Abstract
This study examines the transformative potential of the Belt and Road Initiative (BRI) in enhancing the environmental, social, and governance (ESG) performance of Chinese companies, carrying significant implications for global sustainable development. Using data from Chinese listed companies from 2009 to 2022, we employ a difference-in-differences approach to rigorously assess the impact of the BRI on corporate ESG performance and elucidate the underlying mechanisms. Our findings indicate that the BRI significantly enhances corporate ESG performance, with these results robustly validated through robustness checks. The analysis identifies two primary channels through which the BRI affects ESG performance: internal mechanisms, such as fostering technological innovation and enhancing environmental disclosure, and external mechanisms, including increased analyst attention and the expansion of digital infrastructure. Additionally, we observe significant variation in the BRI’s impact across different industries and firm characteristics. Specifically, non-state-owned enterprises, high-growth companies, large corporations, and those located in economically advanced regions exhibit the most pronounced positive effects. This research not only deepens the understanding of the BRI’s influence on sustainable business practices but also provides valuable insights for policymakers and corporate leaders. By leveraging the BRI, companies can significantly enhance their ESG performance, thus contributing to broader sustainability objectives. Our findings underscore the importance of strategic engagement with global initiatives like the BRI in achieving improvements in corporate sustainability such as enhanced environmental performance and social responsibility.
1. Introduction
The Belt and Road Initiative (BRI), initiated by China in 2013, represents one of the most extensive global development projects of the 21st century, aimed at promoting sustainable connectivity and collaboration among more than 150 nations throughout Asia, Europe, Africa, and beyond. By 2024, the BRI is expected to significantly impact various sectors, including infrastructure, trade, and cultural interaction, facilitating sustainable transformation on an unparalleled scale [1,2]. The BRI has significantly propelled economic growth and reshaped the tenets of sustainable international collaboration. It has evolved into an essential instrument for policy alignment, infrastructural integration, and the advancement of environmentally sustainable trade among participating states. The program has been pivotal in enhancing sustainable financial connections and promoting cultural interchange, reinforcing its position as a fundamental element of global economic integration and sustainable development [3,4].
The BRI is widely recognized for its economic benefits; however, its environmental implications, particularly regarding carbon emissions and pollution from infrastructure projects, are increasingly under scrutiny. These environmental challenges, although less frequently highlighted, pose significant risks to global sustainability [5,6]. In response, China has implemented proactive measures to mitigate these impacts and align the BRI with broader sustainable development goals [7,8]. Notable efforts include establishing the Belt and Road Green Development International Alliance, led by China’s Ministry of Ecology and Environment in collaboration with partner nations. Furthermore, China’s formal partnership with the United Nations Environment Programme to build a green Belt and Road underscores its commitment to embedding sustainability into the core of this global initiative. These actions highlight the BRI’s potential not only as an economic catalyst but also as a significant force in advancing global environmental stewardship. This study aims to address the following core questions: How does the BRI, as one of the most influential global development initiatives of the 21st century, influence the environmental, social, and governance (ESG) performance of Chinese enterprises through both internal and external mechanisms? Specifically, what impact does the BRI, as a strategic framework that integrates economic drivers with sustainable development objectives, have on corporate ESG performance? Furthermore, at the mechanistic level, how does the BRI establish synergistic pathways for ESG enhancement through internal factors such as incentives for technological innovation and improvements in environmental information disclosure as well as external factors like heightened analyst attention and the enhancement of digital infrastructure? Additionally, is there heterogeneity in the ESG performance responses to BRI policies among enterprises with varying ownership structures, growth stages, sizes, and regional economic gradients?
ESG (environmental, social, and governance) principles have emerged as a foundational framework for advancing sustainable corporate development, providing enterprises with a comprehensive and effective strategy. Strong ESG performance not only enhances corporate transparency but also lowers financing costs, improves operational efficiency, fosters innovation, and elevates corporate value, thereby playing a critical role in investor decision-making processes [9,10,11,12,13]. Extensive research has explored the micro-level determinants of ESG performance, considering both internal and external dimensions. Internal factors include digital transformation, ownership structure, and executive characteristics [14,15,16], while external factors encompass government subsidies, institutional investor attention, and media scrutiny [17,18,19]. Moreover, national policies play a significant role in shaping ESG performance, with the BRI serving as a pivotal policy initiative for enhancing corporate ESG performance.
Despite the growing body of literature on ESG performance and the Belt and Road Initiative (BRI), significant gaps remain. While various studies have investigated the internal and external factors influencing ESG performance [9,14,17], the precise mechanisms by which the BRI influences these factors are not yet fully understood. Furthermore, the heterogeneity in the BRI’s impact across different regions, industries, and enterprise types has not been thoroughly examined, leading to an incomplete understanding of how contextual variables shape ESG effectiveness within the BRI framework. This study aims to address these gaps by providing a comprehensive analysis of the BRI’s influence on ESG performance at the enterprise level, thereby offering new insights into the underlying mechanisms and contextual factors that drive these outcomes.
This study contributes to the existing literature in two significant ways. First, it shifts the focus from a predominantly macroeconomic analysis of the BRI to a micro-level examination, exploring its role in sustainable development through corporate ESG performance. This approach offers new theoretical insights and perspectives on how the BRI contributes to sustainability. Second, this paper develops a comprehensive framework to assess the impact of the BRI on corporate ESG performance, identifying the internal and external mechanisms through which the BRI influences these outcomes. This contribution enhances the empirical literature on the intersection of macroeconomic policy and corporate ESG performance while broadening the scope of ESG research.
This paper is organized as follows: Following the introduction in Section 1, Section 2 conducts a literature review encompassing both the determinants of corporate ESG performance and scholarly investigations pertaining to the BRI. Section 3 presents a theoretical framework and formulates research hypotheses regarding the impact of the Belt and Road Initiative on corporate ESG performance. Section 4 outlines the research methods and data sources used in the analysis. Section 5 details the research design, presents the empirical findings, and discusses their implications. Section 6 addresses potential endogeneity issues and conducts robustness checks to ensure the validity of the results. Section 7 explores moderating factors and assesses the heterogeneity of the Belt and Road Initiative’s effects on corporate ESG performance. Finally, Section 8 concludes by summarizing the key findings, highlighting the study’s contributions and limitations, and offering suggestions for future research.
2. Literature Review
In recent years, corporate ESG performance has attracted considerable attention as a crucial indicator of sustainable development and social responsibility. Scholars argue that ESG performance is influenced by a variety of factors, including the external policy environment, digital transformation, internal governance and incentive mechanisms, as well as external oversight [20,21]. For example, studies employing the reform of environmental fees into taxes as a quasi-natural experiment have demonstrated that heavily polluting firms significantly improve their ESG performance through corporate upgrading and green investments following the policy change [22]. Similarly, carbon emissions trading schemes and low-carbon city pilot policies have been found to enhance companies’ environmental and governance performance by increasing executives’ sustainability awareness and boosting environmental investments, respectively [23,24]. Regarding digital transformation, research suggests that a moderate level of digital investment can foster green innovation and enhance transparency, thereby improving ESG performance; however, both excessive and insufficient investments may undermine these benefits [14]. Moreover, the adoption of emerging technologies, coupled with increased media attention, has further improved the quality of ESG disclosures by optimizing internal controls [19,25]. In terms of internal governance, performance-based equity incentives have been shown to significantly drive improvements in corporate ESG performance, particularly when executives serve longer terms and face stricter exercise conditions. In contrast, cross-shareholdings may weaken ESG efforts by increasing market monopolization [15,26].
Furthermore, as a national strategy, the Belt and Road Initiative (BRI) has evolved into a transformative strategy with multifaceted research implications across global trade, infrastructure development, investment, environmental governance, and enterprise performance. Empirical studies indicate that BRI-related transportation infrastructure projects have notably decreased maritime shipping durations and reduced global trade costs, particularly benefiting participating developing economies [27]. This expansion of infrastructure has further stimulated economic growth and enhanced resource allocation efficiency in recipient countries [28]. From an investment standpoint, firms’ outward foreign direct investment (OFDI) strategies within the BRI framework exhibit institutional duality: state-owned enterprises (SOEs) possess comparative advantages in cross-border mergers and acquisitions through policy-backed financing mechanisms, whereas non-SOEs excel in greenfield investments due to market-driven operational flexibility [29]. In environmental domains, the development of renewable energy in host countries under BRI projects is contingent upon technological transfer capacities and financial support structures [30]. Cross-country analyses further confirm that renewable energy adoption contributes to environmental quality improvements, though such effects exhibit regional heterogeneity [31]. Aligning BRI implementation with Sustainable Development Goal (SDG) priorities reveals both synergistic potential and operational challenges, particularly concerning environmental governance frameworks [32]. Supply chain scholars have identified critical vulnerabilities in BRI logistics networks, emphasizing institutional barriers to cross-border coordination [33]. While the theoretical adoption of technological innovation holds promise for optimizing BRI supply chains, practical implementation faces systemic constraints [34]. At the enterprise level, empirical studies validate that BRI participation enhances small and medium-sized enterprise (SME) performance through dual mechanisms: direct market access expansion and indirect network-building effects [35]. These multidimensional impacts underscore the initiative’s complex interplay of economic integration and institutional adaptation, warranting continued interdisciplinary investigation.
The literature reveals multiple pathways through which various factors influence corporate ESG performance and indicates that the BRI plays a significant role in optimizing corporate governance, promoting green transformation, and enhancing international competitiveness [10,36].
3. The Institutional Background and Research Hypothesis
3.1. The Implementation Background of the Belt and Road Initiative
The Belt and Road Initiative (BRI), proposed by China in 2013, emerged against the backdrop of the 2008 global financial crisis, which led to sluggish economic recovery and challenges to the multilateral trade system centered around the World Trade Organization. Encompassing over 60% of the world’s population and 1/3 of global GDP, the BRI aims to address development bottlenecks in participating countries, such as inadequate infrastructure and prominent trade barriers, through a framework emphasizing policy coordination and infrastructure connectivity [37]. This strategic pivot facilitates China’s transition from merchandise export dominance to institutional norm diffusion, leveraging the international financial architecture through novel mechanisms like the Asian Infrastructure Investment Bank (AIIB) and the Silk Road Fund, thereby advancing dual objectives of Renminbi internationalization and global supply chain integration [38].
In recent years, the BRI has exhibited a pronounced shift toward institutionalizing environmental, social, and governance (ESG) standards. The AIIB has pioneered the establishment of green credit standards, channeling funds into projects that address areas such as renewable energy and clean transportation [39]. By the end of Q3 2024, the Climate Bonds Initiative recorded a cumulative volume of USD 5.4 trillion in green, social, sustainability, and sustainability-linked debt, reflecting a substantial commitment to sustainable financing [40]. In the realm of social responsibility, the implementation of localized employment systems and community impact assessment mechanisms has led to a significant increase in ESG reporting among companies, with disclosure rates exceeding 70% in the Asia-Pacific region [41]. On the governance front, the integration of blockchain technology has enhanced the traceability and reliability of environmental data, aligning project assessments with the United Nations Sustainable Development Goals (SDGs) framework to establish quantifiable evaluation tools [42]. This evolution signifies a strategic transition of the BRI from scale expansion to rule-based governance.
The reinforcement of ESG frameworks within the BRI is driven by multiple factors. Internally, the ecological fragility of participating countries, coupled with traditional infrastructure models exhibiting carbon emission intensities significantly higher than those of developed nations, necessitates a shift toward sustainable development practices. Externally, the global surge in ESG asset management compels project stakeholders to meet the ESG criteria set by financial institutions in Europe and the United States. Additionally, escalating geopolitical risks and a rise in environmental litigation underscore the instrumental role of ESG management in risk mitigation. This strategic realignment reflects China’s innovative approach to global governance and highlights the institutional interplay between developmental rights and environmental rights in the new phase of globalization.
3.2. The Belt and Road Initiative’s Influence on Corporate ESG Performance
With a vision to foster a community with a shared future for humanity, the Belt and Road Initiative (BRI) has substantially deepened cooperation between China and participating countries in critical areas such as environmental protection, job creation, and poverty alleviation [43]. This cooperation is fundamentally aligned with the core principles of corporate ESG (environmental, social, and governance) performance. Environmentally, the Chinese government actively encourages enterprises to comply with the environmental regulations and standards of host countries, ensuring that they meet their environmental responsibilities. Non-compliance results in these enterprises incurring the associated investment risks, thereby reinforcing external oversight of environmental accountability. Additionally, in line with the marginal industry transfer theory [44], BRI countries endowed with abundant natural resources and lower production costs offer opportunities for tiered investment, which in turn fosters green innovation and sustainable development, thereby accelerating corporate green transformation. Finally, companies can leverage the collaborative advantages of the BRI platform to establish R&D centers in technologically advanced regions or engage in transnational partnerships to adopt advanced green technologies, thereby optimizing resource allocation and driving green innovation [45].
Socially, the Chinese government encourages BRI-participating companies to prioritize poverty alleviation, education, healthcare, and community development during project implementation, thereby addressing local social needs. Furthermore, BRI-participating companies contribute to local employment by creating job opportunities, providing vocational training, and enhancing social welfare, thereby assuming greater social responsibilities [46].
In terms of corporate governance, BRI-participating companies face diverse and dynamic risks [47], which necessitate improvements in internal governance, stricter compliance management, and robust risk control measures, ultimately resulting in stronger corporate governance. The international scope of the BRI further compels companies to improve their governance structures and transparency, while scrutiny from host country governments and the media underscores the need for continuous improvements in internal governance.
Based on these considerations, the following hypothesis is proposed:
H1:
The Belt and Road Initiative positively impacts the enhancement of corporate ESG performance.
3.3. Internal Mechanisms
Corporate technological innovation encompasses the development and adoption of more efficient production technologies and processes aimed at reducing raw material dependency and enhancing material efficiency. However, technological innovation is inherently high-risk and long-term, which can pose challenges to companies’ ability to enhance their ESG performance [48]. The BRI offers a strategic avenue to mitigate these challenges. First, Chinese companies involved in the BRI gain advantages in accessing credit resources, reducing external financing costs, and benefiting from tax incentives, which collectively promote foreign investment and provide substantial financial support for technological innovation [49,50,51]. Second, the BRI fosters international cooperation and knowledge exchange, expanding R&D investment, facilitating the mobility of technical talent, and reducing the barriers and risks associated with technological innovation, thereby increasing the likelihood of successful innovation [52,53]. Technological innovation plays a critical role in enhancing corporate ESG performance. The impact of technological innovation on ESG performance can be conceptualized as a process of strategic resource reconfiguration and value co-creation. According to the Resource-Based View (RBV), technological innovation outcomes such as green patents and low-carbon processes are regarded as heterogeneous intangible assets that enhance a company’s environmental governance capabilities through capitalization pathways [54]. Their rarity and inimitability can mitigate ESG-related contingent liability risks such as provisions for environmental fines, thereby enhancing the company’s ESG performance. Dynamic Capabilities Theory further elucidates that a company’s adaptive capabilities in clean technologies, such as adjustments in R&D expenditure capitalization decisions, can optimize resource allocation efficiency [55]. Firstly, the organizational learning effects driven by technological iteration such as the deployment of AI environmental monitoring systems can reduce ESG compliance costs, evidenced by a decrease in the proportion of environmental management expenses within SG&A costs. Secondly, the development of technological standards such as innovations in carbon footprint accounting methods can reshape industry ESG disclosure rules, alleviate information asymmetry, and consequently reduce the cost of equity. Collectively, these factors contribute to achieving superior ESG performance. Based on these insights, we propose the following hypothesis:
H2a:
The BRI enhances corporate ESG performance by promoting technological innovation.
The Belt and Road Ecological and Environmental Cooperation Plan advocates for enhanced corporate environmental information disclosure, urging companies to regularly publish annual environmental reports detailing their compliance with environmental laws, regulations, and performance measures. On the one hand, companies participating in BRI projects are subject to stringent governmental oversight on environmental information disclosure, which motivates them to actively disclose environmental data, thereby enhancing transparency and the quality of disclosures [56]. On the other hand, the BRI’s emphasis on sustainable development fosters close environmental collaboration between BRI countries and international organizations. As key stakeholders, companies are encouraged to share information, thereby attracting green investments and further advancing environmental information disclosure within the BRI framework [57]. Environmental information disclosure serves as a crucial communication bridge between companies and investors. According to signaling theory, transparent environmental disclosures effectively convey a company’s environmental commitments and performance, enhancing market trust and recognition of its green practices, thereby elevating corporate ESG performance [58]. Companies with high transparency in environmental disclosures are more likely to attract investments in innovation and green technologies, as investors tend to favor companies that provide clear and reliable information, thereby securing greater green capital and achieving higher returns, which further enhances ESG performance [59]. Thus, we propose the following hypothesis:
H2b:
The BRI enhances corporate ESG performance by promoting environmental information disclosure.
3.4. External Mechanisms
Analysts’ evaluations and forecasts serve as indispensable decision-making tools for investors, profoundly influencing the timeliness and objectivity of corporate information disclosure. Within the BRI framework, analyst attention plays a crucial role in shaping corporate ESG performance. First, analyst attention generates an information transmission effect that reduces information asymmetry between companies and investors [9,60]. Cross-border investments and collaborations within the BRI framework further enhance corporate information transparency. Heightened analyst attention ensures that investors receive comprehensive insights, thereby preventing the underestimation of ESG activities and enhancing ESG performance. Second, analyst attention elicits a confidence effect, whereby increased scrutiny enhances information transparency, boosts investor confidence, and attracts more investments, which in turn reduces financing risks and costs, ultimately leading to improved ESG performance [36]. Lastly, analyst attention exerts a supervisory effect that aligns with Chinese government expectations for BRI-participating companies to fulfill their environmental and social responsibilities. Heightened analyst attention strengthens market oversight and accountability, thereby exerting external pressure on management to reinforce corporate governance, standardize practices, and devise strategies that foster sustainable development, ultimately enhancing ESG performance [19,60]. Thus, we propose the following hypothesis:
H3a:
Increased analyst attention amplifies the positive impact of the Belt and Road Initiative on corporate ESG performance.
Infrastructure connectivity, a cornerstone of the BRI, facilitates trade and investment among participating countries, laying a critical foundation for seamless commerce [61,62]. Internet infrastructure, powered by digital technology, enhances the intelligence, service orientation, and coordination of broader infrastructure networks, strengthening product and technology cooperation among BRI countries and significantly boosting corporate ESG performance. First, the expansion of internet infrastructure accelerates information flow. Companies can leverage mobile internet technologies to enhance information disclosure, offering real-time transparent information exchange platforms for investors, consumers, and regulators. This reduces information asymmetry, allowing stakeholders to accurately assess corporate ESG performance, thus enhancing trust and reinforcing the BRI’s positive impact on ESG performance. Second, internet technology provides advanced decision support systems, improving operational efficiency and reducing costs. Digital financial services and electronic trading platforms streamline transaction processes, reducing intermediary involvement and lowering transaction costs [63]. This allows companies to allocate more resources to green technologies and environmental initiatives, thereby enhancing ESG performance. Based on the above analysis, we propose the following hypothesis:
H3b:
The expansion of internet infrastructure amplifies the positive impact of the Belt and Road Initiative on corporate ESG performance.
Figure 1 presents the research framework, which demonstrates how the Belt and Road Initiative (BRI) affects corporate ESG performance through both internal and external mechanisms. The central hypothesis (H1) posits that the BRI exerts a positive influence on corporate ESG performance. This influence is mediated by internal mechanisms—namely, technological innovation (H2a) and enhanced environmental information disclosure (H2b)—as well as external mechanisms, including increased analyst attention (H3a) and the expansion of internet infrastructure (H3b). Collectively, these mechanisms contribute to enhancing corporate ESG performance within the BRI context.
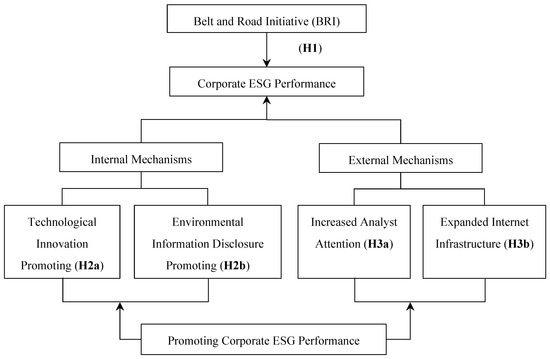
Figure 1.
The impact mechanism of the Belt and Road Initiative on corporate ESG performance.
4. Research Design and Data Sources
4.1. Research Design
To examine the impact of the Belt and Road Initiative (BRI) on corporate ESG performance, we employ the following difference-in-differences (DID) model [64]:
In Equation (1), i represents the firm and t represents the year. denotes the ESG performance of firm i in year t. The key explanatory variable, Treati × Postt, is a dummy variable for the BRI, indicating whether firm i was exposed to the BRI in year t. represents a vector of control variables that influence corporate ESG performance. Additionally, firm fixed effects are included to control for unobservable heterogeneity across companies, while year fixed effects account for unobservable factors that vary over time but remain constant across companies. denotes the regression error term. The primary focus is on the estimated coefficient , which captures the economic impact of the BRI on the ESG performance of Chinese companies. A significantly positive would indicate that the BRI has a substantial positive effect on corporate ESG performance.
4.2. Selection of Indicators and Data Sources
Corporate ESG Performance (ESG): This study employs the Huazheng ESG rating system to evaluate the ESG performance of Chinese listed companies. The Huazheng ESG rating system, inspired by major international ESG frameworks and tailored to the characteristics of the domestic market, establishes a three-tiered indicator system to assess companies’ performance in environmental, social, and governance dimensions. The Huazheng ESG ratings categorize the ESG performance of all listed companies into nine grades (AAA, AA, A, BBB, BB, B, CCC, CC, C). We rank the Huazheng ESG ratings from highest to lowest, assigning values correspondingly, with AAA valued at 9, AA at 8, and so forth [65]. Higher values correspond to better ESG performance. In subsequent robustness tests, alternative ESG measurement methods are considered to re-evaluate corporate ESG performance.
The Belt and Road Initiative (Treat × Post): The BRI was officially incorporated into the Chinese government work report in 2014, marking the commencement of its implementation. Therefore, the variable Post is assigned a value of 1 for the years 2014 and onward, and 0 otherwise. According to the Directory of Chinese Overseas Investment Enterprises (Institutions), the variable Treat is assigned a value of 1 if the investment destination of a firm is a BRI country, and 0 otherwise.
Control Variables (X): We incorporate a series of control variables that may affect corporate ESG performance [22,26]. Firm size (Size) reflects that larger companies possess significant advantages in green competition, corporate governance, and social responsibility [66]. Firm age (Age) represents the length of time a firm has been established; longer-established companies tend to have accumulated more resources, leading to better ESG performance. Financial leverage (Lev) measures the firm’s debt capacity, where higher values suggest that the firm is better positioned to attract creditor funding for sustainable development. Operating net cash flow (Cflow) is closely tied to operational risk; interruptions in cash flow can hinder a firm’s ability to maintain daily operations and support ESG initiatives. The Intangible Asset Ratio (Itang) reflects the value of a firm’s technology and goodwill; higher ratios suggest the firm’s enhanced ability to pursue sustainable development. Return on assets (ROA) and total asset growth rate (TAGR) are indicators of a firm’s growth potential, which is positively correlated with ESG performance [67]. Shareholding concentration (Shrcr) indicates the distribution and stability of ownership, which can influence the firm’s future development strategies and ESG performance. Table 1 provides the specific definitions of the variables used in the regression analysis.

Table 1.
Variable definitions.
This study focuses on Shanghai and Shenzhen A-share listed companies over the period from 2009 to 2022. The starting year, 2009, was chosen based on the earliest availability of Huazheng ESG indicators. Corporate ESG data and firm-level control variables are primarily sourced from the CSMAR database, while BRI-related variables are obtained from the Directory of Chinese Overseas Investment Enterprises (Institutions). To ensure the robustness and validity of the regression results in the subsequent analysis, the original data were processed as follows: First, samples of ST, *ST, and PT companies were excluded due to their financial anomalies and delisting risks. Second, financial companies were excluded due to the unique nature of the financial industry. Third, companies with missing key economic indicators, such as net operating cash flow and total asset growth rate, were excluded. Fourth, to mitigate the impact of outliers, all continuous variables were winsorized at the 1% and 99% percentiles. After these adjustments, the study includes 20,139 observations from 1986 listed companies across 78 industries during the period from 2009 to 2022.
Table 2 presents the descriptive statistics of the key variables. The variable ESG ranges from a minimum of 1 to a maximum of 6, with a standard deviation of 1.0640. This indicates substantial variability in ESG performance across companies and considerable volatility in the sample data. The average ESG score is 4.0940, suggesting that the ESG performance of Chinese listed companies is generally moderate, with all sample companies’ ESG ratings below A. This implies that China is in the early stages of ESG development, with significant room for improvement in its implementation. These findings align with the characteristics of China’s economic development and industrial structure. Historically, China prioritized economic growth over environmental performance and still maintains a large number of low-value-added, labor-intensive, and pollution-intensive enterprises. As global focus on climate change and sustainable development intensifies, China is gradually transitioning to a green economy and a path of high-quality development, with companies increasingly prioritizing ESG performance. The key explanatory variable Treat × Post has a mean value of 0.1258, indicating that 12.58% of the sample companies were involved in the BRI. Descriptive statistics for control variables, including age, size, and leverage, mostly fall within reasonable ranges, supporting the rationality and validity of the selected control variables.
Table 2.
Descriptive statistics.
5. Empirical Findings
5.1. Baseline Regression Analysis
Table 3 presents the baseline regression results assessing the impact of the BRI on corporate ESG performance. Column (1) reports the regression results without control variables, while columns (2) and (3) introduce control variables incrementally. The results indicate that, regardless of whether control variables are included, the regression coefficient of Treat × Post remains positive and significant at the 1% level, suggesting that the BRI contributes to enhanced corporate ESG performance. In column (3), the estimated coefficient of Treat × Post is 0.2013, indicating that, compared with the control group, the BRI can increase the ESG score of treated companies by 20.13%. To further strengthen the interpretation, we compared this figure with similar empirical studies globally. For instance, prior researchers found that green finance pilot policies in China led to an improvement in ESG scores [68], and mandatory ESG disclosure policies result in notable increases in ESG performance across multinational firms [69]. Therefore, the BRI is a critical initiative for China in exploring inclusive global development, contributing not only to economic benefits but also to deep cooperation in areas such as environmental protection and management practices, ultimately enhancing corporate ESG performance. These baseline regression results support Hypothesis H1.
Table 3.
Baseline empirical results.
5.2. Robustness Checks
5.2.1. Parallel Trend Assumption Test
The baseline regression in this study employs a difference-in-differences (DID) model for causal inference. However, the DID model requires the satisfaction of the parallel trend assumption, which posits that there should be no significant differences between the treatment and control groups prior to the BRI implementation, while significant differences should emerge post-implementation. This study employs the event study methodology to test the validity of the parallel trend assumption. The model is specified as follows:
Here, k < 0 indicates the k-th year before the BRI implementation, and k > 0 indicates the k-th year after the initiative’s implementation. represents a series of year dummy variables. The year immediately preceding the initiative’s implementation is used as the base year. In Equation (2), the key coefficient of interest is . If is insignificant before the BRI implementation and becomes significant afterward, it indicates that the parallel trend assumption holds.
The estimation results based on Equation (2) are presented in Figure 2. On the left side of the dashed line, the confidence interval for the estimated coefficient does not significantly differ from zero, indicating no significant difference in ESG performance between the treatment and control groups before the BRI implementation. Furthermore, there is no common growth trend observed prior to the initiative’s implementation. In the current period and subsequent years of BRI implementation (right side of the dashed line), the confidence intervals for the estimated coefficients significantly differ from zero, indicating that the parallel trend assumption is valid and that the baseline regression results are robust. Additionally, the estimated coefficients are significantly positive in the first period and subsequent periods after policy implementation, exhibiting an increasing trend, which suggests that the effects of the BRI are long-term.
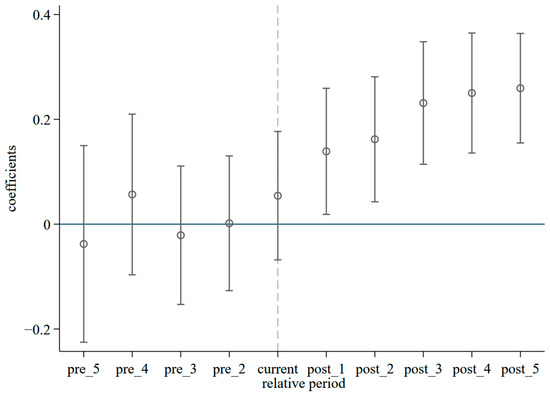
Figure 2.
Parallel Trend Test. Note: Circles represent the estimated coefficients before and after policy implementation, and line segments represent the corresponding 90% confidence intervals.
5.2.2. Placebo Test
The observed improvement in corporate ESG performance may result from random factors rather than the BRI. To eliminate the potential influence of random factors, this study conducts a placebo test within a counterfactual framework. First, the study randomly assigns the implementation time of the BRI for each pilot firm. Second, 266 pilot companies are randomly selected as the treatment group, while the remaining companies constitute the control group. Utilizing the baseline regression model, Monte Carlo simulations are performed and repeated 500 times to obtain the estimated coefficients and p-values. Figure 3 presents the placebo test results for the impact of the BRI on corporate ESG performance. The results indicate that the estimated coefficients of the dummy policy variable are primarily concentrated around zero, and most of these coefficients are not significant. In contrast, the true value (0.2013) is significantly different from the estimated results in the placebo test. These findings align with the empirical results from the baseline regression, providing evidence from a counterfactual perspective that the BRI enhances corporate ESG performance. Although there is minor overlap at the boundary, the majority of the placebo estimates remain well below the actual coefficient. The kernel density curve peaks near zero, andthe robustness of this result is supported by 500 iterations of Monte Carlo simulations. This reinforces the validity of the treatment effect and demonstrates that it is unlikely to result from stochastic variation.

Figure 3.
Placebo Test. Note: The solid line represents the kernel density curve, the dots represent the p-values, and the dashed line represents the true regression coefficients from baseline.
5.2.3. Controlling for Other Policies and External Shocks
During the period of BRI implementation, China also enacted several significant policies that could have potentially impacted companies’ ESG performance, thereby presenting competing hypotheses to the baseline regression results of this study. Therefore, this study further controls for four major policies that may have disrupted the sample period. From an environmental policy perspective, the carbon emission trading pilot policy, as one of the globally significant emission-reduction tools, advances the achievement of dual carbon goals through market-driven environmental regulations, thereby facilitating corporate green transformation [23]. Simultaneously, in the process of implementing the new development concept of green and low-carbon growth, policies such as the low-carbon city pilot policy and environmental tax reform policy encourage enterprises to integrate environmental, social, and governance factors into their investment decisions [24], thereby enhancing corporate ESG performance. From an international policy perspective, cross-border e-commerce comprehensive pilot zones, as an emerging form of foreign trade, provide policy support for enterprises pursuing sustainable development paths. This policy can enhance enterprises’ environmental performance by promoting digital transformation and intelligent manufacturing [70]. Therefore, this study constructs dummy variables for the Carbon Emission Trading Pilot Policy (CCT), Environmental Protection Tax Reform Policy (EPT), Low-Carbon City Pilot Policy (LCC), and Cross-border E-commerce Comprehensive Pilot Zone (CEC) and includes them in Equation (1) for regression analysis. Columns (1)–(4) of Table 4 report the regression results after controlling for other policy interferences, where the estimated coefficients for Treat × Post are all statistically significant at the 1% level, providing supportive evidence for the baseline regression results.
Table 4.
The robustness test results of excluding other policies and external shocks.
Furthermore, this study excludes exogenous shocks that may have affected the baseline regression results. The global financial crisis of 2008 caused turmoil in global financial markets and led to a downturn in the real economy, with Chinese financial institutions and listed companies also significantly affected. To mitigate the potential effects of the global financial crisis (which occurred from 2008 to 2010), we retain samples from 2011 to 2022 for re-estimation. Considering the severe impact of the COVID-19 pandemic on the national economy and daily life by the end of 2019, this study also excludes sample years from 2020 onward. Columns (5) and (6) of Table 4, respectively, present the estimation results excluding the exogenous shocks of the COVID-19 pandemic and the global financial crisis. The results show that the estimated coefficients for Treat × Post remain significantly positive, providing further supportive evidence for the baseline regression results.
5.2.4. Additional Robustness Tests
Propensity Score Matching (PSM): To address potential endogeneity arising from sample self-selection, this study employed propensity score matching (PSM) before conducting the baseline regressions [71]. Propensity score matching (PSM) is a quasi-experimental technique widely used to mitigate selection bias by constructing a comparable control group based on observable characteristics. PSM is employed to address endogeneity concerns arising from sample self-selection. However, PSM has limitations. Specifically, it can account for observable covariates only and may fail to fully address endogeneity caused by unobserved factors. Moreover, the matching process may lead to a loss of sample observations, which could reduce estimation efficiency and statistical power. To mitigate these issues, we conducted difference-in-differences (DID) regression after matching and confirmed that the results remained robust and consistent with the baseline findings. First, covariates for the propensity score matching were defined based on the firm-level control variables used in the baseline model. Second, 1:1 nearest neighbor matching with replacement was conducted based on the control variables from the baseline model. After nearest neighbor matching, the average treatment effect on the treated (ATT) was found to be 7.38, significant at the 1% level. This indicates a causal relationship between the BRI and corporate ESG performance. Subsequently, the study re-conducted difference-in-differences regressions after propensity score matching. Column (1) of Table 5 presents the regression results after propensity score matching, showing that the estimated coefficient of Treat × Post is significant at the 1% level, with a value of 0.1982. The magnitude and significance of the coefficient closely align with the baseline regression results, demonstrating the robustness of the findings.
Table 5.
Additional robustness checks results.
Entropy Balancing: Given that entropy balancing does not result in the loss of observations while eliminating systematic differences between treatment and control groups [72], this method was employed to enhance comparability between the groups. Entropy balancing is a reweighting method that ensures an exact balance between the treatment and control groups on covariate distributions by aligning moments such as mean and variance. Unlike PSM, it retains all sample observations and improves estimation efficiency, especially in settings with high-dimensional covariates. However, entropy balancing is sensitive to the specification of balance constraints and may face overfitting risks if applied to small samples. We carefully selected key covariates to include in the balancing procedure and verified that the weighted covariate distributions closely matched those of the treatment group. When applying entropy balancing in regression, covariates are included in the model, thereby enhancing estimation efficiency without altering the results. Therefore, this study employed entropy balancing to address potential endogeneity concerns. Column (2) of Table 5 presents the regression results of entropy balancing. The results show that the estimated coefficient of Treat × Post is 0.2288, significant at the 1% level, indicating that the BRI significantly enhances corporate ESG performance. This finding further reinforces the robustness of the baseline regression results.
Adding Fixed Effects: In the baseline regression, this study controlled for firm-specific and year-specific fixed effects. Recognizing that comprehensive influences at the city and temporal levels could bias the results, this study further controlled for interactions between city fixed effects and year fixed effects. Column (3) of Table 5 presents the regression results after adding high-dimensional fixed effects. After accounting for random shocks at the city and temporal levels, the estimated coefficient of Treat × Post is 0.1688, significant at the 1% level. The baseline regression results remain robust and reliable.
Replacement of ESG Measurements: To test robustness, the study replaced the dependent variable. Keeping the sample of companies unchanged, Bloomberg’s ESG ratings replaced Huazheng’s ESG ratings. The handling of Bloomberg’s ESG ratings followed the same approach as Huazheng’s ESG ratings. Column (4) of Table 5 presents the regression results after replacing ESG measurements. The results show that the estimated coefficient of Treat × Post is 0.1979, significant at the 1% level. The baseline regression results exhibit robustness.
6. Mechanism Analysis
To investigate how the Belt and Road Initiative (BRI) has enhanced corporate ESG performance, this section explores the underlying mechanisms from both internal and external perspectives.
6.1. Internal Mechanisms
This section employs a mediation effect model to empirically examine the internal mechanisms through which the BRI influences corporate ESG performance, focusing on technological innovation and environmental disclosure. Corporate technological innovation (TI) is measured by the logarithm of patent output. Patent application data are sourced from the China National Intellectual Property Administration (SIPO) and the China Research Data Service Platform (CNRDS) [73,74]. Corporate environmental disclosure (EA) is measured using environmental information disclosure data from the CNRDS and corporate social responsibility reports [20,75].
Columns (1) and (2) of Table 6 present the mediation mechanism test results based on technological innovation. The estimated coefficient of Treat × Post is significantly positive at the 5% level, indicating that the BRI significantly enhances corporate technological innovation. Moreover, the estimated coefficients of Treat × Post exhibit a downward trend compared with the baseline estimation results, suggesting that technological innovation indeed plays a partial mediating role. In summary, the BRI can enhance corporate ESG performance by fostering technological innovation. The empirical results support Hypothesis H2a.
Table 6.
The empirical results of internal mechanism.
Columns (3) and (4) of Table 6 present the mediation mechanism test results based on environmental disclosure. The estimated coefficients of Treat × Post are significantly positive at the 1% level, indicating that the BRI significantly enhances corporate environmental disclosure. Furthermore, the estimated coefficients of Treat × Post exhibit a downward trend compared with the baseline estimation results, suggesting that environmental disclosure indeed plays a partial mediating role. In summary, the BRI can enhance corporate ESG performance by improving environmental disclosure. The empirical results support Hypothesis H2b.
6.2. External Mechanisms
This section employs a moderation effect model to empirically examine the external mechanisms through which the BRI influences corporate ESG performance, focusing on analyst attention and internet infrastructure. Analyst attention (AF) is measured by the number of securities analysts covering listed companies, as provided by the CSMAR securities analyst forecast database [21,76]. The level of internet infrastructure development (INI) is measured by the number of internet users per hundred people. Internet penetration data are sourced from the China City Statistical Yearbook.
Columns (1) and (2) of Table 7 present the moderation mechanism test results based on analyst attention. The analysis primarily focuses on the coefficients of the interaction terms. The results in Column (1) show that the coefficient of AF × Treat × Post is 0.1517, which is significantly positive at the 1% level. Column (2) adds control variables to the model, and although the coefficient of AF × Treat × Post decreases to 0.1236, it remains significantly positive at the 1% level, further confirming the robustness of the analysis results. The decrease in the coefficient value suggests that omitting control variables may lead to an overestimation of the model results. This implies that higher analyst attention amplifies the positive effect of the BRI on corporate ESG performance. The empirical results support Hypothesis H3a.
Table 7.
The empirical results of external mechanism.
Columns (3) and (4) of Table 7 present the moderation mechanism test results based on internet infrastructure. The analysis primarily focuses on the coefficients of the interaction terms. The results in Column (3) show that the coefficient of INI × Treat × Post is 0.0070, which is significantly positive at the 1% level. Column (4) adds control variables to the model, and although the coefficient of INI × Treat × Post decreases to 0.0064, it remains significantly positive at the 1% level, further confirming the robustness of the analysis results. The decrease in the coefficient value suggests that omitting control variables may lead to an overestimation of the model results. This implies that more developed internet infrastructure amplifies the positive effect of the BRI on corporate ESG performance. The empirical results support Hypothesis H3b.
7. Heterogeneity Analysis
This study explores the differentiated effects of the Belt and Road Initiative (BRI) on corporate ESG performance from both regional and corporate perspectives. At the regional level, the study examines the variation in policy effects of the BRI on corporate ESG performance across different economic regions. At the corporate level, the study explores the heterogeneity of the BRI’s impact on corporate ESG performance, focusing on firm size, growth potential, and ownership structure.
7.1. Regional Heterogeneity
Following traditional regional economic division methods, the sample is categorized into three groups—eastern, central, and western regions—based on differing levels of economic development. Columns (1) to (3) of Table 8 present the regression results of the BRI’s impact on corporate ESG performance across these regions. The results reveal that in the eastern and central regions, the regression coefficients for Treat × Post are significantly positive at the 1% and 10% levels, respectively, whereas in the western region, the coefficient is not significant. Specifically, the regression coefficients for Treat × Post are 0.2757 in the eastern region and 0.1387 in the central region. This indicates significant regional differences in the BRI’s impact on corporate ESG performance, with a stronger positive effect observed in more economically developed regions. This can be attributed to the fact that regions with higher levels of economic development face fewer constraints related to financing, industrial structure, and environmental resources, allowing the BRI’s sustainable development potential to be fully realized. These findings align with China’s current developmental context. Economically developed regions benefit from better access to skilled labor, more advanced technological resources, and a higher level of regulatory enforcement. These factors reduce operational constraints and create a conducive environment for sustainable development initiatives. Consequently, companies in such regions are better equipped to integrate the BRI’s objectives into their operations, achieving superior ESG outcomes. This alignment between regional economic conditions and corporate capabilities highlights the synergistic effects.
Table 8.
The empirical results of regional heterogeneity.
7.2. Corporate Heterogeneity
To account for the heterogeneous impacts of national macroeconomic policies on different micro-level enterprises, this study further investigates whether the BRI’s effects on corporate ESG performance vary according to specific corporate characteristics. The analysis focuses on three dimensions: first, the sample enterprises are divided into large and small enterprises based on average firm size; second, enterprises are categorized into high-growth and low-growth groups based on average operating profit growth rates; third, the sample is split into state-owned enterprises (SOEs) and non-state-owned enterprises (non-SOEs) based on ownership structure.
Columns (1) and (2) of Table 9 present the regression results for large and small enterprises. The results show that within the large enterprise group, the estimated coefficient for Treat × Post is 0.2160, significantly positive at the 1% statistical level, whereas the coefficient for small enterprises is not significant. This suggests that the BRI significantly enhances the ESG performance of large enterprises. This is likely because large enterprises possess substantial capital and resources, enabling economies of scale that facilitate better integration into host country markets and improved ESG performance. In contrast, small enterprises may face resource constraints and lack comprehensive institutional mechanisms, impeding their ability to invest in and improve ESG performance.
Table 9.
The empirical results of corporate heterogeneity.
Columns (3) and (4) of Table 9 present the regression results for high-growth and low-growth enterprises. For the high-growth enterprise group, the regression coefficient of Treat × Post is 0.2287, significantly positive at the 1% level, indicating that the BRI positively influences the ESG performance of high-growth enterprises. However, in the low-growth enterprise group, the regression coefficient of Treat × Post is not significant. This discrepancy can be attributed to the fact that high-growth enterprises typically exhibit stronger innovation capabilities and market expansion drives, focusing on rapid growth and market share increases, thus continuously enhancing corporate value. Conversely, low-growth enterprises are more conservative in resource allocation, prioritizing risk avoidance and maintaining operational stability and profit margins, with less emphasis on long-term growth and market expansion. High-growth enterprises participating in BRI investments might outcompete low-growth enterprises due to their first-mover advantages, potentially leading to a “Matthew effect” wherein the strong become stronger and the weak weaker. Therefore, low-growth enterprises may require more policy guidance and incentives to improve their performance.
Columns (5) and (6) of Table 9 highlight the regression results for SOEs and non-SOEs. The results indicate that in the non-SOE group, the estimated coefficient for Treat × Post is 0.2069, significantly positive at the 1% statistical level, whereas the coefficient for the SOE group is not significant. This demonstrates significant differences in the BRI’s impact on corporate ESG performance based on ownership structure, with non-SOEs experiencing a stronger positive effect. This can be attributed to the fact that non-SOEs possess greater decision-making flexibility and market adaptability, allowing them to swiftly capitalize on the new opportunities presented by the BRI and adjust their business strategies to align with the policies and market demands of the host countries. Conversely, SOEs are more constrained by national policies and government strategies, resulting in less flexibility and sensitivity to market changes compared with non-SOEs.
8. Conclusions
The global environment is confronting unprecedented challenges, including climate change, biodiversity loss, and escalating environmental pollution, all of which profoundly affect human life. Guided by the principles of “joint consultation, shared benefits, and collaborative construction”, the Belt and Road Initiative (BRI) has played an active role in addressing these global environmental challenges and promoting sustainable development worldwide. This study investigates the pathways through which the BRI contributes to global sustainable development from a microeconomic perspective. By analyzing data from Chinese publicly listed companies between 2009 and 2022 and employing the difference-in-differences method, this study examines the impact of the BRI on corporate ESG performance and its underlying mechanisms. The baseline regression results demonstrate that the BRI significantly enhances corporate ESG performance, a conclusion that remains robust across various robustness tests. This finding substantiates the role of the BRI in promoting global sustainable development at the microeconomic level. Mechanism analyses conducted from both internal and external perspectives reveal the following: Internally, the BRI improves corporate ESG performance by fostering technological innovation and enhancing environmental disclosure. Externally, increased analyst attention and the development of internet infrastructure significantly amplify the positive impact of the BRI on corporate ESG performance. Heterogeneity analysis indicates that the BRI notably boosts the ESG performance of non-state-owned, high-growth, and large-scale enterprises. Furthermore, the BRI exerts a stronger positive effect on the ESG performance of companies located in regions with higher levels of economic development.
Based on these findings, a multifaceted policy framework is proposed. Firstly, in the realm of green finance, leveraging the Asian Infrastructure Investment Bank’s (AIIB) green credit framework, a dynamic financing cost adjustment mechanism linked to ESG performance should be established. This would involve implementing tiered interest rate incentives for projects focused on ecological restoration and low-carbon transitions alongside a counter-cyclical evaluation system correlating ESG performance with financing amounts. Utilizing sovereign guarantees and multilateral risk-sharing instruments can further reduce financing thresholds for green projects. Secondly, strengthening the coordination of ESG standards is essential. Promoting blockchain-based data recognition agreements among BRI member countries, under the guidance of a “Belt and Road Environmental Information Disclosure Committee”, can facilitate the development of a comprehensive carbon emissions accounting framework. Establishing ESG digital twin systems in key regions and developing modular monitoring solutions tailored to various development stages will enhance oversight. Thirdly, fostering a technological innovation ecosystem is crucial. Establishing a “BRI Technology Transfer Fund” to support the cross-border transfer of patents in clean energy and intelligent infrastructure and setting up ESG technology transfer centers along digital economic corridors to commercialize AI environmental monitoring technologies will drive progress. Implementing lifecycle-based dynamic classification regulations for high-growth enterprises will ensure sustained compliance. Fourthly, implementing enterprise classification governance by providing cross-border guarantee exemptions and green bond fast-track channels for non-state-owned enterprises participating in green supply chains will encourage broader participation. Establishing a “Belt and Road Private ESG Pioneer Enterprises” certification, integrating it into government procurement whitelists, and mandating large enterprises to implement tiered supplier ESG audit systems will promote accountability. Supporting leading enterprises in consolidating clean technology resources through an “ESG M&A Special Fund” will further advance this agenda. Fifthly, promoting regional coordinated development by establishing ESG technology transfer centers in regions like the Yangtze River Delta and the Guangdong–Hong Kong–Macao Greater Bay Area to develop gradient transfer plans is advisable. Piloting the extension of carbon trading rules from areas like Beijing–Tianjin–Hebei to economic corridors such as the Indo-China Peninsula and formulating a “BRI Regional ESG Coordinated Development Index” to quantitatively assess sustainable development capabilities will provide measurable benchmarks. Finally, enhancing social responsibility governance by incorporating indicators like indigenous employment rates into project bidding evaluations, establishing third-party social impact assessment certification systems to involve NGOs in risk-warning mechanisms, promoting the adoption of Chinese new energy vehicle environmental standards as BRI industry norms, and exploring the creation of cross-regional regulatory sandboxes integrating the EU Taxonomy and China’s green catalog will collectively advance the BRI’s ESG objectives. This integrated framework, through the synergistic application of financial innovation, standard coordination, technology transfer, and classification governance, aims to establish a comprehensive ESG enhancement mechanism throughout the entire project lifecycle.
The research-backed policy framework integrates multi-level ESG governance by aligning the efforts of policymakers, regulators, and corporate leaders into a cohesive strategy. At the policy-making level, governments and international bodies are urged to embed ESG principles into development agendas and financial systems, exemplified by initiatives like AIIB’s green credit framework, that channel capital toward sustainable projects and proposals to extend carbon-trading mechanisms across borders and industries to drive low-carbon development. In parallel, regulators should refine and enforce ESG standards, ensuring robust disclosure and accountability through measures such as Belt and Road Private ESG Pioneer Enterprises certification programs, which recognize and incentivize exemplary ESG performance among firms, while also expanding the scope of carbon markets and tightening compliance to align corporate behavior with national climate targets. At the corporate leadership level, companies are expected to proactively internalize these ESG imperatives by integrating environmental and social governance into core strategy and operations, leveraging policy tools (for instance, participating in carbon trading schemes to offset emissions), and striving to meet the high benchmarks set by regulatory frameworks (such as attaining pioneer ESG certifications), thereby demonstrating alignment with global sustainability goals. Policymakers establish enabling structures and international cooperation channels, regulators translate these into concrete standards and incentives, and corporate leaders implement on-the-ground innovations, collectively advancing ESG objectives.
Furthermore, the ESG governance landscape under the BRI—characterized by enhanced environmental disclosure, green finance innovation, and transnational regulatory coordination—provides both opportunities and compliance pressures for foreign stakeholders. For multinational corporations, the alignment of BRI-related ESG standards with global frameworks such as the EU Taxonomy offers a pathway to leverage ESG compatibility for cross-border operations, access green financial instruments (e.g., fast-track green bonds), and participate in regional carbon-trading mechanisms. For foreign institutional investors, the formalization of ESG performance metrics and digital disclosure systems under the BRI reduces information asymmetry and enhances investment transparency, thereby facilitating more informed capital allocation.
This study has three principal limitations that suggest promising avenues for future research. First, concerning data representativeness, our sample is limited to Chinese A-share listed companies due to the availability and reliability of ESG disclosures. We acknowledge that this excludes some unlisted private firms that may play a critical role in BRI-related infrastructure projects, particularly in the construction and energy sectors. This limitation may bias the findings toward firms with better reporting practices and governance transparency. The BRI also involves a wide array of foreign contractors, joint ventures, and multinational corporations operating across diverse institutional environments. Future research could investigate how participation in BRI projects affects ESG performance among non-Chinese firms, particularly in host countries where regulatory frameworks, stakeholder expectations, and ESG reporting standards differ significantly. Such comparative analyses would enrich our understanding of the global ESG implications of the BRI and help assess whether the initiative fosters convergence or divergence in sustainability practices across jurisdictions. Second, the ESG-centric framework may omit additional sustainability dimensions such as green supply chains and social initiatives. Future research should incorporate multidimensional metrics aligned with the UN Sustainable Development Goals to capture a broader spectrum of corporate sustainability efforts. Third, host-country institutional variances—including sector-specific regulations, cultural differences, and enforcement capacities—remain insufficiently explored. Comparative studies across BRI nations could elucidate context-dependent ESG mechanisms. Methodologically, first, regarding the potential subjectivity of ESG ratings, we acknowledge that although the Huazheng ESG rating system is widely used and localized to China’s regulatory and market context, its methodology—similar to other ESG rating agencies—inevitably involves a degree of qualitative assessment, which may introduce evaluator bias. While we mitigate this by focusing on relative rather than absolute ratings and employing rigorous robustness checks, we also recognize the value of triangulating with alternative ESG data sources in future research. Second, in terms of the time horizon, we define the post-treatment period as beginning in 2014, when the BRI was formally incorporated into China’s government work report. However, we recognize that ESG outcomes—especially those linked to environmental transformation and governance reforms—may manifest over longer cycles. As such, our current data window may capture only short- to medium-term effects. We recommend future studies adopt extended timeframes to assess the durability and long-term implications of BRI-driven ESG changes. Third, while the placebo tests support the robustness of our findings by demonstrating that the observed effects are not due to random chance, they do not entirely rule out the possibility of omitted variable bias, particularly from unobservable firm-level factors or policy shocks that may correlate with both BRI participation and ESG performance. Similarly, although our alternative estimation strategies (e.g., PSM-DID and entropy balancing) help mitigate sample selection bias and improve covariate balance, they inherently rely on the assumption of no unobserved confounders—a condition that is difficult to verify in observational studies.
Author Contributions
Formal analysis and writing—original draft, F.C.; validation and writing—review and editing, Y.T.; writing—review and editing, B.L. All authors have read and agreed to the published version of the manuscript.
Funding
This research was funded by the Guangdong Provincial Philosophy and Social Sciences “13th Five-Year Plan” Fund Project (Grants No. GD18CGL04) and the Geological Survey Program of China Geological Survey (Grants No. DD20221782).
Institutional Review Board Statement
Not applicable.
Informed Consent Statement
Not applicable.
Data Availability Statement
Data are contained within the article.
Conflicts of Interest
The authors declare no conflicts of interest.
References
- Lyu, Y.; Lu, Y.; Wu, S.; Wang, Y. The Effect of the Belt and Road Initiative on Firms’ OFDI: Evidence from China’s Greenfield Investment. Econ. Res. J. 2019, 54, 187–202. [Google Scholar]
- Chen, W.; Wang, X.; Long, Y.; Zhao, X.; Liu, Z. Resilience Evolution of the Trade Networks in Regions along the Belt and Road. Econ. Geogr. 2024, 44, 22–31. [Google Scholar]
- Lyu, Y.; Ma, M.; Li, Y. The Major Achievements and Experience in the Joint Construction of the Belt and Road Initiative. Manag. World 2022, 38, 44–55+95+56. [Google Scholar] [CrossRef]
- Zhou, M.; Wu, J.; Li, Y.; Li, D. The Joint Construction of the Belt and Road Initiative and Deepening Interconnection: Based on the Perspective of Interconnections among Countries along the Route. Manag. World 2023, 39, 1–21+93+22. [Google Scholar] [CrossRef]
- Zhang, N.; Liu, Z.; Zheng, X.; Xue, J. Carbon footprint of China’s belt and road. Science 2017, 357, 1107. [Google Scholar] [CrossRef]
- Yang, F.; Li, J. A Review of Renewable Energy Investment in Belt and Road Initiative Countries: A Bibliometric Analysis Perspective. Energies 2024, 17, 4900. [Google Scholar] [CrossRef]
- Yang, B.; Li, B. The Belt and Road Initiative and Green Transformation and Upgrading of the Enterprises. Int. Econ. Trade Res. 2021, 37, 20–36. [Google Scholar]
- Wang, L.; Yang, M. The Belt and Road Initiative and Sustainable Development in the Context of Development Economics. China Ind. Econ. 2022, 1, 5–18. [Google Scholar] [CrossRef]
- Yucel, M.; Yucel, S. Environmental, Social, and Governance (ESG) Dynamics in the Energy Sector: Strategic Approaches for Sustainable Development. Energies 2024, 17, 6291. [Google Scholar] [CrossRef]
- Qiu, M.; Yin, H. An Analysis of Enterprises Financing Cost with ESG Performance under the Background of Ecological Civilization Construction. J. Quant. Technol. Econ. 2019, 36, 108–123. [Google Scholar] [CrossRef]
- Houston, J.F.; Shan, H. Corporate ESG profiles and banking relationships. Rev. Financ. Stud. 2022, 35, 3373–3417. [Google Scholar] [CrossRef]
- Fang, X.; Hu, D. Corporate ESG Performance and Innovation: Empirical Evidence from A-share Listed Companies. Econ. Res. J. 2023, 58, 91–106. [Google Scholar]
- Ferrell, A.; Liang, H.; Renneboog, L. Socially responsible firms. J. Financ. Econ. 2016, 122, 585–606. [Google Scholar] [CrossRef]
- Wang, Y.; Guo, Y. Firm Digital Transformation and ESG Performance: Evidence from Chin’s A-share Listed Firms. J. Financ. Econ. 2023, 49, 94–108. [Google Scholar]
- Lei, L.; Zhang, D.; Ji, Q. Common Institutional Ownership and Corporate ESG Performance. Econ. Res. J. 2023, 58, 133–151. [Google Scholar]
- Huang, S.-z.; Lu, J.-y.; Chau, K.Y.; Zeng, H.-l. Influence of ambidextrous learning on eco-innovation performance of startups: Moderating effect of top management’s environmental awareness. Front. Psychol. 2020, 11, 1976. [Google Scholar] [CrossRef]
- Lee, E.; Walker, M.; Zeng, C.C. Do Chinese state subsidies affect voluntary corporate social responsibility disclosure? J. Account. Public Policy 2017, 36, 179–200. [Google Scholar] [CrossRef]
- Kordsachia, O.; Focke, M.; Velte, P. Do sustainable institutional investors contribute to firms’ environmental performance? Empirical evidence from Europe. Rev. Manag. Sci. 2022, 16, 1409–1436. [Google Scholar] [CrossRef]
- Zhai, S.; Cheng, Y.; Xu, H.; Cao, L. Media Attention and the Enterprises’ESG Information Disclosure Quality. Account. Res. 2022, 8, 59–71. [Google Scholar]
- He, X.; Xiao, T.; Chen, X. Corporate Social Responsibility Disclosureand Financing Constraints. J. Financ. Econ. 2012, 38, 60–71+83. [Google Scholar]
- Xu, X.; Tang, Q. Financial Analyst Coverage and Corporate R&D Activities: Evidence from the Chinese Securities Market. J. Financ. Res. 2010, 12, 173–189. [Google Scholar]
- Ji, S.; Teng, Z. Green Tax Changes and Corporate ESG Performance. J. Stat. Inf. 2024, 39, 74–88. [Google Scholar]
- Kong, X.; Zhang, X.; Tang, X. The Impact of Carbon Emission Trading Pilot Policy on Corporate ESG Performance. Stat. Decis. 2024, 40, 174–178. [Google Scholar] [CrossRef]
- Hong, T.; Wang, Y.; Yao, S. Low-Carbon Pilot City Policy and Corporate ESG Performance: A Perspective Based on Investment Preferences. Rev. Ind. Econ. 2024, 3, 75–94. [Google Scholar] [CrossRef]
- Hu, J.; Han, Y.; Zhong, Y. How Corporate Digital Transformation Affects Corporate ESG Performance. Rev. Ind. Econ. 2023, 1, 105–123. [Google Scholar] [CrossRef]
- Wang, X.; Wang, L. Performance-based Equity Incentives, Exercise Conditions, and Corporate ESG Performance. Manag. Account. Stud. 2024, 3, 22–35. [Google Scholar]
- De Soyres, F.; Mulabdic, A.; Murray, S.; Rocha, N.; Ruta, M. How Much Will the Belt and Road Initiative Reduce Trade Costs? Int. Econ. 2019, 159, 151–164. [Google Scholar] [CrossRef]
- Yang, G.; Huang, X.; Huang, J.; Chen, H. Assessment of the Effects of Infrastructure Investment under the Belt and Road Initiative. China Econ. Rev. 2020, 60, 101418. [Google Scholar] [CrossRef]
- Ding, H.; Li, Y.; Wang, L.; Xue, C. The Belt and Road Initiative, Political Involvement, and China’s OFDI. Int. Stud. Econ. 2022, 17, 459–483. [Google Scholar] [CrossRef]
- Geng, Q. The Belt and Road Initiative and Its Implications for Global Renewable Energy Development. Curr. Sustain. Renew. Energy Rep. 2021, 8, 40–49. [Google Scholar] [CrossRef]
- Khan, I.; Han, L.; Bibi, R.; Khan, H. Linking Natural Resources, Innovations, and Environment in the Belt and Road Initiative Countries Using Dynamic Panel Techniques: The Role of Innovations and Renewable Energy Consumption. Environ. Sci. Pollut. Res. 2022, 29, 59666–59675. [Google Scholar] [CrossRef] [PubMed]
- Yin, W. Integrating Sustainable Development Goals into the Belt and Road Initiative: Would It Be a New Model for Green and Sustainable Investment? Sustainability 2019, 11, 6991. [Google Scholar] [CrossRef]
- Nitsche, B. Decrypting the Belt and Road Initiative: Barriers and Development Paths for Global Logistics Networks. Sustainability 2020, 12, 9110. [Google Scholar] [CrossRef]
- Chan, H.K.; Dai, J.; Wang, X.; Lacka, E. Logistics and Supply Chain Innovation in the Context of the Belt and Road Initiative (BRI). Transp. Res. E Logist. Transp. Rev. 2019, 132, 51–56. [Google Scholar] [CrossRef]
- Ahmad, Z.; Chao, L.; Chao, W.; Ilyas, S. How Collaboration Impacts in the Market Orientation-Performance Relationship of SMEs? A Perspective from Belt and Road Initiative. J. Bus. Ind. Mark. 2021, 36, 796–806. [Google Scholar] [CrossRef]
- Chen, Q.; Ma, L.; Yi, Z. Analyst Coverage and Corporate’s Innovation Performance: The Logic of China. Nankai Bus. Rev. 2017, 20, 15–27. [Google Scholar]
- Ribberink, N.; Schubert, L. Infrastructure Investment and Development alongside the Belt and Road Initiative. In Kazakhstan’s Diversification from the Natural Resources Sector: Strategic and Economic Opportunities; Routledge: London, UK, 2020; pp. 85–109. [Google Scholar]
- Yu, H. Motivation Behind China’s ‘One Belt, One Road’ Initiatives and Establishment of the Asian Infrastructure Investment Bank. In China’s New Global Strategy; Routledge: London, UK, 2020; pp. 3–18. [Google Scholar]
- Nedopil, C. Green Finance for Soft Power: An Analysis of China’s Green Policy Signals and Investments in the Belt and Road Initiative. Environ. Policy Gov. 2022, 32, 85–97. [Google Scholar] [CrossRef]
- Anderson, A.M.; Kish, R. Rewarding Performance through Sustainability-Linked Bonds. Econ. Aff. 2024, 44, 294–319. [Google Scholar] [CrossRef]
- Dhochak, M.; Ranga, A.; Doliya, P. Corporate Governance and Environmental Social and Governance Disclosures: Evidence from the Asia-Pacific Countries. Int. J. Corp. Gov. 2024, 14, 189–211. [Google Scholar] [CrossRef]
- Mulligan, C.; Morsfield, S.; Cheikosman, E. Blockchain for Sustainability: A Systematic Literature Review for Policy Impact. Telecomm. Policy 2024, 48, 102676. [Google Scholar] [CrossRef]
- Cheng, Q.; Cai, X.; Liu, B. The Belt and Road Initiative and ESG Performance of the Enterprises. Int. Econ. Trade Res. 2024, 40, 58–74. [Google Scholar]
- Kojima, K. The “Flying Geese” Model of Asian Economic Development: Origin, Theoretical Extensions, and Regional Policy Implications. J. Asian Econ. 2000, 11, 375–401. [Google Scholar] [CrossRef]
- Zhu, Q.; Sun, J. The Belt and Road Initiative and Green Innovation of Chinese Enterprises. Nanjing J. Soc. Sci. 2020, 11, 33–40. [Google Scholar]
- Chen, Y.; Yang, X.; Yao, X. Which Factor Will Be Helpful to the Skill Improvement of Employees in the Chinese OFDI Firms: On-the-Job Training or Labor Mobility? World Econ. Stud. 2019, 4, 59–70+135. [Google Scholar]
- Wang, Y.; Li, B. An Analysis of the Protection of Overseas Interests in China’s Outward Investment from a Risk-Return Perspective. Asia-Pac. Econ. Rev. 2020, 6, 100–107. [Google Scholar]
- Zhou, X.; Cheng, L.; Wang, H. Does Higher Technological Innovation Level Lead to Better Corporate Financial Performance? An Empirical Study Based on 16 Years of Patent Application Data from China’s Listed Pharmaceutical Companies. J. Financ. Res. 2012, 8, 166–179. [Google Scholar]
- Luo, C.; Zeng, S. “Going Global” and Financial Constraints of Enterprises: The “Belt and Road” Initiative as a Quasi-Natural Experiment. J. Financ. Res. 2020, 10, 92–112. [Google Scholar]
- Xu, S.; He, X.; Zhong, K. The Belt and Road Initiative and Chinese Firms’ Financial Constraints. China Ind. Econ. 2019, 7, 155–173. [Google Scholar]
- Wang, G.; Zhang, H. The Belt and Road Initiative and the TFP of China’s OFDI Enterprises: A Perspective on Investing in Developed Countries. J. World Econ. 2020, 5, 49–72. [Google Scholar]
- Chen, S.; Qiang, Q. The Trade Network Structure of the “One Belt and One Road” and Its Environmental Effects. Sustainability 2020, 12, 3519. [Google Scholar] [CrossRef]
- Yu, C.; Meng, X. How Does “the Belt and Road” Initiative Boost Innovation of Chinese Enterprises. J. Int. Trade 2022, 12, 130–147. [Google Scholar]
- Bhandari, K.R.; Ranta, M.; Salo, J. The Resource-Based View, Stakeholder Capitalism, ESG, and Sustainable Competitive Advantage: The Firm’s Embeddedness into Ecology, Society, and Governance. Bus. Strategy Environ. 2022, 31, 1525–1537. [Google Scholar] [CrossRef]
- Lee, H. Drivers of Green Supply Chain Integration and Green Product Innovation: A Motivation-Opportunity-Ability Framework and a Dynamic Capabilities Perspective. J. Manuf. Technol. Manag. 2023, 34, 476–495. [Google Scholar] [CrossRef]
- Zhu, J. The Belt and Road Initiative and the Information Efficiency of Capital Market. Econ. Manag. 2019, 9, 38–56. [Google Scholar]
- Du, X.; Xiao, L.; Zhang, Y. External Audit Governance and Information Disclosure Quality of Chinese Enterprises in Countries along the “Belt and Road Initiative”. J. Cent. Univ. Financ. Econ. 2022, 5, 59–71. [Google Scholar]
- Tang, Y.; Ma, W.; Xia, L. Quality of Environmental Information Disclosure, Internal Control “Level” and Enterprise Value: Empirical Evidence from Listed Companies in Heavy Polluting Industries. Account. Res. 2021, 7, 69–84. [Google Scholar]
- Li, H.; Zhang, T.; Yang, F.; Chen, M. Environmental, Social and Governance Information Disclosure and Corporate Green Innovation Performance. Stat. Res. 2022, 39, 38–54. [Google Scholar]
- Guo, B.; Pérez-Castrillo, D.; Toldrà-Simats, A. Firms’ Innovation Strategy under the Shadow of Analyst Coverage. J. Financ. Econ. 2019, 131, 456–483. [Google Scholar] [CrossRef]
- Lu, S.; Dong, R.; Ye, C. Does “the Belt and Road Initiative” Promote High-Quality Exports: Evidence from Firms in China. China Ind. Econ. 2021, 3, 80–98. [Google Scholar]
- Dai, X.; Song, J. Global Value Chain Optimization Effect of the Belt and Road Initiative: Based on the Perspective of Improving the GVC Position of Participating Countries along the Belt and Road. China Ind. Econ. 2021, 6, 99–117. [Google Scholar]
- Zhang, L.; Wu, X. The Mechanism, Dilemmas, and Countermeasures of Digital Finance in Alleviating Financing Constraints for SMEs. Theor. Investig. 2020, 5, 110–114. [Google Scholar]
- Beck, T.; Levine, R.; Levkov, A. Big Bad Banks? The Winners and Losers from Bank Deregulation in the United States. J. Financ. 2010, 65, 1637–1667. [Google Scholar] [CrossRef]
- Lin, Y.; Fu, X.; Fu, X. Varieties in State Capitalism and Corporate Innovation: Evidence from an Emerging Economy. J. Corp. Financ. 2021, 67, 101919. [Google Scholar] [CrossRef]
- Wu, Y.; Zhou, R.; Zhang, C. Size and ESG Premiums: Evidence from Chinese A-Share Market. N. Am. J. Econ. Financ. 2024, 74, 102246. [Google Scholar] [CrossRef]
- Pelster, M.; Horn, M.; Oehler, A. Who Cares about ESG? J. Clim. Financ. 2024, 8, 100045. [Google Scholar] [CrossRef]
- Sun, X.; Zhou, C.; Gan, Z. Green Finance Policy and ESG Performance: Evidence from Chinese Manufacturing Firms. Sustainability 2023, 15, 6781. [Google Scholar] [CrossRef]
- Krueger, P.; Matos, P.; Serafeim, G.; Zheng, K. The Effects of Mandatory ESG Disclosure Around the World. J. Account. Res. 2024, 62, 1795–1847. [Google Scholar] [CrossRef]
- Zhang, B.; Zhang, Y. The More Open, the Greener: Comprehensive Pilot Zones for Cross-Border E-Commerce and the Enhancement of Corporate Environmental Performance. Int. Trade 2023, 10, 16–27. [Google Scholar]
- Heckman, J.J.; Ichimura, H.; Todd, P.E. Matching as an econometric evaluation estimator: Evidence from evaluating a job training programme. Rev. Econ. Stud. 1997, 64, 605–654. [Google Scholar] [CrossRef]
- Hainmueller, J. Entropy balancing for causal effects: A multivariate reweighting method to produce balanced samples in observational studies. Pol. Anal. 2012, 20, 25–46. [Google Scholar] [CrossRef]
- Tang, S.; Wu, X.; Zhu, J. Digital Finance and Enterprise Technology Innovation: Structural Feature, Mechanism Identification and Effect Difference under Financial Supervision. Manag. World 2020, 36, 52–66+9. [Google Scholar]
- Yu, M.; Fan, R.; Zhong, H. Chinese Industrial Policy and Corporate Technological Innovation. China Ind. Econ. 2016, 12, 5–22. [Google Scholar] [CrossRef]
- Song, X.; Hu, J.; Li, S. Corporate Social Responsibility Disclosure and Stock Price Crash Risk Based on Information Effect and Reputation Insurance Effect. J. Financ. Res. 2017, 4, 161–175. [Google Scholar]
- He, J.J.; Tian, X. The dark side of analyst coverage: The case of innovation. J. Financ. Econ. 2013, 109, 856–878. [Google Scholar] [CrossRef]
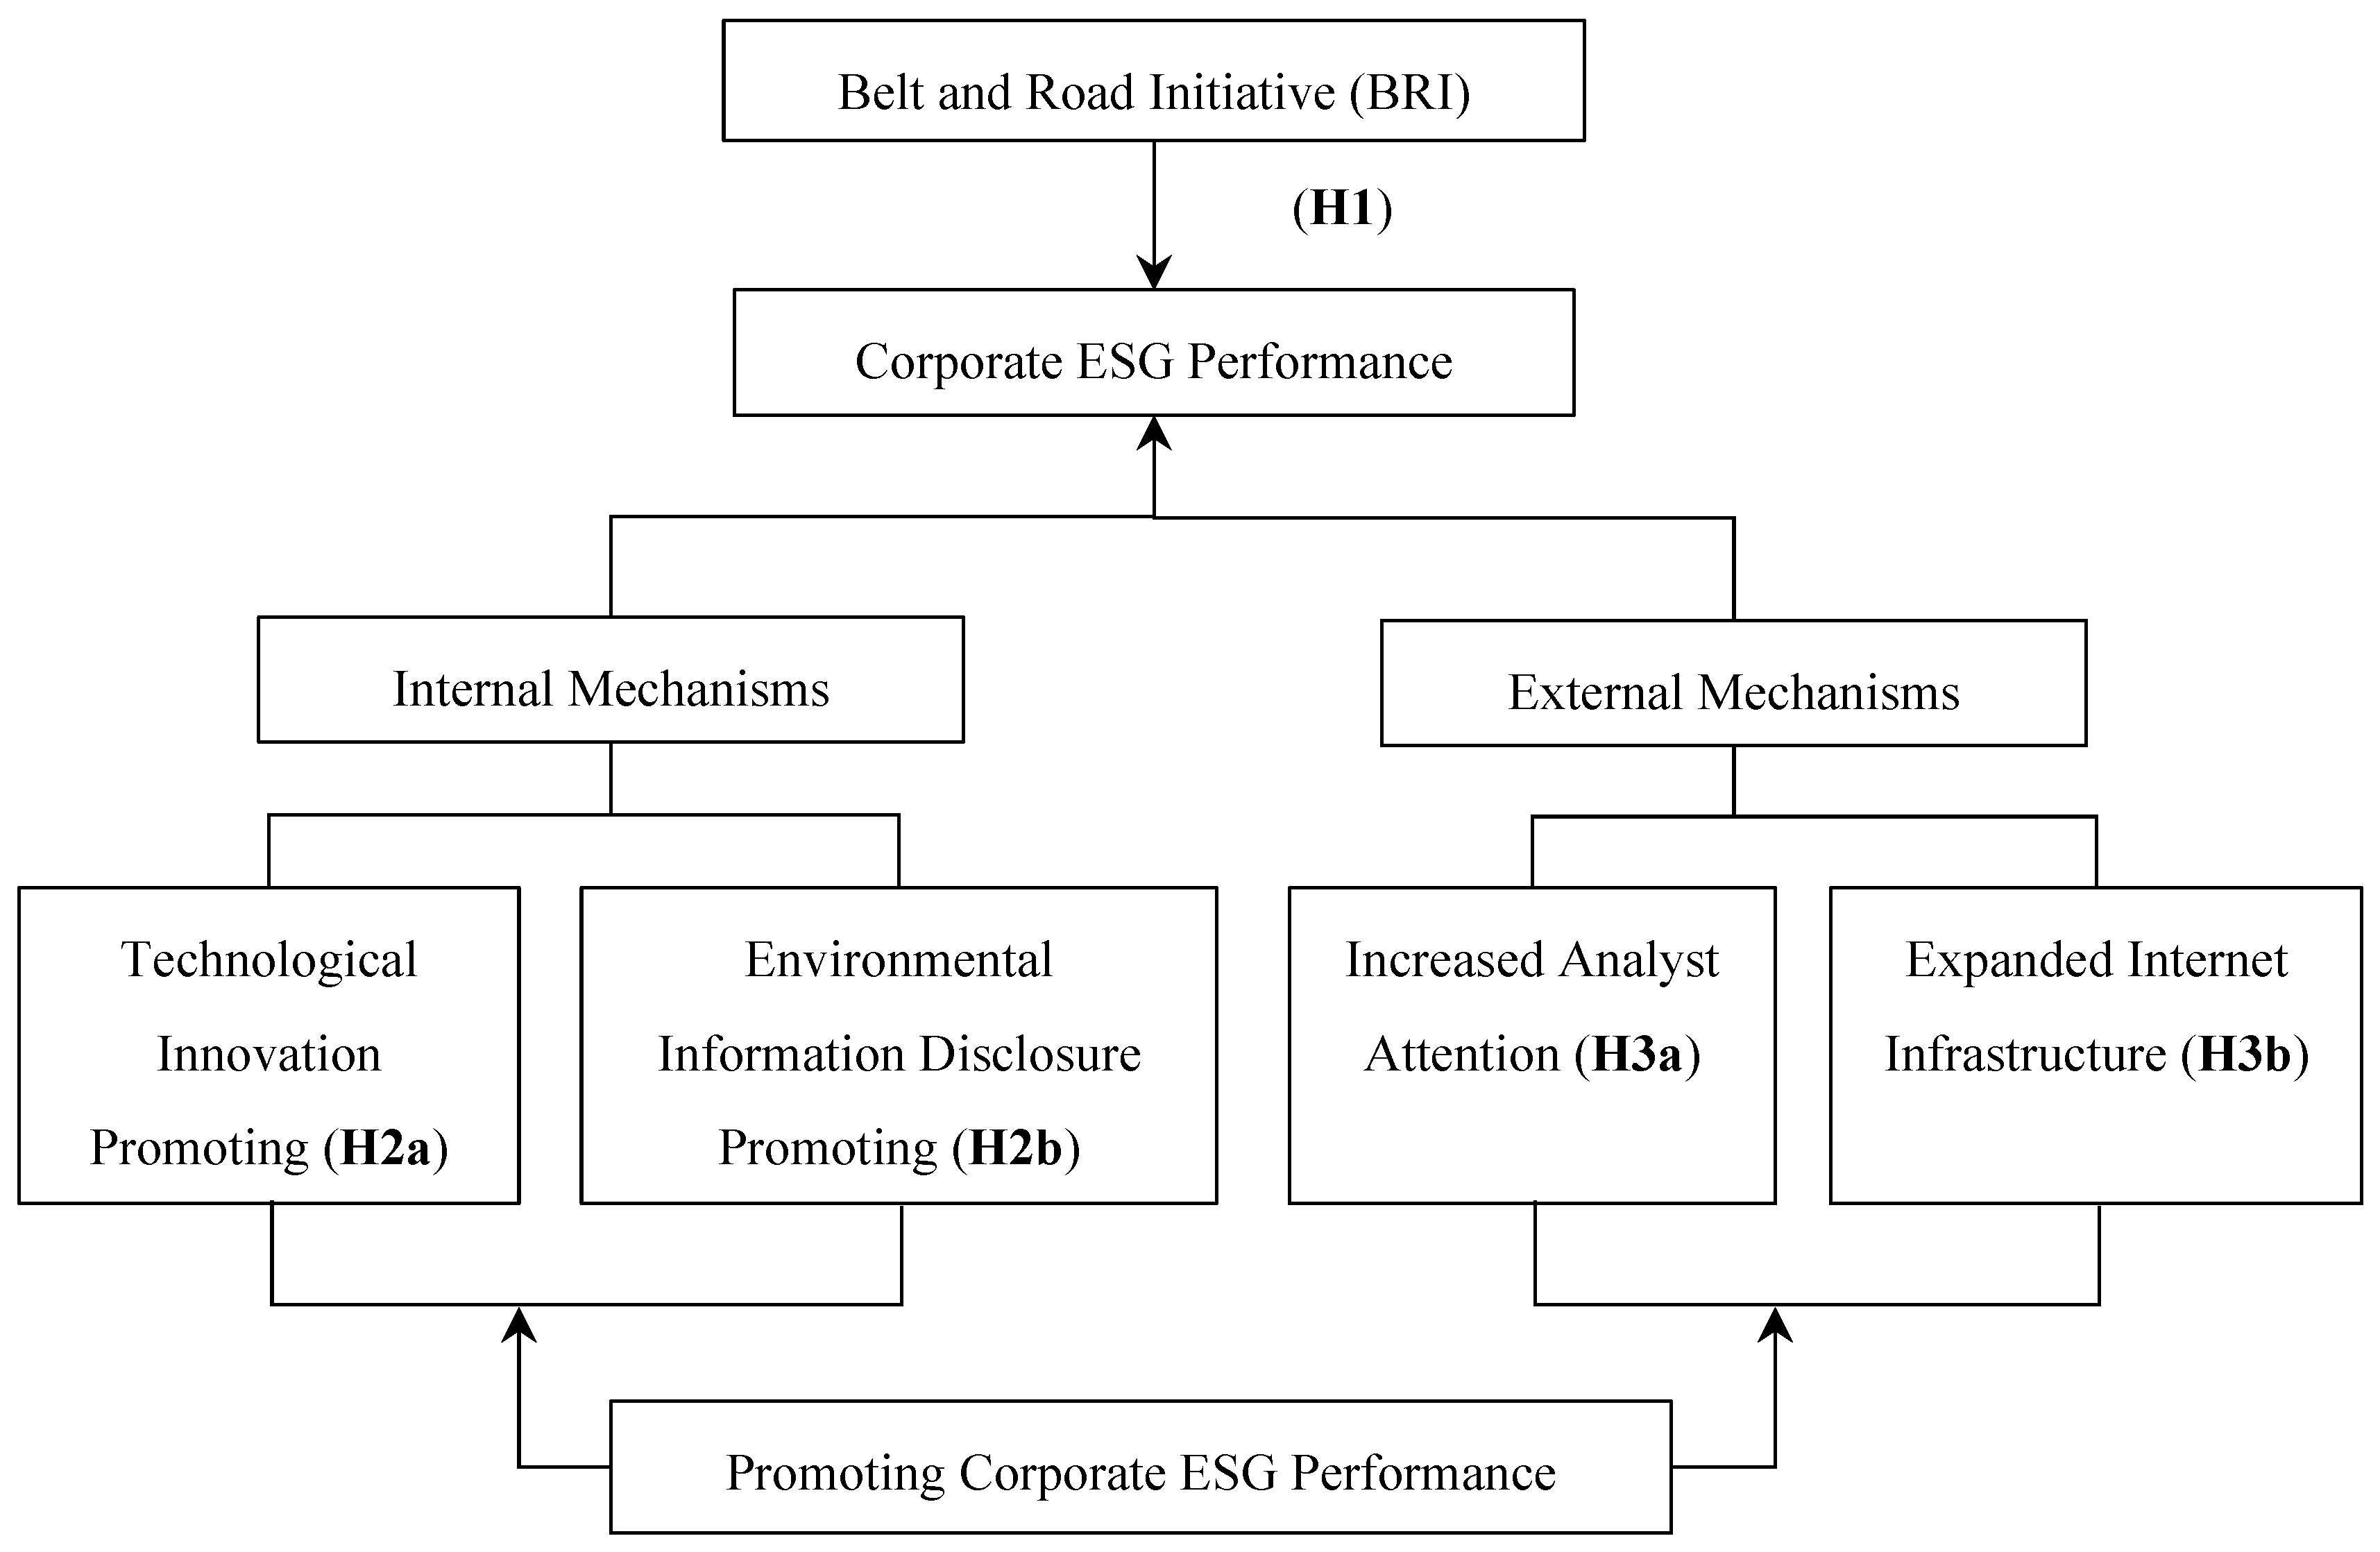
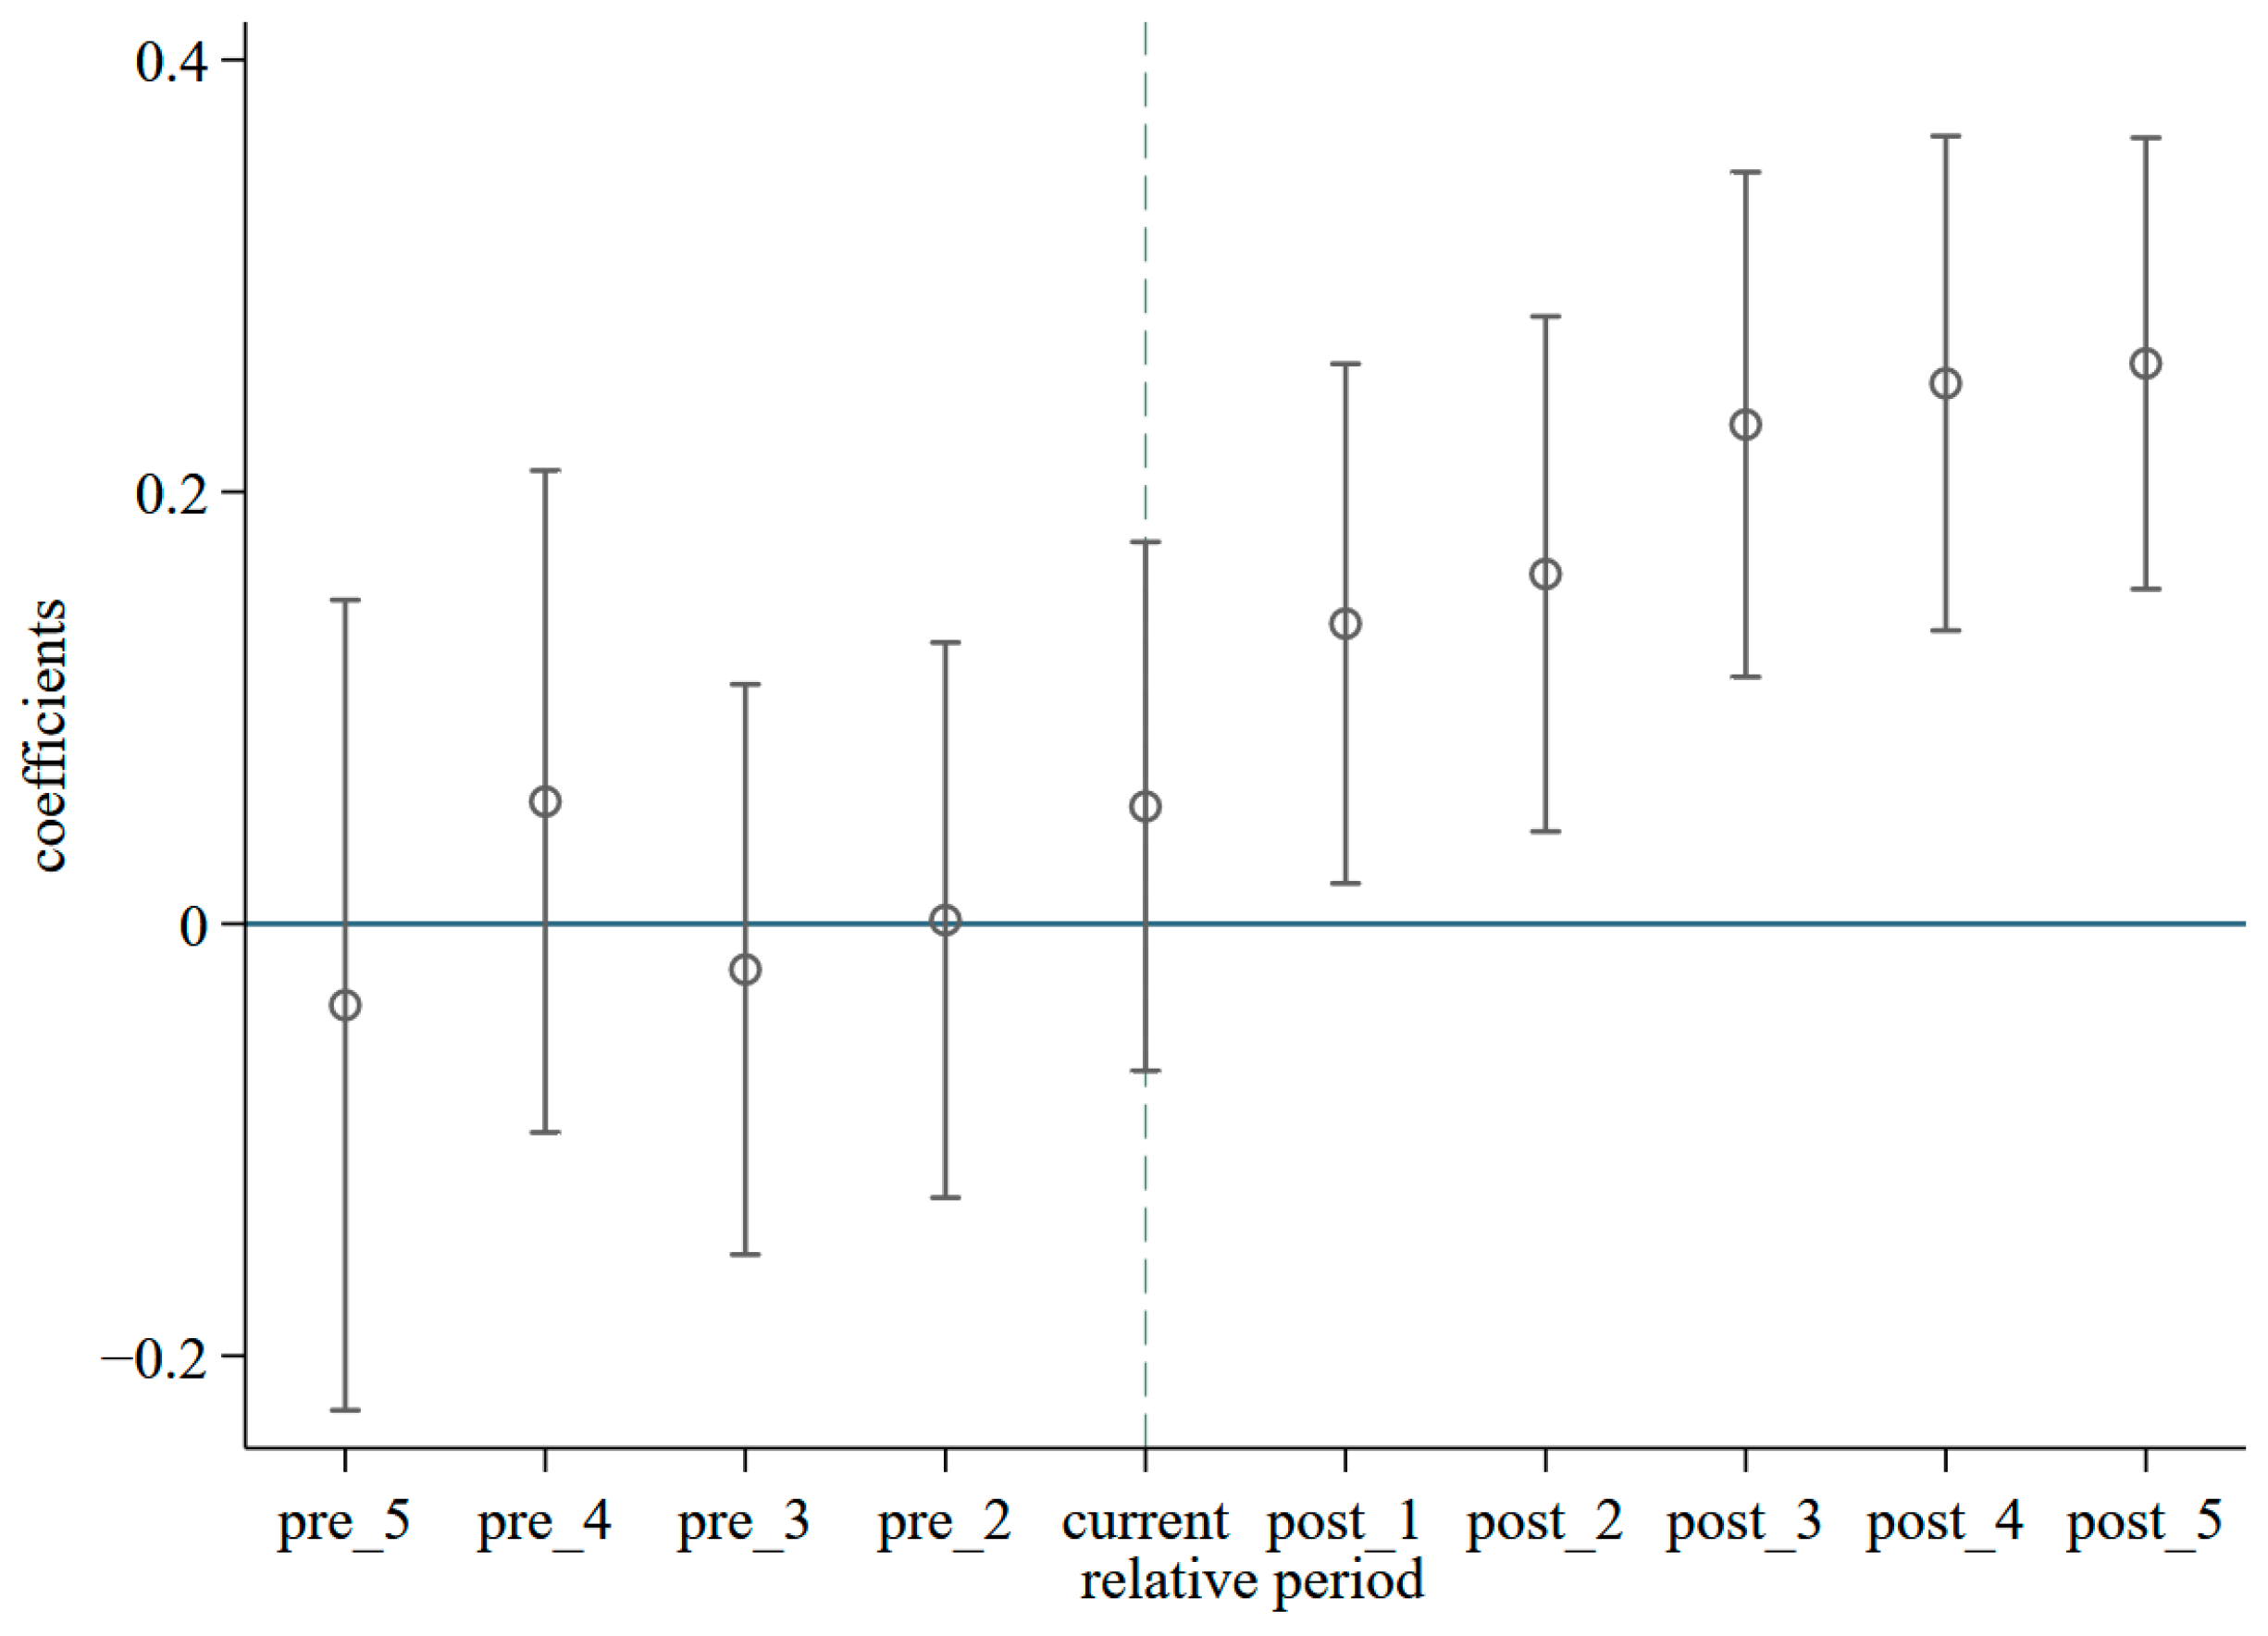
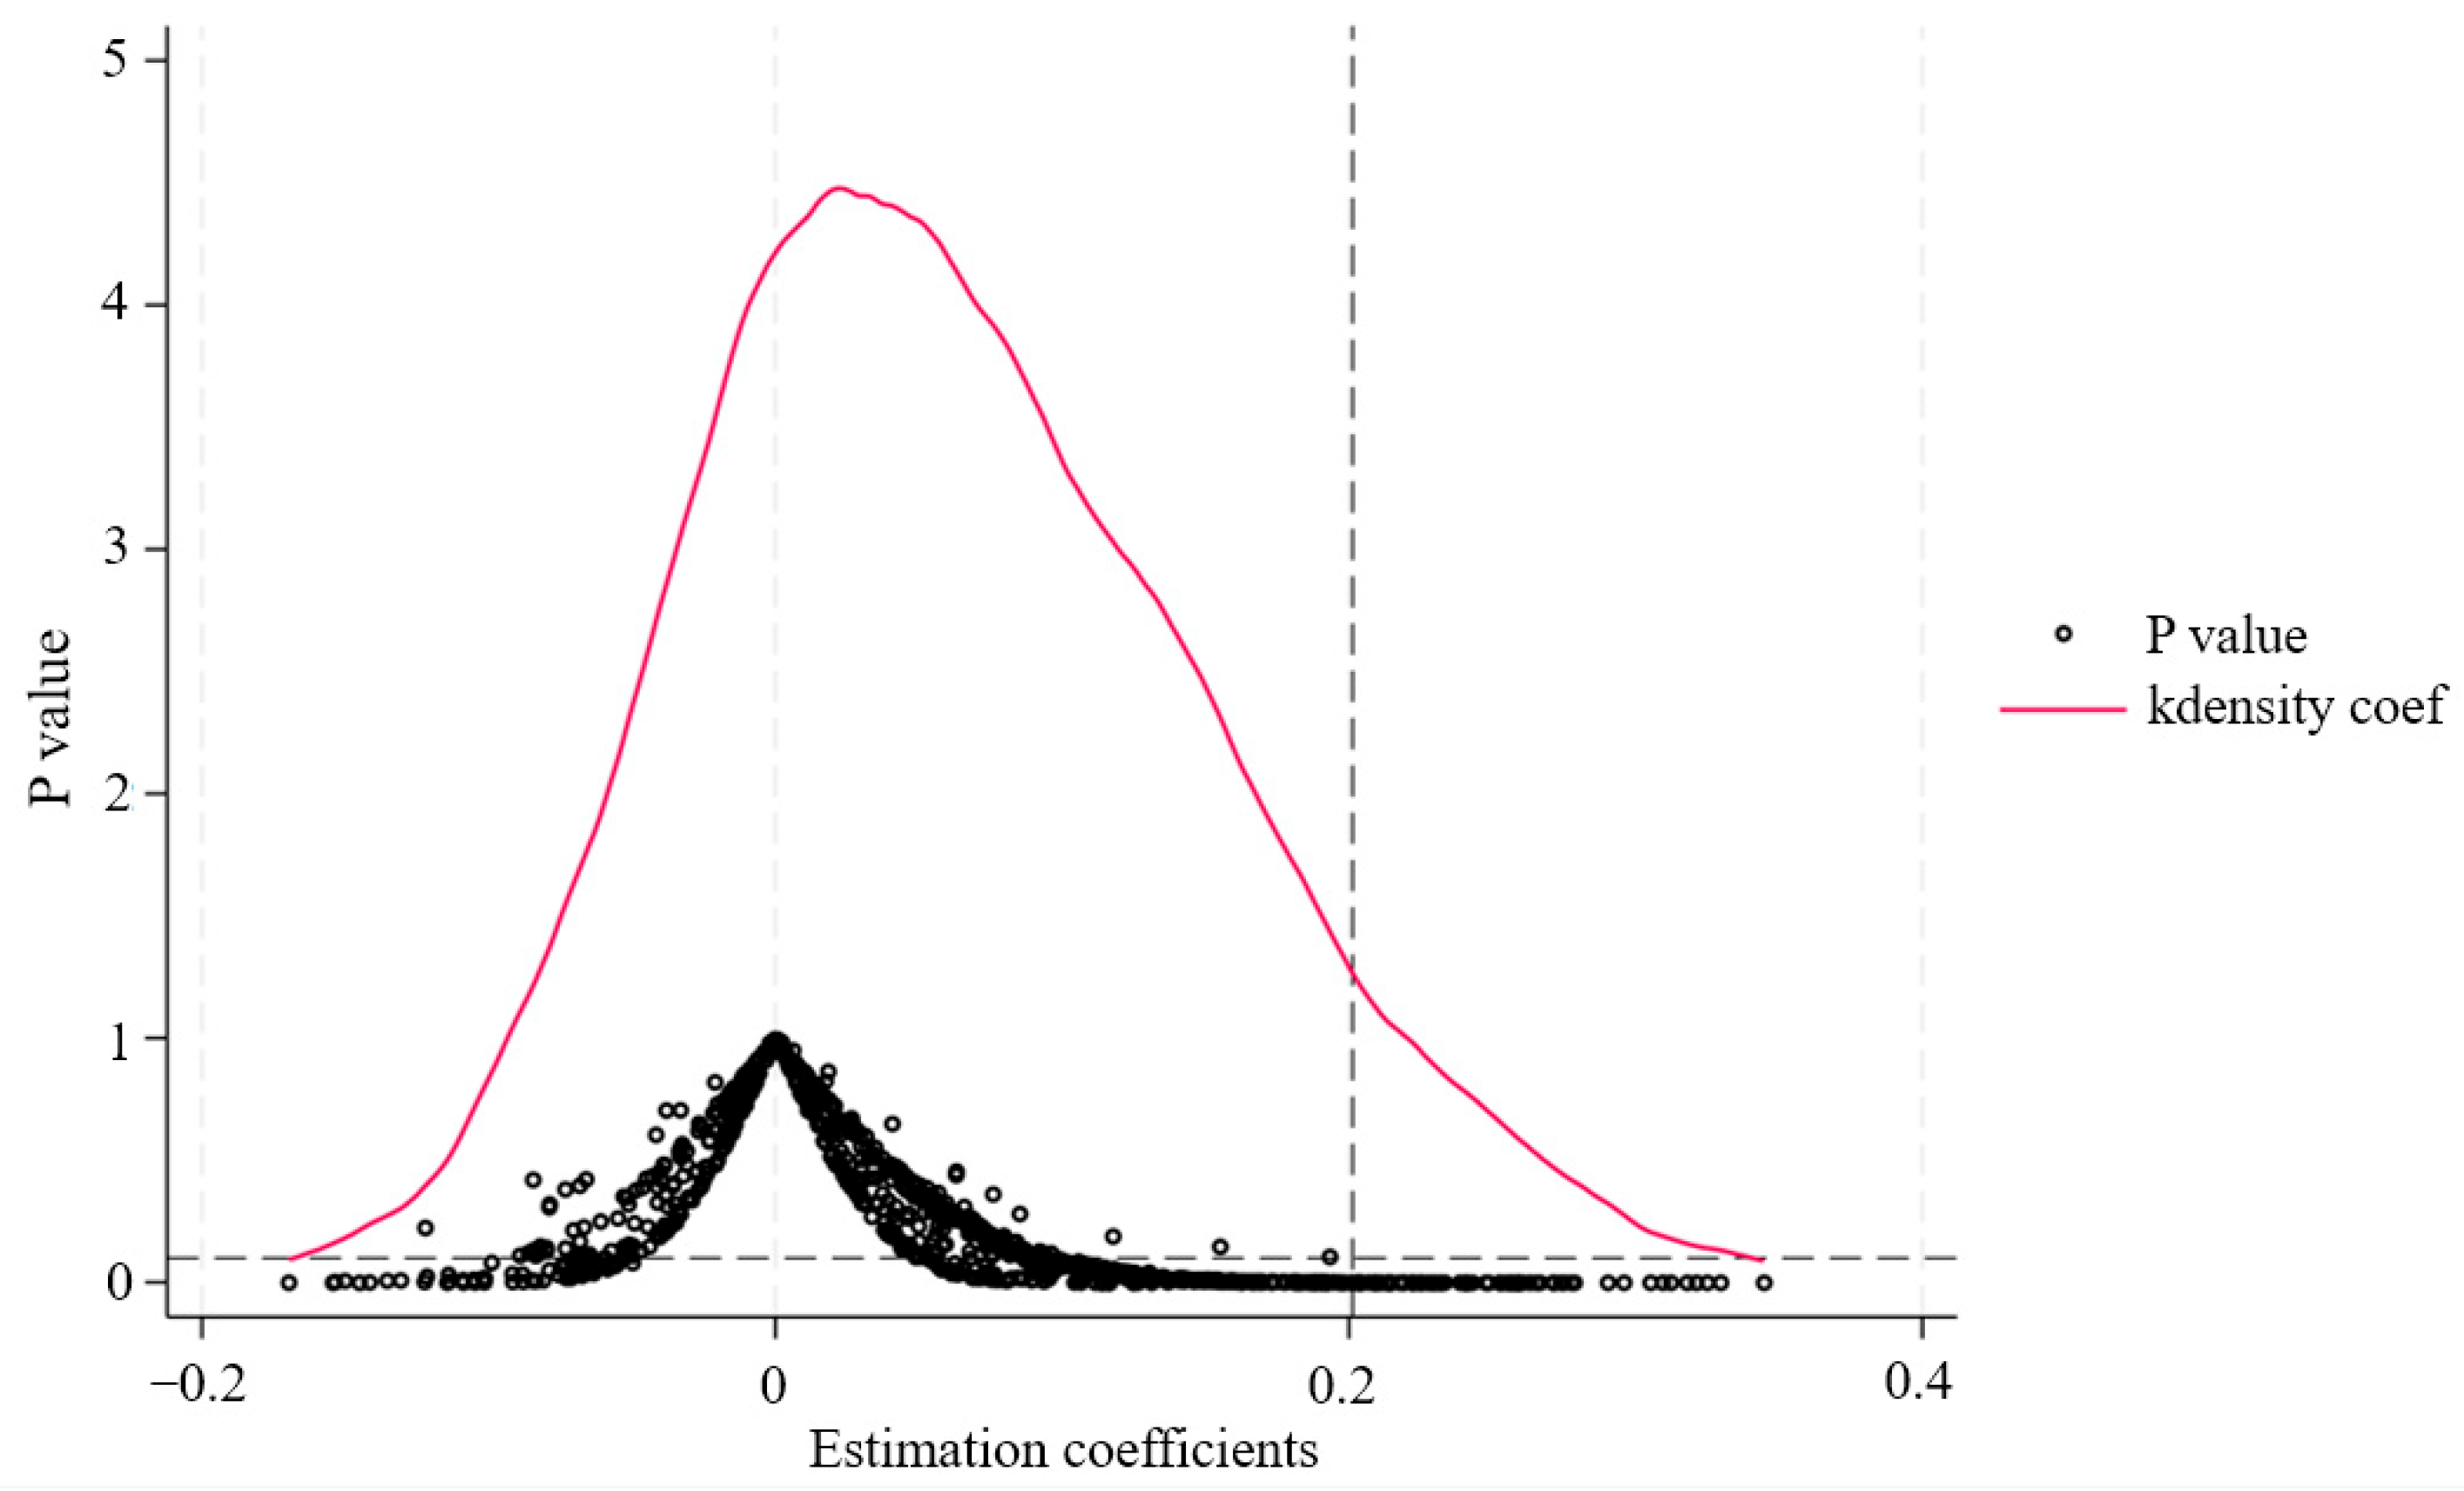
Disclaimer/Publisher’s Note: The statements, opinions and data contained in all publications are solely those of the individual author(s) and contributor(s) and not of MDPI and/or the editor(s). MDPI and/or the editor(s) disclaim responsibility for any injury to people or property resulting from any ideas, methods, instructions or products referred to in the content. |
© 2025 by the authors. Licensee MDPI, Basel, Switzerland. This article is an open access article distributed under the terms and conditions of the Creative Commons Attribution (CC BY) license (https://creativecommons.org/licenses/by/4.0/).