Article

How Does Green Credit Affect Corporate Green Investment Efficiency? A Test Based on Listed Corporations in China’s Heavy Pollution Industry

1
Business School, Qingdao University of Technology, Qingdao 266520, China
2
School of Economics and Management, China University of Petroleum (East China), Qingdao 266580, China
3
State Key Laboratory of Enhanced Oil and Gas Recovery, Research Institute of Petroleum Exploration and Development, CNPC, Beijing 100083, China
*
Authors to whom correspondence should be addressed.
Sustainability 2025, 17(8), 3712; https://doi.org/10.3390/su17083712
Submission received: 5 March 2025 / Revised: 15 April 2025 / Accepted: 17 April 2025 / Published: 19 April 2025

Abstract

:
Green credit significantly aids green industry development and energy transformation. However, can green credit incentivize heavy polluting corporations to accelerate their green transformation? To assess this question, this research analyzed how green credit affects green investment efficiency of heavy polluting corporations. A fixed-effects model was applied to explore the impact, followed by a threshold effect model to assess whether there is a nonlinear relationship under the effect of other factors. The study shows that green credit can significantly improve the green investment efficiency of heavy polluting corporations. From an internal control perspective, this improvement is significant for corporations that are state-owned or have low executive shareholding. From an external regulation perspective, the improvement is significant for the areas with low financial and environmental regulation. Green credit is influenced by the corporate asset–liability ratio and executives’ green thinking; both have non-linear, single-threshold effects on corporate green investment efficiency.

1. Introduction

Under the carbon neutrality of China, green credit (GC) has become an important way to promote the low-carbon transformation of corporations. The scale of GC in China’s domestic and foreign currencies grew significantly, from RMB 8.23 trillion at the end of 2018 to RMB 22.03 trillion by the end of 2022. In January 2025, the National Financial Regulatory Administration and the People’s Bank of China further issued the “Implementation Plan for the High—Quality Development of Green Finance in the Banking and Insurance Industry” to further strengthen green finance management and incentivize the development of. However, problems remain, such as insufficient policy implementation [1], an insufficient pool of professionals knowledgeable in this area, and unclear environmental information disclosure rules [2]. Accelerating the green transformation of heavy polluting corporations is needed to realize low-carbon economic and social transformation. GC is an important means for limiting the number of loans to highly polluting corporations, as well as incentivizing corporations to reduce pollution [3,4].
In theory, GC can significantly impact the green investments of heavy polluting (HP) corporations. First, external financing conditions affect corporations’ investment decisions and production activities. GC policies limit the financing of traditional polluting projects by changing the lending threshold. This activates the “Porter effect” and achieves a “win-win” effect between the environment and the economy. Su and Lian [5] and Cutillas et al. [6] noted that short-term debt can reduce overinvestment and improve underinvestment, increasing investment efficiency. Second, GC serves as a source of external pressure for heavy polluting corporations, motivating them to improve GI, reduce pollution emissions, and actively meet social responsibilities. Corporations that implement green management are more likely to obtain bank loans with the support of GC policies, thereby encouraging green innovation and productivity improvement [7,8]. GC is also associated with more external oversight, reducing inefficient investments by managers [9].
Studies have explored the impact of green finance policies on multiple investment behavior by Chinese enterprises [10,11,12,13]. For example, Wang and Fan [14] analyzed the relationship between green finance and investment behavior of renewable energy enterprises. Zhang et al. [10] explored how the green credit policy affects overseas investment efficiency. Zhang and Shi [12] analyzed the effects of carbon emissions trading policy on green investment in carbon-intensive enterprise. However, few studies have explored the green investment efficiency (GIE) achieved by those enterprises. Evaluating efficiency systematically is needed to display the level of GI in China, with the goal of good environmental outcomes [15,16]. Otherwise, the real level of GI in China cannot be accurately displayed, which is not conductive to achieving the goal of favorable environmental results.
In addition, studies have not yet addressed the impact of GC on corporate GIE from the perspective of heavy polluting industry. For example, Li et al. [11] studied the impact of finance on firm’s green investment efficiency. Green investment helps to promote the transformation of high-emission industries to low-carbon and environmentally friendly emerging industries. Furthermore, the promotion of green investment depends on the development of green credit. Thus, the study on the impact of GC on corporate GIE from the perspective of heavy polluting industry has important theoretical and practical significance. Finally, recent studies on GC focus on studying its linear policy effects, such as the policy effects of GC on bank financial performance, bank profitability and risk, corporate financing, and corporate innovation [3,17,18,19]. Studies have not considered whether there is a non-linear effect of GC on corporations at a micro-level in the presence of other factors, as well as with high polluting industries. If based on this idea, the impact of GC on GIE in high polluting industries would not be revealed and even lead to misunderstanding.
This study used a Super Slacks-Based Measure (Super-SBM) DEA model to measure the GIE of HP corporations. Second, double fixed effects were used to investigate whether GC has a linear effect on the GIE of these corporations. Then, the heterogeneity of this relationship was investigated based on property rights, executive shareholding, financial regulation, and environmental regulation. Finally, a threshold effect model was used to investigate whether there is a nonlinear effect associated with the relationship based on corporate indebtedness and corporate executives’ green thinking. Due to the lack of uniformity in the degree to which HP corporations disclose pollutants, and the lack of a complete pollutant emissions database, pollutant emission data from 2016 to 2021 were manually collected for 78 HP corporations.
This paper makes the following key contributions. First, this paper focuses on the impact of GC on the efficiency of GI in HP corporations. By using a double-fixed model and heterogeneity analysis, this study empirically confirms the impact of GC on the GIE of HP corporations. Second, this research measures this efficiency using manually collected company-level data. This enables more objective and accurate index measurements, reflecting the actual effect of corporations’ GI and providing basic data for subsequent studies. Third, this paper presents a specific study on the policy implications of GC. By considering the effects of corporate indebtedness and corporate executives’ thinking related to green business, the study explores the non-linear effects of GC on the GIE of heavily polluting corporations. The results of this study can help more accurately analyze the impact of GC policies and improve the relevance and effectiveness of policy formulation.
The rest of this paper is structured as follows. Section 2 reviews the previous literature, Section 3 is the methodology, Section 4 describes the results, and Section 5 provides conclusions and policy recommendations.

2. Literature Review

2.1. Impact of GC

GC is a policy tool by which banks can earn profits while fulfilling their social responsibilities. Some studies have explored the policy implications of GC from the bank’s perspective. Zhou et al. [20] found that corporate social responsibility has negative short-term and positive long-term impacts on banks’ financial performance; GC plays a moderating role. Lian et al. [17] found that GC improves the financial performance of commercial banks, due to its positive effect on the return on interest-earning assets for those banks. Luo et al. [18] found that GC positively impacts the core competitiveness of commercial banks. Yin et al. [21] found that large profitable banks tend to provide more GC. Cilliers et al. [22] noted that GC has a positive spillover effect on society and contributes to bank sustainability. The GC regulatory system is currently inadequate in China; as such, banks face higher policy, market, and reputation risks when implementing GC [23].
Some studies have explored the policy implications of GC from a corporate perspective. Wu et al. [24] found that GC positively affects the environmental economic performance of corporations through eco-innovation. Lin and Pan [3] noted that GC policies can decrease the level of financing for heavy polluters, reducing both bank and non-bank loans. Zhou et al. [25] found that GC policies improve corporations’ environmental goods and services and significantly increase the maturity of corporations’ green exports. Zhang et al. [26] found that GC policies can also significantly promote innovation and significantly affect corporations’ pollution emissions.
Zhang et al. [27] noted that GC policies hinder radical green innovation but improve overall and incremental green innovation for heavy polluters. The “push-back” effect of green finance can lead corporations to achieve a “green”-oriented transformation of investments and lead “high pollution and high energy consumption” corporations to gradually become “green” corporations [28]. Wen et al. [29] found that GC policies can impact the transformation and upgrading of high energy-consuming corporations. GC can also impact corporate investment and financing [3,30,31,32,33]. Lin and Pan [34] analyzed the impacts of GC on green transformation of HP enterprises. Huang and Xie [35] explored the impact of GC policies on the global value chain position of HP enterprises.

2.2. Green Investment Efficiency

GIs refer to investments that are designed to reduce greenhouse gas and air pollutant emissions, without significantly reducing the production and consumption of non-energy products [36]. Mielke and Steudle [37] defined GI as capital flowing to green infrastructure and technology. Corporate investment in environmental protection is defined as expenditures made on research and development and environmental technology renovation, as well as the cost of upgrading production equipment required for corporate environmental responsibility. This includes investment in pollution prevention, maintenance of environmental protection equipment, and pollution control [38].
Previous research has focused on GI; as such, a uniform and clear definition of GIE has not emerged. However, related studies do include similar definitions. These include environmental efficiency, defined as a measure of the potential and actual enterprise pollution emissions [39], and eco-efficiency, defined as the efficiency of the input of ecological resources in meeting human needs [40]. Pan and He [41] used super-efficient SBM-DEA to measure the GI benefits of corporations, using the value of the integrated utilization of three wastes as the expected output.
Few studies have directly studied the efficiency of corporate GI; however, many factors have been studied on topics with a similar influence with respect to GIE, and some have been studied from a policy perspective. Chang et al. [42] found that government subsidies and tax rebates can positively impact the efficiency of business investments. Renewable energy policy, China’s carbon emissions trading policy, environmental policy, and GC policy all impact GI [13,15,26,43].
Other factors affect GIE. For example, Fan et al. [44] assessed the efficiency in Belt and Road countries, where industrial structure and external dependence show inhibitive and promotional effects, respectively, on GIE, and where technology investment has changed from an initial negative impact to a positive one. Environmental regulation is seen as a major factor incentivizing companies to make GIs [45]. Wang and Wang [38] found that provincial green economy and green enforcement governance play an important role in promoting GI for heavy polluters. Hu et al. [46] found that Chinese railroad express transportation has improved environmental efficiency in China. Anagnostopoulou and Avgoustaki [47] concluded that human resource practices inhibit business investment efficiency. Yan et al. [48] found that the green gold financial reform and the innovation pilot zone increased corporations’ R&D investment and improved their investment efficiency. Tian et al. [49] analyzed the impact of GC regulation on corporate GIE.

2.3. The Impact of GC on Corporate Investment and Financing Behavior

Many studies have examined the effects of GC on the cost and maturity of corporate financing. Lin and Pan [34] analyzed how GC policies impact the financing decisions of heavy polluters. Chai et al. [50] noted that GC policies reduce the illiquid liabilities of heavy polluters but increase the liquid liabilities and commercial credit of corporations. Liu et al. [51] found that GC policies significantly reduce the debt financing capacity of heavy polluters. Zhang et al. [33] found that after implementing GC guidelines, high pollution and high energy consumption corporations faced significantly increased financing costs. Wu et al. [30] proposed that GC policy significantly negatively impacted the external financing of the manufacturing industry. Xu and Li (2020) found that the GC policy reduced the maturity and increased the cost of debt financing for “two high” corporations. Li et al. [52] noted that listed companies in industries with higher environmental risks face more severe financing constraints after implementing GC policies.
Some studies have found that GC can impact corporations’ investment behavior [53,54]. Wang and Fan [11] constructed a green finance development index and found that green finance significantly increases investments in renewable energy corporations. Feng et al. [55] showed that GCs can financially support and incentivize manufacturers to invest in R&D for “early adopters” of new energy vehicles. Li et al. [56] developed a game model among corporations, banks, and government to demonstrate that green loan subsidies increase the willingness of business corporations to invest in innovation. Zhao et al. [32] found that GC policies increased the investment cash flow sensitivity of heavily polluting corporations. Zhang et al. [27] found that GC policies help improve the efficiency of China’s overseas investments. He et al. [57] showed that GC had a non-linear relationship on how renewable energy investment impacts the green economic development index, with a double threshold effect. Li et al. [11] studied the relationship between GC and GIE of green corporations. Zhao et al. [58] explored the impact of green finance on corporate carbon emissions.
Existing research on green investment efficiency reveals three critical gaps that inform the present study’s approach. First, while numerous studies have demonstrated green credit’s positive effects on renewable energy sectors [14], its potential to drive green transformation in heavy polluting industries remains theoretically contested [3,19]. This study aims to address this debate by employing a fixed-effects model to systematically examine green credit’s impact on green investment efficiency in high-pollution enterprises.
Second, the current literature predominantly examines either macro-level policy effects or isolated firm characteristics [45], lacking comprehensive analysis of how internal governance and external regulation interact. The present research seeks to bridge this gap by incorporating both internal control variables (e.g., ownership structure, executive shareholding) and external moderating factors (e.g., regional financial supervision intensity, environmental regulation stringency), thereby addressing what Anagnostopoulou and Avgoustaki [47] identify as the “insufficient attention to corporate micro-foundations”.
Third, existing studies have largely overlooked potential nonlinear relationships in green credit effects [11]. This investigation proposes to employ threshold effect modeling to examine critical tipping points in variables such as corporate debt-to-asset ratios and executives’ environmental awareness. This methodological approach responds to the call of Tian et al. [49] for greater attention to heterogeneous effects in green finance policy research.
Through these three dimensions of analysis, this study intends to provide new empirical evidence for optimizing differentiated green credit policies, while addressing several key limitations in the current literature.

3. Methodology

3.1. Hypotheses

GC increases the cost of debt financing [31] and significantly inhibits the financing of heavy polluters [59]. A corporation’s financing directly impacts its decisions, especially with respect to green management [60]. Research shows that corporations seek to grow and actively manage in a green way to obtain bank loans, which promotes corporate green innovation, corporate productivity, and corporate GIE [11,61,62]. To remain competitive in accessing GC, companies are more likely to adopt an investment strategy that prioritizes green projects; this may reduce their pollution emissions [14]. Therefore, GC enables heavy polluters to actively use limited resources for pollution control and GIs, improving their GIE. The analysis above leads to Hypothesis 1:
H1. 
Increased GC increases the GIE of heavy polluters.
There is a non-linear relationship between debt and investment [63]. Debt financing can reduce the agency cost problem between corporate executives and shareholders [64]. On the negative side, a high debt level places more interest pressure on corporations and compresses available investment funds. Highly indebted corporations choose a conservative strategy, increasing corporate savings and foregoing otherwise profitable investment opportunities in favor of repairing weak balance sheets and reducing external financing costs [65]. When corporate indebtedness reaches a certain level, heavy polluters invest in green transformation to obtain bank loans, enhancing the GC policy reversal effect. Therefore, GC has a non-linear impact on corporations’ GIE, depending on the indebtedness of corporations. This analysis leads to Hypothesis 2.
H2. 
The level of corporate indebtedness has a threshold effect on the impact GC has on corporate GIE.
Executive perception, or thinking, involves focusing on and interpreting internal and external organizational factors; executive perception informs the operational efficiency and effectiveness of the organization’s purpose [66]. Executives’ low-carbon perceptions significantly and positively impact corporate low-carbon behavior, indicating that moderate executives’ low-carbon perceptions promote corporate low-carbon behavior [67]. Higher environmental protection awareness among corporate executives is associated with more decision-making behavior that supports improvements in the corporate environment. Executives’ perceptions drive low-carbon behavior; executives with more awareness about low-carbon approaches and benefits are more inclined to adopt low-carbon management strategies [68].
A moderate level of green thinking by executives can promote the effect of GC on corporate GIE; the policy effect of GC may weaken when this level of thinking reaches a certain level and internal low-carbon management strategies become more mature. Therefore, GC may have a non-linear impact on the GIE of corporations, depending on the level of executive green thinking. This leads to Hypothesis 3:
H3. 
Executive green thinking has a threshold effect with respect to the impact of GC on corporate GIE.

3.2. The Super-SBM DEA

Environmental issues are commonly studied using pollutant emissions as an output variable to assess environmental performance, with pollutant emissions being non-desired outputs. Traditional DEA models are mostly radial and angular measurements, which cannot fully consider the slack of input and output, and cannot accurately measure the efficiency when there is unexpected output. In order to overcome these shortcomings, Tone [69] proposed a non-radial and non-angular SBM-DEA model based on relaxation variables. Many studies used this method to evaluate green investment or green innovation efficiency [70]. This method can reveal the efficiency of green investment more accurately. The model used in this paper is expressed as follows:
ρ * = min 1 m i = 1 m x ¯ x i k 1 r 1 + r 2 × s = 1 r 1 y ¯ d / y s k d + q = 1 r 2 y ¯ u / y q k u x ¯ j = 1 , k n x i j λ j , i = 1 , 2 , , m y ¯ d j = 1 , k n y s j d λ j , s = 1 , 2 , , r 1 y ¯ u j = 1 , k n y q u λ j , q = 1 , 2 , , r 2 λ j 0 , j = 1 , 2 , , n x ¯ x i k , j = 1 , 2 , , m y ¯ d y s k d , s = 1 , 2 , , r 1 y ¯ u y q u , u = 1 , 2 , , r 2
where n denotes the number of decision units ( D M U s ); each D M U consists of m inputs, γ 1 desired outputs, and γ 2 non-desired outputs. The term λ denotes the weight of the corresponding input or output element, and ρ is the GIE value. When ρ < 1, the D M U is in an inefficient state; when ρ ≥ 1, the D M U is effective; and a larger value of ρ indicates higher efficiency. Efficiency scores were calculated using the Super-SBM model under variable returns to scale (VRS) in MaxDEA 5.2 (Beijing Realworld Software Company Ltd.).

3.3. Fixed Effects Model

The fixed effect model is a statistical method widely used in panel data analysis. The core advantage of the fixed effect model is that it can reduce the estimation bias and improve the accuracy and explanatory power of the model by controlling the individual and time fixed effects, and it is also suitable for complex data structures and various research scenarios. The model used to study the effect of GC on the GIE by corporations is expressed as follows:
G I E i , t = a 0 + a 1 G C i , t + a 2 S i z e i , t + a 3 R O E i , t + a 4 C a s h f l o w i , t + a 5 F i x e d i , t + a 6 I n d e p i , t + a 7 M f e e i , t + a 8 T o b i t Q i , t + δ t + μ i + ε i , t
where G I E i , t is the GIE of corporation i in year t ; G C i , t is the impact of corporation i’s exposure to GC in year t ; S i z e i , t is the size of corporation i in year t ; R O E i , t is the return on net assets of corporation i in year t ; C a s h f l o w i , t is the cash flow ratio of corporation i in year t ; F i x e d i , t is the percentage of fixed assets of corporation i in year t ; I n d e p i , t is the proportion of independent directors in company i in year t ; M f e e i , t is the overhead rate of company i in year t ; T o b in Q i , t is the TobinQ value of corporation i in year t ; δ and μ denote year and corporation impact, respectively; and a 0 8 denote the parameters to be estimated. The variables ε i , t are independently and identically distributed error terms. The variables in Model 1 are populated using corporate data ranging from 2016 to 2021 for China.
To analyze the relationship between GC and GIE based on heterogeneity, data for property rights, executive shareholding, financial regulation, and environmental regulation are added as dummy variables to the control variables. When state-owned enterprise (SOE) equals 1, it indicates that company I is a state-owned enterprise; when the value equals 0, it is a non-state-owned enterprise. When executive shareholding equals 1, it indicates that company I belongs to the high executive shareholding group; when the value equals 0, it belongs to the low executive shareholding group. When financial regulation equals 1, it indicates that Company I belongs to a high financial regulation area; when it equals 0, it indicates it belongs to a low financial regulation area. When environmental regulation equals 1, it indicates Company I belongs to a high environmental regulation area; when it equals 0, it belongs to a low environmental regulation area. Panel regressions were estimated using Stata 16.0 (StataCorp LP, College Station, TX).

3.4. Threshold Effect Model

The threshold effect model can capture the nonlinear relationship between variables, especially when this relationship suddenly changes at a certain critical value. It is widely used in nonlinear relationship analysis [57]. To study the nonlinear effect of GC on the GIE of enterprises, the model is as follows:
G I E i , t = b 0 + b 1 G C i , t · I ( L e v γ 1 ) + b 2 G C i , t · I ( L e v γ 1 ) + b 3 C o n t r o l i , t + ε i , t
G I E i , t = c 0 + c 1 G C i , t · I ( E G A γ 1 ) + c 2 G C i , t · I ( E G T γ 1 ) + c 3 C o n t r o l i , t + ε i , t
where G I E i , t is denoted as the GIE of corporation i in year t . The G C i , t is the impact of the GC level received by corporation i in year t . The term C o n t r o l i , t denotes control variables, including Size, ROE, Cashflow, Fixed, Indep, Mfee, and TobinQ. The L e v and E G T are threshold variables: gearing ratio and executive green thinking, respectively. The term I ( · ) is the indicator function, and γ is the threshold value to be measured. The terms b 1 , b 2 and c 1 , c 2 denote L e v and E G T at different ranges of values, respectively. The coefficients of the impact of the development level on the GIE of HP corporations differ. Threshold effects were tested using Stata 16.0 (StataCorp LP, College Station, TX).

3.5. Variable Descriptions and Data Sources

Table 1 shows the measured values and data sources for each variable. In this study, GI and labor input are input variables; net profit is the desired output; and particulate matter, sulfur dioxide, and nitrogen oxides emitted by the corporation are non-desired outputs. Together, these measure the corporation’s GIE. GC is a proxy variable for GC policy, using the share of GC closing balance as a part of total loans from listed banks. Based on previous studies [71,72], control variables include corporation size (Size), return on net assets (ROE), cash flow (Cashflow), fixed assets as a percentage of total assets (Fixed), percentage of independent directors (Indep), overhead rate (Mfee), and TobinQ. The asset-liability ratio (Lev) and executive green thinking (EGT) are used as threshold variables. Due to the lack of uniformity in the degree to which HP corporations disclose pollutants, and the lack of a complete pollutant emissions database, pollutant emission data from 2016 to 2021 were manually collected for 78 HP corporations.
The “Guidelines for the Classification of Listed Companies (2012 Revision)” lists 17 industries as being heavy polluters: coal mining and washing (B06); oil and gas mining (B07); mining and processing of ferrous metals (B08); mining and processing of non-ferrous metals (B09); mining and processing of non-metallic minerals (B10); manufacturing of wine, beverages, and refined tea (C15); textiles (C17); textiles and clothing (C18); leather, fur, and feathers and their products, and footwear (C19); paper and paper products (C22); petroleum processing, coking, and nuclear fuel processing (C25); chemical raw materials and chemical products manufacturing (C26); pharmaceutical manufacturing (C27); chemical fibers (C28); rubber and plastic products (C29); non-metallic mineral products (C30); ferrous metal smelting and rolling processing (C31); non-ferrous metal smelting and rolling processing (C32); and the electricity, heat production, and supply industry (D44) [73].
It is difficult to measure the non-expected output of corporate GIE, as it requires pollutant emission data for listed companies; data for most pollutants have only been disclosed by polluting companies since 2016. Therefore, this paper focuses on A-share listed companies in HP industries from 2016 to 2021. There are no uniform national regulations related to pollutant disclosure, leading to different pollutant emission data for different corporations. A screening process was done to review and categorize pollutant emission data from studied corporations; sulfur dioxide, nitrogen oxides, and particulate matter were finally identified as the measures for analysis. Annual observations for 468 companies were manually collected and screened from the studied corporations across HP industries.
Table 2 provides descriptive statistics of the variables. The standard deviations of GC, enterprise GIE, and gearing ratio were 0.118, 0.259, and 0.176, respectively. These results indicate that there are few differences between different corporations for these three variables. The standard deviation of green awareness, or thinking, by corporate executives was 7.156. This indicates there is a large gap in this type of awareness across executives across corporations. The correlation analysis and Variance Inflation Factor (VIF) test in Table 3 indicate that there was no serious multicollinearity between the variables.

4. Empirical Analysis and Results

4.1. Changing Patterns of Green Investment Efficiency

Figure 1 shows the changes in the GIE of HP corporations over the six-year study period. The corporations are categorized by industry. Overall, the efficiency of HP corporations was mostly at a low level of less than 0.5, with only the C15 industry having a slightly higher value. However, the efficiency of HP corporations shows an overall upward trend. This indicates that the continuous expansion of GC in China has improved the GIE of HP corporations.

4.2. Basic Results Analysis

Table 4 shows the impact of GC on corporate GIE. Columns (1) and (2) report the results of single-fixed and double-fixed models, respectively, excluding the control variables. Both were statistically significant at the 1% level. Column (3) shows the results of the single-fixed model, controlling only for corporations; column (4) shows the results of double-fixed model controlling for time and corporations. Both were also significant at the 1% level. The coefficient of GC in the double-fixed model was 0.577, indicating that the efficiency of corporations increased by 0.577 when GC increased by 1.
These results demonstrate that GC effectively increased the GIE of heavily polluting corporations, confirming H1. GC supports environment-friendly corporations. It also imposes financing restrictions on heavily polluting industries and incentivizes those corporations to conduct green transformation and upgrading. At the same time, GC changes the risk perception of HP corporations, prompting them to actively fulfill social responsibilities and take the initiative to improve their GIE. This finding is useful and interesting. On the one hand, there are some previous studies that mainly evaluated the GIE by using DEA or other efficiency evaluation methods. On the other hand, some studies analyzed the influencing factors of GIE, including industrial, human resource practices, provincial green economy, green enforcement governance, and green gold reform and the innovation pilot zone [44,45,46,47,48,49]. However, they have not focused on the role of GC. These results prove the existence of GC function.

4.3. Robustness Tests

(1) Endogeneity test
When studying corporate GIE, some indicators may be more difficult to quantify, making the selected variables less comprehensive. Further, the above regression results may have endogeneity problems. Therefore, this study set GC with a one-period lag as an instrumental variable [74,75] and estimated it using a two-stage least squares method. Table 5, Column (1) shows the results of the first-stage regression. The estimated coefficient of the instrumental variable (IV) was 1.260, which was significant at the 1% level. The F-statistic value was much larger than 10, indicating there was no weak instrumental variable problem. Table 5, Column (2) shows the results of the second stage regression. The estimated coefficient of GC was 0.551, which was significant at the 1% level. This further supports the finding that GC significantly improves the GIE in heavily polluting corporations. This further confirms the robustness of the above regression results.
(2) Hanging the explained variables
Table 6, Column (1) shows the robustness test when changing the explained variables. The input indicators for the measurement of GIE of enterprises were increased to three indicators, with the addition of capital investment, which was measured by the net fixed assets of enterprises. The regression coefficient of GC in the first column of the table remained significantly positive at the 1% level when the re-measured corporate GIE was brought into the fixed effects model. This demonstrates the robustness of the above regression results.
(3) Changing the explanatory variables
Table 6, Column (2) shows the robustness test when changing the explanatory variables. To replace the measured value of GC, the natural logarithm of the share of GC balances was replaced with the natural logarithm of the original share of GC balances. The re-measured GC values were then incorporated into the double fixed model. The regression coefficient of GC in the second column of the table remained significantly positive at the 1% level, upholding the robustness of the regression results.
(4) Quantile regression
Table 7 shows the average marginal effect of GC on the GIE of heavy polluters using quantile regression. Columns (1), (2), (3), and (4) present the estimates using the four quartiles of 0.1, 0.25, 0.5, and 0.75, respectively. The results show that the regression coefficients for each quartile differed, indicating that the extent to which GC enhanced the GIE of corporations varied according to the type of corporation. The effect of GC policy on improving the efficiency of different heavily polluting corporations was consistently significant and positive for all four quartiles. This further demonstrates that the regression results above were robust.

4.4. Heterogeneity Analysis

This section analyzes the heterogeneity of the results from both the internal control perspectives and external regulatory perspectives. This expands the existing studies because the existing studies seldom focused on how GC impacts the GIE in China’s heavy pollution industry from a systematic perspective [50,51,52,53,54,55,56]. In addition, this also provides some useful information about the changes of the results under multiple different perspectives. The relevant subject, government, and enterprise can obtain more beneficial enlightenment from it.

4.4.1. Internal Control Perspectives

(1) Enterprise ownership
Table 8, Columns (1) and (2) show the heterogeneity analysis for heavy polluters and non-heavy polluters, based on whether the corporation is state-owned or non-state-owned. The regression coefficient of the state-owned group was 0.579, and the coefficient for the non-state-owned group was 0.449; both results were significant at the 1% level. Therefore, the effect of GC on GIE improvement was more significant for state-owned corporations than non-state-owned. State-owned corporations must protect state and society needs and meet the state’s needs to regulate the economy. State-owned corporations are better able to implement national policies and actively fulfill environmental and social responsibilities than non-state-owned corporations. This makes them better able to actively implement the GC policy’s GI requirements.
(2) Corporate executive shareholding
Table 8, Columns (3) and (4) show the heterogeneity analysis based on the level of executive shareholding of each corporation. The median percentage of executive shareholding of HP companies was used as the boundary. The studied companies were divided into high and low executive shareholding groups, and the impact of GC on the GIE performance at different executive shareholding ratios was assessed. The regression coefficients were 0.551 for the high executive shareholding group and 0.723 for the low executive shareholding group. Both results were significant at the 1% level. As a result, GCs had a greater impact on improving GIE in firms with low executive ownership than in firms with high executive ownership.
This result may be explained as follows. Corporations have limited resources, and executives with higher levels of equity ownership are more inclined to pursue current benefits, reducing their environmental-related investments and lowering the effect of GC on the regulation of corporate GI. The inability of GIs to generate direct economic benefits, and the associated uncertain economic returns, leads executives with higher equity ownership to be more inclined to pursue conservative corporate strategies. They may avoid environmental governance responsibilities in their daily activities, weakening the policy guidance effect of GC.

4.4.2. External Regulatory Perspectives

(1) Financial regulation
Table 9, Columns (1) and (2) present the heterogeneity analysis based on the level of financial regulation. The financial regulation level in each province was ranked, with heavy polluters grouped into high and low financial regulation groups based on the average values of the indicators. The regression coefficient was 0.574 for the high financial regulation group, and the coefficient was 0.586 for the low financial regulation group; both of these results were significant at the 1% level. GC had a larger effect on GIE improvement for the high financial regulation group compared to the low financial regulation group.
This result may be due to the fact that financial regulation has a positive role in maintaining the stability of financial markets and promoting development by providing a stable source of funding. Thus, corporations facing high financial regulation may have access to more stable external financing, making the positive impact of GC less prominent. Financial regulation also increases risk-taking capacity, lowering the incentive effect of GC on GI by heavy polluters.
(2) Environmental regulation
Table 9, Columns (3) and (4) show the heterogeneity analysis based on the level of environmental regulation. Each province was ranked using regulation index values, and the heavy polluters were divided into high and low environmental regulation groups. The regression coefficient of the high environmental regulation group was 0.519, and the coefficient of the low environmental regulation group was 0.574; both results were significant at the 1% level. Therefore, GC had a more significant effect on GIE improvement in the low environmental regulation group compared to the high environmental regulation group.
This result may be explained as follows. Given reasonably intense environmental regulation, corporations undertake green transformation activities. However, the low-carbon transformation of HP corporations requires significant financial support, with a long and uncertain low-carbon R&D cycle. GC increases the financing constraints of HP corporations; as such, the risk is that when the pressure from environmental regulation is too extreme, HP corporations may be more willing to pursue lower-impact short-term improvement measures, or even adopt non-compliant practices, to treat pollution. This may weaken the impact of GC policy guidance on GIE of HP corporations.

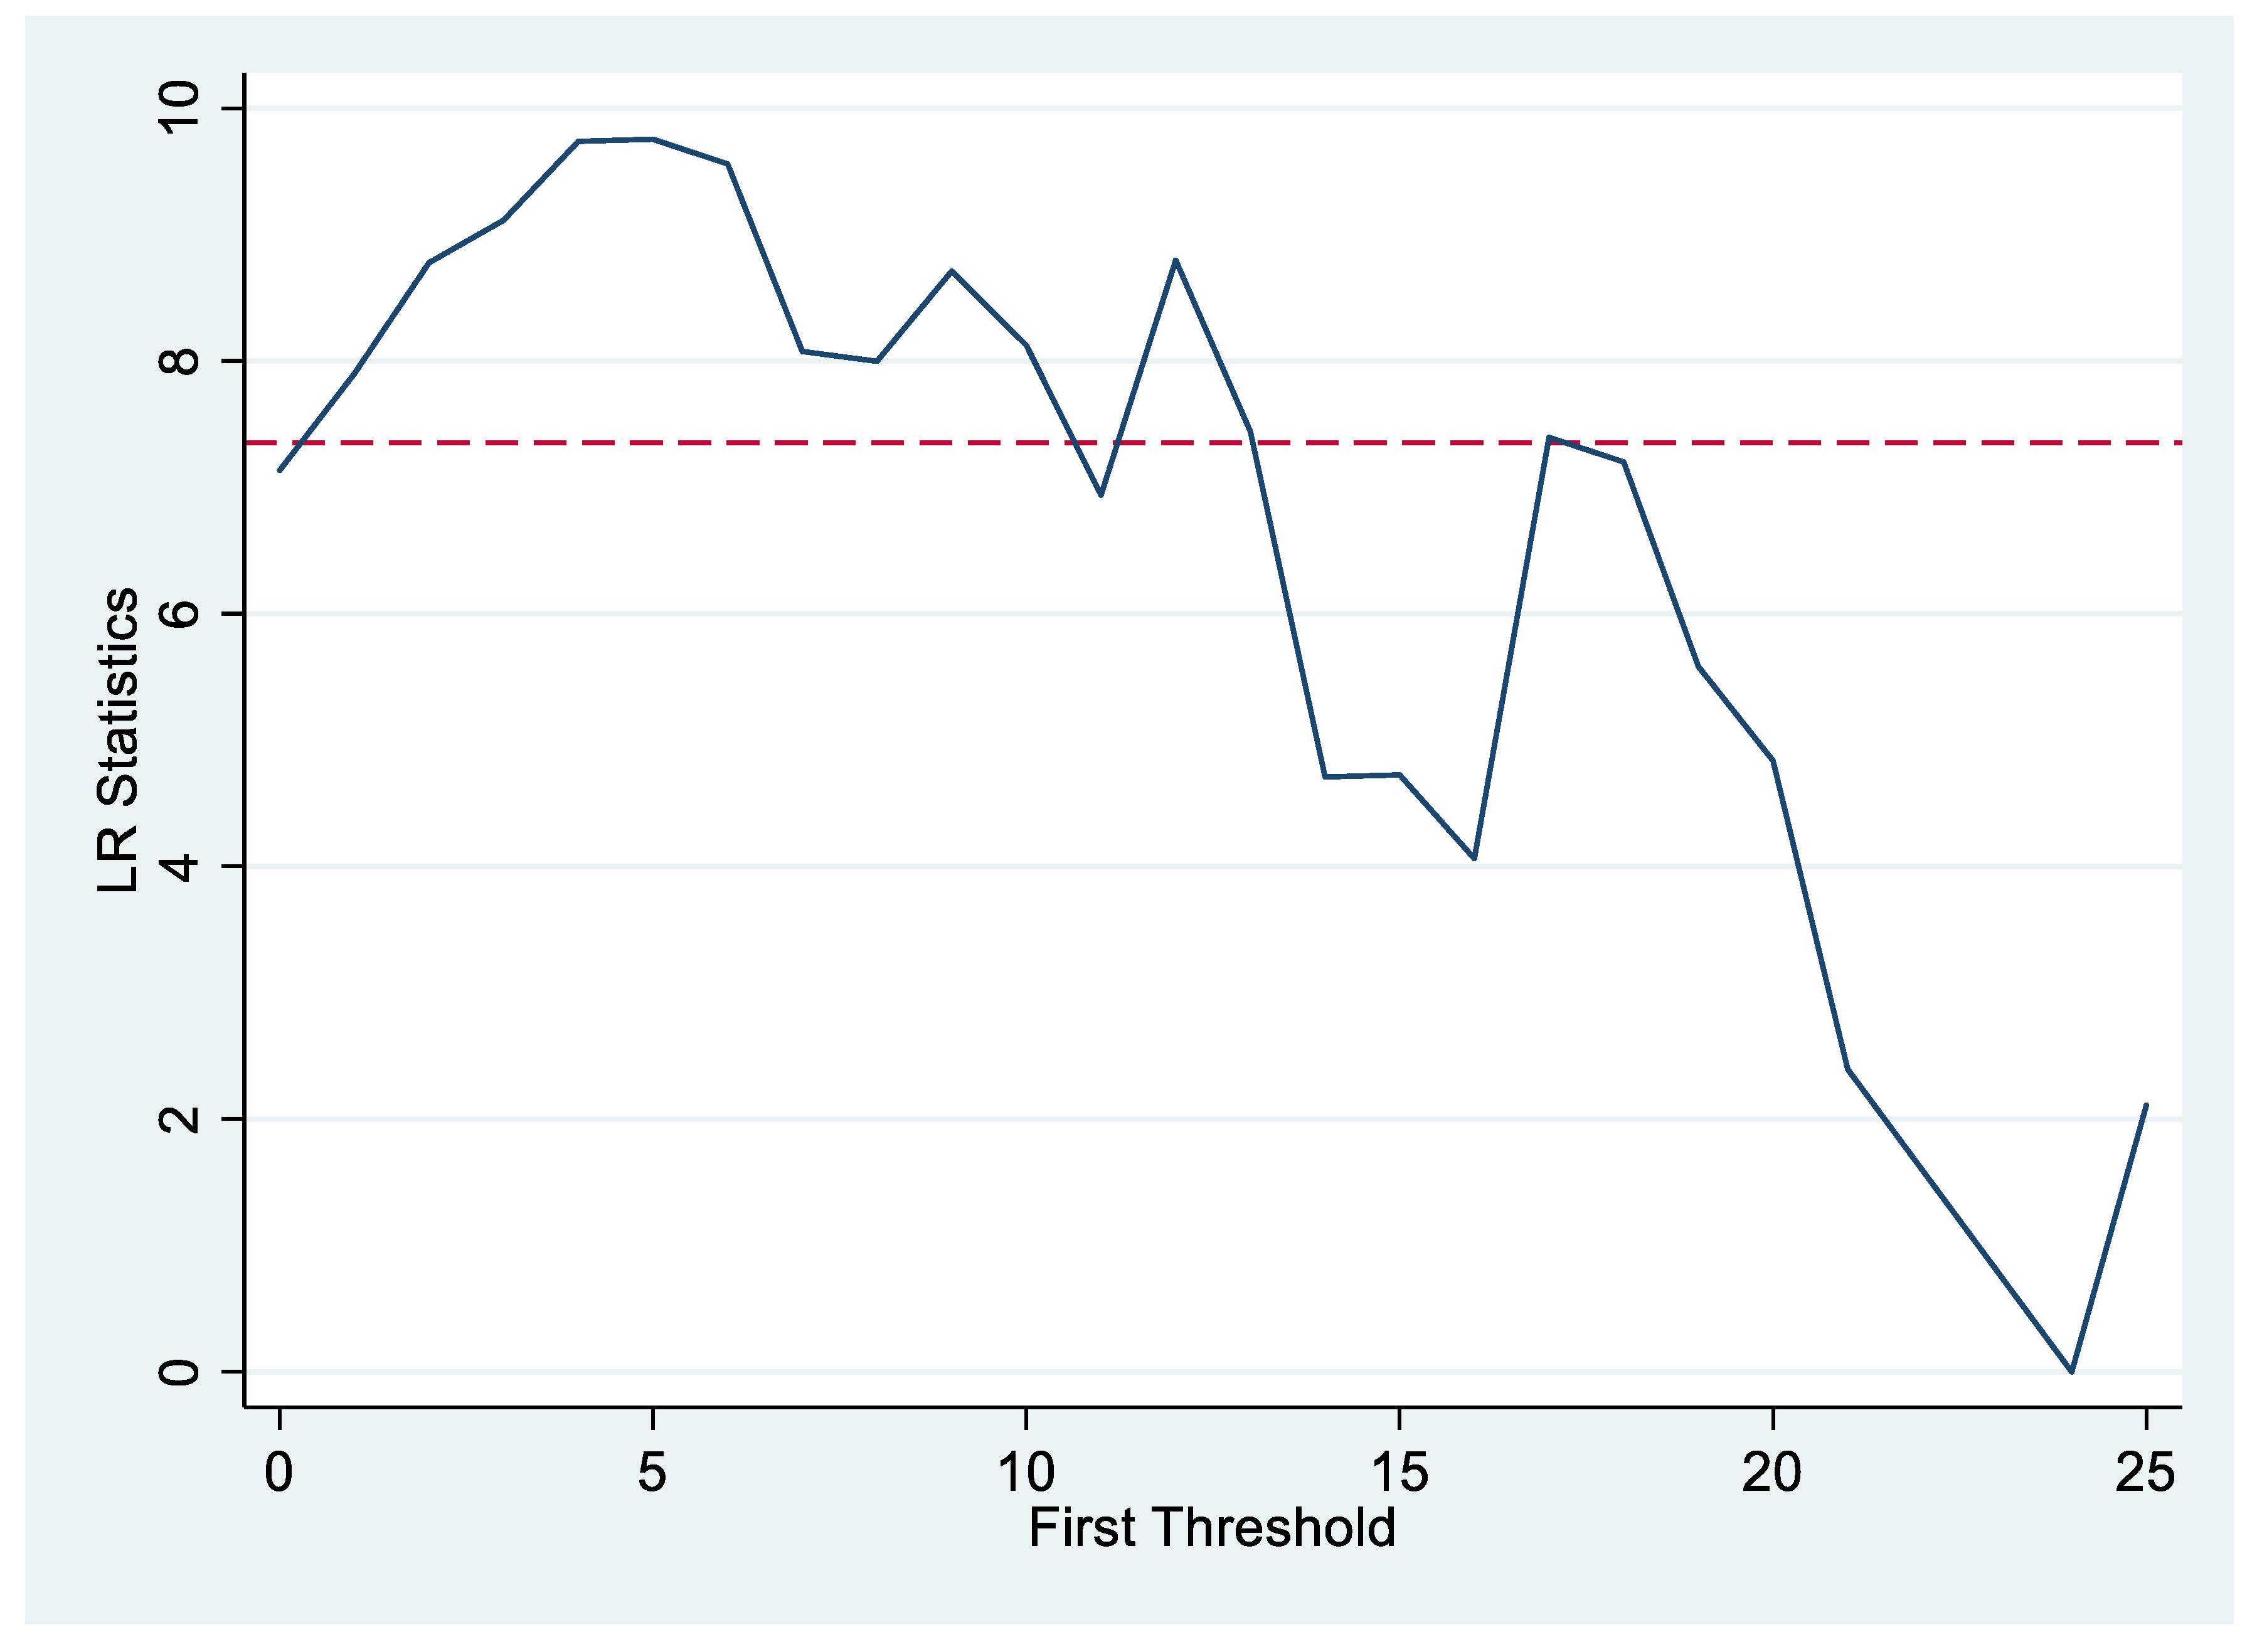
4.5. Further Analysis

The threshold regression model was used to empirically assess whether there is a significant threshold value between asset–liability ratio and executive green thinking. The goal is to judge whether these factors have significant differences at different levels with respect to the impact of GC on corporate GIE. This tests Hypotheses 2 and 3. The asset-liability ratio and executive green thinking were used as threshold variables, and single and double threshold effects were tested using self-sampling tests of the threshold effects. The p-values obtained using the F-statistic and Bootstrap method show that there was a single threshold for both asset–liability ratio and executive green thinking, at 0.2948 and 24.0000 units, respectively; no double threshold existed. Previous studies have proved that there may be a nonlinear relationship between GC and investment behavior. For example, He et al. [57] showed that GC had a non-linear relationship on how renewable energy investment impacts the green economic development index, with a double threshold effect. This study also conducted non-linear analyses on the relationship between GC and GIE by using asset–liability ratio and executive green thinking as threshold variables, respectively. Thus, this analysis has important theoretical significance, which expands the boundaries of existing research on the relationship between GC and GIE. Table 10 shows the self-sampling test results for the threshold effect. Table 11 provides the single threshold estimates and confidence intervals.
Table 12 shows the results of the single-threshold model. Column (1) shows the regression results using the asset–liability ratio as the threshold variable. When the asset–liability ratio exceeded the threshold value of 0.2948, it increased the promoting influence of GC on GIE; when the ratio was lower than that threshold, the opposite was true. This indicates a higher level of assets and liabilities may make corporations more positively respond to GC policy guidance and actively improve their corporate green image to obtain loans. This makes the GC’s promoting influence on GIE greater compared to when the asset and liability level is low.
Column (2) shows the regression results with executive green thinking as the threshold variable. When executive green thinking exceeded the threshold value of 24.0000, the promoting influence of GC on GIE weakened, and the coefficient decreased from 0.371 to 0.299. This means that when executive green thinking reaches a certain level, it lowers the effects of GC on the efficiency of corporate GI. This may be because when the thinking reaches this level, corporations are already actively engaged in environmental investment activities and internal pollution control activities. This embedded thinking weakens the incremental policy effect of GC on GIE in these corporations.
To more clearly show the estimation of the threshold value and the process of constructing the confidence interval, Figure 2 and Figure 3 show the plot of the likelihood ratio function of the above two variables as the threshold variable. The likelihood ratio (LR) statistic value was less than the critical value at the 5% significance level. This means it fell within the hypothesis acceptance domain: the threshold value of threshold regression was equal to the actual threshold value. This result was in accordance with the results of the previous significance test.

5. Conclusion and Policy Implications

5.1. Conslusions

This paper analyzed the impact of GC on the GIE of corporations, using data for 78 Chinese HP listed corporations from 2016 to 2021. This study combined the double-fixed model and the threshold regression model to first test the impact of GC on the efficiency using the double-fixed model. Based on this, this study then evaluated the heterogeneous effects of corporate property rights, corporate executive shareholding, financial regulation, and environmental regulations. The paper further explored the presence of nonlinear effects of GC on the GIE of HP corporations under the influence of corporate indebtedness and corporate executive green thinking.
This study showed that the overall GIE of HP corporations was low, at a value mostly less than 0.5. GC significantly improved the GIE of HP corporations. With respect to enterprise internal control, GC significantly improved the GIE of corporations that were state-owned or have low executive shareholding. With respect to external regulation, GC significantly improved GIE in areas with low financial and environmental regulation. The impact of GC was influenced by enterprise indebtedness and executive green thinking; these had non-linear, single-threshold effects on GIE.

5.2. Policy Implications

The findings of this study highlight the following policy recommendations. First, GC implementation should be regulated and guaranteed. GC policy emerged late in China compared to other economies, when banks evaluate corporations for GC approval. Appropriate credit incentives should be given to heavily polluting enterprises that are actively engaged in environmental protection management. In contrast, credit constraints are needed with heavily polluting enterprises that continue to seriously pollute, in order to improve their GIE. Furthermore, the government should improve the development level of GC by improving green financial standards, strengthening supervision and evaluation, setting up GC funds, and strengthening international cooperation.
Second, targeted policies should be formulated based on enterprise heterogeneity. This includes adjusting the implementation criteria of GC; implementing differentiated management of the credit; and increasing the policy influence of GC on non-state and high executive shareholding heavy polluters, in order to promote green transformation. GC should be coordinated with financial and environmental regulation policies and tailored to local conditions. This way, heavily polluting corporations can actively engage in green transformation while ensuring the integrity of their capital chains to maintain corporate vitality; a moderate policy mix should amplify the policy effects of GC.
Third, corporations should maintain a moderate gearing ratio and continuously improve green thinking among corporate executives. Corporations should rationally allocate their debt structure; avoid over-relying on a particular financing method or asset; establish long-term debt service plans and risk management mechanisms to reduce debt risks; strengthen debt information disclosure to enhance corporate transparency and credibility; and introduce capital operations to balance financing and development. To actively promote their image related to corporate environmental protection, corporations should internally regulate excessive and risky investments, as well as address financing dynamics in a timely manner. Corporations obtaining GC need to demonstrate a certain level of environmental awareness and environmental practices. If heavy polluters can achieve substantial environmental benefits in practice, it may justifiably enhance their social image and brand value.

5.3. Limitations

This study analyzed the influence of GC on the efficiency of corporate GI, and much remains to be done. Due to the late start of GC, this paper did not conduct a comparative study before and after the implementation of the policy. This resulted in the limited practical significance of this study. In addition, the disclosure of pollutant emission data by heavily polluting enterprises suffers from the problems of little disclosure and non-uniform disclosure of pollutants, and the conclusions of the study are relatively limited. Thus, we have not conducted a detailed analysis on the impact path and mechanism. In the future, we suggest exploring the impact mechanism of GC on the GIE of enterprise and conduct mediation effect research based on more detailed and reliable data.

Author Contributions

Conceptualization, L.L.; methodology, Y.L.; software, Y.L.; validation L.L.; formal analysis, Y.L.; investigation, L.L.; resources, L.L.; data curation, Y.L.; writing—original draft preparation, Y.L.; writing—review and editing, L.L.; visualization, Y.L.; supervision, L.L. and M.Z.; project administration L.L. and J.H.; funding acquisition, L.L. and X.Z. All authors have read and agreed to the published version of the manuscript.

Funding

The authors gratefully acknowledge the financial support provided by the National Natural Science Foundation of China (72303123), the Humanities and Social Sciences Project of Shandong Provincial Federation of Social Sciences (2023-zkzd-048) and the research project on the evaluation system of the innovation ability of key laboratories and the path of national strategic scientific and technological strength construction (2022DQ0107-21).

Institutional Review Board Statement

Not applicable.

Informed Consent Statement

Not applicable.

Data Availability Statement

The data in this paper come from annual reports and corporate social responsibility reports, the CSMAR database, the Resset database, bank annual reports and corporate social responsibility reports, and the National Bureau of Statistics of China.

Conflicts of Interest

The authors declare no conflicts of interest.

References

  1. Zhang, B.; Yang, Y.; Bi, J. Tracking the implementation of green credit policy in China: Top-down perspective and bottom-up reform. J. Environ. Manag. 2011, 92, 1321–1327. [Google Scholar] [CrossRef] [PubMed]
  2. Su, X.; Pan, C.; Zhou, S.; Zhong, X. Threshold effect of green credit on firms’ green technology innovation: Is environmental information disclosure important? J. Clean. Prod. 2022, 380, 134945. [Google Scholar] [CrossRef]
  3. Lin, B.; Pan, T. Financing decision of heavy pollution enterprises under green credit policy: Based on the perspective of signal transmission and supply chain transmission. J. Clean. Prod. 2023, 412, 137454. [Google Scholar] [CrossRef]
  4. Liu, H.; Liu, Z.; Zhang, C.; Li, T. Transformational insurance and green credit incentive policies as financial mechanisms for green energy transitions and low-carbon economic development. Energy Econ. 2023, 126, 107016. [Google Scholar] [CrossRef]
  5. Su, D.; Lian, L. Does Green Credit Policy Affect Corporate Financing and Investment? Evidence from Publicly Listed Firms in Pollution-Intensive Industries. J. Financ. Res. 2018, 462, 123–137. [Google Scholar]
  6. Cutillas Gomariz, M.F.; Sánchez Ballesta, J.P. Financial reporting quality, debt maturity and investment efficiency. J. Bank. Financ. 2014, 40, 494–506. [Google Scholar] [CrossRef]
  7. Hao, F.; Xie, Y.; Liu, X.; Sarkar, B. The impact of green credit guidelines on the technological innovation of heavily polluting enterprises: A Quasi-Natural experiment from China. Math. Probl. Eng. 2020, 2020, 8670368. [Google Scholar] [CrossRef]
  8. Su, T.; Meng, L.; Wang, K.; Wu, J. The role of green credit in carbon neutrality: Evidence from the breakthrough technological innovation of renewable energy firms. Environ. Impact Assess. Rev. 2023, 101, 107135. [Google Scholar] [CrossRef]
  9. Li, G.; Wang, P.; Pal, R. Measuring sustainable technology R&D innovation in China: A unified approach using DEA-SBM and projection analysis. Expert Syst. Appl. 2022, 209, 118393. [Google Scholar]
  10. Zhang, J.; Luo, Y.; Ding, X. Can green credit policy improve the overseas investment efficiency of enterprises in China? J. Clean. Prod. 2022, 340, 130785. [Google Scholar] [CrossRef]
  11. Li, L.; Qiu, L.; Xu, F.; Zheng, X. The impact of green credit on firms’ green investment efficiency: Evidence from China. Pac.-Basin Financ. J. 2023, 79, 101995. [Google Scholar] [CrossRef]
  12. Zhang, Y.J.; Shi, W. Has China’s carbon emissions trading (CET) policy improved green investment in carbon-intensive enterprises? Comput. Ind. Eng. 2023, 180, 109240. [Google Scholar] [CrossRef]
  13. Hassan, S.T.; Batool, B.; Sadiq, M.; Zhu, B. How do green energy investment, economic policy uncertainty, and natural resources affect greenhouse gas emissions? A Markov-switching equilibrium approach. Environ. Impact Assess. Rev. 2022, 97, 106887. [Google Scholar] [CrossRef]
  14. Wang, Q.; Fan, Z. Green finance and investment behavior of renewable energy enterprises: A case study of China. Int. Rev. Financ. Anal. 2023, 87, 102564. [Google Scholar] [CrossRef]
  15. Wang, B.; Zhao, W. Interplay of renewable energy investment efficiency, shareholder control and green financial development in China. Renew. Energy 2022, 199, 192–203. [Google Scholar] [CrossRef]
  16. Guo, K.; Cao, Y.; He, S.; Li, Z. Evaluating the efficiency of green economic production and environmental pollution control in China. Environ. Impact Assess. Rev. 2024, 104, 107294. [Google Scholar] [CrossRef]
  17. Lian, Y.; Gao, J.; Ye, T. How does green credit affect the financial performance of commercial banks? —Evidence from China. J. Clean. Prod. 2022, 344, 131069. [Google Scholar] [CrossRef]
  18. Luo, S.; Yu, S.; Zhou, G. Does green credit improve the core competence of commercial banks? Based on quasi-natural experiments in China. Energy Econ. 2021, 100, 105335. [Google Scholar] [CrossRef]
  19. Zhang, A.; Deng, R.; Wu, Y. Does the green credit policy reduce the carbon emission intensity of heavily polluting industries? -Evidence from China’s industrial sectors. J. Environ. Manag. 2022, 311, 114815. [Google Scholar] [CrossRef]
  20. Zhou, D.; Qiu, Y.; Wang, M. Does environmental regulation promote enterprise profitability? Evidence from the implementation of China’s newly revised Environmental Protection Law. Econ. Model. 2021, 102, 105585. [Google Scholar] [CrossRef]
  21. Yin, W.; Zhu, Z.; Kirkulak-Uludag, B.; Zhu, Y. The determinants of green credit and its impact on the performance of Chinese banks. J. Clean. Prod. 2021, 286, 124991. [Google Scholar] [CrossRef]
  22. Cilliers, E.J.; Diemont, E.; Stobbelaar, D.J.; Timmermans, W. Sustainable green urban planning: The green credit tool. J. Place Manag. Dev. 2010, 3, 57–66. [Google Scholar] [CrossRef]
  23. Guo, P. Financial policy innovation for social change: A case study of China’s green credit policy. Int. Rev. Sociol. 2014, 24, 69–76. [Google Scholar] [CrossRef]
  24. Wu, S.; Zhou, X.; Zhu, Q. Green credit and enterprise environmental and economic performance: The mediating role of eco-innovation. J. Clean. Prod. 2023, 382, 135248. [Google Scholar] [CrossRef]
  25. Zhou, C.; Sun, Z.; Qi, S.; Li, Y.; Gao, H. Green credit guideline and enterprise export green-sophistication. J. Environ. Manag. 2023, 336, 117648. [Google Scholar] [CrossRef] [PubMed]
  26. Zhang, D.; Kong, Q. Renewable energy policy, green investment, and sustainability of energy firms. Renew. Energy 2022, 192, 118–133. [Google Scholar] [CrossRef]
  27. Zhang, M.; Zhang, X.; Song, Y.; Zhu, J. Exploring the impact of green credit policies on corporate financing costs based on the data of Chinese A-share listed companies from 2008 to 2019. J. Clean. Prod. 2022, 375, 134012. [Google Scholar] [CrossRef]
  28. Lu, Y.; Gao, Y.; Zhang, Y.; Wang, J. Can the green finance policy force the green transformation of high-polluting enterprises? A quasi-natural experiment based on “Green Credit Guidelines”. Energy Econ. 2022, 114, 106265. [Google Scholar] [CrossRef]
  29. Wen, H.; Lee, C.-C.; Zhou, F. Green credit policy, credit allocation efficiency and upgrade of energy-intensive enterprises. Energy Econ. 2021, 94, 105099. [Google Scholar] [CrossRef]
  30. Wu, S.; Wu, L.; Zhao, X. Impact of the green credit policy on external financing, economic growth and energy consumption of the manufacturing industry. Chin. J. Popul. Resour. Environ. 2022, 20, 59–68. [Google Scholar] [CrossRef]
  31. Xu, X.; Li, J. Asymmetric impacts of the policy and development of green credit on the debt financing cost and maturity of different types of enterprises in China. J. Clean. Prod. 2020, 264, 121574. [Google Scholar] [CrossRef]
  32. Zhao, J.; Huang, J.; Liu, F. Green credit policy and investment-cash flow sensitivity: Evidence from a quasi-natural experiment. Financ. Res. Lett. 2023, 52, 103502. [Google Scholar] [CrossRef]
  33. Zhang, Y.; Li, X.; Xing, C. How does China’s green credit policy affect the green innovation of high polluting enterprises? The perspective of radical and incremental innovations. J. Clean. Prod. 2022, 336, 130387. [Google Scholar] [CrossRef]
  34. Lin, B.Q.; Pan, T. The impact of green credit on green transformation of heavily polluting enterprises: Reverse forcing or forward pushing? Energy Policy 2024, 184, 113901. [Google Scholar] [CrossRef]
  35. Huang, X.B.; Xie, J.W. Impact of green credit policies on the global value chain position of heavy polluting enterprises. Energy Policy 2024, 192, 114269. [Google Scholar] [CrossRef]
  36. Eyraud, L.; Clements, B.; Wane, A. Green investment: Trends and determinants. Energy Policy 2013, 60, 852–865. [Google Scholar] [CrossRef]
  37. Mielke, J.; Steudle, G.A. Green Investment and Coordination Failure: An Investors’ Perspective. Ecol. Econ. 2018, 150, 88–95. [Google Scholar] [CrossRef]
  38. Wang, W.; Wang, X. Does provincial green governance promote enterprise green investment? Based on the perspective of government vertical management. J. Clean. Prod. 2023, 396, 136519. [Google Scholar] [CrossRef]
  39. Chang, Y.-T.; Zhang, N.; Danao, D.; Zhang, N. Environmental efficiency analysis of transportation system in China: A non-radial DEA approach. Energy Policy 2013, 58, 277–283. [Google Scholar] [CrossRef]
  40. Burnett, R.D.; Hansen, D.R. Ecoefficiency: Defining a role for environmental cost management. Account. Organ. Soc. 2008, 33, 551–581. [Google Scholar] [CrossRef]
  41. Pan, K.; He, F. Does Public Environmental Attention Improve Green Investment Efficiency?—Based on the Perspective of Environmental Regulation and Environmental Responsibility. Sustainability 2022, 14, 12861. [Google Scholar] [CrossRef]
  42. Chang, K.; Wan, Q.; Lou, Q.; Chen, Y.; Wang, W. Green fiscal policy and firms’ investment efficiency: New insights into firm-level panel data from the renewable energy industry in China. Renew. Energy 2020, 151, 589–597. [Google Scholar] [CrossRef]
  43. Hu, S.; Wang, A.; Du, K.; Si, L. Can China railway express improve environmental efficiency? Evidence from China’s cities. Environ. Impact Assess. Rev. 2023, 99, 107005. [Google Scholar] [CrossRef]
  44. Fan, Q.; Liu, J.; Zhang, T.; Liu, H. An evaluation of the efficiency of China’s green investment in the “Belt and Road” countries. Struct. Change Econ. Dyn. 2022, 60, 496–511. [Google Scholar] [CrossRef]
  45. Huang, L.; Lei, Z. How environmental regulation affect corporate green investment: Evidence from China. J. Clean. Prod. 2021, 279, 123560. [Google Scholar] [CrossRef]
  46. Hu, Y.; Bai, W.; Farrukh, M.; Koo, C.K. How does environmental policy uncertainty influence corporate green investments? Technol. Forecast. Soc. Change 2023, 189, 122330. [Google Scholar] [CrossRef]
  47. Anagnostopoulou, S.C.; Avgoustaki, A. The impact of human resource practices on corporate investment efficiency. Int. Rev. Financ. Anal. 2023, 87, 102609. [Google Scholar] [CrossRef]
  48. Yan, C.; Mao, Z.; Ho, K.-C. Effect of green financial reform and innovation pilot zones on corporate investment efficiency. Energy Econ. 2022, 113, 106185. [Google Scholar] [CrossRef]
  49. Tian, J.F.; Sun, S.Y.; Cao, W.; Bu, D.; Xue, R. Make every dollar count: The impact of green credit regulation on corporate green investment efficiency. Energy Econ. 2024, 130, 107307. [Google Scholar] [CrossRef]
  50. Chai, S.; Zhang, K.; Wei, W.; Ma, W.; Abedin, M.Z. The impact of green credit policy on enterprises’ financing behavior: Evidence from Chinese heavily-polluting listed companies. J. Clean. Prod. 2022, 363, 132458. [Google Scholar] [CrossRef]
  51. Liu, X.; Wang, E.; Cai, D. Green credit policy, property rights and debt financing: Quasi-natural experimental evidence from China. Financ. Res. Lett. 2019, 29, 129–135. [Google Scholar] [CrossRef]
  52. Li, W.; Cui, G.; Zheng, M. Does green credit policy affect corporate debt financing? Evidence from China. Environ. Sci. Pollut. Res. 2022, 29, 5162–5171. [Google Scholar] [CrossRef]
  53. Khan, M.K.; He, Y.; Akram, U.; Sarwar, S. Financing and monitoring in an emerging economy: Can investment efficiency be increased? China Econ. Rev. 2017, 45, 62–77. [Google Scholar] [CrossRef]
  54. Naeem, K.; Li, M.C. Corporate investment efficiency: The role of financial development in firms with financing constraints and agency issues in OECD non-financial firms. Int. Rev. Financ. Anal. 2019, 62, 53–68. [Google Scholar] [CrossRef]
  55. Feng, X.; Li, Y.; Huang, B. Research on manufacturer’s investment strategy and green credit policy for new energy vehicles based on consumers’ preferences and technology adoption. Technol. Forecast. Soc. Change 2023, 191, 122476. [Google Scholar] [CrossRef]
  56. Li, Z.; Liao, G.; Wang, Z.; Huang, Z. Green loan and subsidy for promoting clean production innovation. J. Clean. Prod. 2018, 187, 421–431. [Google Scholar] [CrossRef]
  57. He, L.; Zhang, L.; Zhong, Z.; Wang, D.; Wang, F. Green credit, renewable energy investment and green economy development: Empirical analysis based on 150 listed companies of China. J. Clean. Prod. 2019, 208, 363–372. [Google Scholar] [CrossRef]
  58. Zhao, X.; Ramzi, B.; Mohammad, Z.A.; Zhou, S.L. The charm of green finance: Can green finance reduce corporate carbon emissions? Energy Econ. 2024, 134, 107574. [Google Scholar] [CrossRef]
  59. Peng, B.; Yan, W.; Elahi, E.; Wan, A. Does the green credit policy affect the scale of corporate debt financing? Evidence from listed companies in heavy pollution industries in China. Environ. Sci. Pollut. Res. 2022, 29, 755–767. [Google Scholar] [CrossRef]
  60. Zhang, K.; Li, Y.; Qi, Y.; Shao, S. Can green credit policy improve environmental quality? Evidence from China. J. Environ. Manag. 2021, 298, 113445. [Google Scholar] [CrossRef]
  61. Hu, G.; Wang, X.; Wang, Y. Can the green credit policy stimulate green innovation in heavily polluting enterprises? Evidence from a quasi-natural experiment in China. Energy Econ. 2021, 98, 105134. [Google Scholar] [CrossRef]
  62. Lv, C.; Fan, J.; Lee, C.-C. Can green credit policies improve corporate green production efficiency? J. Clean. Prod. 2023, 397, 136573. [Google Scholar] [CrossRef]
  63. Gebauer, S.; Setzer, R.; Westphal, A. Corporate debt and investment: A firm-level analysis for stressed euro area countries. J. Int. Money Financ. 2018, 86, 112–130. [Google Scholar] [CrossRef]
  64. Grossman, S.J.; Hart, O.D. Corporate Financial Structure and Managerial Incentives. In The Economics of Information and Uncertainty; National Bureau of Economic Research: Cambridge, MA, USA, 1983; pp. 107–140. [Google Scholar]
  65. Myers, S.C. Determinants of corporate borrowing. J. Financ. Econ. 1977, 5, 147–175. [Google Scholar] [CrossRef]
  66. Wiredu, G.O.; Boateng, K.A.; Effah, J.K. The platform executive: Technology shaping of executive cognition during digital service innovation. Inf. Manag. 2021, 58, 103469. [Google Scholar] [CrossRef]
  67. Jiang, Y.; Hu, Y.; Asante, D.; Mintah Ampaw, E.; Asante, B. The Effects of Executives’ low-carbon cognition on corporate low-carbon performance: A study of managerial discretion in China. J. Clean. Prod. 2022, 357, 132015. [Google Scholar] [CrossRef]
  68. Zhou, Z.; Nie, L.; Ji, H.; Zeng, H.; Chen, X. Does a firm’s low-carbon awareness promote low-carbon behaviors? Empirical evidence from China. J. Clean. Prod. 2020, 244, 118903. [Google Scholar] [CrossRef]
  69. Tone, K. A slacks-based measure of efficiency in data envelopment analysis. Eur. J. Oper. Res. 2001, 130, 498–509. [Google Scholar] [CrossRef]
  70. Lv, Y.; Xie, Y.X.; Lou, X.J. Spatial-temporal transition and convergence trend of regional green innovation efficiency in China. J. Quant. Tech. Econ. 2020, 5, 78–97. [Google Scholar]
  71. Hsu, P.-H.; Tian, X.; Xu, Y. Financial development and innovation: Cross-country evidence. J. Financ. Econ. 2014, 112, 116–135. [Google Scholar] [CrossRef]
  72. Li, S.; Wang, Q. Green finance policy and digital transformation of heavily polluting firms: Evidence from China. Financ. Res. Lett. 2023, 55, 103876. [Google Scholar] [CrossRef]
  73. Zhou, G.; Sun, Y.; Luo, S.; Liao, J. Corporate social responsibility and bank financial performance in China: The moderating role of green credit. Energy Econ. 2021, 97, 105190. [Google Scholar] [CrossRef]
  74. Su, C.-W.; Li, W.; Umar, M.; Lobonţ, O.-R. Can green credit reduce the emissions of pollutants? Econ. Anal. Policy 2022, 74, 205–219. [Google Scholar] [CrossRef]
  75. Niu, H.; Zhao, X.; Luo, Z.; Gong, Y.; Zhang, X. Green credit and enterprise green operation: Based on the perspective of enterprise green transformation. Front. Psychol. 2022, 13, 1041798. [Google Scholar] [CrossRef]
Figure 1. Corporate GIE, 2016–2021.
Sustainability 17 03712 g001
Figure 2. Lev Threshold parameters.
Sustainability 17 03712 g002
Figure 3. EGT Threshold parameters.
Sustainability 17 03712 g003
Table 1. Definitions of variables.
VariablesAcronymOperationalizationSources
Green investmentGIEnvironmental, green-related investmentsAnnual report and corporate
social
responsibility reports
Labor inputLINumber of employees in the companyCSMAR database, Resset database
Capital investmentGIEnterprise fixed assets valueCSMAR database, Resset database
Net profitNPNet profitCSMAR database, Resset database
Particulate matterPMParticulate matter emissions of corporationsAnnual report and corporate social responsibility reports
Sulfur dioxideSO2Sulfur dioxide emissions of corporationsAnnual report and corporate social responsibility reports
Nitrogen oxideNONitric oxide emissions of corporationsAnnual report and corporate social responsibility reports
Green investment efficiencyGIEEfficiency calculated from the measurement model on the super-SBM model
Green creditGCLn(GC Balance/Total loans at the end of the period)CSMAR database, Bank Annual Reports and corporate social esponsibility reports
Corporation sizeSizelog(total assets)CSMAR database, Resset database
Return on net assetsROENet Profit/Average balance of shareholders’ equityCSMAR database, Resset database
Cash flowCashflowNet cash flows from operating activities/total assetsCSMAR database, Resset database
Fixed assets as a percentageFixedNet fixed assets/total assetsCSMAR database, Resset database
Percentage of independent directorsIndepIndependent Directors/Number of DirectorsCSMAR database, Resset database
Overhead rateMfeeOverhead/Operating incomeCSMAR database, Resset database
TobinQTobinQ(Market value of shares outstanding + Number of non-marketable shares × Net assets per share + Carrying value of liabilities)/total assetsCSMAR database, Resset database
Political
connection
SOEDummy variable: 1 if it is a state-owned enterprise, 0 if otherwiseCSMAR database, Resset database
Financial supervisionFSDummy variable: 1 if it is a Strong financial supervision, 0 if otherwiseNational Bureau
of Statistics of China
Executive shareholdingESDummy variable: 1 if it is a High Executive Shareholding, 0 if otherwiseCSMAR database, Resset database
Environmental regulationERDummy variable: 1 if it is a Strong environmental regulation, 0 if otherwiseNational Bureau
of Statistics of China
Asset–liability ratioLevTotal liabilities at year-end/Total assets at year-endCSMAR database, Resset database
Executive green thinkingEGTEnvironment-related word frequency statisticsAnnual report
Table 2. Descriptive statistics.
VariableObsMeanStd. Dev.MinMax
GI4682.709 × 10⁸1.241 × 10⁹18,4062.276 × 10¹⁰
LI4687932824035270,829
NP4681.879 × 10⁹5.468 × 10⁹−3.418 × 10⁹5.572 × 10¹⁰
PM468654.919470.0040015,004
SO2468119129310.17421,500
NO468225657035.83068,803
GIE4680.3140.2590.001761.869
GC468−2.6873890.1179233−2.797537−2.445186
Size46823.341.29420.3926.43
ROE4680.08780.129−0.8190.406
Cashflow4680.07610.0608−0.1520.257
Fixed4680.3930.1440.04140.711
Indep4680.3620.04740.3000.571
Mfee4680.05300.03280.006950.195
SOE4680.5300.50001
FR4680.4870.50001
ES4680.5020.50101
ER4680.5260.50001
Lev4680.4650.1760.07900.906
EGT4687.1947.156048
Table 3. Correlation analysis and VIF test.
GIEGCSizeROECashflowFIXEDIndepMfeeTobinQ
GIE1
GC0.207 ***1
Size0.03000.128 ***1
ROE0.102 **0.05100.184 ***1
Cashflow0.256 ***0.081 *0.152 ***0.478 ***1
Fixed−0.304 ***−0.093 **0.089 *−0.163 ***−0.03401
Indep0.113 **0.0560−0.005000.04400.163 ***−0.04501
Mfee0.0210−0.176 ***−0.463 ***−0.101 **−0.083 *−0.166 ***0.06101
TobinQ0.349 ***0.00100−0.082 *0.246 ***0.316 ***−0.339 ***0.264 ***0.238 ***1
VIF 1.061.32 1.381.431.191.091.391.42
*, **, and *** represent significant at 10%, 5%, and 1%, respectively.
Table 4. The impact of GC on the efficiency of corporate GI.
VariableGIEGIEGIEGIE
(1)(2)(3)(4)
GC0.454 ***0.613 ***0.346 ***0.577 ***
(6.232)(6.779)(3.995)(5.032)
Size −0.041−0.053 *
(−1.402)(−1.797)
ROE −0.303 ***−0.311 ***
(−3.383)(−3.452)
Cashflow 0.552 ***0.539 ***
(2.890)(2.827)
Fixed −0.709 ***−0.633 ***
(−5.037)(−4.469)
Indep 0.797 ***0.661 **
(2.646)(2.171)
Mfee −1.208 **−0.635
(−2.100)(−1.013)
TobinQ 0.036 **0.045 ***
(2.315)(2.762)
Constant1.535 ***1.924 ***2.174 ***3.020 ***
(7.828)(8.138)(2.608)(3.423)
YearNOYESNOYES
Corporation YESYESYESYES
N468468468468
R20.0910.1200.1890.214
Notes: the data in parentheses indicate standard errors; *, **, and *** represent significant at 10%, 5%, and 1%, respectively.
Table 5. Endogeneity test.
VariableGIE GIE
First
(1)
Second
(2)
IV (L.GC)1.260 ***
(20.94)
GC 0.551 ***
(4.30)
Size0.0020.004
(0.47)(0.38)
ROE−0.011−0.207 *
(−0.30)(−1.91)
Cashflow0.07790.834 ***
(1.12)(3.87)
Fixed−0.024−0.379 ***
(−0.89)(−4.64)
Indep−0.012−0.019
(−0.15)(−0.07)
Mfee−0.114−0.099
(−0.92)(−0.25)
TobinQ0.0020.061 ***
(0.43)(4.98)
Constant0.764 ***1.721 ***
(3.99)(3.96)
Observations468468
R-squared0.5720.222
Notes: the data in parentheses indicate standard errors; *, and *** represent significant at 10%, and 1%, respectively.
Table 6. Multiple robustness tests.
VariableGIEGIE
(1)(2)
GC0.585 ***0.215 ***
(5.070)(5.032)
Size−0.062 **−0.053 *
(−2.093)(−1.797)
ROE−0.298 ***−0.311 ***
(−3.287)(−3.452)
Cashflow0.505 ***0.539 ***
(2.635)(2.827)
Fixed−0.672 ***−0.633 ***
(−4.714)(−4.469)
Indep0.599 *0.661 **
(1.956)(2.171)
Mfee−0.596−0.635
(−0.944)(−1.013)
TobinQ0.044 ***0.045 ***
(2.674)(2.762)
Constant3.303 ***−0.885
(3.720)(−1.270)
YearYESYES
Corporation YESYES
N468468
R20.2130.214
Notes: the data in parentheses indicate standard errors; *, **, and *** represent significant at 10%, 5%, and 1%, respectively.
Table 7. Quantile regression.
VariableGIEGIEGIEGIE
(1)(2)(3)(4)
GC0.213 *0.256 **0.342 ***0.435 ***
(1.684)(2.549)(4.050)(3.320)
Size0.008−0.008−0.039−0.074
(0.168)(−0.196)(−1.200)(−1.448)
ROE−0.189−0.226−0.300 **−0.380 **
(−1.025)(−1.547)(−2.452)(−2.000)
Cashflow0.527 *0.535 **0.551 ***0.568 **
(1.884)(2.414)(2.974)(1.971)
FIXED−0.620 ***−0.649 ***−0.707 ***−0.769 ***
(−2.655)(−3.508)(−4.570)(−3.199)
Indep0.6230.6800.792 **0.914
(1.135)(1.562)(2.178)(1.615)
Mfee−1.675−1.523 *−1.220 *−0.892
(−1.583)(−1.816)(−1.739)(−0.818)
TobinQ0.0290.0310.036 **0.041
(1.161)(1.578)(2.159)(1.576)
Quantile0.10.250.50.75
N468468468468
Notes: the data in parentheses indicate standard errors; *, **, and *** represent significant at 10%, 5%, and 1%, respectively.
Table 8. Heterogeneity analysis of internal control perspectives.
VariableGIE
SOENon-SOEHigh Executive ShareholdingLow Executive Shareholding
(1)(2)(3)(4)
GC0.579 ***0.449 ***0.551 ***0.723 ***
(3.466)(2.623)(3.015)(4.520)
Size−0.037−0.024−0.019−0.066 *
(−0.867)(−0.473)(−0.301)(−1.869)
ROE−0.327 **−0.303 **−0.422 ***−0.008
(−2.439)(−2.405)(−3.730)(−0.040)
Cashflow0.510 *0.601 **0.538 *0.769 **
(1.858)(2.158)(1.931)(2.590)
Fixed−0.688 ***−0.476 **−0.671 **−0.632 ***
(−2.792)(−2.484)(−2.575)(−3.406)
Indep0.987 **0.1540.5261.328 **
(2.393)(0.327)(1.044)(2.605)
Mfee−1.576 *−0.2800.084−0.731
(−1.666)(−0.296)(0.090)(−0.764)
TobinQ0.043 **0.0260.071 **0.010
(2.282)(0.763)(2.052)(0.397)
Constant2.614 **2.1272.1063.523 ***
(2.001)(1.491)(1.178)(3.118)
YearYESYESYESYES
Corporation YESYESYESYES
N248220235233
R20.2810.1460.1760.347
Notes: the data in parentheses indicates standard errors; *, **, and *** represent significant at 10%, 5%, and 1%, respectively.
Table 9. Heterogeneity analysis of external regulatory perspectives.
VariableGIE
Strong Financial SupervisionWeak Financial RegulationStrong Environmental RegulationWeak Environmental Regulation
(1)(2)(3)(4)
GC0.574 ***0.586 ***0.519 ***0.574 ***
(3.570)(3.415)(3.071)(3.387)
Size−0.055−0.0500.002−0.087 **
(−1.012)(−1.325)(0.040)(−2.208)
ROE−0.289 ***−0.321 *−0.341 **−0.299 **
(−2.713)(−1.901)(−2.169)(−2.563)
Cashflow0.683 ***0.4110.583 **0.475
(2.775)(1.336)(2.165)(1.633)
Fixed−0.688 ***−0.533 **−0.590 ***−0.623 ***
(−3.887)(−2.274)(−2.616)(−3.186)
Indep1.396 **0.4451.091 **0.386
(2.349)(1.129)(2.303)(0.915)
Mfee−0.782−0.373−0.710−0.919
(−0.880)(−0.403)(−0.815)(−0.954)
TobinQ0.037 *0.047 *0.063 **0.035
(1.830)(1.743)(2.402)(1.582)
Constant2.814 *3.004 **1.3863.916 ***
(1.847)(2.571)(0.929)(3.347)
YearYESYESYESYES
Corporation YESYESYESYES
N228240246222
R20.2990.1590.2260.224
Notes: data in parentheses indicate standard errors; *, **, and *** represent significant at 10%, 5%, and 1%, respectively.
Table 10. Threshold effect test results.
VariableThreshold Numberp-Valuep-ValueCrit10Crit5Crit1
LevSingle13.340.040011.537412.846920.4280
Double7.410.293310.693912.567416.8130
EGTSingle10.160.09009.549312.072617.1045
Double3.240.49678.642010.496817.1059
Note: BS count was 300.
Table 11. Threshold value estimation results.
VariableTHRESHOLD VALUE95% Confidence Interval
Lev0.2948(0.2801, 0.3032)
EGT24.0000(19.0000, 25.0000)
Table 12. Results of parameter estimation for the single panel threshold model.
VariableGIEGIE
(1)(2)
GC∙I (Lev ≤ 0.2948)0.308 ***
(3.48)
GC∙I (Lev > 0.2948)0.355 ***
(3.87)
GC∙I (EGT ≤ 24.0000) 0.371 ***
(4.36)
GC∙I (EGT > 24.0000) 0.299 ***
(2.95)
Size−0.025−0.048
(−0.92)(−1.61)
ROE−0.324 **−0.272 **
(−2.60)(−2.33)
Cashflow0.549 ***0.517 ***
(3.37)(2.86)
Fixed−0.650 ***−0.767 ***
(−3.40)(−3.35)
Indep0.728 *0.816 **
(1.89)(2.07)
Mfee−1.366 *−1.178
(−1.84)(−1.47)
TobinQ0.031 ***0.039 ***
(2.98)(4.12)
Constant1.819 **2.427 ***
(2.30)(2.78)
Observations468468
Number of area7878
R-squared0.2150.207
Notes: the data in parentheses indicates standard errors; *, **, and *** represent significant at 10%, 5%, and 1%, respectively.
Disclaimer/Publisher’s Note: The statements, opinions and data contained in all publications are solely those of the individual author(s) and contributor(s) and not of MDPI and/or the editor(s). MDPI and/or the editor(s) disclaim responsibility for any injury to people or property resulting from any ideas, methods, instructions or products referred to in the content.

