Article

Sustainable Urban Planning Using Integrated Geophysical Techniques in New Sohag City, Egypt

Department of Geophysics, Faculty of Science, Cairo University, Giza 12511, Egypt
Sustainability 2025, 17(8), 3730; https://doi.org/10.3390/su17083730
Submission received: 27 February 2025 / Revised: 17 April 2025 / Accepted: 18 April 2025 / Published: 21 April 2025
(This article belongs to the Section Hazards and Sustainability)

Abstract

:
Sustainable planning in New Sohag City, Egypt, can be significantly enhanced by employing integrated geophysical techniques. The current research presents the applicability of multiple integrated geophysical methods to prepare the optimal land use plans for the sustainable development of the new urban extension of Sohag Governorate, Upper Egypt, to tackle residential density and overcrowding in the governorate. The utilized geophysical techniques were electrical resistivity tomography (ERT), seismic refraction (SR), and ground penetrating radar (GPR). All these applied geophysical techniques concluded the near-surface stratigraphic sequence, which can be summarized by a generic subsurface model: variable wadi-fill deposits due to the variation in the flooding nature of the Nile River over the past millions of years, with an average thickness of 4.1 m; wet sand with intercalations of silt and clay, with an average thickness of 9.2 m. The model ends with highly saturated sand and gravel deposits, representing the groundwater aquifer throughout the studied area. The integration of the geophysical techniques, as well as the geological investigation, proved a clear efficacy for preparing the optimal land-use plan of the studied site, in the form of the proposed extensions of the agricultural activities, green and open areas, old quarrying areas, construction areas, and the groundwater potential throughout the studied area to conserve natural resources and ensure sustainable land use.

1. Introduction

The residential communities in Egypt have suffered for a long period from overcrowding and unclear plans in Greater Cairo, and the governorates of Upper Egypt, in which the urban communities of the governorates of Upper Egypt were gathered on the narrow strip of the Nile Valley, leading to degradation in the infrastructure’s utilities and associated environmental problems. This necessitated the current governments, since the beginning of the current century, to adapt new urban plans and extensions of the already-existing communities to achieve optimal environmental and urban sustainability and utilize the available natural resources as much as possible (optimal land-use planning) [1,2,3].
Land use planning is the systematic process of assessing land potential and alternatives for optimal land uses and improved economic and social conditions through participatory processes that are multi-sectoral and multi-stakeholder. The main target of land-use planning is to support decision-makers in selecting and putting into practice those land uses that will best meet the needs of people while safeguarding natural resources and ecosystem services for current and future generations [4]. So, the assessment of land suitability can provide decision-makers with options for viable land use to fulfill the needs of different sectors operating in a landscape while optimizing and sustaining resource use [5], as shown in Figure 1.
Consequently, one of the main targets of Egypt’s Vision 2030 is to enhance the quality of life of Egyptians through three main pillars: an economic pillar, a social pillar aiming to improve population characteristics, and an environment pillar aiming to provide a better living environment (necessitating the optimal planning of new urban areas) [6].
In general, the population of Egypt is growing steadily, especially in Sohag Governorate, whose population increased from 3.7 million to 4.9 million between 2004 and 2018, necessitating the preparation of an optimal land-use plan for the already-existing Sohag Governorate [7], as illustrated in Figure 2.
Sohag Governorate, one of the rural governorates aligned along the River Nile in Upper Egypt, is situated 467 km south of Cairo and comprises a limited sector of land along both banks of the River Nile, with a total length of nearly 110 km (Figure 3). The land surface of Sohag was characterized by deposits of the Nile Valley, which can be utilized for cultivation and associated activities. The edges of the valley, on both the east and west flanks of the Nile, are marked by steep scarps raised abruptly by adjacent limestone plateaus, as presented in Figure 4 [8].
Geophysical methods are considered the most important and fastest techniques that can be used to determine urban and land use mapping and future planning, due to their ability to evaluate the subsurface stratigraphy of the area studied. The application of a sole geophysical technique in the research of urban planning would not provide accurate and independent results, so it is highly valuable to utilize integrated geophysical techniques to minimize the rate of uncertainty and develop a reliable future plan. The current study focuses on the application and integration of near-surface geophysical techniques (electrical resistivity tomography, seismic refraction, and ground penetrating radar) to provide a clear image that can be understood by decision-makers and planning authorities [10,11].
Electrical resistivity tomography (ERT), seismic refraction, and ground penetrating radar (GPR) have been applied by various authors to investigate near-surface soils for preparing the land-use plan for the investigation site [12,13,14,15].
Several geophysical studies were carried out around Sohag governorate to characterize the subsurface stratigraphic sequence [16,17,18,19,20,21,22]. It was found that most of the surface structural elements (faulting) have the same trends affecting the basement of Middle Egypt. The sedimentary subsurface sequence, which unconformably overlies the crystalline basement rocks, has an average thickness ranging from 500 m to 3000 m [21]. The dominant topographical features around the studied area are considered a true reflection of the exhibited structural elements. The drainage pattern is controlled by fault trends and joints, which were mostly created by tectonic activity.
The main objective of the current research is to emphasize the integrating role of geological and geophysical techniques in designing optimal land use planning for the extension of Sohage City, mitigating all associated geological, environmental, and geophysical risks and aiming at ensuring future safety, resilience, and sustainability.

2. Geological and Structural Setting

The geologic map of Egypt reflects the surface-exposed rocks in the study area, representing the Pliocene and Quaternary deposits. The Precambrian basement rocks are exposed in the Red Sea hills, with an average depth of 1640 m [8].
The subsurface stratigraphic column of the Sohag area has been discussed by many authors [23,24,25,26,27,28,29] and is summarized as a thick succession of fluviatile deposits, represented by Holocene deposits (wadi-fill deposits, clay, and silt); Pleistocene sediments (gravels, fine sand-silt intercalations); Pliocene deposits (limestone, silt, sand, and clay); and Early Eocene deposits (limestone with flint bands), as shown in Figure 3.
The hydrogeological framework of the study area can be described by a single aquifer system—the Quaternary aquifer—composed primarily of fluvial sands interspersed with minor conglomerate and clay deposits. This aquifer is overlain by a layer of Neonile silt and fine-grained sands, which form the foundation for cultivated lands in the region. Along the eastern and western margins, the Neonile silt layer transitions into more recent sedimentary deposits. The aquifer exhibits varying confinement conditions: it is semi-confined within the floodplain due to the overlying silt layer, while in the desert fringes, it becomes unconfined where the silt is absent. The thickness of the permeable aquifer layer decreases spatially, ranging from approximately 150 m in the central floodplain to 50 m near the desert edges. Hydraulic conductivity averages 70 m/day for the main aquifer body but drops significantly to 4 cm per day in the low-permeability silty top layer [30,31,32].

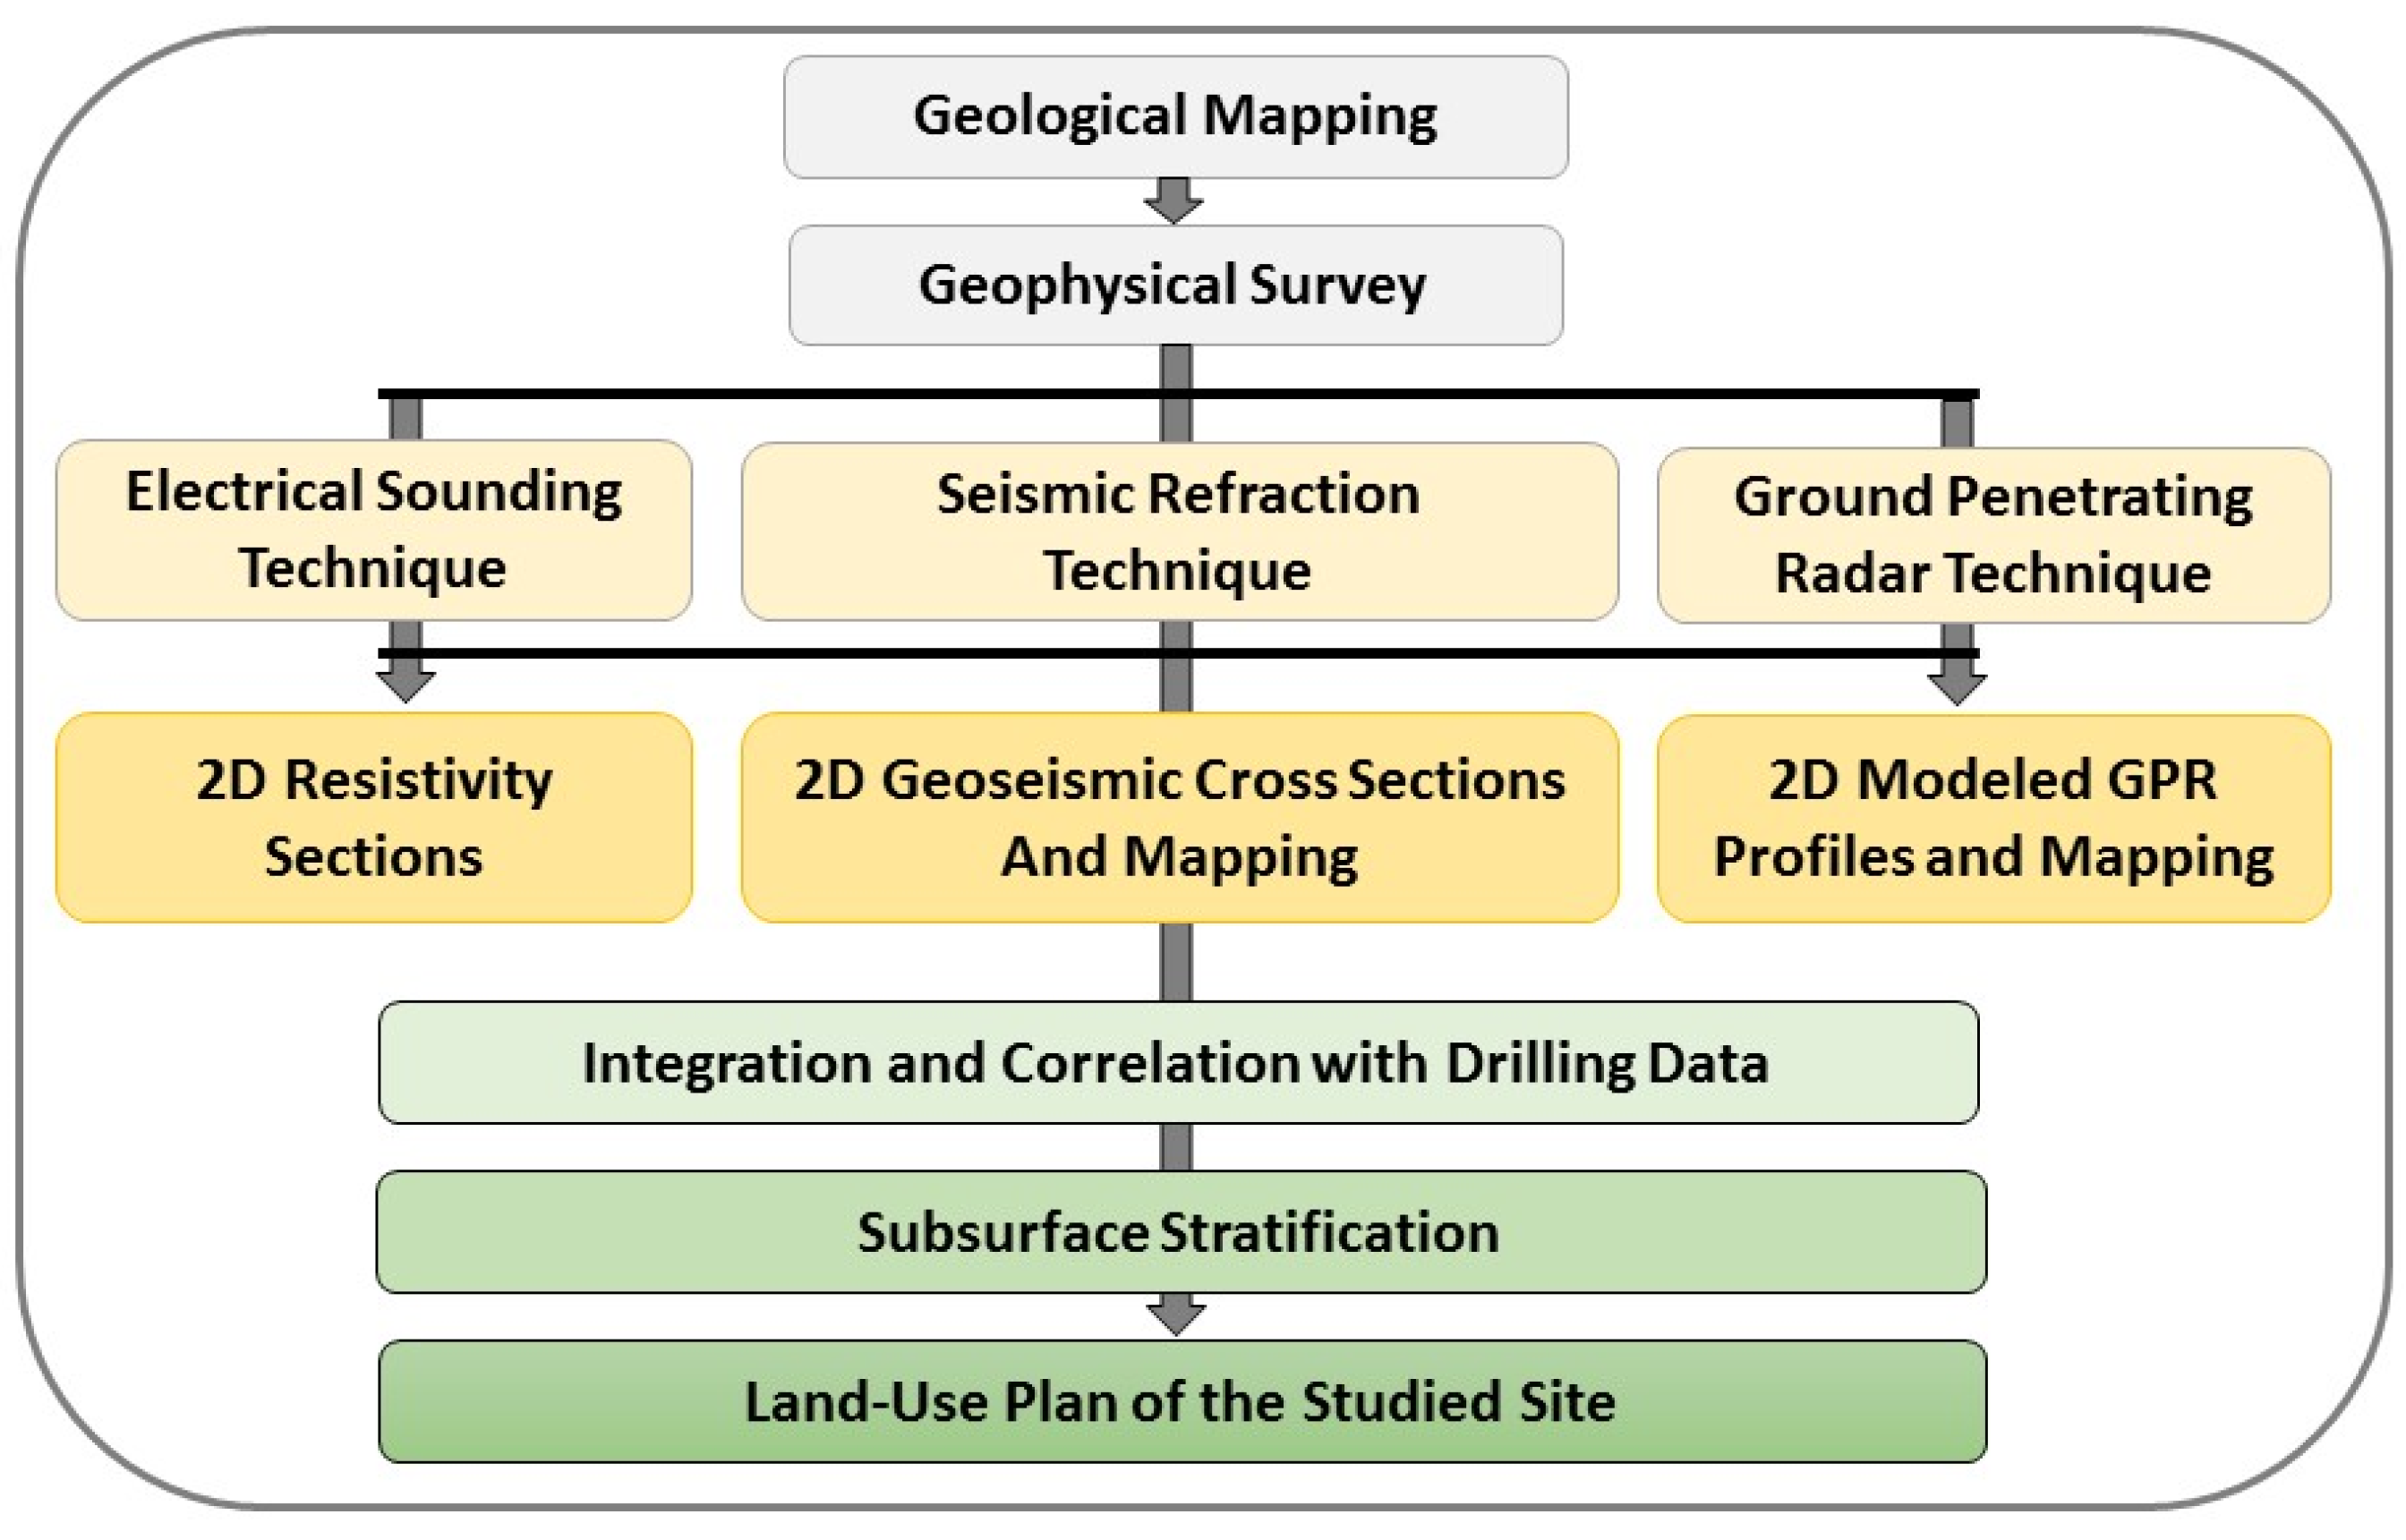
3. Materials and Methods

The applied scheme of the current research began with the collection of the geological mapping from different references and was adopted for the investigated site, followed by determining the most predominant affecting structural elements such as faulting, unconformity, and folding. Then, the most optimal geophysical techniques (electrical resistivity tomography, seismic refraction, and ground penetrating radar) were selected for the evaluation of the lithological subsurface sequence. Finally, we integrated and merged all the obtained results and findings to construct the suggested land use plan for the investigated site, as illustrated in Figure 4.

3.1. Electrical Resistivity Tomography

A total of thirteen geo-electrical resistivity tomography (ERT) profiles were conducted utilizing the Wenner array. Each spread was 96 m in total length, with 2 m electrode spacing and a 10 m interline interval, using the “SYSCAL R2-IRIS” system, which has a built-in microcomputer together with an electronic switching unit used to automatically select the relevant four electrodes for each measurement. The penetrated depth reaches about 17 m for all the acquired ERT traverses, as shown in Figure 5.

3.2. Seismic Refraction

The seismic refraction method is considered one of the most applicable geophysical methods for evaluating near-surface subsurface stratification. It is based mainly on the transmission of seismic sound waves through the subsurface medium using an artificial source of seismic waves, where these waves are refracted and recorded by a package of planted surface recorders (geophones). Arrival times of the refracted waves are then registered, followed by constructing the time distance curves to obtain the 2D geo-seismic depth sections [33].
Twelve seismic refraction traverses (forward and reverse shots) were acquired using a 12-channel seismograph model “DOLANG-Italy”, as illustrated in Figure 5. The profiles were 55 m in length, except for profiles 10, 11, and 12, which were 65 m long. Geophone spacing was set at 5 m, and the interval between the shot point and the first geophone was also 5 m.

3.3. Ground Penetrating Radar

Ground penetrating radar (GPR) is considered a rapid and effective electromagnetic technique operating in the frequency range of 1 MHz to a few GHz. It is generally used for imaging environmental and engineering problems and is based on the emission of short pulses of high-frequency EM energy into the ground from a transmitting antenna. The velocity of the emitted EM waves depends on the dielectric permittivity of subsurface materials. When the emitted EM waves encounter an interface between two materials with different dielectric permittivity, a portion of the energy is reflected back to the ground surface and recorded by a receiver antenna, then displayed on the attached control unit for processing the acquired GPR traverses.
The depth of EM wave penetration depends on the frequency of the utilized antenna, the dielectric constant, and the electrical conductivity of the subsurface soils. However, low-frequency antennas achieve greater depth of penetration than those of high frequency, but they have poor spatial resolution. Conductive soils such as clays attenuate radar waves much more rapidly than resistive soils such as dry sand and resistive rock [34].

4. Results

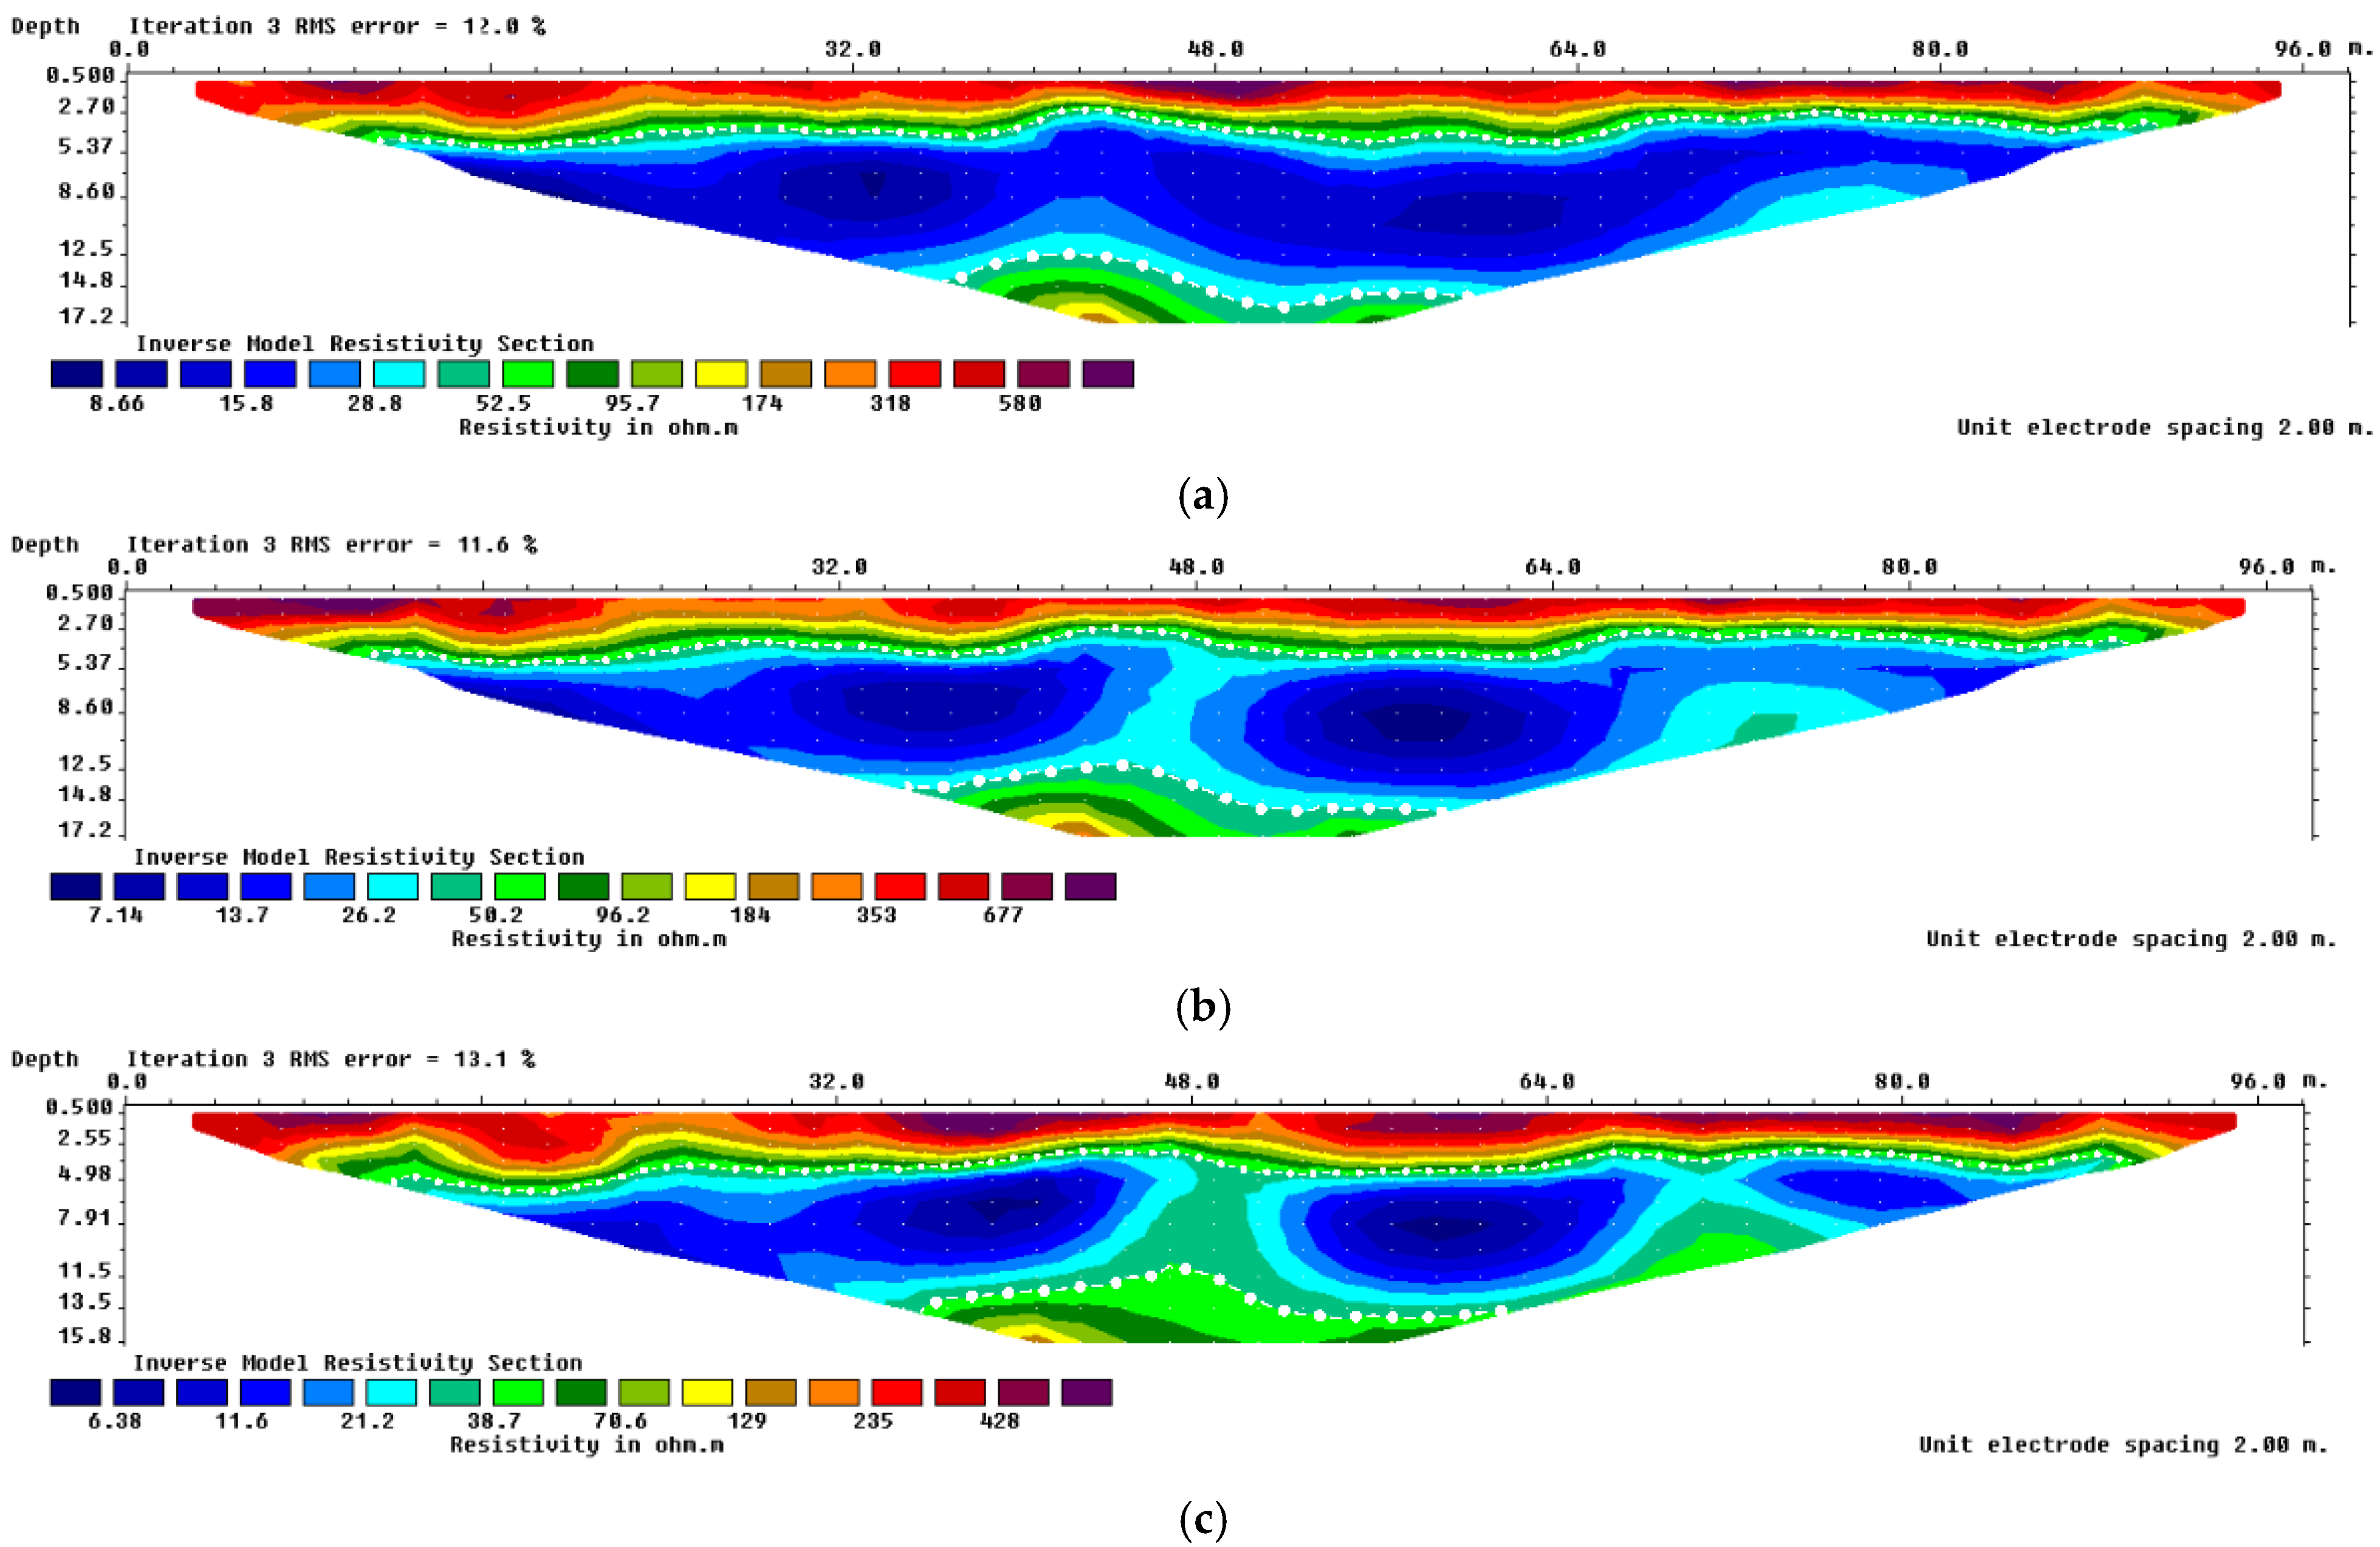
4.1. Electrical Resistivity Tomography

The ERT profiles were processed and modeled using RES2DINV Ver. 3.59 [35]. The RMS error of the iterated models ranged between 11.63–13.7%, and the obtained models revealed a generic subsurface stratigraphic section composed of three geoelectric layers that can be described as follows and presented in Figure 6:
  • The surface wadi-fill deposits exhibit high resistivity values in the range of 184–684 Ohm.m, as shown in Figure 6a–c, due to the variation of the flooding nature of the Nile River over the past millions of years. The average thickness is 4.1 m across all the conducted profiles, and the materials are classified as surface friable sands, dry mud, silty sands, and clayey sands, as correlated with the gathered geologic information. The wide range of resistivities reflects different meteorological, seasonal, and sedimentation conditions in the first exposed layer.
  • The second geoelectric layer, with a low resistivity range of 7.1–28.8 Ohm.m and a thickness of 9.2 m, is represented by deposits of wet sand, as shown in Figure 6a–c.
  • The bottom layer extends to the maximum penetrable depth of the conducted ERT sections (17.2 m) and is characterized by moderate resistivity values ranging from 58.1 to 175.0 Ohm.m, corresponding to highly saturated sand and gravel deposits, which represent the groundwater aquifer, as shown in Figure 6a–c.

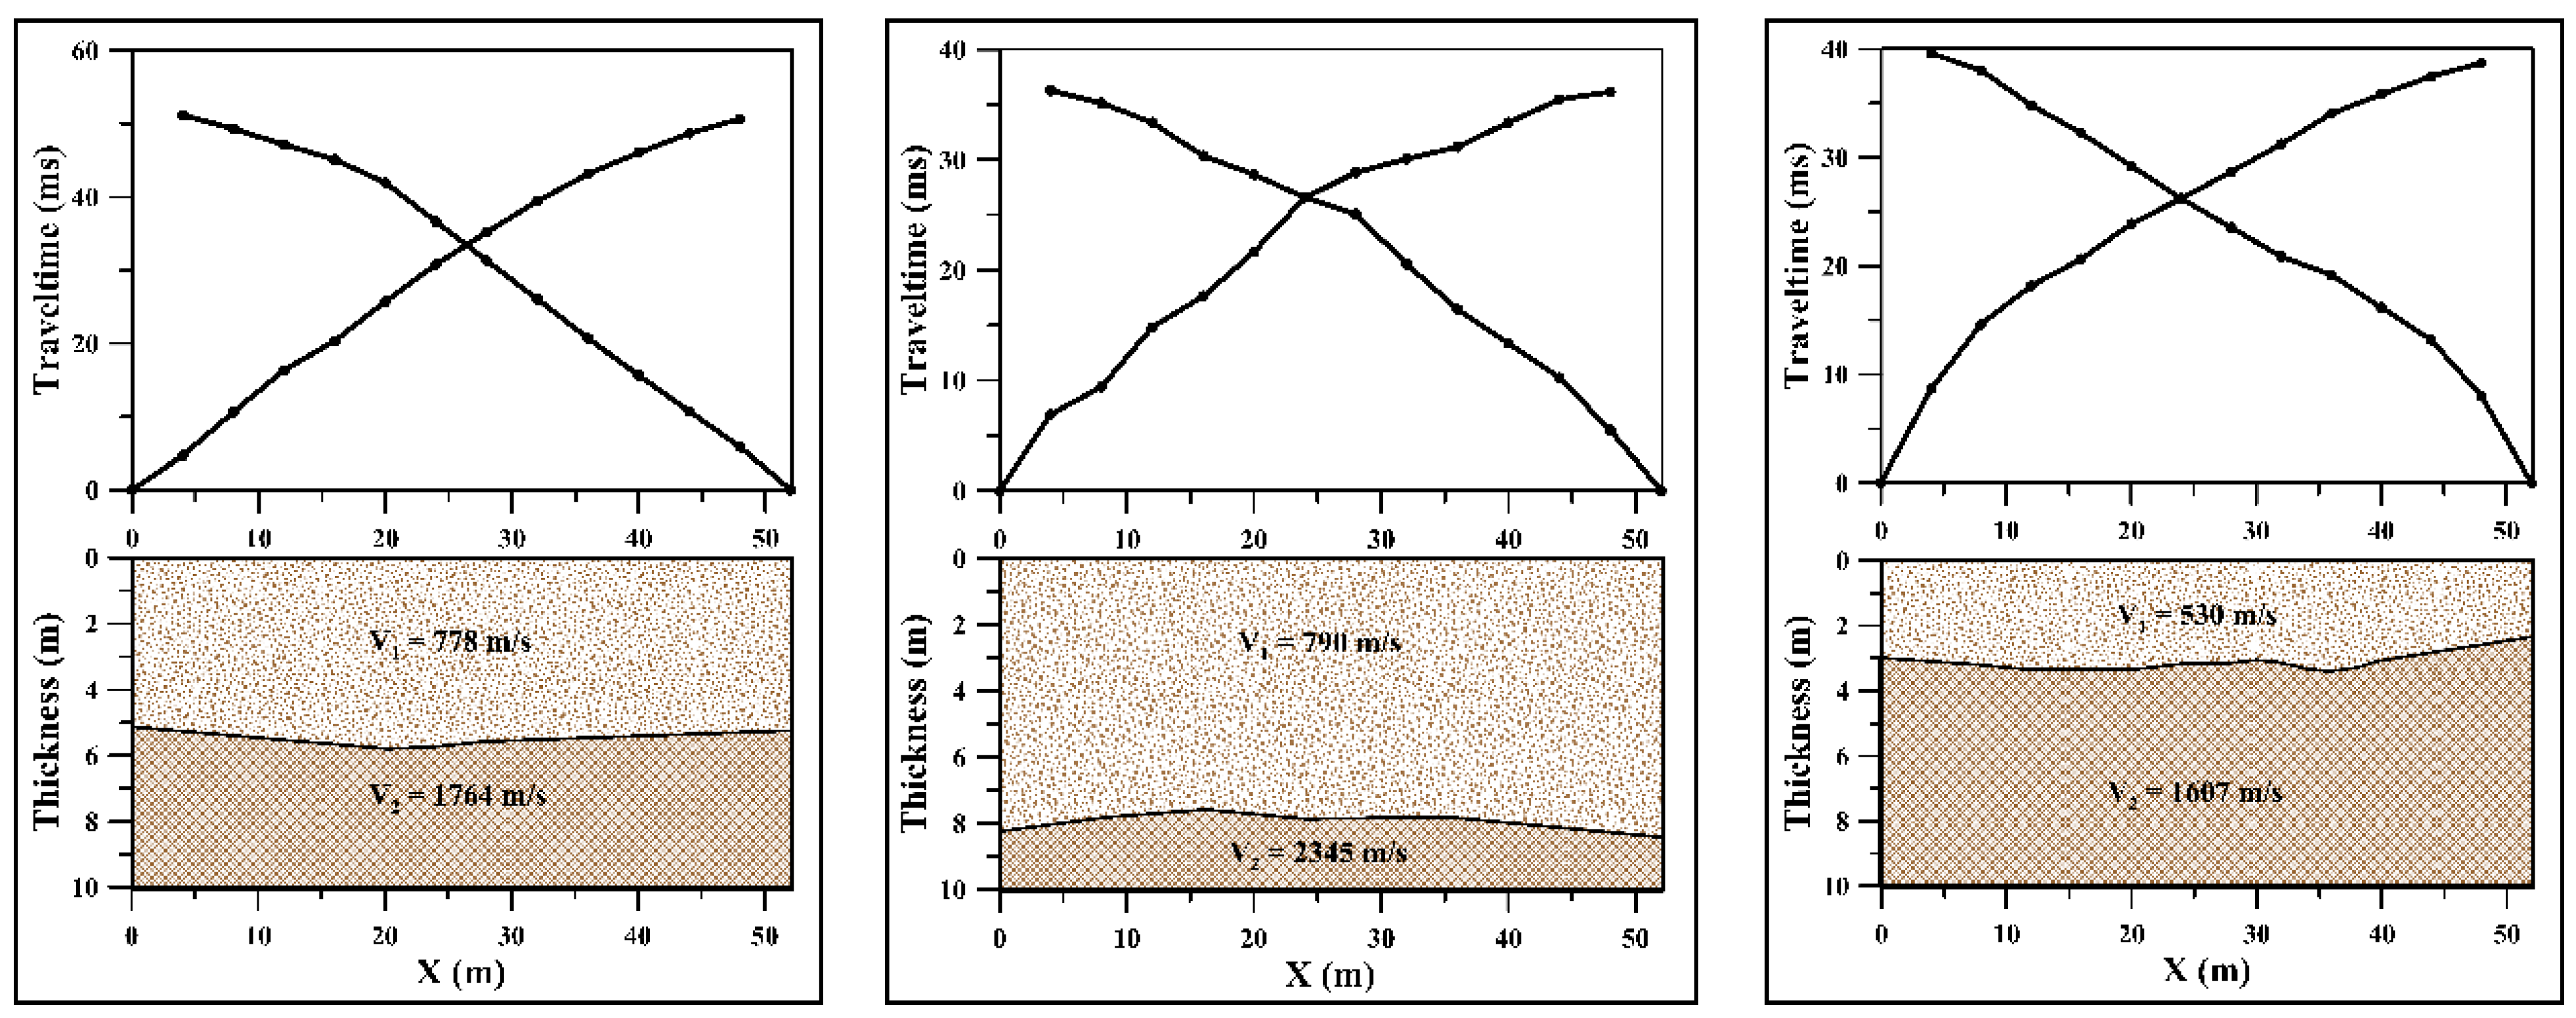
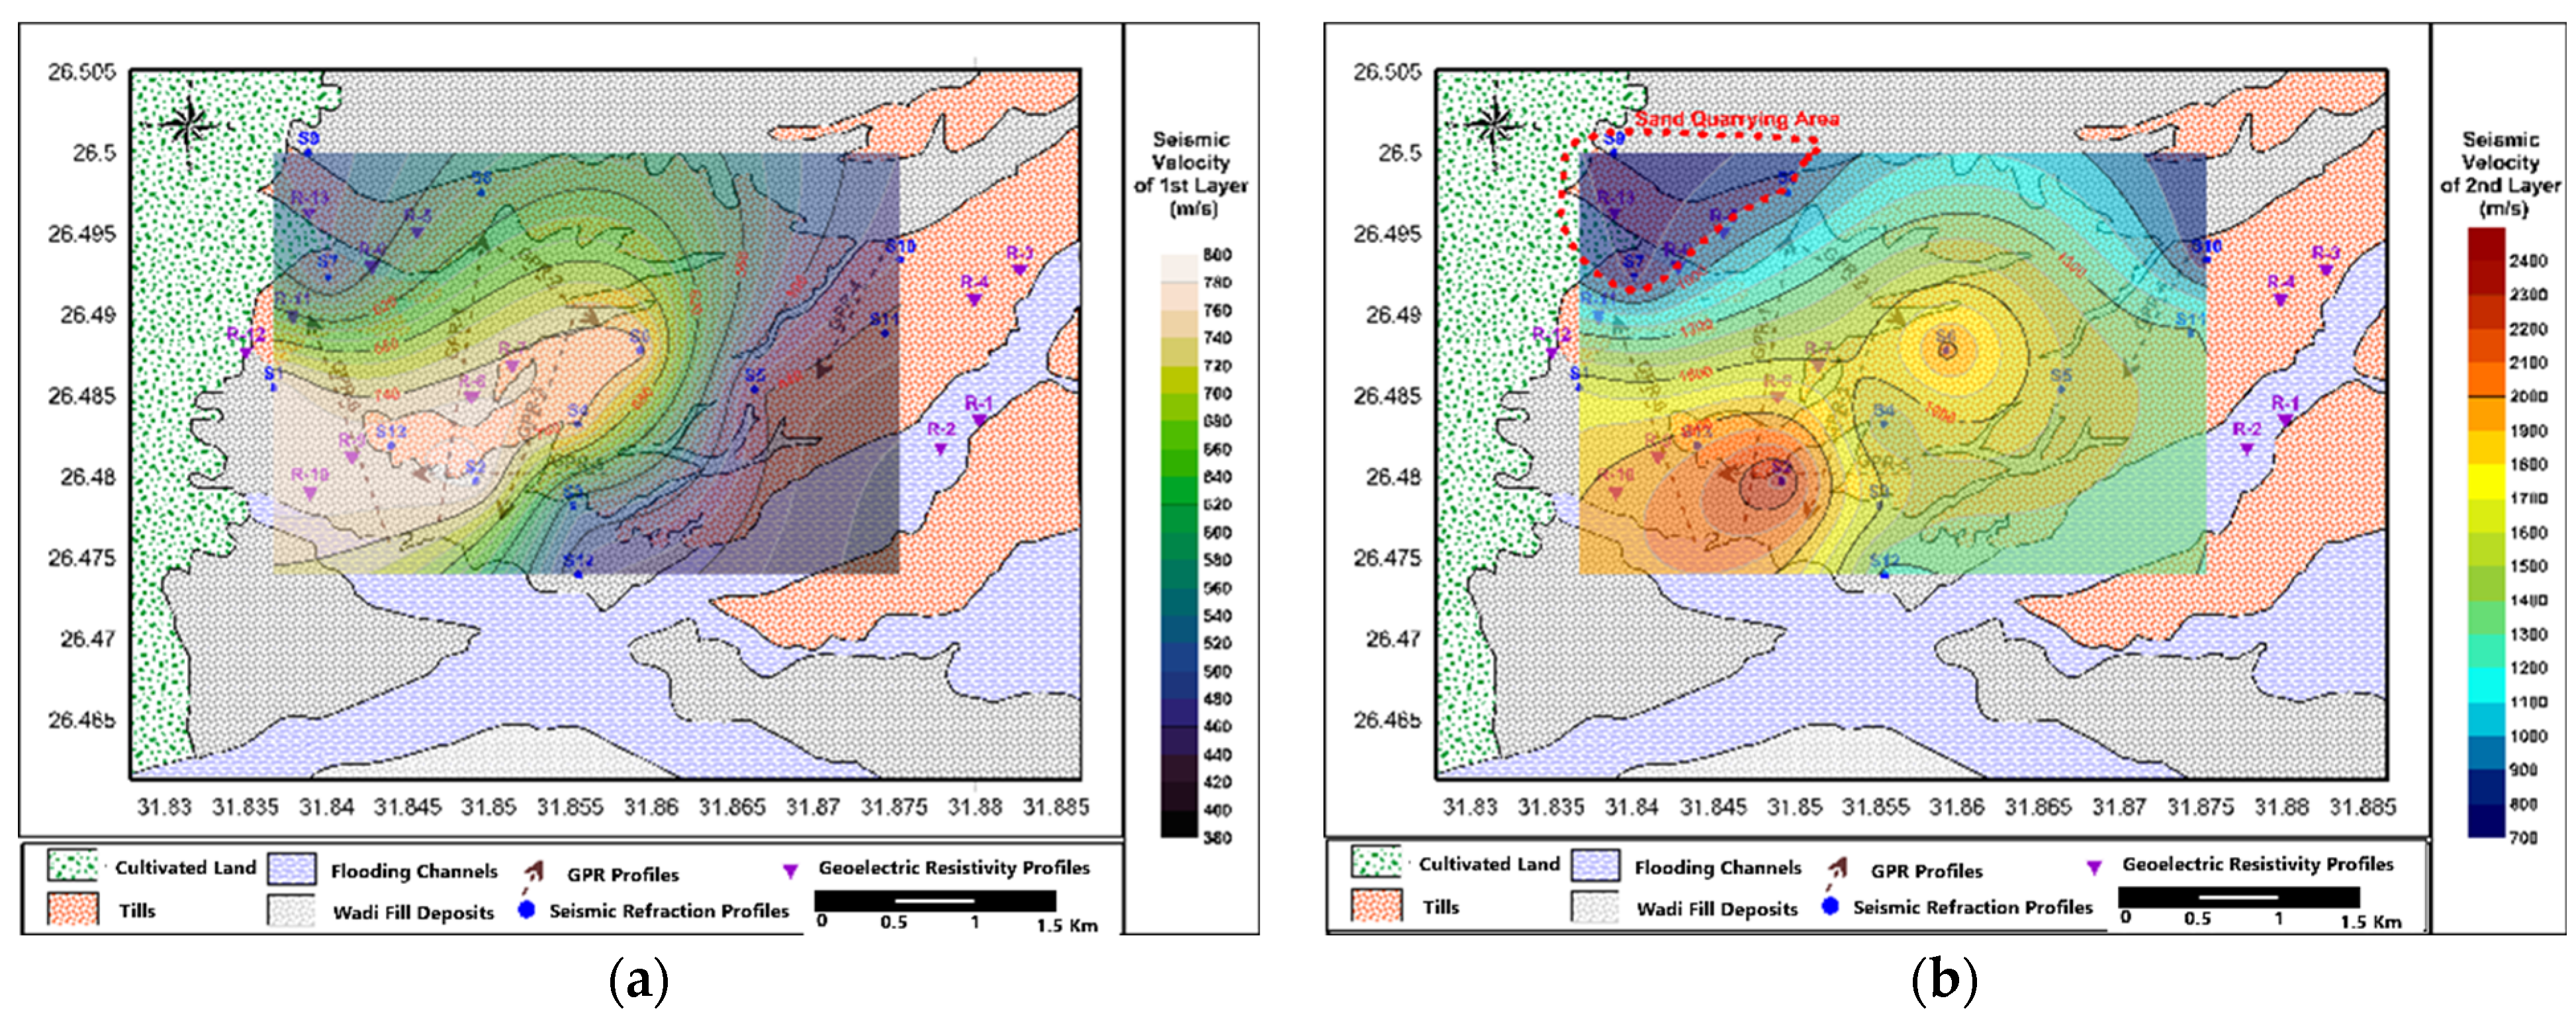
4.2. Seismic Refraction

The plus–minus method, also abbreviated by CRM (conventional reciprocal method), is an interpretational assumption for the analysis of shallow seismic refraction data. It can be used to estimate the depth and velocity variations of the subsurface layers for slope angles less than ~10° [36]. However, the method can be applied to the planar layer boundaries and small dips. Currently, the plus–minus interpretational method is preferred over other advanced inversion methods that have fewer restrictions. In addition, the method is still used for real-time processing in the field because of its simplicity and low computational costs [37].
The acquired seismic refraction seismograms were digitized, the first arrival was picked with maximum accuracy, time–distance curves were constructed, and these curves were modeled by applying the plus–minus method. The obtained geo-seismic depth sections mentioned the clear presence of lateral variations of seismic velocity throughout the investigated area, and the obtained models revealed generic subsurface stratigraphic section layers that can be described as follows (as illustrated in Figure 7):
  • Surface wadi-fill deposits of seismic velocity ranging from 445 to 778 m/s, with a varying thickness through the conducted profiles ranging from 1 to 8 m.
  • A second layer of wet sand with equivalent seismic velocity ranging from 1406 to 1660 m/s, with laterally varied thickness starting from 9 m as a minimum and, in some cases, extending to the maximum penetrable seismic profile (10 m).
  • A third layer, which is detected only at profile S-02 in the middle of the studied area, with a seismic velocity of 2345 m/s, is represented by a highly consolidated claystone layer.
To perform the spatial distribution of the picked seismic velocities from the geoseismic depth sections, a group of contour maps for the seismic velocities of the subsurface layers was constructed. The contour map for the seismic velocity of the first layer showed the increase in velocity in the middle of the studied area (700–800 m/s), where the boundaries of the studied area were characterized by low seismic velocity (400–600 m/s) (as illustrated in Figure 8a). On the contrary, the seismic velocity of the second layer increased in the middle and decreased on the boundaries of the studied area. This can be interpreted by the presence of old quarrying at the northwest of the studied area (as illustrated in Figure 8b).

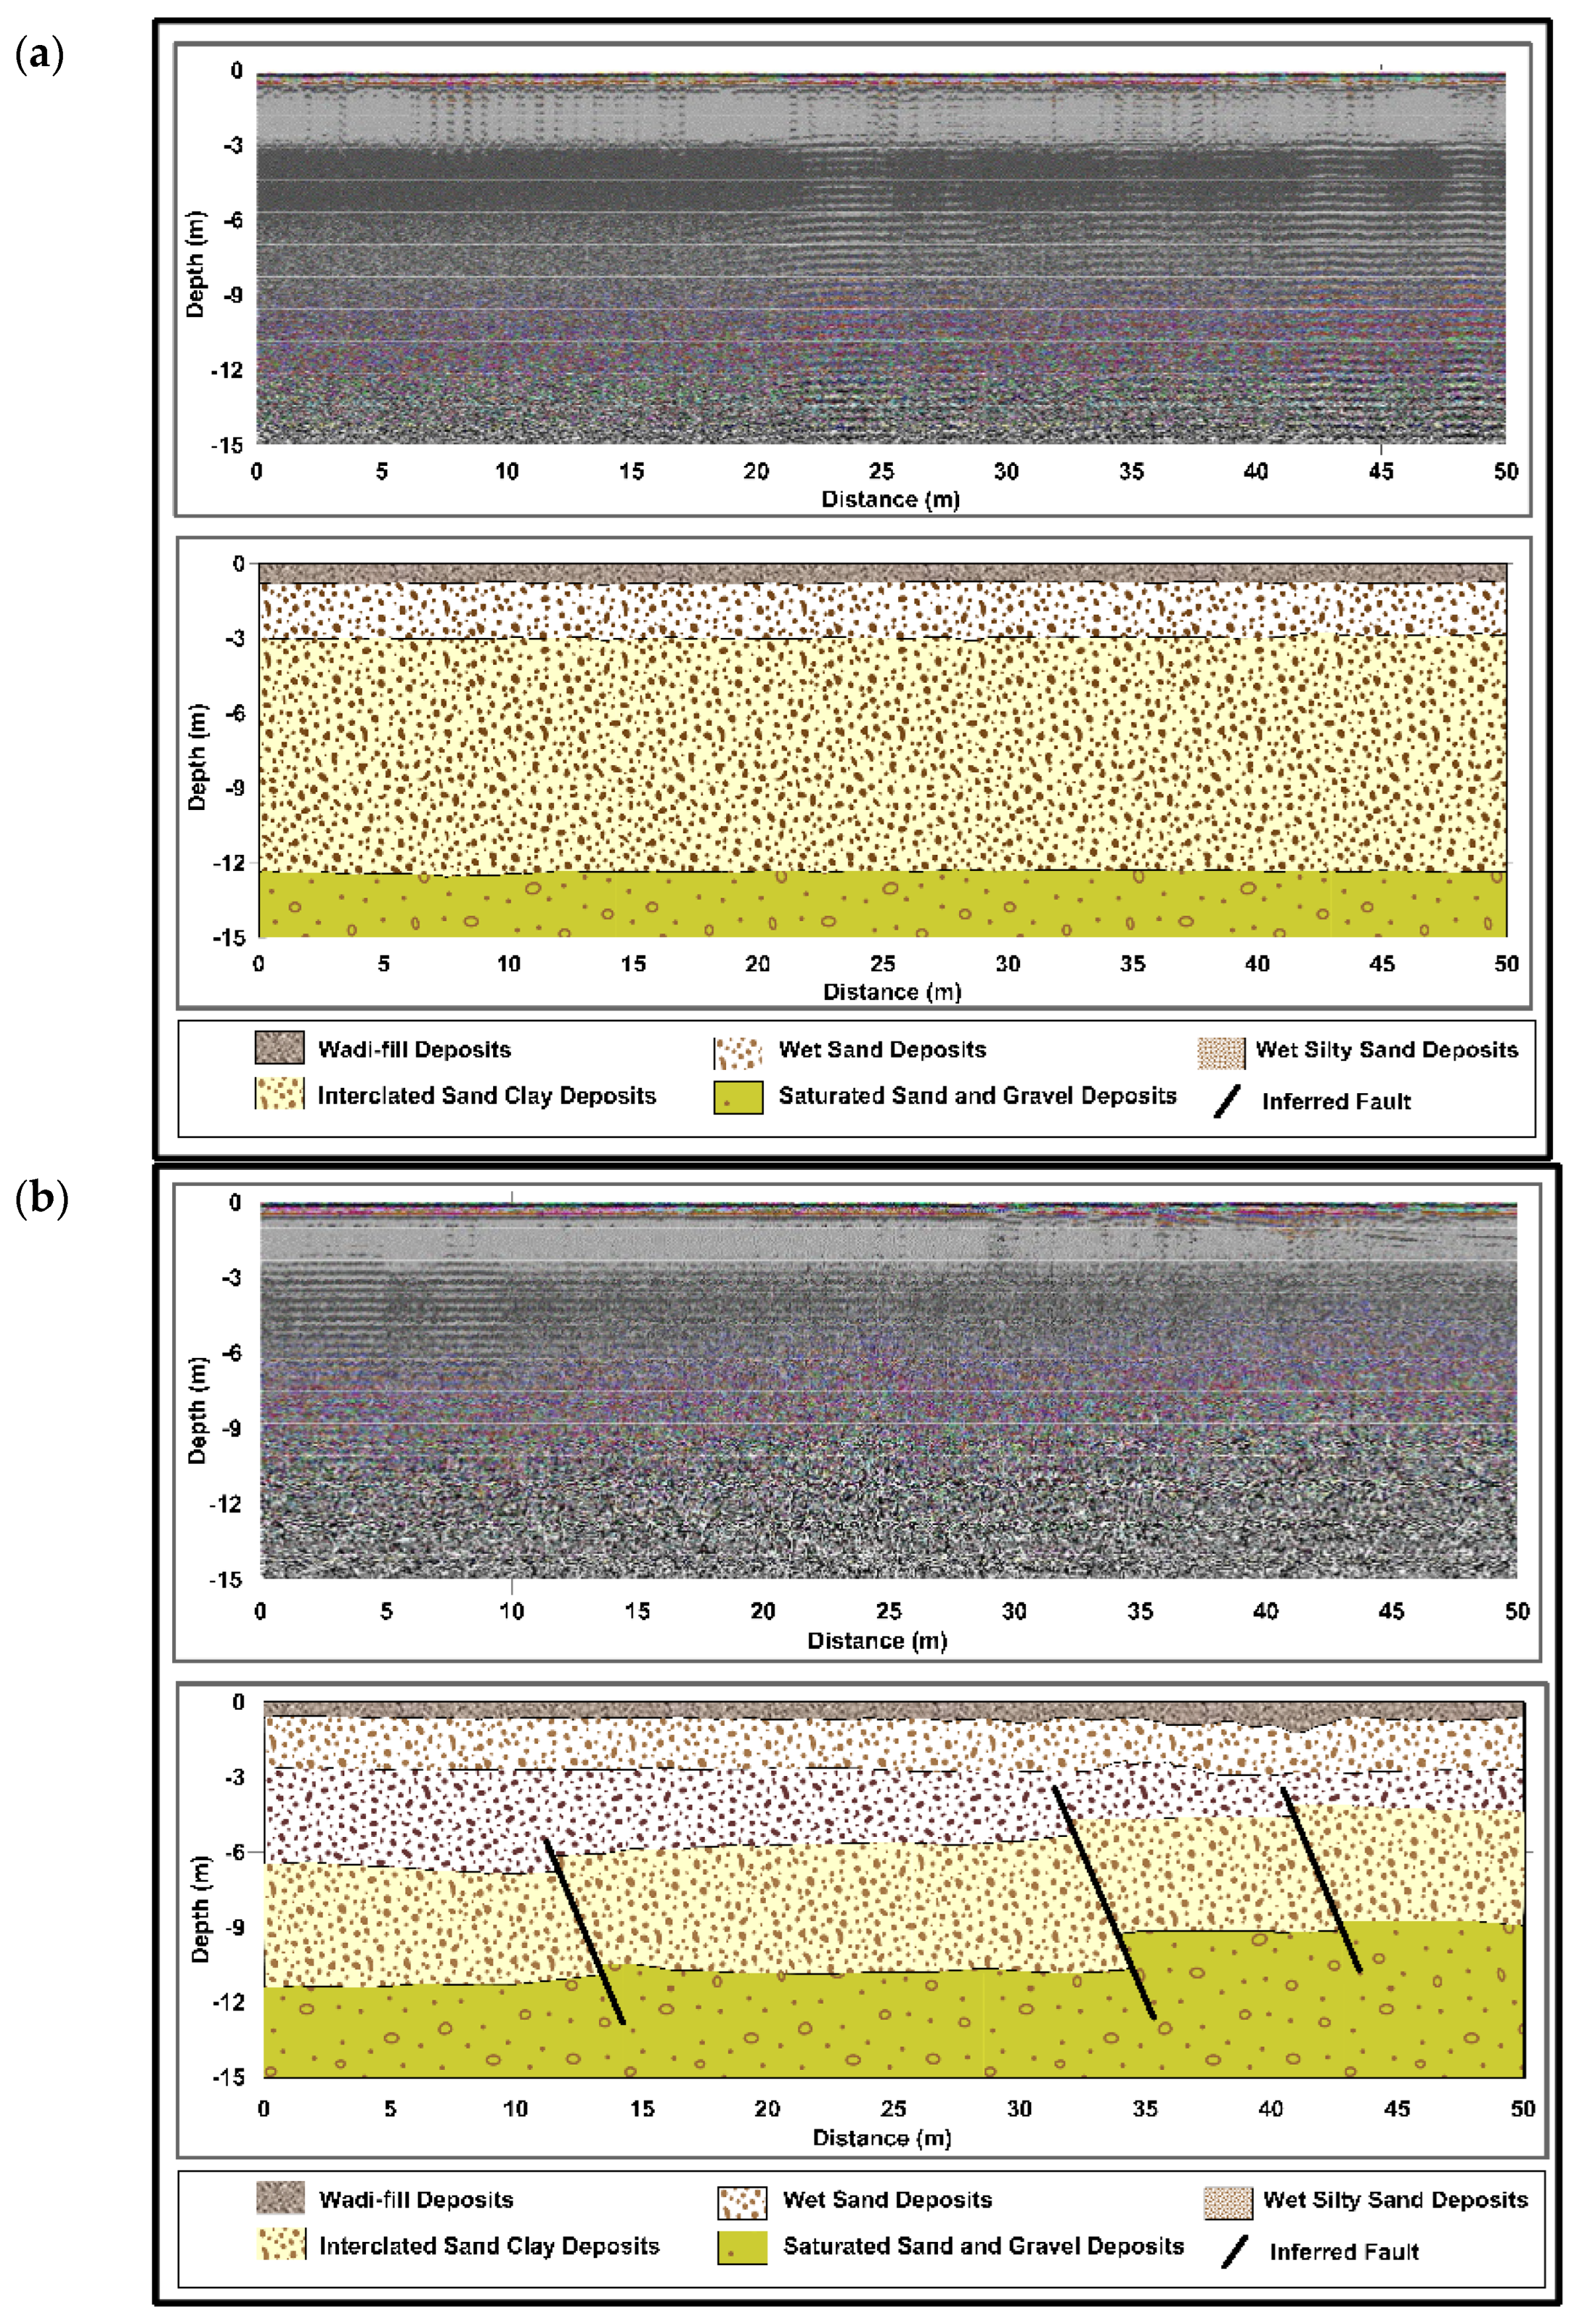
4.3. Ground Penetrating Radar

A total of six GPR traverses were conducted in the study area using an antenna frequency of 100 MHz, aiming to image to an approximate depth of 15 m in the study area by assuming an EM velocity of 12 m/ns, as presented in the standard tabular values. The basic concept underpinning the interpretation regime is that radar reflections are parallel to the bedding surface at the survey resolution [38]. The GPR sections obtained were interpreted using the available outcrops that are well observed in the studies area as a control, along with the basic knowledge of the dominant local geology.
The GPR sections revealed a major subsurface stratigraphy, which can be described as follows: a surface layer of wadi-fill deposits with a thickness ranging from 0.5 to 0.7 m; a second layer of wet sand deposits with intercalations of silt and clay deposits, with a varying thickness of 10.3–11.5 m; and the GPR conducted traverses were ended with highly saturated sand and gravel deposits, which represented the water-bearing formation throughout the studied area. It is also indicated from GPR profiles that the presence of parallel structural faulting affects the studied site, which is suggested to be initiated as a result of the main structural control of the faulting that constitutes the Nile Valley [39], as shown in Figure 9.
By picking the reflector of the highly saturated sand and gravel deposits, a contour map of the upper surface of the water-bearing formation was constructed to perform the spatial distribution of the aquifer, which can be utilized in the investigated area as a natural resource recharged from the River Nile, as mentioned by various researchers [32,40]. It is obvious that the depth to the groundwater aquifer decreases near the Nile River, toward the west, to about 6.5 m, while it increases toward the east (limestone plateau) to about 15 m, as confirmed by [32], as shown in Figure 10.

5. Discussion

Proactive subsurface management transforms urban challenges into opportunities for resilience and sustainability. By integrating new technologies in geophysics and geology, cities can mitigate risks, reduce costs, and foster inclusive growth, turning the hidden depths beneath our feet into a foundation for future prosperity [41,42,43,44,45,46,47,48,49].
A key to success in the urban planning of a site is an understanding of the subsurface stratigraphic sequences through acquiring multiple geophysical survey to provide meaningful information on the subsurface features. ERT, SR, and GPR were utilized in the current research to map the stratigraphic features encountered in the studied area, such as subsurface sequence, geological structures, and groundwater-bearing formations.
The conducted electrical resistivity tomography (ERT) survey revealed the presence of three main distinct geoelectric layers within the study area: surface wadi-fill deposits with high resistivity values ranging from 184 to 684 Ohm.m, due to historical variation in the flooding behavior of the Nile River, with an average thickness of 4.1 m, as correlated with the gathered geologic information; the second layer, with a resistivity ranging from 7.1 to 28.8 Ohm.m and a thickness of 9.2 m, is represented by deposits of wet sand; and the bottom layer, which extended to the maximum penetrable depth (17.2 m), with a resistivity range of 58.1–175.0 Ohm.m, corresponds to highly saturated sand and gravel deposits, representing the groundwater aquifer.
The conducted seismic refraction (SR) survey results revealed the presence of two distinct geoseismic layers within the study area, which can be formalized as follows: surface wadi-fill deposits with a seismic velocity range of 445–778 m/s and a varying thickness across the conducted profiles ranging from 1 to 8 m; a second layer of wet sands with an equivalent seismic velocity ranging from 1406 to 1660 m/s and a laterally disparate thickness starting from 9 m as a minimum and, in some cases, extending to the maximum penetrable seismic profile (10 m); and highly consolidated claystone pockets, detected only at profile S-02 in the middle of the studied area, with a seismic velocity of 2345 m/s.
The ground penetrating radar (GPR) survey results revealed the presence of a detailed image of the subsurface model representing the study area, which can be described as follows: a surface layer of wadi-fill deposits, with a thickness ranging from 0.5 to 0.7 m; a second layer of wet sand deposits with intercalations of silt and clay deposits, with a fluctuating thickness of 10.3–11.5 m; and the GPR-conducted traverses ended with highly saturated sand and gravel deposits, which represented the water-bearing formation throughout the studied area. The conducted GPR profiles also indicated the presence of nearly parallel structural faulting elements influencing the study area, which are suggested to be initiated as a result of the main structural control of the faulting that constitutes the Nile Valley.
By combining, integrating, and merging the results from the three conducted geophysical methods, the subsurface geology was better defined as a depositional alluvial environment due to the proximity of the study area to the Nile River, with a major generic subsurface model of surface dry wadi-fill deposits, wet silty clayey sands, and ended with highly saturated sand and gravel deposits at an average depth of 11 m. The groundwater aquifer system is represented by the Quaternary deposits, as confirmed by [30,32,50].
The land-use map of the study area was derived from the combination of all the obtained results of conducted ERT, SR, and GPR geophysical techniques, as well as the evaluated upper surface groundwater aquifer, in addition to the geological mapping and outcropping of the study area, as presented in Figure 11.
The suggested land-use map of the study area reveals the following natural resources that can be optimally used for the generation of a new urban community:
  • Agricultural areas: located in the western part of the study area, close to the Nile River, which is considered a source of agricultural projects.
  • Groundwater aquifer: as confirmed by ERT, SR, and GPR geophysical techniques, the depth of the groundwater aquifer is very shallow, ranging from 6.5 to 15 m.
  • Clay deposits: as present in the central and northeast parts of the study area, which can be utilized for reclamation and natural fertilization of the proposed land for agricultural activities.
Consequently, most of the study area is valid for construction purposes, taking into consideration the following precautions, as shown in Figure 11:
  • Excluding the floods and torrential paths, located in the south of the study area, and using them as open and garden areas to serve as breathable areas for the proposed new urban community.
  • Excluding the highly faulted area, as concluded by GPR techniques, in the middle of the study area.
  • Engineering treatment of the old quarrying areas, as depicted by the seismic refraction survey, in the northwest of the study area.

6. Conclusions

The current research is directly related to Goal 11 of the SDGs (Sustainable Development Goals), which focuses on the optimal land use planning of the new Sohage city, excluding all the associated geological, environmental, and geophysical risks and aiming at future safety, resilience, and sustainability.
In this paper, electrical resistivity tomography, seismic refraction, and ground penetrating radar in addition to the available geological outcropping and geophysical information were carefully integrated to provide a clear image of the subsurface stratigraphic setting, the water-bearing formations, and the affecting structural elements in the studied area.
The main subsurface geological section was revealed, in which there is a clear lateral variation in the thickness and lithology of the alluvial deposits. The most generic subsurface model can be described as follows: variable wadi-fill deposits due to the variation of flooding nature of the Nile River over the past millions of years, with an average thickness of 4.1 m; wet sand with intercalations of silt and clay, with an average thickness of 9.2 m; and the model ends with the highly saturated sand and gravel deposits, which represent the groundwater aquifer throughout the studied area.
The optimal land-use plan of the study area was prepared, which aims to maximize the benefits of natural resources of cultivated lands and elevated clay deposits as a source for reclamation and natural fertilization of the proposed land for agricultural activities, and to preserve the groundwater aquifer from environmental hazards. It also excludes the floods and torrential paths in the south of the study area and the highly faulted area in the middle of the study area from the plan of the construction activities. In addition, the plan includes the engineering treatment of the old quarrying areas in the northwest of the study area.
The integration of the applied geophysical techniques (ERT, SR, and GPR) has proven to be effective in preparing the optimal land-use plan for the new extension of Sohag City and is considered the driving force in future planning, enhancing the developmental process for the whole community.

Funding

This research received no external funding.

Institutional Review Board Statement

Not applicable.

Informed Consent Statement

Not applicable.

Data Availability Statement

The data used to support the findings of this study are available from the author upon request.

Conflicts of Interest

The author declares no conflicts of interest.

References

  1. Fahmi, W.; Sutton, K. Greater Cairo’s Housing Crisis: Contested Spaces from Inner City Areas to New Communities. J. Cities 2008, 25, 277–297. [Google Scholar] [CrossRef]
  2. AbdelMaksoud, K.M.; Al-Metwaly, W.M.; Ruban, D.A.; Yashalova, N.N. Geological Heritage Under Strong Urbanization Pressure: El-Mokattam and Abu Roash as examples from Cairo, Egypt. J. Afr. Earth Sci. 2018, 141, 86–93. [Google Scholar] [CrossRef]
  3. El Araby, M. Urban Growth and Environmental Degradation: The Case of Cairo, Egypt. J. Cities 2002, 19, 389–400. [Google Scholar] [CrossRef]
  4. FAO. Guidelines for Land Use Planning; FAO: Rome, Italy, 1993; Available online: https://www.fao.org/4/t0715e/t0715e00.htm (accessed on 20 January 2025).
  5. FAO. Land Resource Planning for Sustainable Land Management; Land and Water Division Working Paper; FAO: Rome, Italy, 2017. [Google Scholar]
  6. Osman, M. Population Situation Analysis; Cooperation between UNFPA, Bassera Center, and National Population Council. 2016. Available online: https://egypt.unfpa.org/en/publications/population-situation-analysis-egypt-2016-report (accessed on 20 January 2025).
  7. Aly, H.Y.; Hamed, A.F.; Mohammed, N.A. Depression Among the Elderly Population in Sohag Governorate. Saudi Med. J. 2018, 39, 185–190. [Google Scholar] [CrossRef]
  8. Ghazala, H.H.; Ibraheem, I.M.; Haggag, M.; Lamees, M. An Integrated Approach to Evaluate the Possibility of Urban Development Around Sohag Governorate, Egypt, Using Potential Field data. Arab. J. Geosci. 2018, 11, 194. [Google Scholar] [CrossRef]
  9. Bishnoi, L.; Basu, P.C. Siting of Nuclear Installations. Nucl. India 2005, 38, 8–10. [Google Scholar]
  10. Oyediran, A.; Falae, P.O. Integrated Geophysical and Geotechnical Methods for Pre-Foundation Investigations. J. Geol. Geophys. 2018, 8, 453. [Google Scholar] [CrossRef]
  11. Benjumea, B.; Gabàs, A.; Macau, A.; Figueras, S.; Bellmunt, F. Application of Geophysical Techniques to Support Geological Mapping Projects. Spec. Top. Near Surf. Geosci. 2016, 34, 35–40. [Google Scholar] [CrossRef]
  12. Whiteley, R.J.; Stewart, S.B. Engineering Geophysics in Australia: Urban Case Studies from Downunder. In Proceedings of the 21st EEGS Symposium on the Application of Geophysics to Engineering and Environmental Problems, Philadelphia, PA, USA, 6–10 April 2008. [Google Scholar] [CrossRef]
  13. Deiana, R.; Bonetto, J.; Mazzariol, A. Integrated Electrical Resistivity Tomography and Ground Penetrating Radar Measurements Applied to Tomb Detection. Surv. Geophys. 2018, 39, 1081–1105. [Google Scholar] [CrossRef]
  14. Drahor, M.G.; Berge, A.M.; Öztürk, C. Integrated Geophysical Surveys for the Subsurface Mapping of Buried Structures Under and Surrounding of the Agios Voukolos Church in İzmir, Turkey. J. Archaeol. Sci. 2011, 38, 2231e2242. [Google Scholar] [CrossRef]
  15. Lee, S.C.H.; Noh, K.A.M.; Zakariah, M.N.A. High-Resolution Electrical Resistivity Tomography and Seismic Refraction for Groundwater Exploration in Fracture Hard Rocks: A Case Study in Kanthan, Perak, Malaysia. J. Asian Earth Sci. 2021, 218, 104880. [Google Scholar] [CrossRef]
  16. El-Gamilli, M. Geological and Geophysical Studies on Wadi El-Assuity Area, Eastern Desert, Egypt. Master’s Thesis, Assuit University, El Fateh, Egypt, 1964. [Google Scholar]
  17. Youssef, M.I. Structural Pattern of Egypt and its Interpretation. AAPG Bull. 1968, 52, 601–614. [Google Scholar]
  18. Senosy, M.M. Verification of the Qena Assiut Sedimentary Basin by Gravity Data. Egypt. J. Geol. 1997, 41, 797–816. [Google Scholar]
  19. Mahmoud, F.A. Subsurface Geological Conditions, as Deduced from Gravity and Magnetic Data in the Area East of El-Balyana, Sohag, Egypt. Master’s Thesis, South Valley University, Qena, Egypt, 1999. [Google Scholar]
  20. El-Emam, A.E. Geophysical Study Around the Epicenter of Earthquake of 1 May 1999, Sohag, Western Desert, Egypt. Master’s Thesis, El-Mansoura University, Mansoura, Egypt, 2002. [Google Scholar]
  21. Badawy, A.; Abdel-Monem, S.M.; Sakr, K.; Ali, S.M. Seismicity and Kinematic Evolution of Middle Egypt, National Research Institute of Astron and Geophysics, Helwan, Cairo. Egypt. J. Geodyn. 2006, 42, 28–37. [Google Scholar] [CrossRef]
  22. Shahid, S. Impact of Climate Change on Irrigation Water Demand of Dry Season Boro Rice in Northwest Bangladesh. Clim. Chang. 2011, 105, 433–453. [Google Scholar] [CrossRef]
  23. Bishay, Y. Biostratigraphic Study of the Eocene in the Eastern Desert between Samalut and Assiut by the Large Foraminifera; S N Publisher: Delhi, India, 1961. [Google Scholar]
  24. Bishay, Y. Studies on the Large Foraminifera of the Eocene (The Nile Valley between Assiut and Cairo and SW Sinai). Ph.D. Thesis, Alexandria University, Bab Sharqi, Egypt, 1966. [Google Scholar]
  25. El Naggar, Z. On a Proposed Lithostratigraphic Stratigraphic Subdivision for the Late Cretaceous-Early Paleogene Succession in the Nile Valley Egypt. In Proceedings of the 7th Arab Petroleum Congress Kuwait, Kuwait City, Kuwait, 16–22 March 1970. [Google Scholar]
  26. Attia, A. Parameter and Characteristics of the Groundwater Reservoir in Upper Egypt. Master’s Thesis, Faculty of Engineering, Cairo University, Al Giza, Egypt, 1974. [Google Scholar]
  27. Farrag, A.A. Hydrogeological Studies on the Quaternary Water-Bearing Sediments in the Area Between Assiut and Aswan. Master’s Thesis, Faculty of Science, Assiut University, El Fateh, Egypt, 1982. [Google Scholar]
  28. Omer, A. Geological, Mineralogical and Geochemical Studies on the Neogene and Quaternary Nile Basin Deposits, Qena-Assiut Stretch, Egypt. Ph.D. Thesis, Geology Department, Faculty of Science, South Valley University, Sohag, Egypt, 1996. [Google Scholar]
  29. Sheleby, A.; Said, M.; Eid, M. Paleogene Lithostatigraphy of the Area West of the Nile Valley between Qena and South Assiut. Annu. Geol. Surv. Egypt 2000, 23, 563–578. [Google Scholar]
  30. Omran, A.A.; Korany, E.A.; Abdel-Rahman, A.A. An Integrated Approach to Evaluate Groundwater Potentiality—A Case Study. In Proceedings of the 3rd International Conference of Applied Geophysical, Gniew, Poland, 21–23 June 2017. [Google Scholar]
  31. RIGW. Hydrogeological map of Egypt, 1st ed.; Scale 1:2000,000; Research Institute for Groundwater, Ministry of Public Works and Water Resources: Cairo, Egypt, 1989. [Google Scholar]
  32. Ismail, E.A.O. Environmental Investigations in the West Tahta Region, Upper Egypt: A Hydrogeochemical, Geophysical and Remote Sensing Study; Montanuniversität Leoben: Leoben, Austria, 2013. [Google Scholar]
  33. Fkirin, M.A.; Badawy, S.; El deery, M.F. Seismic Refraction Method to Study Subsoil Structure. J. Geol. Geophys. 2016, 5. [Google Scholar] [CrossRef]
  34. Davis, J.L.; Annan, A.P. Ground Penetrating Radar for High Resolution Mapping of Soil and Rock Stratigraphy. Geophys. Prospect. 1989, 37, 531–551. [Google Scholar] [CrossRef]
  35. Loke, M.H. Geoelectrical Imaging 2D & 3D, Rapid 2-D Resistivity & IP Inversion Using the Least-Squares Method; Geometrics Inc.: San Jose, CA, USA, 1999. [Google Scholar]
  36. Hagedoorn, J.G. The Plus-Minus Method of Interpreting Seismic Refraction Sections. Geophysical Prospecting. Geophys. Prospect. 1959, 7, 158–182. [Google Scholar] [CrossRef]
  37. Van Overmeeren, R.A. Hagedoorn’s plus-minus method: The beauty of simplicity. Geophys. Prospect. 2001, 49, 687–696. [Google Scholar] [CrossRef]
  38. Mitchum, R.M., Jr.; Vail, P.R.; Sangree, J.B. Seismic Stratigraphy and Global Changes of Sea Levels: Part 6. Stratigraphic Interpretation of Seismic Reflection Patterns in Depositional Sequences. In Seismic Stratigraphy–Applications to Hydrocarbon Exploration: AAPG Memoir; Payton, C.E., Ed.; AAPG: Tulsa, OK, USA, 1977; Volume 26, pp. 117–133. [Google Scholar]
  39. El Bastawesy, M.; Faid, A.; El Gammal, E.S. The Quaternary development of tributary channels to the Nile River at Kom Ombo area, Eastern Desert of Egypt, and their implication for groundwater resources. Hydrol. Process. 2010, 24, 1856–1865. [Google Scholar] [CrossRef]
  40. Abdelshafy, M.; Saber, M.; Abdelhaleem, A.; Abdelrazek, S.M.; Seleem, M. Hydrogeochemical Processes and Evaluation of Groundwater Aquifer at Sohag city, Egypt. Sci. Afr. 2019, 6, e00196. [Google Scholar] [CrossRef]
  41. De Wet, A.R.; Sternberg, R.; Winick, J. Interpreting Land-Use History by Integrating Aerial Photographs, Near-Surface Geophysics, and Field Observations Into a Digital Database. Environ. Eng. Geosci. 1999, V, 235–254. [Google Scholar] [CrossRef]
  42. Odgaard, M.V.; Dalgaard, T.; Bøcher, P.K.; Svenning, J. Site-specific modulators control how geophysical and socio-technical drivers shape land use and land cover. Geo Geogr. Environ. 2018, 5. [Google Scholar] [CrossRef]
  43. Molinari, C.; Menozzi, B.I.; Montanari, C.; Branch, N.; Stagno, A.M. Multidisciplinary approach for reconstructing past local land-use practices: Two case studies from the Ligurian Apennines, north-western Italy. Holocene 2025. [Google Scholar] [CrossRef]
  44. Liu, L.; Chan, L.S. Sustainable urban development and geophysics. J. Geophys. Eng. 2007, 4, 243. [Google Scholar] [CrossRef]
  45. Darul, A.; Irawan, D.E.; Agustine, E. Geophysics for the environment in Indonesia. F1000Research 2024, 13, 131. [Google Scholar] [CrossRef]
  46. Lapenna, V. Resilient and Sustainable Cities of Tomorrow: The Role of Applied Geophysics. Boll. Geofis. Teor. Appl. 2017, 58, 237–251. [Google Scholar] [CrossRef]
  47. Rana, S.; Mishra, V.N.; Rai, P.K. Applications of Geophysics in Structural and Geotechnical Engineering. In Best Practices in Geotechnical and Pavement Engineering; Kolathayar, S., Vinod Chandra Menon, N., Sreekeshava, K.S., Eds.; Lecture Note in Civil Engineering; Springer: Singapore, 2023; p. 449. [Google Scholar] [CrossRef]
  48. Locurcio, M.; Tajani, F.; Anelli, D. Sustainable Urban Planning Models for New Smart Cities and Effective Management of Land Take Dynamics. Land 2023, 12, 621. [Google Scholar] [CrossRef]
  49. Moreira, F.G.P.; Silva, L.E.C.; dos Santos, V.I.M. The Hidden Facets: Uncovering the Influence of Region on Social Housing Unit Distribution in Brazil. Buildings 2023, 13, 2208. [Google Scholar] [CrossRef]
  50. Omran, A.A. Integration of Remote Sensing, Geophysics and GIS to Evaluate Groundwater Potentiality—A Case Study in Sohag Region, Egypt. In Proceedings of the 3rd International Conference on Water Resources and Arid Environments (2008) and the 1st Arab Water Forum, Riyadh, Saudi Arabia, 16–19 November 2008. [Google Scholar]
Figure 1. Land resource planning as part of an integrated land resource decision-making process (modified after FAO, 2017 [5]).
Sustainability 17 03730 g001
Figure 2. Total population of Sohag governorate from 2004 to 2018 (Statistical Year Book—Population of Egypt, 2016, and Aly et al., 2018 [7]).
Sustainability 17 03730 g002
Figure 3. Subsurface stratigraphic columnar section of the Sohag area (adapted from [9] Bishnoi and Basu 2005).
Sustainability 17 03730 g003
Figure 4. Scheme of the applied methodology in the current research.
Sustainability 17 03730 g004
Figure 5. General geologic map of Sohag with respect to Egypt.
Sustainability 17 03730 g005
Figure 6. Samples of the iterated ERT models: (a) R1, (b) R2, and (c) R3.
Sustainability 17 03730 g006
Figure 7. Samples of geoseismic depth sections.
Sustainability 17 03730 g007
Figure 8. Contour map of the seismic velocity: (a) first layer and (b) second layer.
Sustainability 17 03730 g008
Figure 9. Samples of the interpreted GPR profiles: (a) GPR-01, (b) GPR-02.
Sustainability 17 03730 g009
Figure 10. Depth to groundwater aquifer using GPR data.
Sustainability 17 03730 g010
Figure 11. Suggested land-use plan of the Sohag area.
Sustainability 17 03730 g011
Disclaimer/Publisher’s Note: The statements, opinions and data contained in all publications are solely those of the individual author(s) and contributor(s) and not of MDPI and/or the editor(s). MDPI and/or the editor(s) disclaim responsibility for any injury to people or property resulting from any ideas, methods, instructions or products referred to in the content.

