

Analysis of Heavy Metal Sources and Sustainability: Human Health Risk Assessment of Typical Agricultural Soils in Tianjin, North China Plain


Abstract
1. Introduction
2. Materials and Methods
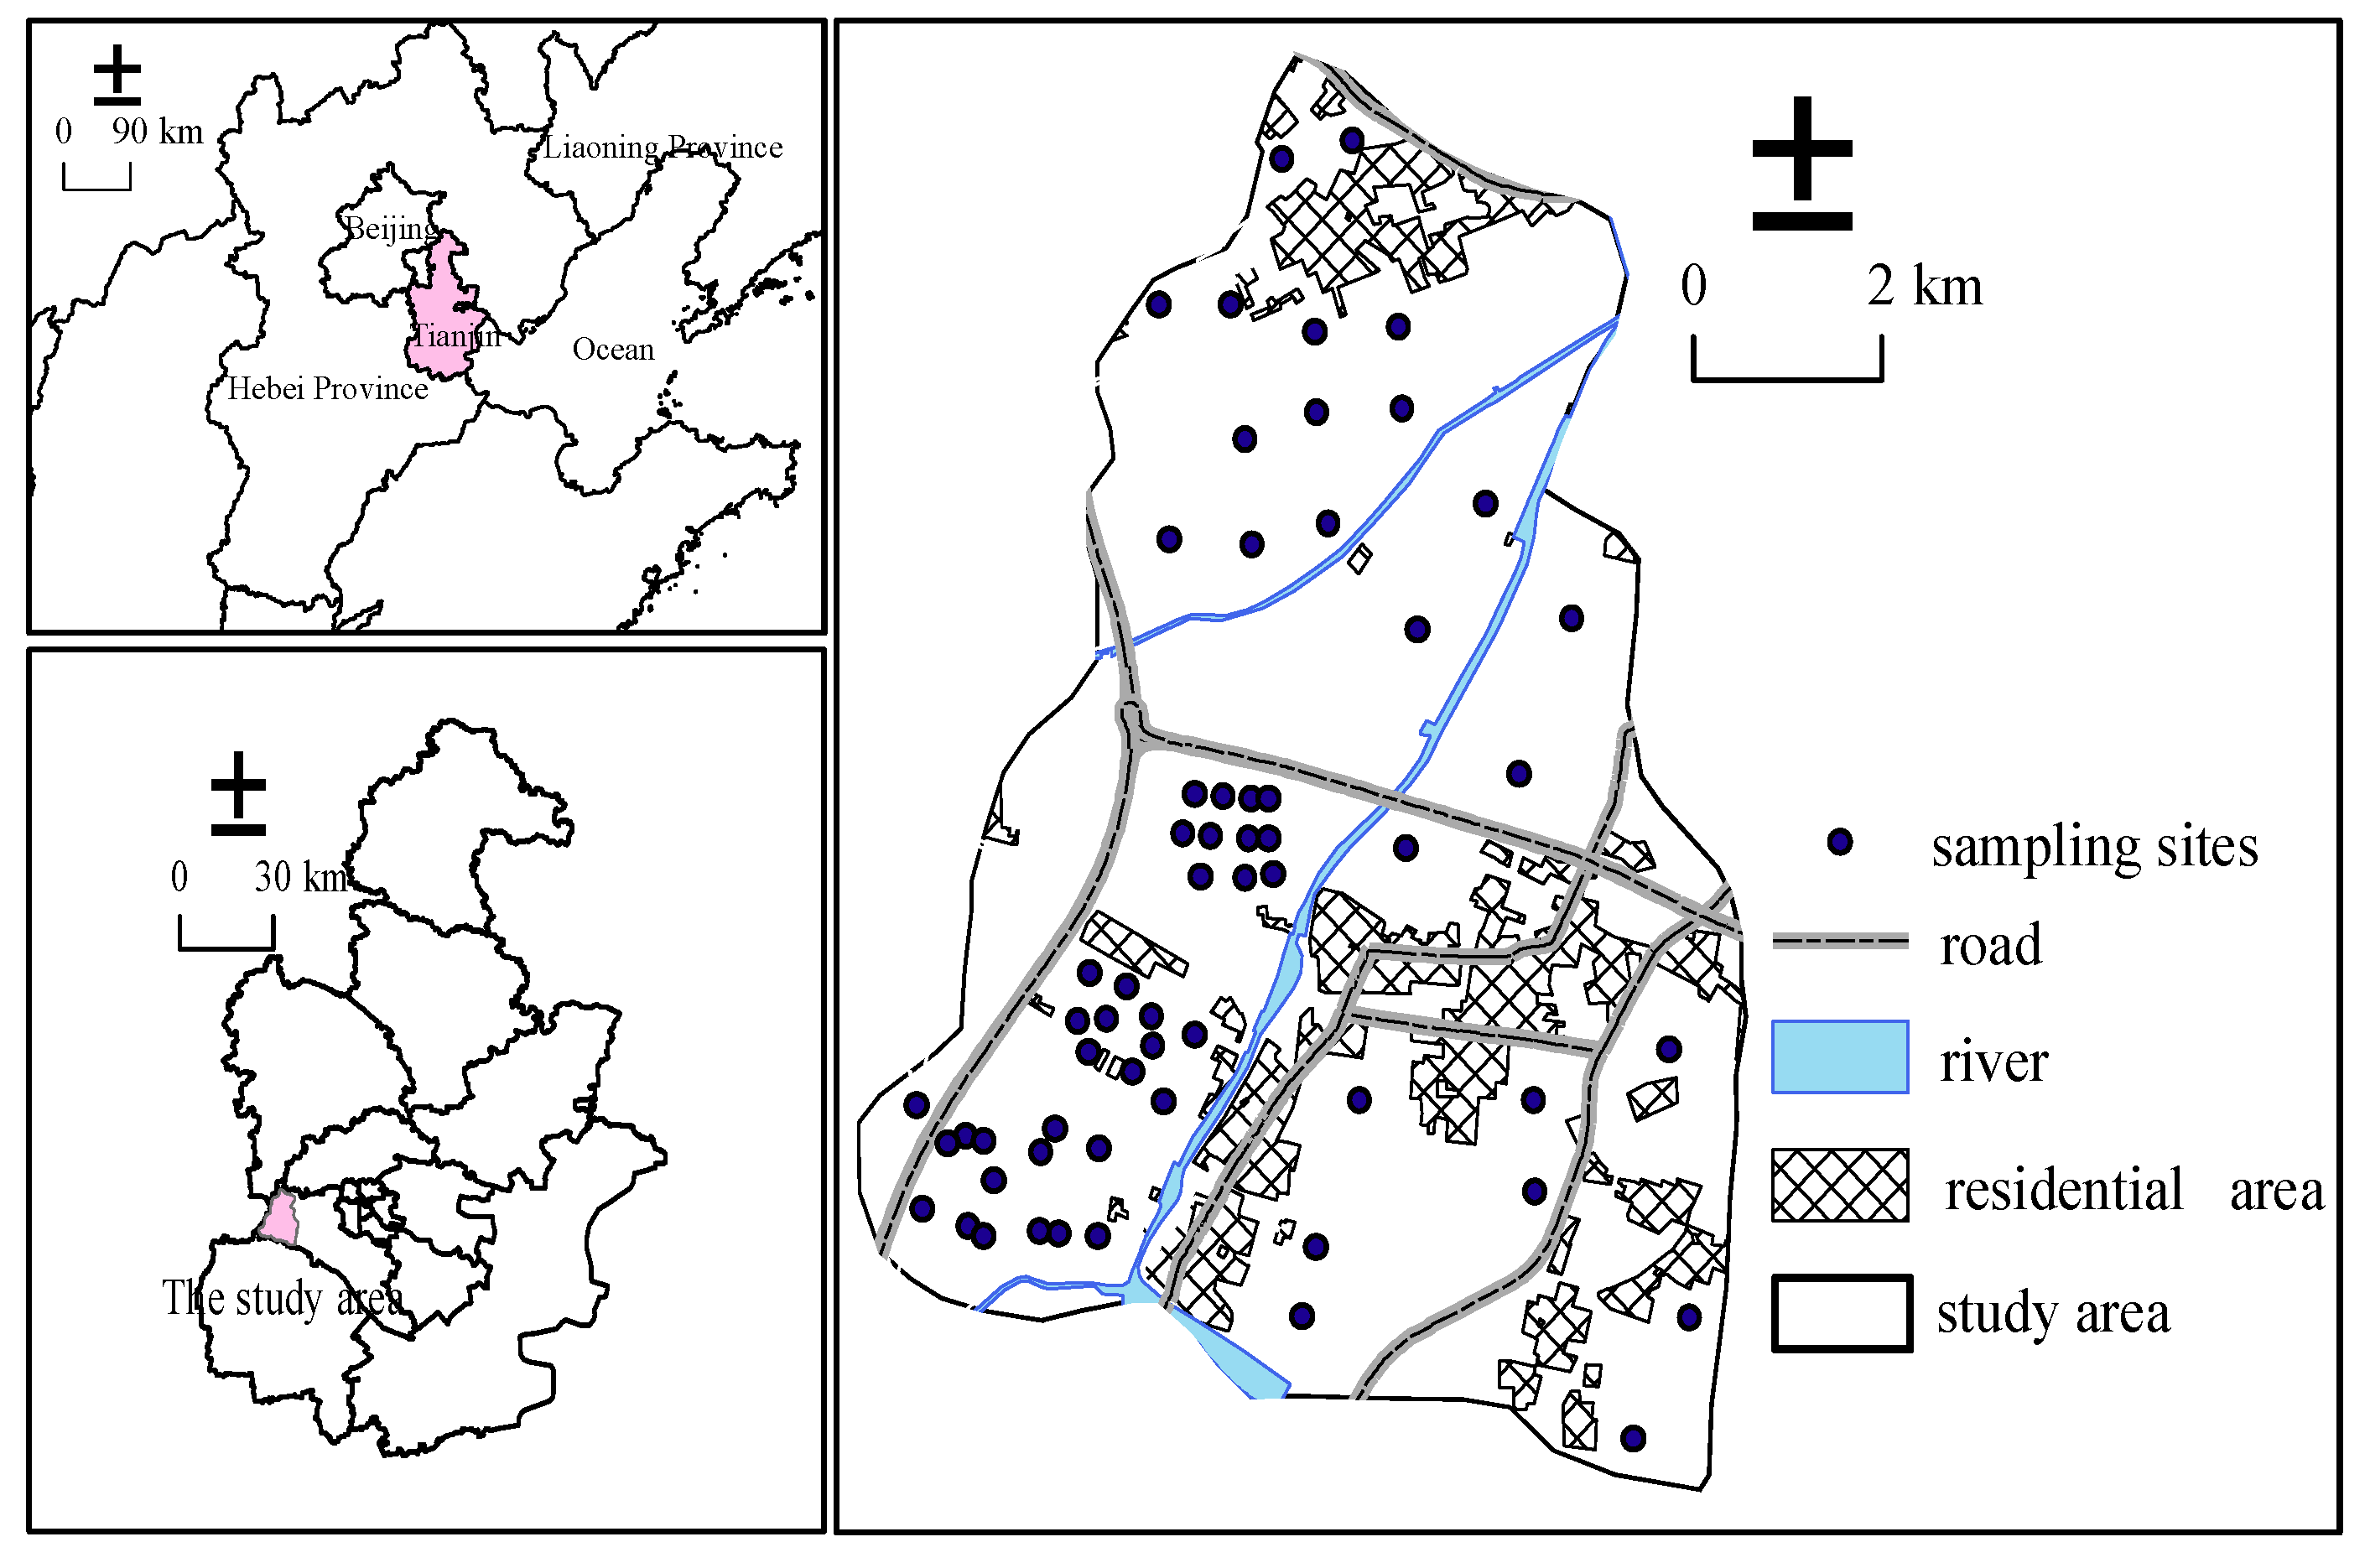
2.1. Study Area
2.2. Sampling and Analysis
2.3. Research Methods
2.3.1. Geo-Accumulation Index (Igeo)
2.3.2. Pearson Correlation Coefficient
2.3.3. Principal Component Analysis
2.3.4. APCS–MLR Model
2.3.5. PMF Model
2.3.6. Comparison Between Two Models
2.3.7. Health Risk Assessment
3. Results and Discussion
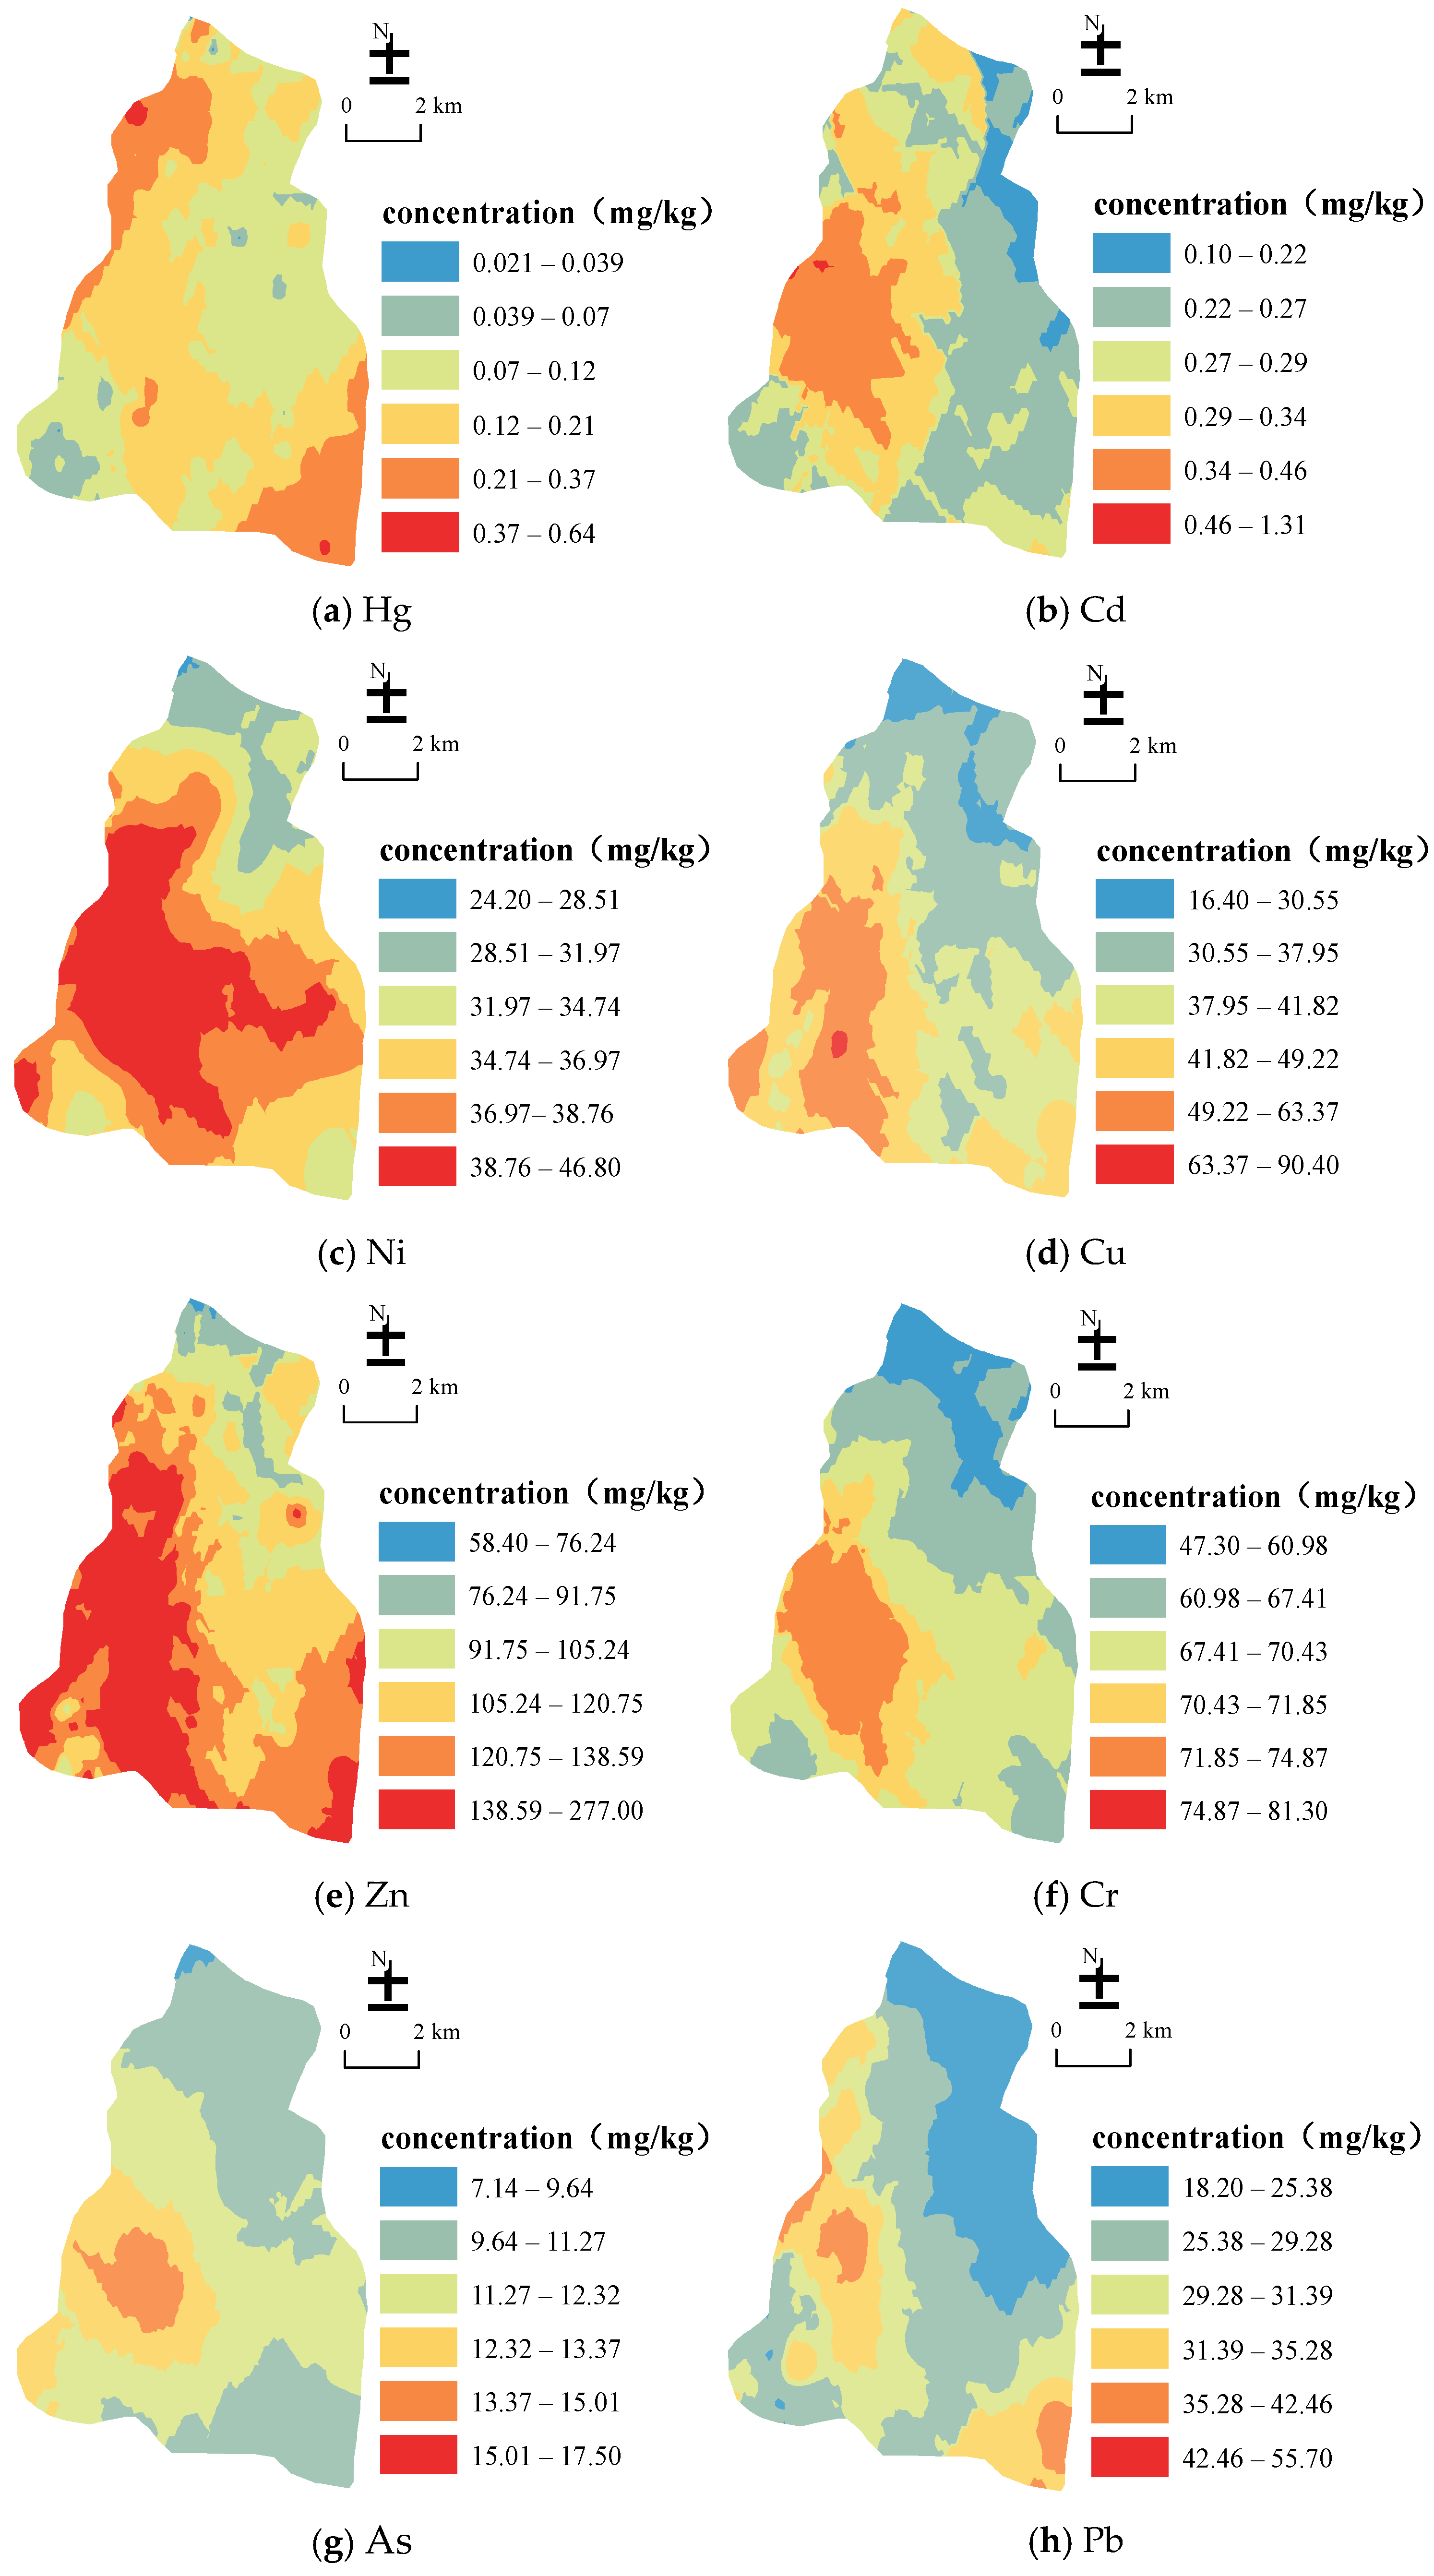
3.1. Characteristics Analysis of Heavy Metal Content in Soil
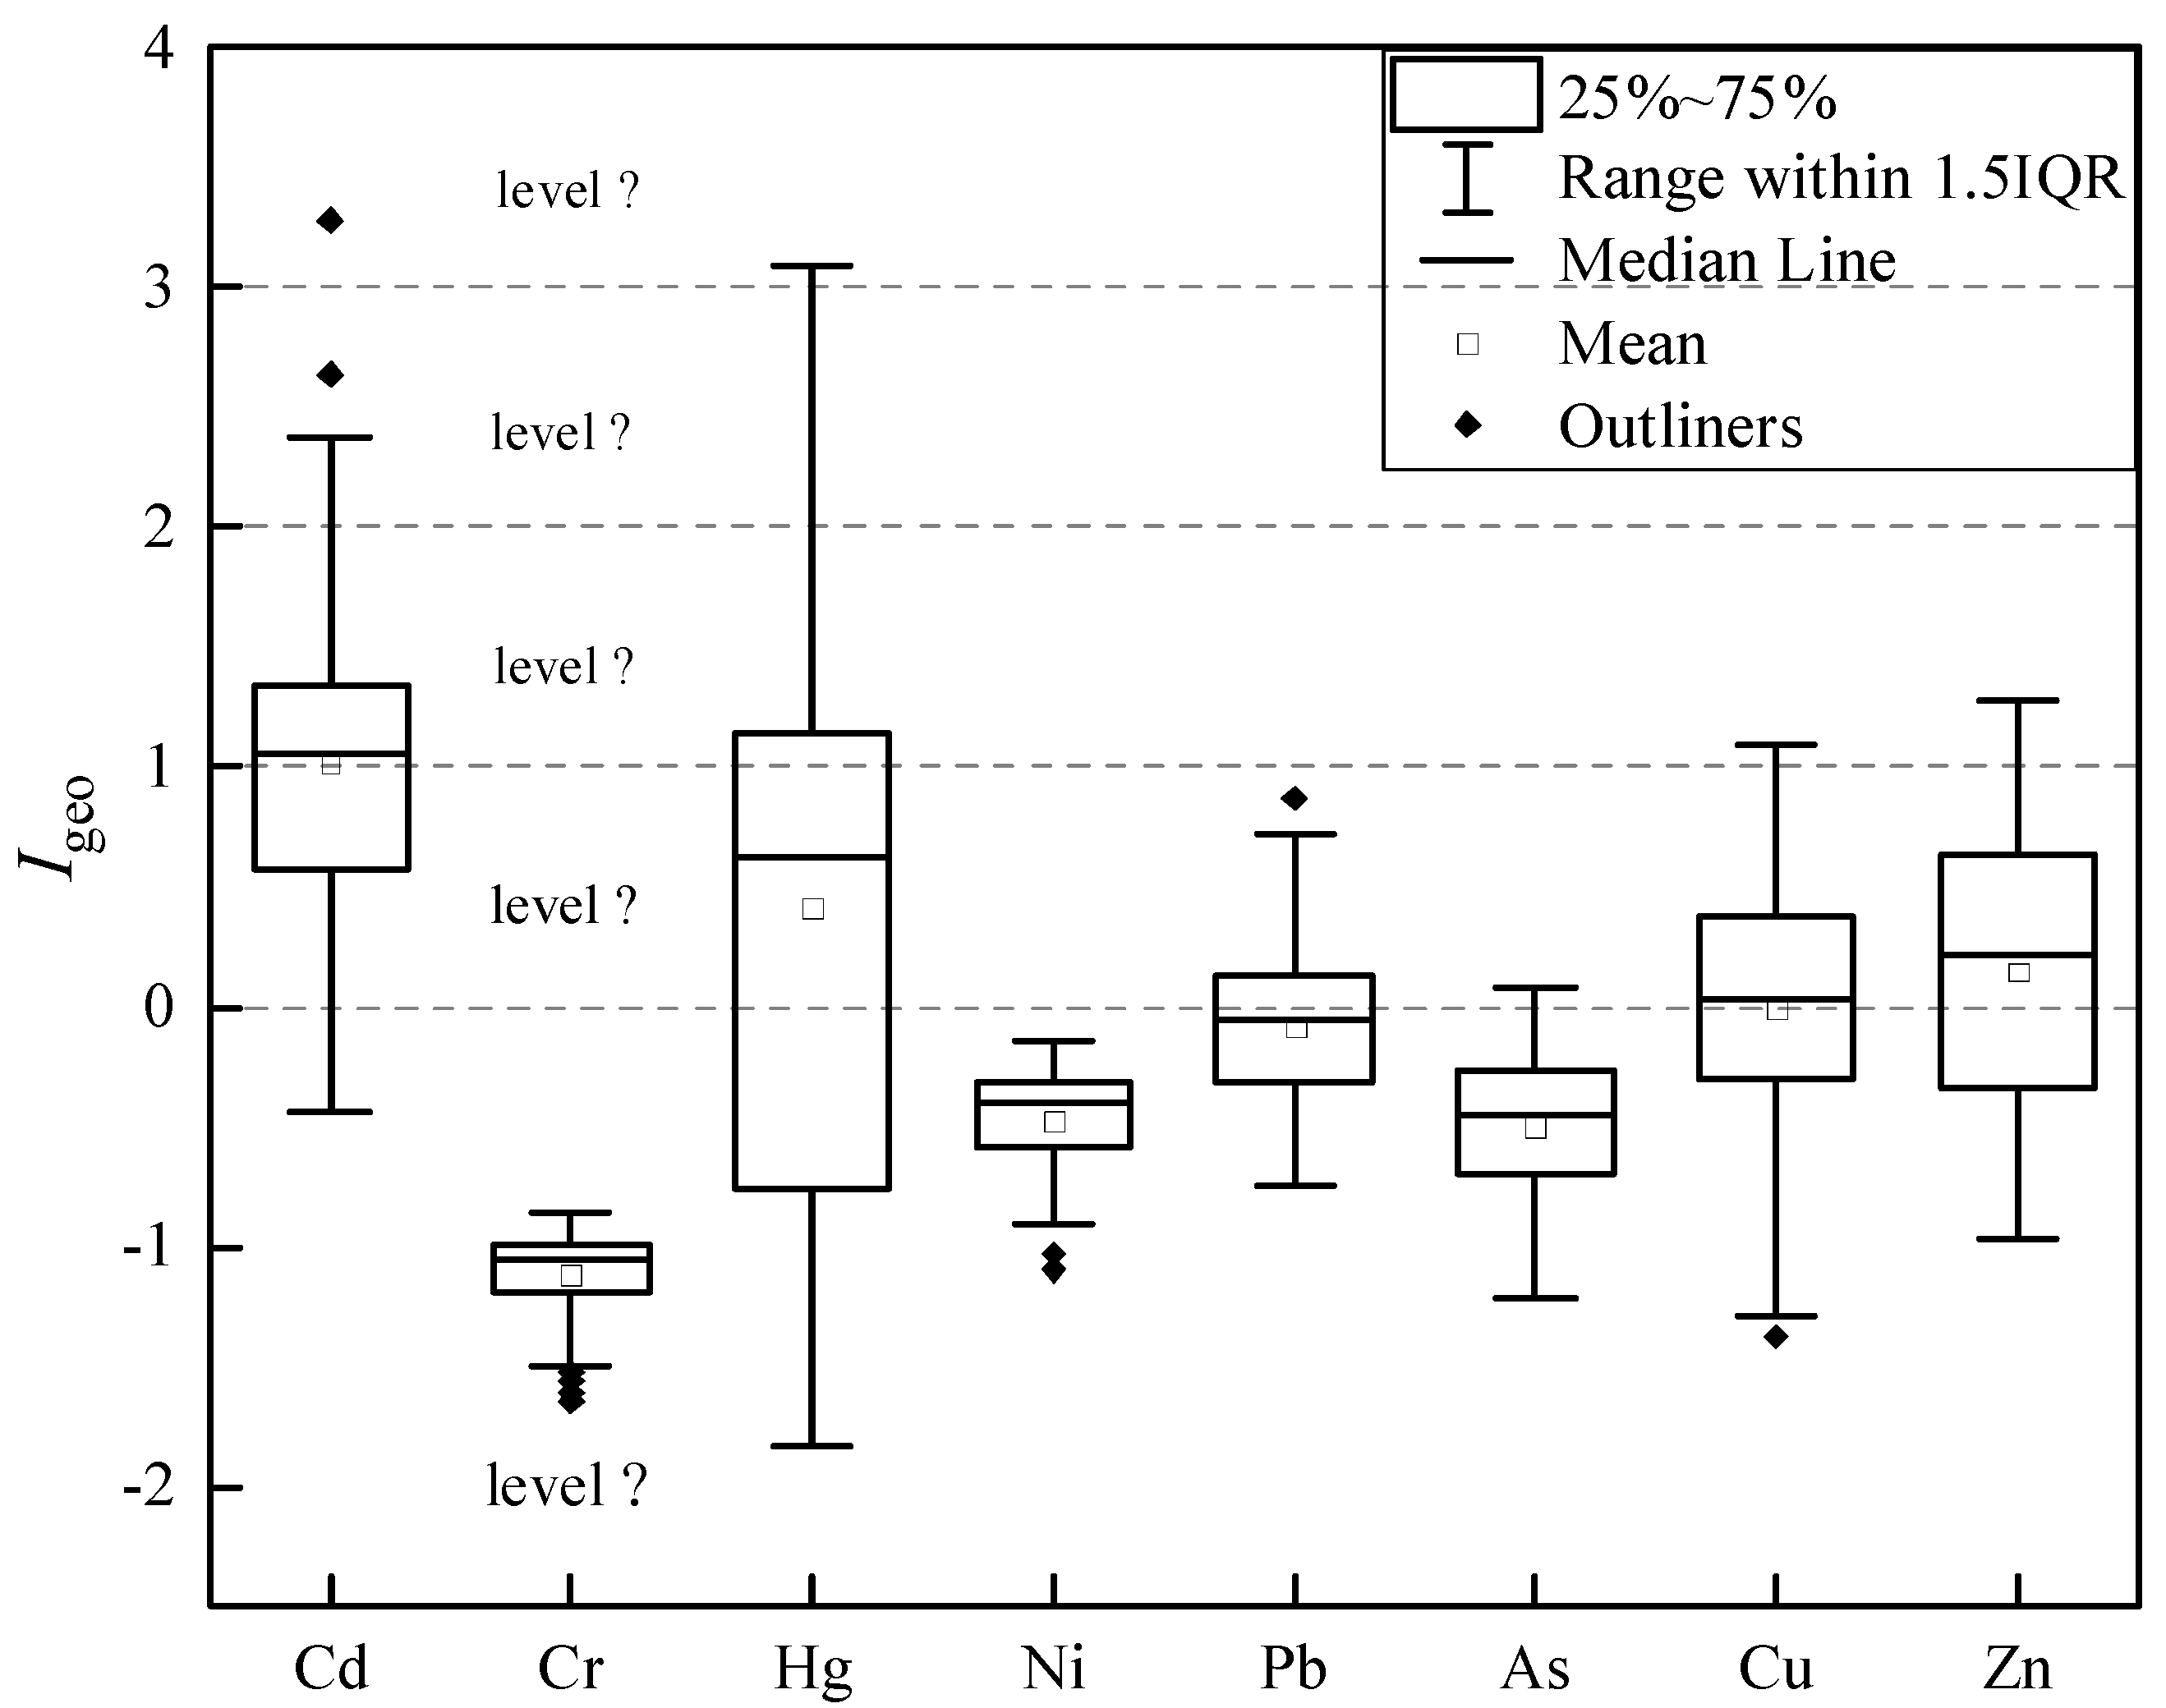
3.2. The Geo-Accumulation Indices (Igeo)
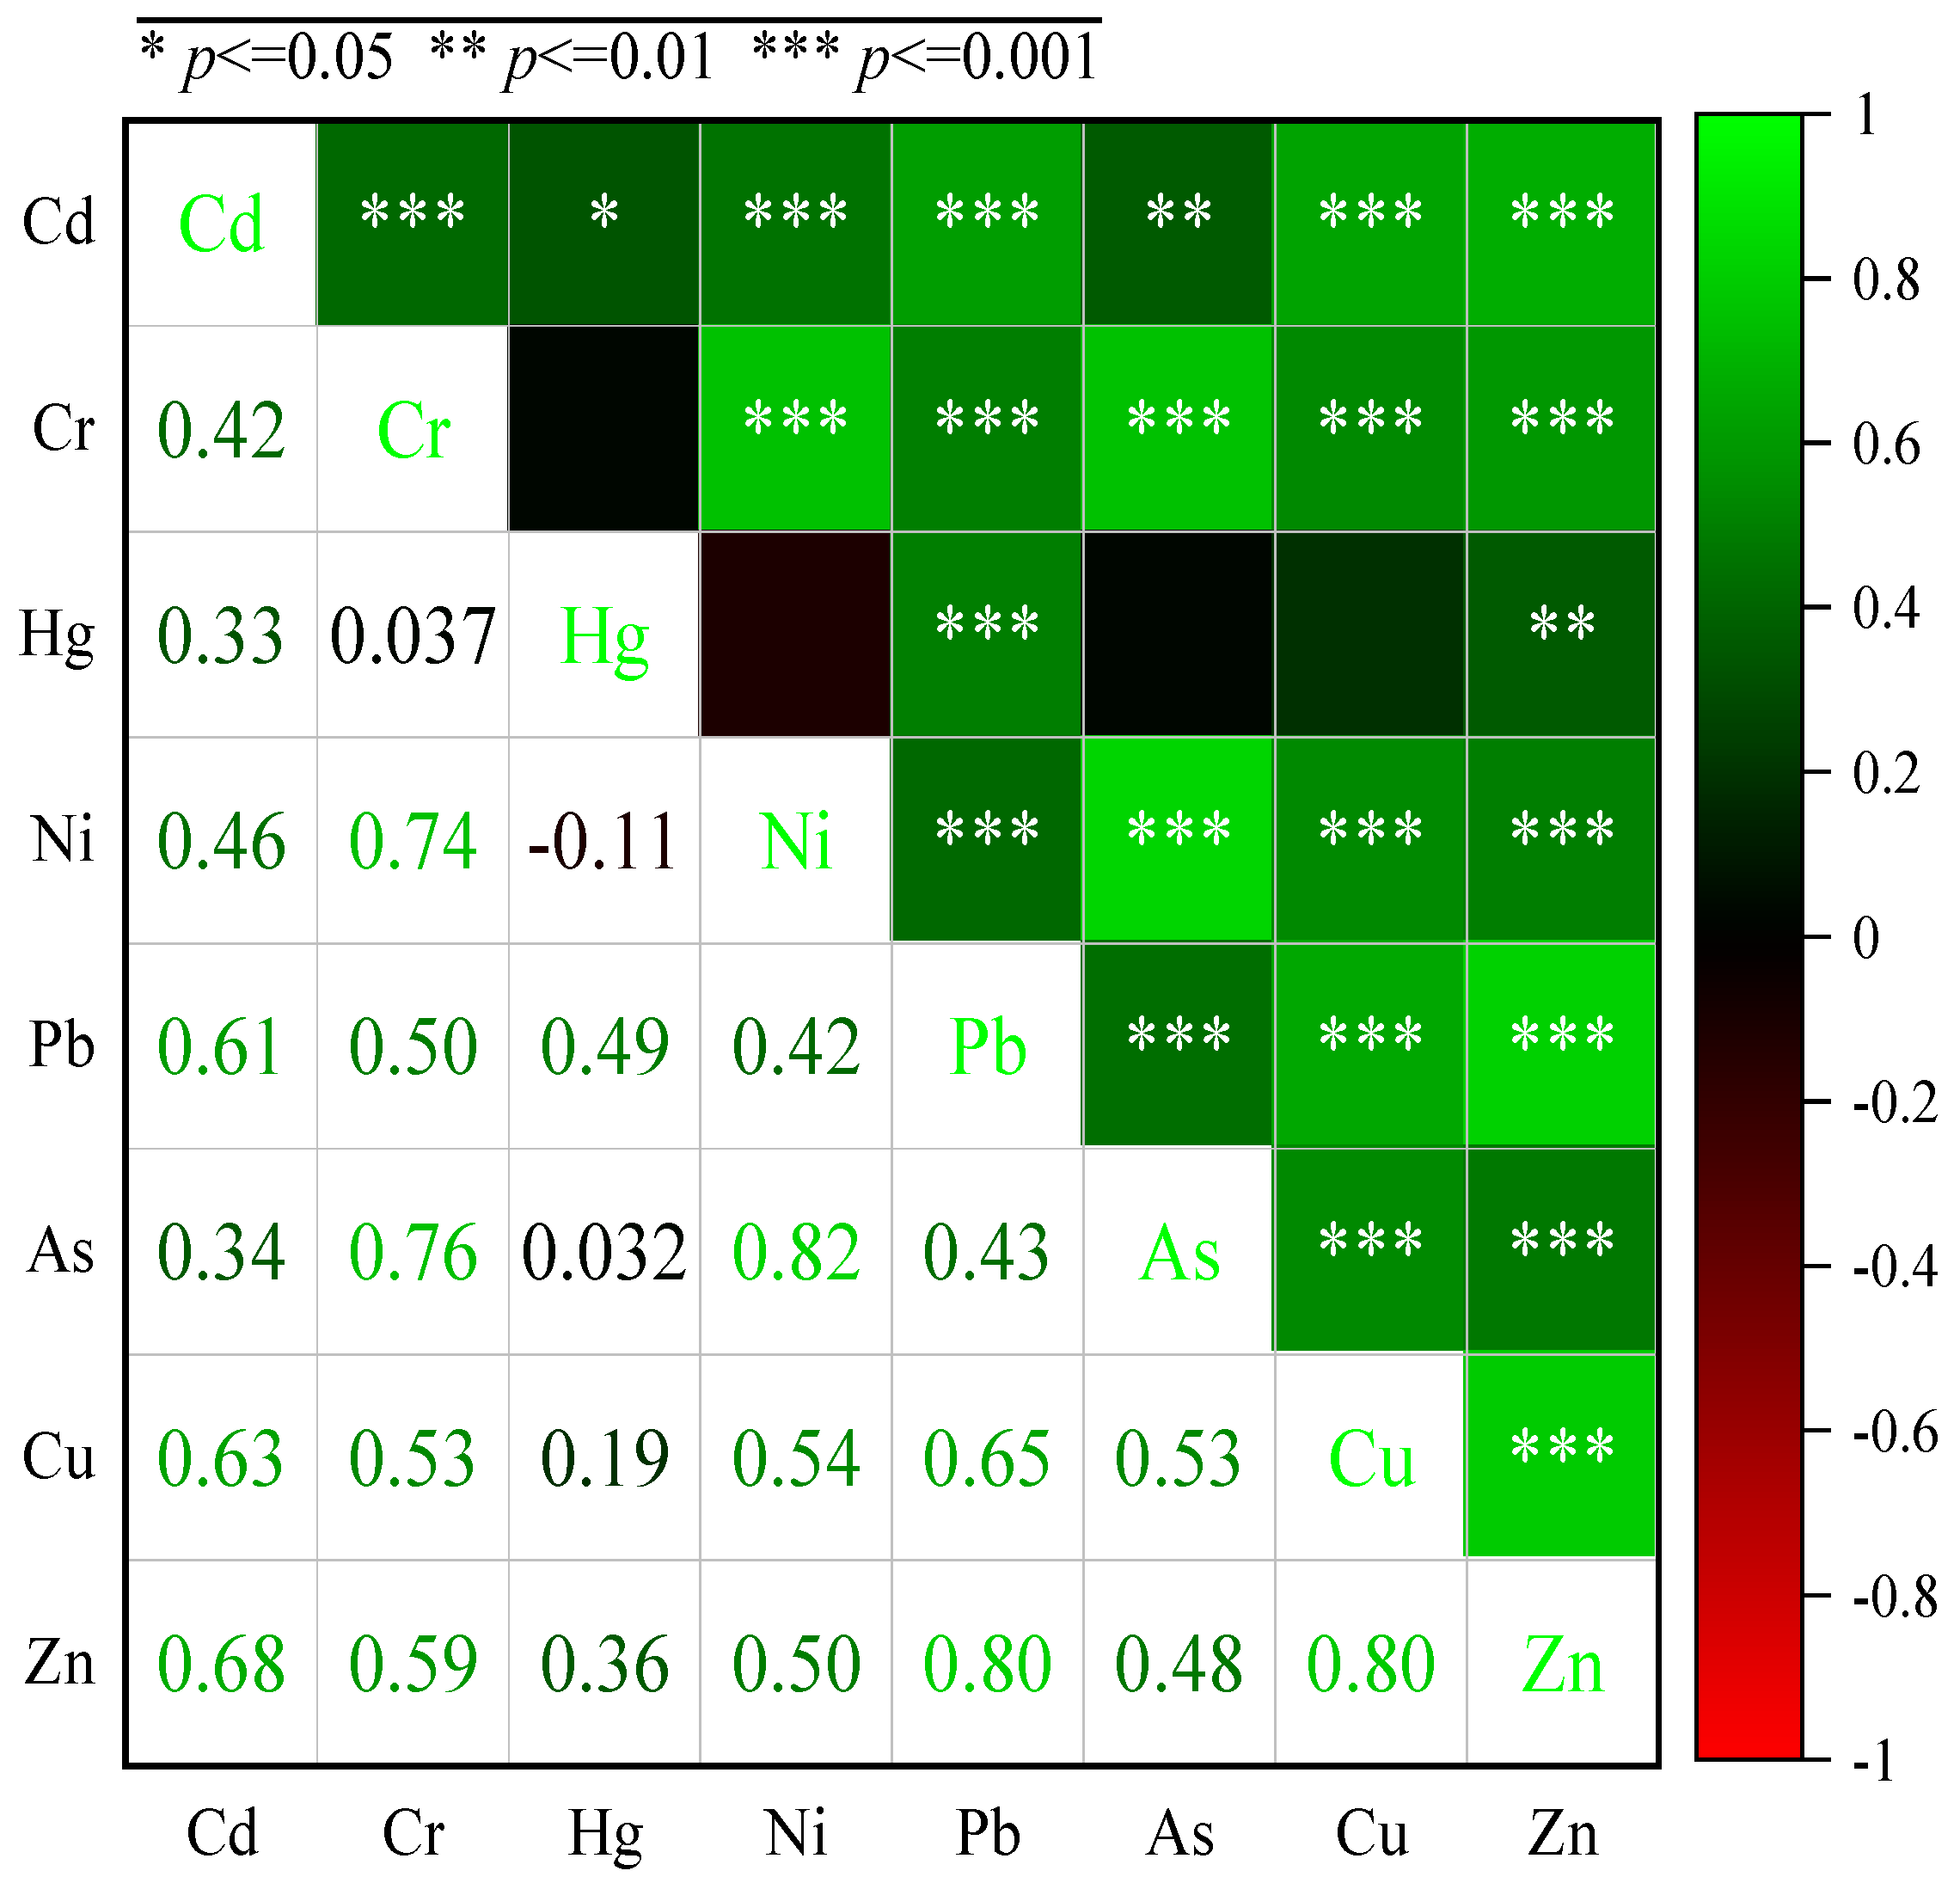
3.3. Correlation Analysis of Heavy Metal Interactions
3.4. Principal Component Analysis
3.5. APCS–MLR Model
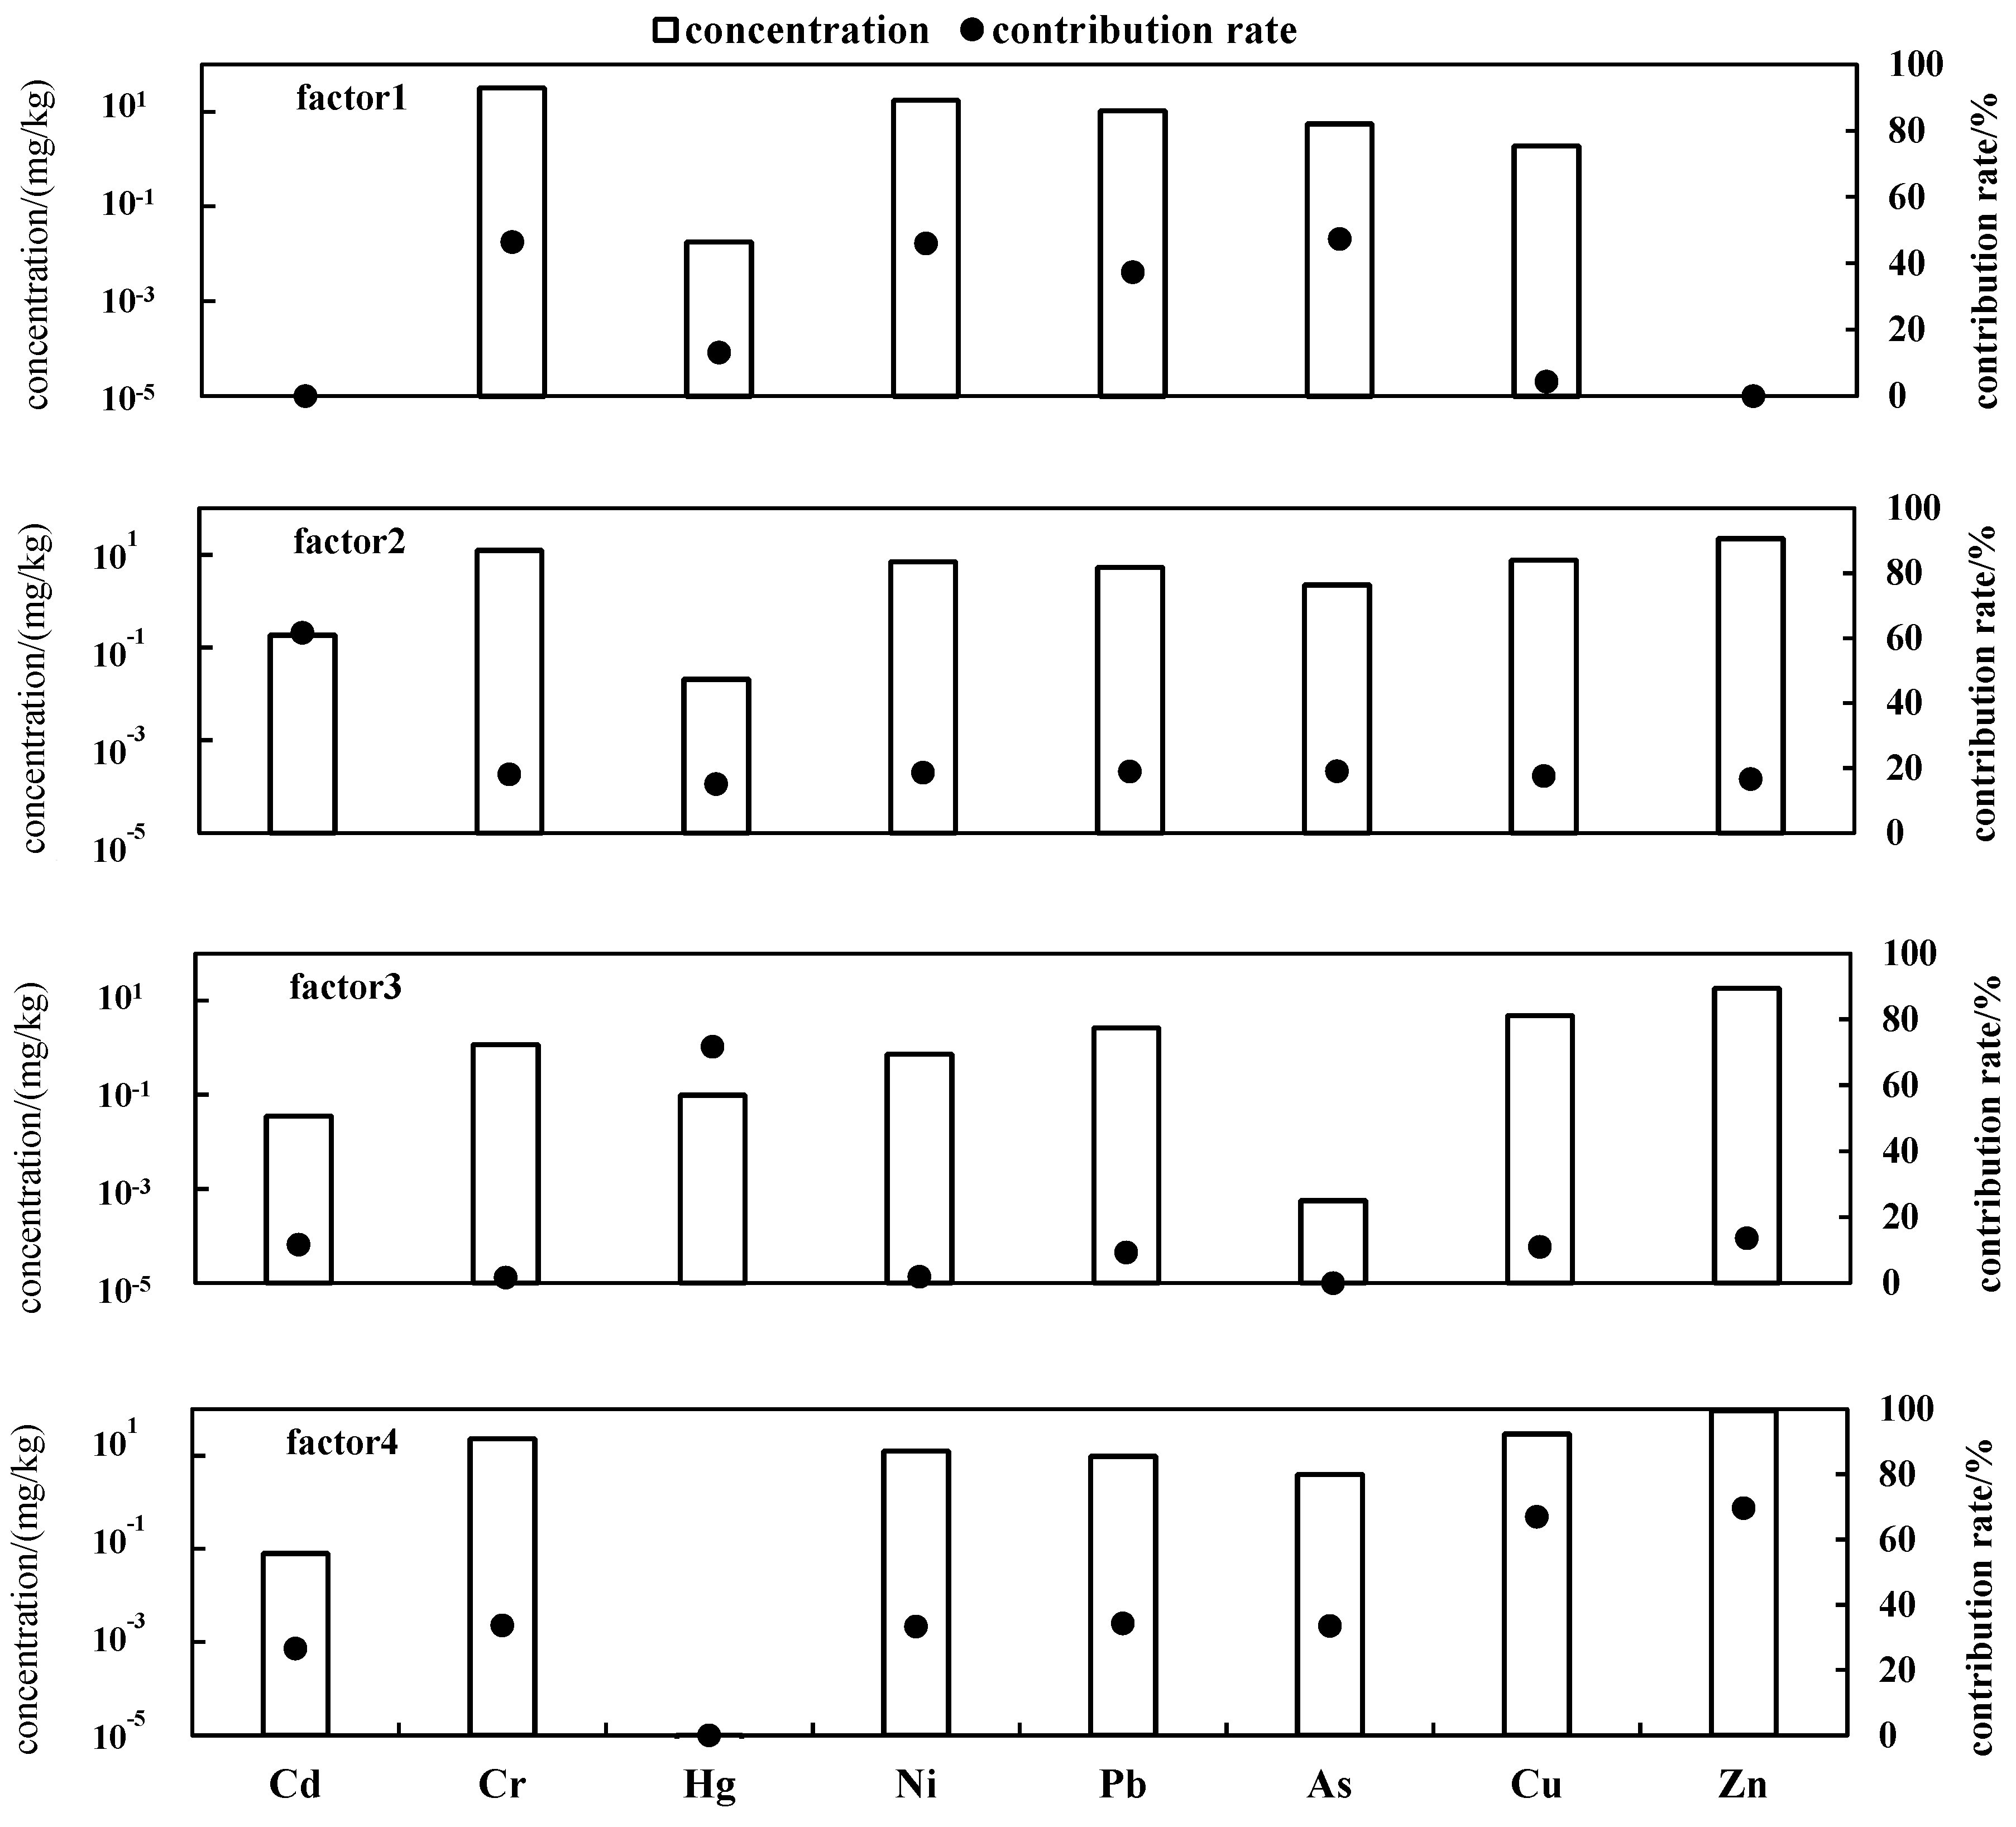
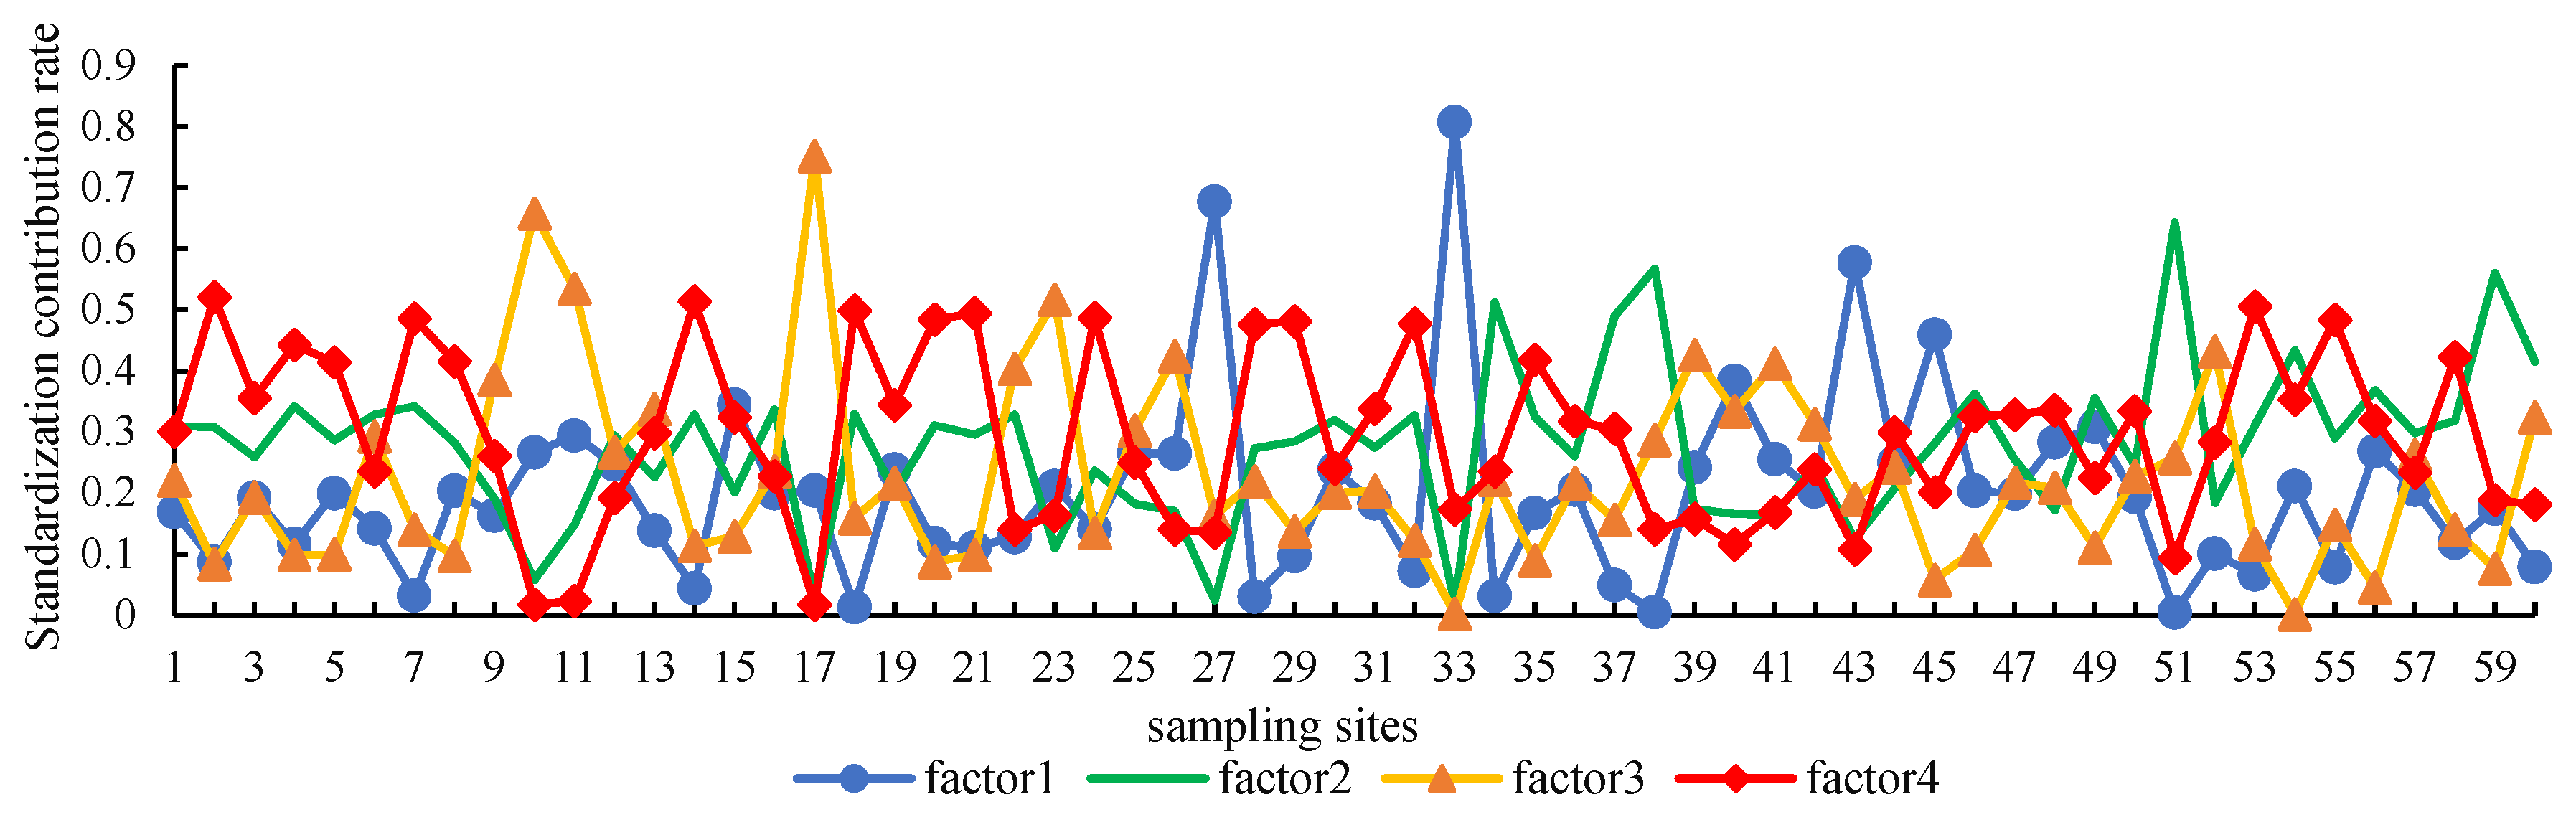
3.6. PMF Analysis
3.7. Comparison of APCS–MLR Model and PMF Model
3.8. Health Risk Assessment of Heavy Metals in Soil Based on PMF Model
4. Conclusions
- (1)
- Cd and Hg pollution were the most severe among the eight heavy metals in the study aera, with the average values exceeding the background by 151.9% and 324.1%, respectively. About 15% of the sites were at moderate to severe pollution levels. The geo-accumulation index average value of element Zn is 0.15 belonging to minor pollution level and the Igeo average values of the other elements belong to no pollution level.
- (2)
- The results of correlation analysis, PCA, APCS–MLR, and PMF showed the sources of heavy metals in the study area are natural sources, mixed sources of agriculture and transportation, coal combustion sources, and pesticide sources. Compared with APCS–MLR, the PMF model is more appropriate for the analysis of heavy metal sources in the study area. The elements Cr, Ni, Pb, and As mainly come from natural source with the proportion of 24.4%; the element Cd mainly comes from pesticide source with the proportion of 23.3%; the element Hg mainly comes from coal combustion source with the proportion of 15.1%; the elements Cu and Zn mainly come from mixed source of agriculture and transportation with the proportion of 37.3%.
- (3)
- The health risk assessment model shows the HI values of heavy metals for children and adults are 0.781 and 0.100, respectively, which means the absence of obvious non-carcinogenic risk in the three pathways: ingestion of crops, hand-to-mouth ingestion, skin contact, and the HI values of all elements are sorted by As > Cr > Pb > Ni > Cu > Hg > Zn > Cd. The TCR values for adults and children are 2.43 × 10⁻⁵ and 1.90 × 10⁻⁴, respectively, which means the total carcinogenic risk is caused by heavy metals. The CR value of As for children is more than 1 × 10⁻⁴, indicating the carcinogenic risk in this region is mainly caused by element As.
- (4)
- The results of the PMF model show the TCR value of natural source is the highest, with Cr being the main contributor to the childhood maximum total non-carcinogenic risk indices (HI) and childhood TCR in the source contribution. The HI value in the pesticide source (1.08 × 10⁻²) and the TCR value in the mixed source (6.96 × 10⁻⁶) of the element Cr are more significant than others. Hg contributes the most to coal combustion sources, and the contribution of HI (Cu, Zn) is in the mixed source of agriculture and transportation.
Author Contributions
Funding
Institutional Review Board Statement
Informed Consent Statement
Data Availability Statement
Conflicts of Interest
References
- Liu, Q.; Wang, S.; Zhou, J.; Bao, L.; Zhou, W.; Zhang, N. Accumulation and Transport of Cd, Pb, As, and Cr in Different Maize Varieties in Southwest China. Agriculture 2025, 15, 203. [Google Scholar] [CrossRef]
- Wang, Y.; Xin, C.; Yu, S.; Xue, H.; Zeng, P.; Sun, P.; Liu, F. Evaluation of Heavy Metal Content, Sources, and Potential Ecological Risks in Soils of Southern Hilly Areas. Environ. Sci. 2022, 43, 4756–4766. [Google Scholar]
- Jiang, H.; Cai, L.; Wen, H.; Hu, G.; Chen, L.; Luo, J. An integrated approach to quantifying ecological and human health risks from different sources of soil heavy metals. Sci. Total Environ. 2020, 701, 134466. [Google Scholar] [CrossRef]
- Zhao, Z.; Zhao, Z.; Fu, B.; Wu, D.; Wang, J.; Li, Y.; Tang, W. Distribution and fractionation of potentially toxic metals under different land-use patterns in suburban areas. Pol. J. Environ. Stud. 2022, 31, 475–483. [Google Scholar] [CrossRef] [PubMed]
- Yi, X.; Xie, Z.; Wang, W.; Luo, X.; Shen, L.; Liu, B.; Shao, L. Source apportionment of heavy metals in soil of Guangzhou: Comparison of three receptor models. J. China Univ. Sci. Technol. 2021, 51, 813–821. [Google Scholar]
- Tian, X.; He, G.; Luo, L.; Wu, Y.; Cui, W. Spatial distribution characteristics and source apportionment of heavy metals in vineyard soil at east piedmont of Helan Mountains. Southwest Agric. Sci. 2021, 34, 641–646. [Google Scholar]
- Cai, Z.; Yang, X. Research on Restoration of Heavy Metal Contaminated Farmland Based on Restoration Ecological Compensation Mechanism. Sustainability 2023, 15, 5201. [Google Scholar] [CrossRef]
- Li, Q.; Han, Z.; Tian, Y.; Xiao, H.; Yang, M. Risk Assessment of Heavy Metal in Farmlands and Crops Near Pb-Zn Mine Tailing Ponds in Niujiaotang, China. Toxics 2023, 11, 106. [Google Scholar] [CrossRef]
- Ma, J.; Ge, M.; Wang, S.; Deng, L.; Sun, J.; Jiang, Y.; Zhou, L. Health Risk Assessment and Priority Control Factors Analysis of Heavy Metals in Agricultural Soils Based on Source-oriented. Environ. Sci. 2024, 45, 396–406. [Google Scholar]
- Zhang, S. Assessment of soil heavy metal pollution and health risk in different functional areas of Shanghai City based on GIS. J. Environ. Eng. Technol. 2022, 12, 1226–1236. [Google Scholar]
- Yu, L.; Wang, F.; Fan, H.; Kang, G.; Liu, H.; Wang, D.; Xu, J. Spatial distribution, source apportionment, and ecological risk assessment of soil heavy metals in Jianghugongmi Producing Area, Shandong Province. Environ. Sci. 2022, 43, 4199–4211. [Google Scholar]
- Che, K.; Chen, C.; Zheng, Q.; Fan, H.; Wei, M.; Luo, P.; Yu, J. Characteristics and health risks in surrounding soils heavy metal emissions from coal-fired power plants and heavy metal pollution. Environ. Sci. 2022, 43, 4578–4589. [Google Scholar]
- Qiao, W.; Wang, Y.; Zhang, D.; Yin, X.; Bai, G.; He, P. Identification of heavy metal distribution and sources in soil from a mining area. Geoscience 2022, 36, 543–551. [Google Scholar]
- Guo, H.; Sun, Y.; Wang, X.; Zhang, L.; Mei, Y.; Liu, Q.; Wang, Q. Spatial distribution characteristics and source analysis of soil heavy metals in county-level city. Acta Sci. Circumstantiae 2022, 42, 287–297. [Google Scholar]
- Zhang, H.; Wu, C.; Gong, J.; Yuan, X.; Wang, Q.; Pei, W.; Long, T.; Qiu, J.; Zhang, H. Assessment of heavy metal contamination in roadside soils along the Shenyang-Dalian Highway in Liaoning Province, China. Pol. J. Environ. Stud. 2017, 26, 1539–1549. [Google Scholar]
- Zhang, R.; Chen, T.; Pu, L.; Qie, L.; Huang, S.; Chen, D. Current Situation of Agricultural Soil Pollution in Jiangsu Province: A Meta-Analysis. Land 2023, 12, 455. [Google Scholar] [CrossRef]
- Ning, Y.; Yang, B.; Yang, S.; Ye, J.; Li, J.; Ren, L.; Liu, Z.; Bi, X.; Liu, J. Application of Pb Isotopes and REY Patterns in Tracing Heavy Metals in Farmland Soils from the UpperMiddle Area of Yangtze River. Int. J. Environ. Res. Public Health 2023, 20, 966. [Google Scholar] [CrossRef]
- Wu, Y.; Xia, Y.; Mu, L.; Liu, W.; Wang, Q.; Su, T.; Yang, Q.; Milinga, A.; Zhang, Y. Health Risk Assessment of Heavy Metals in Agricultural Soils Based on Multi-Receptor Modeling Combined with Monte Carlo Simulation. Toxics 2024, 12, 643. [Google Scholar] [CrossRef]
- Shen, G.; Ru, X.; Gu, Y.; Liu, W.; Wang, K.; Li, B.; Guo, Y.; Han, J. Pollution Characteristics, Spatial Distribution, and Evaluation of Heavy Metal(loid)s in Farmland Soils in a Typical Mountainous Hilly Area in China. Foods 2023, 12, 681. [Google Scholar] [CrossRef]
- Zhang, J.; Liu, Y.; Hong, S.; Wen, M.; Zheng, C.; Liu, P. Speciation Analysis and Pollution Assessment of Heavy Metals in Farmland Soil of a Typical Mining Area: A Case Study of Dachang Tin Polymetallic Ore, Guangxi. Appl. Sci. 2023, 13, 708. [Google Scholar] [CrossRef]
- Ma, J.; She, Z.; Wang, S.; Deng, L.; Liu, P.; Sun, J. Health Risk Assessment of Heavy Metals in Agricultural Soils Around the Gangue Heap of Coal Mine Based on Monte Carlo Simulation. Environ. Sci. 2023, 44, 5666–5678. [Google Scholar]
- Yin, F.; Feng, K.; Yin, C.; Bai, D.; Wang, R.; Zhou, Y.; Liang, Y.; Liu, L. Evaluation and source analysis of heavy metal in cultivated soil around typical industrial district of Qinghai province. China Environ. Sci. 2021, 41, 5217–5226. [Google Scholar]
- Zhang, H.; Cui, W.; Huang, Y.; Li, Y.; Zhong, X.; Wang, L. Evaluation and source analysis of heavy metal pollution of farmland soil around the mining area of karst region of central Guizhou Province. Acta Sci. Circumstantiae 2022, 42, 412–421. [Google Scholar]
- Chen, J.; Fang, H.; Wu, J.; Lin, J.; Lan, W.; Chen, J. Distribution and source apportionment of heavy metals in farmland soils using PMF and lead isotopic Composition. J. Agro-Environ. Sci. 2019, 38, 1026–1035. [Google Scholar]
- Xia, Z.; Bai, Y.; Wang, Y.; Gao, X.; Ruan, X.; Zhong, Y. Spatial distribution and source analysis of soil heavy metals in a small watershed in the mountainous area of southern Ningxia based on PMF model. Environ. Sci. 2022, 43, 432–441. [Google Scholar]
- Song, Q.; Xu, X.; Wu, Q.; Yang, H.; Wang, C.; Gu, Z.; Xu, M. Quantitative analysis of environmental risk of heavy metal sources in soil based on PMF model. J. Nat. Sci. Hunan Norm. Univ. 2022, 45, 76–83. [Google Scholar]
- Zheng, Y.; Wen, H.; Cai, L.; Luo, J.; Tang, D.; Wu, M.; Li, H.; Li, D. Source analysis and risk assessment of heavy metals in soil of county scale based on PMF model. Environ. Sci. 2023, 44, 5242–5252. [Google Scholar]
- Yang, D.; Yang, Y.; Hua, Y. Source Analysis Based on the Positive Matrix Factorization Models and Risk Assessment of Heavy Metals in Agricultural Soil. Sustainability 2023, 15, 13225. [Google Scholar] [CrossRef]
- Chen, H.; Sun, X.; Sun, L.; An, Y.; Xiao, Y.; Zhang, J.; Hong, Y.; Song, X. A Comprehensive Study of Spatial Distribution, Pollution Risk Assessment, and Source Apportionment of Topsoil Heavy Metals and Arsenic. Land 2024, 13, 2151. [Google Scholar] [CrossRef]
- Zhang, C.; Wang, Z.; Liu, L.; Liu, Y. Source Analysis of Soil Heavy Metals in Agricultural band Around the Mining AreaBased on APCS-MLR Receptor Model and Geostatistical Method. Environ. Sci. 2023, 44, 3500–3508. [Google Scholar]
- Hu, Z.; Wu, Z.; Luo, W.; Xie, Y. Content, Sources, and Ecological Risk Assessment of Heavy Metals in Soil of Typical Karst County. Environ. Sci. 2024, 45, 5507–5516. [Google Scholar]
- Li, J.; Gao, Z.; Ma, L.; Ma, J.; Zhang, M.; Ma, X.; Zang, F.; Li, X. Multiproxy Comprehensive Analysis for Source Apportionment and Pollution of Heavy Metals in Upban Drinkingwater Source Soils from the Lanzhou Reach of the Yellow River. Environ. Sci. 2024, 45, 6723–6733. [Google Scholar]
- Li, W.; Zhou, X.; Wang, B.; Ding, D.; Wu, D.; Zhang, Z. Pollution characteristics and assessment of heavy metal in different land-use types in Tianjin City. Bull. Soil. Water Conserv. 2018, 38, 200–205. [Google Scholar]
- Ji, D.; Zeng, W.; Zhang, X.; Zhang, J.; Wang, Q.; Zhang, W.; Deng, L.; Yang, G.; Wu, S. Ecological risk assessment and principal component analysis of heavy metals in suburban farmland soils of Tianjin. Environ. Chem. 2019, 38, 1955–1965. [Google Scholar]
- Wang, B.; Zhang, Z. The features and potential ecological risk assessment of soil heavy metals in Tianjin suburban farmland. Environ. Monit. China 2012, 28, 23–27. [Google Scholar]
- Xie, W.; Yang, Y.; Hou, J. Characteristics of selenium and heavy metals concentrations in soils and vegetables and screening of green selenium-enriched vegetables in a base of Tianjin. Environ. Chem. 2018, 37, 2790–2799. [Google Scholar]
- Zhang, Y.; Han, J.; Tu, Q.; Yang, Y.; Xu, Y.; Shi, R. Accumulation Characteristics and Evaluation of Heavy Metals in Suburban Farmland Soils of Tianjin. J. Ecol. Rural. Environ. 2019, 35, 1445–1452. [Google Scholar]
- Peng, H.; Ma, J.; Ma, Y.; Chen, Y. Characteristics and source identification of heavy metal pollution in agricultural soils and vegetables in Wuqing District, Tianjin City, China. Chin. J. Ecol. 2019, 38, 2102–2112. [Google Scholar]
- Chen, H.; Teng, Y.; Lu, S.; Wang, Y.; Wu, J.; Wang, J. Source apportionment and health risk assessment of trace metals in surface soils of Beijing metropolitan, China. Chemosphere 2016, 144, 1002–1011. [Google Scholar] [CrossRef]
- Zhang, H.; Wang, Y.; Wang, H.; Ju, W.; Huang, R.; Liu, R.; Du, M. Heavy metal pollution characteristics and health risk assessment of soil from an abandoned site for lead smelting of waste lead batteries. J. Environ. Eng. Technol. 2023, 13, 769–777. [Google Scholar]
- Cheng, R. Pollution characteristics and health risk assessment of heavy metals in farmland soil downstream of a copper mine slag dumps. J. Environ. Eng. Technol. 2020, 10, 280–287. [Google Scholar]
- Wang, H.; Wu, J.; Tian, Z.; Li, Y.; Gong, B. Status and development trend of soil pollutant health risk assessment technology. J. Environ. Eng. Technol. 2023, 13, 778–784. [Google Scholar]
- Zhao, X.; Duan, L.; Zhou, J.; Liu, X.; Lu, W.; Qiu, J.; Ke, H.; Zheng, H. Distribution characteristics, source analysis and risk assessment of heavy metals in sediments of Wanghu Lake of Hubei Province. J. Environ. Eng. Technol. 2023, 13, 1021–1030. [Google Scholar]
- Lv, Y.; Wang, Q.; Sun, X.; Zhang, Z.; Zhang, Y.; Gao, Y. Pollution characteristics and source identification of heavy metals in farmland soils around a tailing pond in Zhejiang Province. J. Environ. Eng. Technol. 2023, 13, 1464–1475. [Google Scholar]
- U.S. EPA. Method 6010D (SW-846): Inductively Coupled Plasma-Atomic Emission Spectrometry; Revision 4; U.S. EPA: Washington, DC, USA, 2014. [Google Scholar]
- Ministry of Ecology and Environment of the People’s Republic of China. Soil and Sedimen—Determination of Mercury, Arsenic, Selenium, Bismuth, Antimony—Microwave Dissolution/Atomic Fluorescence Spectrometry; Ministry of Ecology and Environment of the People’s Republic of China: Beijing, China, 2014. [Google Scholar]
- Fan, S. Pollution and health risk assessment of heavy metals in soil neighborhoods around a smelter in Changqing town of Baoji city. Environ. Pollut. Control. 2015, 37, 46–54. [Google Scholar]
- Jia, Y.; Zhang, W.; Liu, M.; Peng, Y.; Hao, C. Spatial Distribution, Pollution Characteristics and Source of Heavy Metals in Farmland Soils around Antimony Mine Area, Hunan Province. Pol. J. Environ. Stud. 2022, 31, 1653–1665. [Google Scholar] [CrossRef]
- Tang, Z.; Deng, R.; Zhang, J.; Ren, B.; Hursthouse, A. Regional distribution characteristics and ecological risk assessment of heavy metal pollution of different land use in an antimony mining area-Xikuangshan, China. Hum. Ecol. Risk Assess. 2020, 26, 1779–1794. [Google Scholar] [CrossRef]
- Mohamed, K.; Elsayed, S.; Enas, M.; Sahar, A.; Ali, A.; Rosa, L.; Manal, A. Quantitative Evaluation of Soil Quality Using Principal Component Analysis: The Case Study of El-Fayoum Depression Egypt. Sustainability 2021, 13, 1824. [Google Scholar] [CrossRef]
- Markus, R. What is principal component analysis? Nat. Biotechnol. 2008, 26, 303–304. [Google Scholar]
- Sun, Y.; Zhou, S.; Meng, S.; Wang, M.; Mu, H. Principal component analysis–artifcial neural network-based model for predicting the static strength of seasonally frozen soils. Sci. Rep. 2023, 13, 16085. [Google Scholar]
- Wei, Q.; Jin, L.; Chen, W.; Gu, H. Pollution Characteristics and Source Analysis of Heavy Metals in Sediment of Panlong River. Shandong Agric. Sci. 2020, 52, 75–82. [Google Scholar]
- Gholizadeh, M.; Melesse, A.; Reddi, L. Water quality assessment and apportionment of pollution sources using APCS-MLR and PMF receptor modeling techniques in three major rivers of South Florida. Sci. Total Environ. 2016, 566–567, 1552–1567. [Google Scholar] [CrossRef]
- Xu, J.; Xie, R.; Liu, L.; Huang, Z. Evaluating the Level of Total Mercury Present in the Soils of a Renowned Tea Production Region. Agronomy 2025, 15, 435. [Google Scholar] [CrossRef]
- U.S. EPA. A Framework for Assessing Health Risk of Environmental Exposures to Children; U.S. Environmental Protection Agency: Washington, DC, USA, 2006. [Google Scholar]
- China National Environmental Monitoring Centre. Soil Background Values in China, 1st ed.; China Environmental Science Press: Beijing, China, 1990; pp. 494–496. [Google Scholar]
- GB 15618-2018; Soil Environmental Quality Risk Control Standard for Soil Contamination of Agricultural Land. Ministry of Ecology and Environment of the People’s Republic of China: Beijing, China, 2018.
- Hu, H.; Gao, L.; Zhang, H.; Zhou, X.; Zheng, J.; Hu, J.; Hu, H.; Ma, Y. Effectiveness of Passivator Amendments and Optimized Fertilization for Ensuring the Food Safety of Rice and Wheat from Cadmium-Contaminated Farmland. Sustainability 2022, 14, 15026. [Google Scholar] [CrossRef]
- Guo, X.; Li, J.; Lin, Z.; Ma, L. The Impact of Environmental Regulation and Technical Cognition on Farmers’ Adoption of Safety Agro-Utilization of Heavy Metal-Contaminated Farmland Soil. Sustainability 2024, 16, 3343. [Google Scholar] [CrossRef]
- Dong, L.; Fang, B. Analysis of spatial heterogeneity of soil heavy metals in tea plantation: Case study of high quality tea garden in Jiangsu and Zhejiang. Geogr. Res. 2017, 36, 391–404. [Google Scholar]
- Luo, L.; Ma, Y.; Zhang, S.; Wei, D.; Zhu, Y. An inventory of trace element inputs to agricultural soils in China. J. Environ. Manag. 2009, 90, 2524–2530. [Google Scholar] [CrossRef]
- Li, W.; Cui, Y.; Zeng, C.; Zhu, Y.; Peng, Y.; Wang, K.; Li, S. Pollution characteristics and source analysis of heavy metals in farmland soils in the taige canal valley. Environ. Sci. 2019, 40, 5073–5081. [Google Scholar]
- Ju, T.; Wu, X.; Shi, H.; Gao, F.; Li, X.; Wang, Y.; Luan, T.; Fan, P. Heavy metal pollution and ecological risk assessment of arable land soil in Haigou small watershed. J. Environ. Eng. Technol. 2018, 8, 556–562. [Google Scholar]
- Ai, J.; Wang, N.; Yang, J. Source apportionment of soil heavy metals in Jiapigou goldmine based on the UNMIX model. Environ. Sci. 2014, 35, 3530–3536. [Google Scholar]
- Zhang, J.; Xia, J.; Chen, S.; Wu, Y.; Pang, Y.; Huang, T. Source analysis of heavy metal lead in Luoma Lake sediments based on Pb stable isotopes. J. Environ. Eng. Technol. 2023, 13, 1011–1020. [Google Scholar]
- Yuan, H.; Zhong, H.; Zhao, L.; Ma, C. Analysis of Heavy Metal Pollution Sources of Typical FarmlandSoils in Chongzhou City Based on PCA/APCS Receptor Model. Sichuan. Environ. 2019, 38, 35–43. [Google Scholar]
- Hingorani, R.; Jimeenez, R.; Grande, M.; Castillo, A.; Nevshupa, R.; Castellota, M. From analysis to decision: Revision of a multifactorial model for the in situ assessment of NOx abatement effectiveness of photocatalytic pavements. Chem. Eng. J. 2020, 402, 126250. [Google Scholar] [CrossRef]
- Deng, J.; Zhang, Y.; Qiu, Y.; Zhang, H.; Du, W.; Xu, L.; Hong, Y.; Chen, Y.; Chen, J. Source apportionment of PM2.5 at the Lin’an regional background site in China with three receptor models. Atmos. Res. 2018, 202, 23–32. [Google Scholar] [CrossRef]
- Gan, Y.; Huang, X.; Li, S.; Liu, N.; Li, Y.; Freidereich, A.; Wang, W.; Wang, R.; Dai, J. Source quantification and potential risk of mercury, cadmium, arsenic, lead, and chromium in farmland soils of Yellow River Delta. J. Cleaner Prod. 2019, 221, 98–107. [Google Scholar] [CrossRef]


| Igeo | Igeo < 0 | 0 ≤ Igeo < 1 | 1 ≤ Igeo < 2 | 2 ≤ Igeo < 3 | 3 ≤ Igeo < 4 | 4 ≤ Igeo < 5 | Igeo ≥ 5 |
|---|---|---|---|---|---|---|---|
| Pollution levels | Level Ⅰ: Uncontaminated | Level Ⅱ: Uncontaminated to moderately contaminated | Level Ⅲ: Moderately contaminated | Level Ⅳ: Moderately to heavily contaminated | Level Ⅴ: Heavily contaminated | Level Ⅵ: Heavily to extremely contaminated | Level Ⅶ: Extremely contaminated |
| Symbol | Parameter | Reference Value for Adults | Reference Value for Children |
|---|---|---|---|
| EF | exposure frequency/(d/a) | 300 | 300 |
| ED | exposure duration/a | 24 | 6 |
| AT | average time/d | 365 × 24 | 365 × 6 |
| BW | body weight/kg | 5 | 15 |
| Ring | daily intake of soil in hand and mouth/(mg/d) | 100 | 200 |
| Rinh | respiratory rate/(m3/d) | 20 | 5 |
| PEF | particle emission factor/(m3/kg) | 1.36 × 10⁹ | 1.36 × 10⁹ |
| AF | Adherence factor to skin/[mg/(cm2·d)] | 0.07 | 0.2 |
| SA | skin surface area exposed/cm2 | 4350 | 1660 |
| ABS | dermal absorption factor | 0.001 | 0.001 |
| Element | Mean/(mg/kg) | Range/(mg/kg) | Standard Deviation/(mg/kg) | Coefficient of Variation | Kurtosis | Skewness | Background Values */ (mg/kg) | RSV #/ (mg/kg) | RIV #/ (mg/kg) |
|---|---|---|---|---|---|---|---|---|---|
| Cd | 0.23 | 0.08~0.84 | 0.12 | 0.51 | 11.98 | 2.61 | 0.09 | 0.6 | 4 |
| Cr | 66.8 | 47.3~81.2 | 7.94 | 0.12 | −0.43 | −0.46 | 98.38 | 250 | 1300 |
| Hg | 0.212 | 0.011~2.29 | 0.34 | 1.62 | 23.38 | 4.32 | 0.05 | 3.4 | 6 |
| Ni | 32.9 | 22.3~42.9 | 5.95 | 0.18 | −1.16 | −0.19 | 34.46 | 190 | / |
| Pb | 26.9 | 16.8~50.4 | 6.13 | 0.23 | 2.41 | 1.07 | 20.32 | 170 | 1000 |
| As | 10.6 | 6.1~15.1 | 2 | 0.19 | −0.58 | −0.04 | 11.07 | 25 | 100 |
| Cu | 36.1 | 16.4~64.8 | 11.18 | 0.31 | 0.06 | 0.4 | 28.38 | 100 | / |
| Zn | 111 | 55.7~246 | 40.37 | 0.36 | 0.84 | 0.91 | 76.27 | 300 | / |
| Factor | Factor Load | Contribution Rate of Variances/% | Accumulated Contribution Rate of Variances/% | |||||||
|---|---|---|---|---|---|---|---|---|---|---|
| Cd | Cr | Hg | Ni | Pb | As | Cu | Zn | |||
| PC1 | 0.833 | 0.314 | 0.204 | 0.332 | 0.306 | 0.198 | 0.828 | 0.828 | 57.2 | 57.2 |
| PC2 | 0.168 | 0.846 | −0.080 | 0.858 | 0.698 | 0.923 | 0.357 | 0.343 | 19.3 | 76.5 |
| PC3 | 0.136 | 0.064 | 0.951 | −0.149 | 0.476 | 0.060 | 0.012 | 0.253 | 8.1 | 84.6 |
| R2 | Cd | Cr | Hg | Ni | Pb | As | Cu | Zn |
|---|---|---|---|---|---|---|---|---|
| APCS–MLR | 0.726 | 0.809 | 0.95 | 0.861 | 0.797 | 0.889 | 0.804 | 0.86 |
| PMF | 0.704 | 0.826 | 1.000 | 0.902 | 0.877 | 0.911 | 0.935 | 0.953 |
| Recipient | Exposure Pathways | Cd | Cr | Hg | Ni | Pb | As | Cu | Zn | HQ | HI (TCR) |
|---|---|---|---|---|---|---|---|---|---|---|---|
| children | HQing | 2.48 × 10⁻³ | 2.44 × 10⁻¹ | 7.75 × 10⁻³ | 1.81 × 10⁻² | 8.41 × 10⁻² | 3.88 × 10⁻¹ | 9.88 × 10⁻³ | 4.05 × 10⁻³ | 7.58 × 10⁻¹ | 7.81 × 10⁻¹ |
| HQinh | 4.57 × 10⁻⁸ | 4.71 × 10⁻⁴ | 2.85 × 10⁻⁶ | 3.22 × 10⁻⁷ | 1.54 × 10⁻⁶ | 1.74 × 10⁻⁵ | 1.81 × 10⁻⁷ | 7.44 × 10⁻⁸ | 4.93 × 10⁻⁴ | ||
| HQder | 4.12 × 10⁻⁴ | 2.03 × 10⁻² | 4.49 × 10⁻⁵ | 1.11 × 10⁻⁴ | 9.36 × 10⁻⁴ | 6.44 × 10⁻⁴ | 5.47 × 10⁻⁵ | 3.36 × 10⁻⁵ | 2.25 × 10⁻² | ||
| CRing | 1.52 × 10⁻⁵ | 1.74 × 10⁻⁴ | 1.90 × 10⁻⁴ | ||||||||
| CRinh | 8.22 × 10⁻¹⁴ | 5.65 × 10⁻⁷ | 5.58 × 10⁻⁹ | 9.19 × 10⁻¹² | |||||||
| CRder | 2.52 × 10⁻⁸ | 2.90 × 10⁻⁷ | |||||||||
| adults | HQing | 3.11 × 10⁻⁴ | 3.05 × 10⁻² | 9.68 × 10⁻⁴ | 2.26 × 10⁻³ | 1.05 × 10⁻² | 4.85 × 10⁻² | 1.23 × 10⁻³ | 5.06 × 10⁻⁴ | 9.48 × 10⁻² | 1.00 × 10⁻¹ |
| HQinh | 4.57 × 10⁻⁸ | 4.71 × 10⁻⁴ | 2.85 × 10⁻⁶ | 3.22 × 10⁻⁷ | 1.54 × 10⁻⁶ | 1.74 × 10⁻⁵ | 1.81 × 10⁻⁷ | 7.44 × 10⁻⁸ | 4.93 × 10⁻⁴ | ||
| HQder | 9.45 × 10⁻⁵ | 4.64 × 10⁻³ | 1.03 × 10⁻⁵ | 2.54 × 10⁻⁵ | 2.15 × 10⁻⁴ | 1.48 × 10⁻⁴ | 1.25 × 10⁻⁵ | 7.71 × 10⁻⁶ | 5.16 × 10⁻³ | ||
| CRing | 1.89 × 10⁻⁶ | 2.18 × 10⁻⁵ | 2.43 × 10⁻⁵ | ||||||||
| CRinh | 8.22 × 10⁻¹⁴ | 5.65 × 10⁻⁷ | 5.58 × 10⁻⁹ | 9.19 × 10⁻¹² | |||||||
| CRder | 5.77 × 10⁻⁹ | 6.64 × 10⁻⁸ |
| Risk Category | Heavy Metal | Children | Adults | ||||||||
|---|---|---|---|---|---|---|---|---|---|---|---|
| Factor 1 | Factor 2 | Factor 3 | Factor 4 | Sum | Factor 1 | Factor 2 | Factor 3 | Factor 4 | Sum | ||
| non carcinogenicrisk | Cd | 2.38 × 10⁻⁷ | 1.08 × 10⁻² | 4.75 × 10⁻³ | 4.39 × 10⁻⁴ | 1.60 × 10⁻² | 3.05 × 10⁻⁸ | 1.38 × 10⁻³ | 6.08 × 10⁻⁴ | 5.63 × 10⁻⁵ | 2.04 × 10⁻³ |
| Cr | 7.55 × 10⁻² | 2.95 × 10⁻² | 2.75 × 10⁻³ | 5.47 × 10⁻² | 1.62 × 10⁻¹ | 9.67 × 10⁻³ | 3.78 × 10⁻³ | 3.52 × 10⁻⁴ | 7.00 × 10⁻³ | 2.08 × 10⁻² | |
| Hg | 4.28 × 10⁻⁵ | 4.92 × 10⁻⁵ | 2.33 × 10⁻⁴ | 2.38 × 10⁻⁷ | 3.25 × 10⁻⁴ | 5.48 × 10⁻⁶ | 6.30 × 10⁻⁶ | 2.98 × 10⁻⁵ | 3.05 × 10⁻⁸ | 4.16 × 10⁻⁵ | |
| Ni | 4.12 × 10⁻² | 1.66 × 10⁻² | 1.72 × 10⁻³ | 2.98 × 10⁻² | 8.93 × 10⁻² | 5.27 × 10⁻³ | 2.13 × 10⁻³ | 2.20 × 10⁻⁴ | 3.81 × 10⁻³ | 1.14 × 10⁻² | |
| Pb | 2.51 × 10⁻² | 1.27 × 10⁻² | 6.23 × 10⁻³ | 2.30 × 10⁻² | 6.70 × 10⁻² | 3.21 × 10⁻³ | 1.63 × 10⁻³ | 7.98 × 10⁻⁴ | 2.95 × 10⁻³ | 8.59 × 10⁻³ | |
| As | 1.32 × 10⁻² | 5.31 × 10⁻³ | 1.33 × 10⁻⁶ | 9.36 × 10⁻³ | 2.79 × 10⁻² | 1.69 × 10⁻³ | 6.79 × 10⁻⁴ | 1.70 × 10⁻⁷ | 1.20 × 10⁻³ | 3.57 × 10⁻³ | |
| Cu | 4.51 × 10⁻³ | 1.82 × 10⁻² | 1.13 × 10⁻² | 6.91 × 10⁻² | 1.03 × 10⁻¹ | 5.78 × 10⁻⁴ | 2.33 × 10⁻³ | 1.45 × 10⁻³ | 8.85 × 10⁻³ | 1.32 × 10⁻² | |
| Zn | 2.38 × 10⁻⁷ | 5.26 × 10⁻² | 4.29 × 10⁻² | 2.19 × 10⁻¹ | 3.15 × 10⁻¹ | 3.05 × 10⁻⁸ | 6.73 × 10⁻³ | 5.49 × 10⁻³ | 2.81 × 10⁻² | 4.03 × 10⁻² | |
| HI | 1.60 × 10⁻¹ | 1.46 × 10⁻¹ | 6.99 × 10⁻² | 4.05 × 10⁻¹ | 7.81 × 10⁻¹ | 2.04 × 10⁻² | 1.87 × 10⁻² | 8.95 × 10⁻³ | 5.20 × 10⁻² | 1.00 × 10⁻¹ | |
| carcinogenicrisk | Cd | 1.53 × 10⁻¹⁰ | 2.83 × 10⁻⁷ | 3.06 × 10⁻⁶ | 6.96 × 10⁻⁶ | 1.03 × 10⁻⁵ | 1.96 × 10⁻¹¹ | 3.62 × 10⁻⁸ | 3.91 × 10⁻⁷ | 8.89 × 10⁻⁷ | 1.32 × 10⁻⁶ |
| Cr | 4.87 × 10⁻⁵ | 1.90 × 10⁻⁵ | 1.77 × 10⁻⁶ | 3.52 × 10⁻⁵ | 1.05 × 10⁻⁴ | 6.22 × 10⁻⁶ | 2.43 × 10⁻⁶ | 2.26 × 10⁻⁷ | 4.50 × 10⁻⁶ | 1.34 × 10⁻⁵ | |
| Ni | 2.65 × 10⁻⁵ | 1.07 × 10⁻⁵ | 1.11 × 10⁻⁶ | 1.92 × 10⁻⁵ | 5.75 × 10⁻⁵ | 3.39 × 10⁻⁶ | 1.37 × 10⁻⁶ | 1.41 × 10⁻⁷ | 2.45 × 10⁻⁶ | 7.35 × 10⁻⁶ | |
| As | 8.51 × 10⁻⁶ | 3.42 × 10⁻⁶ | 8.54 × 10⁻¹⁰ | 6.03 × 10⁻⁶ | 1.80 × 10⁻⁵ | 1.09 × 10⁻⁶ | 4.37 × 10⁻⁷ | 1.09 × 10⁻¹⁰ | 7.71 × 10⁻⁷ | 2.3 × 10⁻⁶ | |
| TCR | 8.37 × 10⁻⁵ | 3.34 × 10⁻⁵ | 5.94 × 10⁻⁶ | 6.74 × 10⁻⁵ | 1.90 × 10⁻⁴ | 1.07 × 10⁻⁵ | 4.27 × 10⁻⁶ | 7.59 × 10⁻⁷ | 8.62 × 10⁻⁶ | 2.43 × 10⁻⁵ | |
Disclaimer/Publisher’s Note: The statements, opinions and data contained in all publications are solely those of the individual author(s) and contributor(s) and not of MDPI and/or the editor(s). MDPI and/or the editor(s) disclaim responsibility for any injury to people or property resulting from any ideas, methods, instructions or products referred to in the content. |
© 2025 by the authors. Licensee MDPI, Basel, Switzerland. This article is an open access article distributed under the terms and conditions of the Creative Commons Attribution (CC BY) license (https://creativecommons.org/licenses/by/4.0/).
Share and Cite
Zhu, L.; Liu, K.; Zhou, J.; Li, L. Analysis of Heavy Metal Sources and Sustainability: Human Health Risk Assessment of Typical Agricultural Soils in Tianjin, North China Plain. Sustainability 2025, 17, 3738. https://doi.org/10.3390/su17083738
Zhu L, Liu K, Zhou J, Li L. Analysis of Heavy Metal Sources and Sustainability: Human Health Risk Assessment of Typical Agricultural Soils in Tianjin, North China Plain. Sustainability. 2025; 17(8):3738. https://doi.org/10.3390/su17083738
Chicago/Turabian StyleZhu, Ling, Kun Liu, Jiong Zhou, and Lanlan Li. 2025. "Analysis of Heavy Metal Sources and Sustainability: Human Health Risk Assessment of Typical Agricultural Soils in Tianjin, North China Plain" Sustainability 17, no. 8: 3738. https://doi.org/10.3390/su17083738
APA StyleZhu, L., Liu, K., Zhou, J., & Li, L. (2025). Analysis of Heavy Metal Sources and Sustainability: Human Health Risk Assessment of Typical Agricultural Soils in Tianjin, North China Plain. Sustainability, 17(8), 3738. https://doi.org/10.3390/su17083738