Review

A Systematic Review of Methodological Advances in Urban Heatwave Risk Assessment: Integrating Multi-Source Data and Hybrid Weighting Methods

College of Architecture and Urban Planning, Shandong Jianzhu University, Jinan 250101, China
*
Author to whom correspondence should be addressed.
Sustainability 2025, 17(8), 3747; https://doi.org/10.3390/su17083747
Submission received: 9 November 2024 / Revised: 21 March 2025 / Accepted: 15 April 2025 / Published: 21 April 2025

Abstract

:
As climate change intensifies, urban populations face growing threats from frequent and severe heatwaves, underscoring the urgent need for advanced risk assessment frameworks to inform adaptation strategies. This systematic review synthesizes methodological innovations in urban heatwave risk assessment (2007–2024), analyzing 259 studies through bibliometric analysis (CiteSpace 6.4.R1) and multi-criteria evaluation. We propose the hazard–exposure–vulnerability–adaptability (HEVA) framework, an extension of Crichton’s risk triangle that integrates dynamic adaptability metrics and supports high-resolution spatial analysis for urban heatwave risk assessment. Our systematic review reveals three key methodological gaps: (1) Inconsistent indicator selection across studies; (2) limited analysis of microclimatic variations; (3) sparse integration of IoT- or satellite-based monitoring. The study offers practical solutions for enhancing assessment accuracy, including refined weighting methodologies and high-resolution spatial analysis techniques. We conclude by proposing a research agenda that prioritizes interdisciplinary approaches—bridging urban planning, climate science, and public health—while advocating for policy tools that address spatial inequities in heat risk exposure. These insights advance the development of more precise, actionable assessment systems to support climate-resilient urban development.

1. Introduction

Climate change has led to a 50% increase in global heatwave frequency since 1980, posing severe threats to human health, particularly through more intense and prolonged extreme heat events—a trend directly linked to urbanization and greenhouse gas emissions. This concerning pattern is clearly illustrated in IPCC climate projections (Figure 1) [1], where temperature extremes (right panel) demonstrate significantly greater warming amplitudes compared to long-term averages. These differential warming rates underscore the critical importance of examining heatwave-related health risks—the central focus of our investigation. The repercussions of climate change are profoundly disrupting global health systems [2]. Rising global temperatures and rapid urbanization exacerbate urban heat stress, posing significant challenges to sustainable urban development and jeopardizing the safety and well-being of urban populations. Urban disasters induced by heatwaves result from complex interactions between global and local factors. Although a unified international definition and standard for heatwaves is yet to be established, their adverse impact on urban health is indisputable. Elevated temperatures are associated with an increased risk of heat-related illnesses, including heatstroke, syncope, tachycardia, and cardiovascular complications [3,4]. This trend is anticipated to worsen, leading to heightened heat-related morbidity and mortality rates [5,6,7,8,9]. Vulnerable groups, such as the elderly and young children, are disproportionately affected by extreme heat, particularly in urban environments amplified by the urban heat island effect [5,10]. Consequently, mitigating the effects of urban heatwaves has emerged as a critical focus in urban planning and ecological research [11,12], representing a cornerstone for promoting healthy and sustainable urban development.
The Canadian scholar Oke classified urban climate research into mesoscale, local scale, and microscale research, emphasizing the significant heterogeneity of urban spaces and the consequent variation in applicable research methods and techniques [13]. Two prominent methodologies integrating urban planning and urban climate studies are the urban climate map (UCMap) and the local climate zone (LCZ). The UCMap, introduced by the German scholar Knoch in the 1950s, and further developed by German scholars in the 1970s, provides guidance for urban climate planning by analyzing various factors, such as the urban thermal environment, wind dynamics, and air quality [14]. It has been applied in studies across 20 countries [15,16,17,18,19,20]. Meanwhile, the LCZ classification system, proposed by Stewart in 2012, has gained widespread adoption for evaluating the impact of urban spatial structures on thermal environments [21,22,23,24]. Despite its broad relevance, the UCMap’s practical implementation remains constrained by the limited availability of meteorological stations and insufficient data acquisition accuracy in many urban areas.
Early studies on urban thermal environments predominantly relied on temperature data, with a primary focus on the LCZ canopy layer [25,26]. However, advancements in remote sensing satellite technology—characterized by extensive data coverage, high timeliness, superior spatial resolution, and strong comparability—have gradually shifted research emphasis to the LCZ surface [27,28,29]. Currently, LCZ classifications are primarily conducted using the following three methods: field measurements [30], Geographic Information System (GIS)-based approaches, and remote sensing image-based techniques [29]. In 2017, the IEEE Data Fusion Contest introduced an LCZ classification method utilizing convolutional neural networks (CNNs), which has since attracted substantial attention. While research on CNN-based classification methods remains limited, existing studies demonstrate that deep learning techniques offer considerable advantages over traditional machine learning approaches [31,32,33].
Urban heatwave risk assessment has garnered considerable academic attention, with numerous studies exploring urban heat disasters from the perspectives of heatwave characteristics, impacts, and risk evaluation [34,35,36,37]. Most research utilizes land surface temperature (LST) [38,39,40,41,42,43] and air temperature ( T a ) [44,45] as proxies for hazard intensity due to their accessibility. However, the heat radiation driven by the convective fluxes of sensible and latent heat under intense sunlight is more critical to human health and thermal comfort. Mean radiant temperature ( T m r t ), an effective metric for assessing the urban thermal radiation environment, better represents the actual thermal load experienced by individuals in exposed conditions. It offers advantages over LST and T a when designing health protection strategies, as it reflects thermal stress with greater accuracy. T m r t is strongly influenced by urban morphology and surface materials, demonstrating pronounced spatial variability and making it widely applicable in urban biometeorological research. Studies confirm that T m r t is more appropriate than T a in evaluating outdoor thermal comfort, as it captures significant spatial variations over short distances. Several models are commonly used to quantify T m r t , including ENVI-met, SOLWEIG, and RayMan. The RayMan model, known for its high sensitivity and computational speed, provides excellent alignment with empirical data. However, it requires fisheye photographs for its calculations, restricting its application to specific locations and limiting its capacity to account for multiple reflections between buildings [46,47,48,49]. The ENVI-met model supports the detailed classification of surface materials and calculates a broader range of radiation parameters but suffers from limitations in grid size, resulting in reduced accuracy and prolonged computation times. By contrast, the SOLWEIG model excels in simulating complex urban environments through the integration of geographical elevation and meteorological data. It is particularly suitable for large-scale spatial analysis and dynamic simulations due to its high spatial resolution, although it cannot directly compute thermal comfort indices, necessitating supplementary calculations [46,47,50,51].
Recent studies have advanced the understanding of urban overheating and urban heat island (UHI) effects through integrated assessment frameworks that incorporate energy, environmental, vulnerability, and health impacts [52]. While multi-source data fusion—including remote sensing, meteorological records, population statistics, and socioecological factors—has improved heatwave risk evaluation, critical methodological gaps persist. First, existing reviews predominantly focus on heatwave health impacts and UHI mechanisms yet lack systematic analyses of evolving risk assessment frameworks, particularly in integrating real-time spatial data and adaptive capacity metrics. Second, despite the proliferation of hybrid weighting techniques, no consensus exists on standardized indicator selection or scalable computational methods for high-resolution urban analysis. This study bridges these gaps via the following steps:
(1)
Conducting a systematic review of methodological innovations in heatwave risk assessment, emphasizing multi-source data integration and hybrid weighting approaches.
(2)
Proposing the HEVA framework, which extends traditional models by incorporating (a) dynamic adaptability indicators and (b) high-resolution spatial analysis.
(3)
Establishing a comparative evaluation of existing frameworks to identify best practices for urban-scale risk mapping, supported by empirical validation.

2. Development of Risk Assessment of Urban Heatwaves

This section presents a systematic review of the current research progress in urban heatwave risk assessment. A literature search was conducted across the Web of Science, Scopus, and EI databases using the combined keywords “heatwave”, “risk assessment”, and “urban climate”, covering publications from 2007 to 2024, with a particular emphasis on studies published in the most recent three years. Our search identified 259 relevant records, comprising 245 research articles and 14 review papers, with selection criteria prioritizing methodological advancements in heatwave risk assessment, especially studies employing multi-source data integration and hybrid weighting approaches. Through bibliometric analysis using CiteSpace 6.4.R1, we constructed comprehensive knowledge maps examining multiple dimensions including keyword co-occurrence networks, abstract thematic clustering, author/institutional collaboration patterns, and reference co-citation relationships. The analysis reveals a substantial increase in publication output over the past two decades, as clearly demonstrated in Figure 2, highlighting the remarkable growth of research achievements in this field. While there was some progress in publications from 2007 to 2017, the overall number of articles remained moderate. This period is identified as the phase of research expansion. Since 2019, the number of published papers has surged sharply each year. During this period, urban heatwaves have received significant attention from researchers worldwide. This trend is likely to continue due to the growing global focus on climate issues.
Further analysis of the spatial distribution of research by country reveals that China published the most papers (62) from 2007 to 2024, followed by the United States (53) and Australia (40). The results indicate that China has the highest research output on urban heatwave risk assessment. This trend may be attributed to China’s rapid urbanization and the increasing frequency of extreme heat events in recent years. Compared to the United States and Australia, China’s research focus is more aligned with the integration of multi-source data and the development of hybrid weighting methods, reflecting the country’s unique challenges in managing urban heat risks. These findings highlight the importance of regional context in shaping research priorities and methodologies (Figure 3).
The top 20 most frequent keywords are shown in Table 1, with “climate change”, “mortality”, “impact”, “temperature”, and “risk” being the five most frequently occurring terms, as also illustrated in Figure 4. The sequence of “climate change” followed by “mortality” and “risk” indicates that researchers are focusing on the impacts of climate change on human health. Studies suggest that research could be expanded to explore these issues from the perspectives of “thermal comfort” and “adaptation”. Additionally, the role of “precipitation” in influencing urban heat environments has also been identified as significant.

3. Definition and Standards of Heatwaves

Heatwave definitions vary significantly across countries, influenced by differences in geographical characteristics, ecological conditions, population densities, prevailing temperatures, urban planning practices, and levels of economic development (Table 2). Most countries and international organizations define heatwaves primarily in terms of daily maximum temperatures and their duration. Moreover, studies on the conceptual framework and measurement criteria of heatwaves have become increasingly detailed and systematic [53,54,55,56,57].
The diverse criteria for defining heatwaves have led scholars to adopt varying methodologies in their research. At present, certain studies rely on absolute temperature thresholds to define heatwaves. For example, the World Meteorological Organization (WMO) defines a heatwave as three consecutive days with daily maximum temperatures exceeding 32 °C, while some scholars suggest alternative thresholds of 30 °C or 35 °C [58,59]. As research advances, an increasing number of scholars are adopting relative thresholds to define and study heatwaves, which account more effectively for temperature variations across diverse geographical contexts. Common relative thresholds frequently utilized include 81%, 95%, and 97.5% [60,61,62,63]. Furthermore, some researchers integrate relative and absolute thresholds to improve the applicability of their definitions [64,65,66]. Studies indicate that relative thresholds, compared to absolute thresholds, more comprehensively account for regional environmental differences, rendering them more objective and suitable for diverse applications. In addition to temperature thresholds, some researchers have introduced other metrics, such as apparent temperature, wet-bulb temperature, and heat index to examine heatwaves’ impact on human thermal comfort [67,68,69]. These metrics emphasize human thermal tolerance to heatwaves, offering critical insights for heatwave risk assessment and the development of adaptive strategies.

4. Construction of a Heatwave Risk Assessment System

Risk assessment forms the cornerstone of urban heatwave risk management, playing a pivotal role in mitigating risks associated with heatwave events. It is particularly critical for identifying spatial heterogeneity in urban areas, driven by variations in land use, socioeconomic conditions, population density, and environmental factors [70]. The study of climate change adaptability can be traced back to the 1970s [71]. Early studies in developed countries focused on pathological aspects of high-temperature disaster risks, such as identifying temperature thresholds that adversely affect human health and examining the relationship between heat-related morbidity or mortality and individual characteristics [72]. With the progression of research, the focus has expanded to encompass comprehensive assessments of urban climate change vulnerability, urban resilience, and broader aspects of adaptability [73,74,75,76]. This evolution in research focus is evident in both methodological advancements and the refinement of assessment frameworks. For example, the Intergovernmental Panel on Climate Change (IPCC) introduced the concept of climate risk assessment in its Third Assessment Report, which incorporates holistic evaluations of climate change impacts, system vulnerabilities, and adaptive capacities [77]. A comprehensive heatwave risk assessment system generally involves the following four key steps: establishing the assessment framework, selecting relevant indicators, quantifying their weights, and developing an integrated evaluation model.

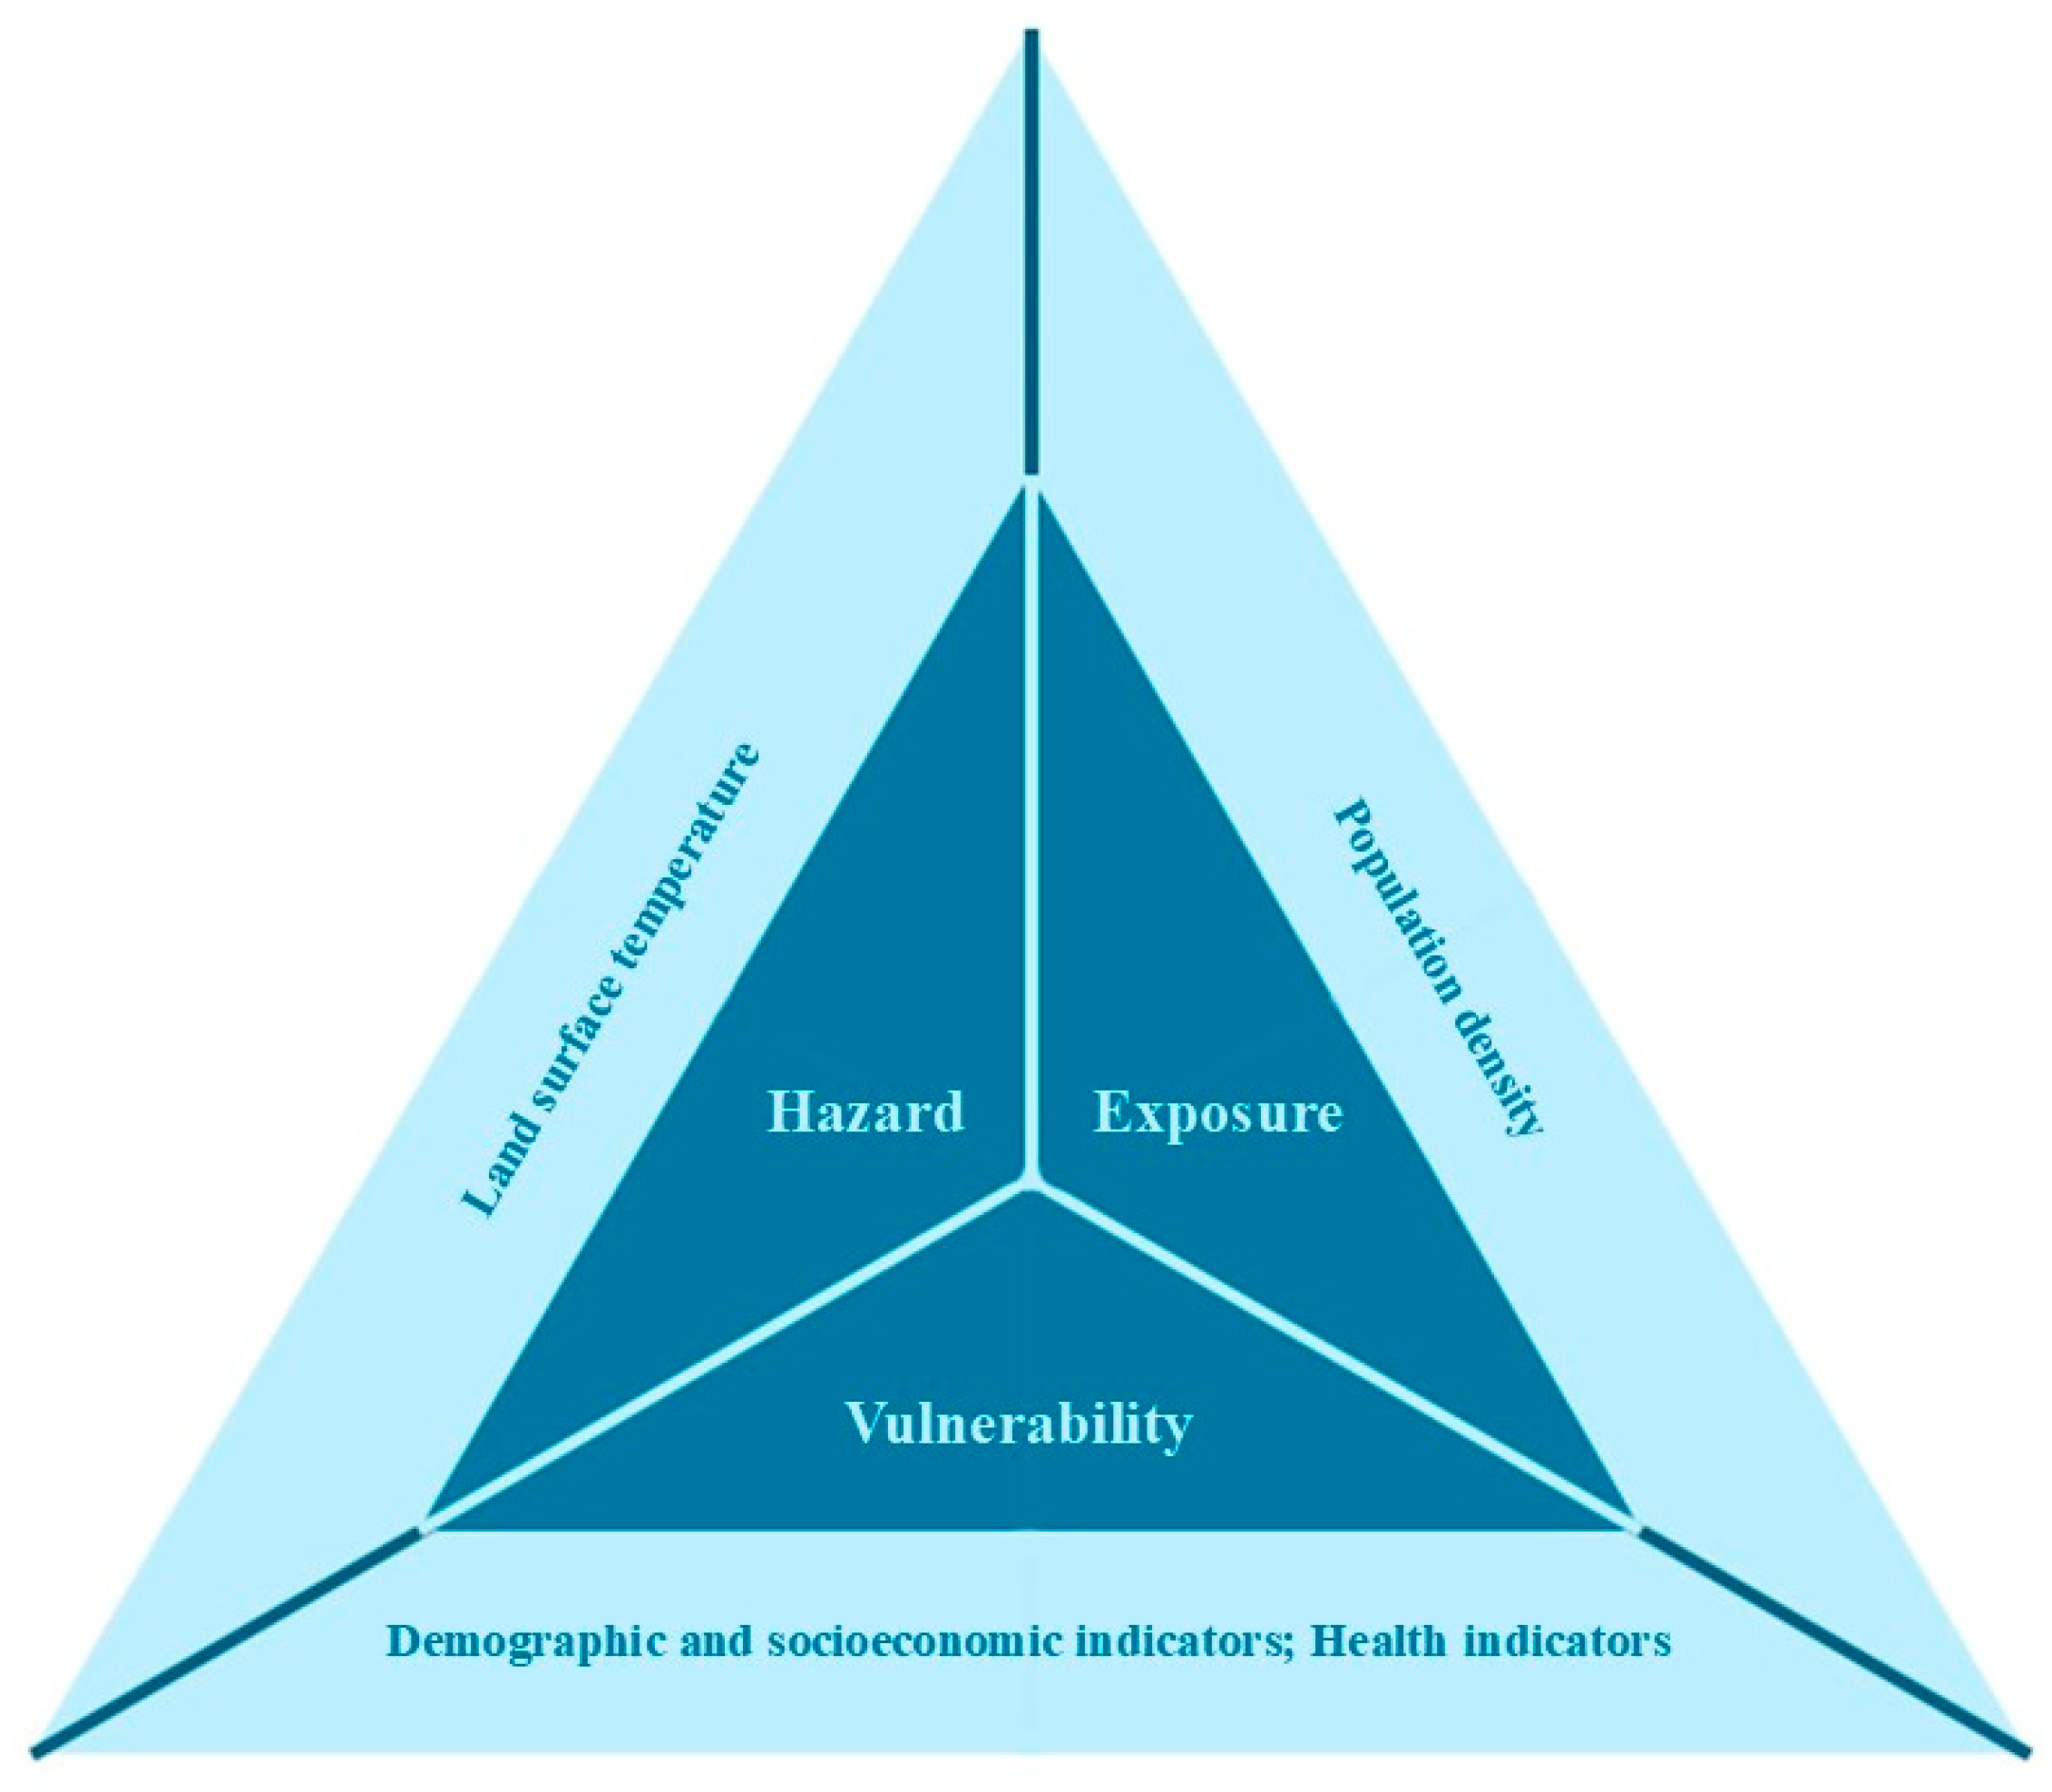
4.1. Determination of the Risk Assessment Framework

Early studies on high-temperature disasters predominantly examined their frequency, intensity, and duration [78], integrating assessments of natural environmental and sociocultural dimensions. For instance, Krüger established a heat sensitivity model developed a heat sensitivity model incorporating urban structure, population distribution, and thermal characteristics, which was applied to evaluate heatwave risks in Leipzig, Germany [79]. Crichton’s risk triangle, a widely utilized conceptual framework for heatwave risk assessments, conceptualizes risk as a function of hazard, exposure, and vulnerability, facilitating quantitative analysis (Figure 5) [80,81]. In related studies, the three components of the risk triangle—hazard, exposure, and vulnerability—are partially or fully adopted, with their applications largely contingent upon the study area’s characteristics and data availability [82,83,84,85,86]. For example, Marie-Leen Verdonck employed heat hazard, heat exposure, and heat vulnerability as primary components, integrating the latter two into an exposure–vulnerability index to evaluate near- and long-term heatwave risks in Brussels, using five indicators for simulation analysis [87]. Conversely, Weihua Dong developed a heatwave risk function based solely on heat hazard and vulnerability, employing one heat disaster indicator and four vulnerability indicators to simulate the global spatial distribution of near- and long-term average heatwave risks.
In addition to Crichton’s risk triangle, the heat vulnerability index (HVI) is widely employed as an alternative assessment framework for analyzing heatwave risks. The IPCC’s Fifth Assessment Report emphasized the importance of disaster risk assessment in climate change research and introduced a natural disaster risk framework based on “hazard, social vulnerability, and exposure” [88]. David M. Lapola employed a vulnerability index and a heat stress risk index to evaluate heat stress vulnerability and its associated risks across six metropolitan areas in Brazil. Their findings highlighted those areas with high exposure, but low resilience exhibited elevated heat stress vulnerability. Furthermore, regions characterized by relatively high urban temperatures and high vulnerability faced greater heat stress risks, whereas those with lower temperatures and reduced vulnerability experienced diminished risks [89]. Similarly, Aleksi Räsänen generated heat vulnerability and heatwave risk maps by evaluating the spatial weights and zonal distributions of vulnerability and risk indices. The study revealed that variations in research scale significantly influenced vulnerability zoning maps but had a comparatively smaller effect on heatwave risk maps [90].
Social vulnerability has emerged as a critical factor in evaluating the impacts of high temperatures on human health, with sensitivity and adaptive capacity identified as two primary dimensions [91]. Sensitivity denotes individuals’ susceptibility to heat-related hazards, often influenced by demographic characteristics and pre-existing medical conditions [92]. Adaptive capacity refers to the ability to mitigate or avoid the adverse effects of climate change, typically influenced by individuals’ awareness of preventive measures and the socioeconomic and healthcare capacities of their region [93]. However, current research often overlooks the variations in regional adaptive capacities when assessing heatwave risks. The IPCC’s Fourth Assessment Report initially highlighted the importance of adaptive capacity in addressing climate change and assessing vulnerability, a perspective further reinforced in its Fifth Assessment Report [88,94]. Several scholars have identified sensitivity, adaptive capacity, and exposure as the three core indicators for assessing vulnerability to high-temperature heatwaves. They have developed quantitative methods for evaluating climate change vulnerability by constructing mathematical models that integrate these factors [95,96,97,98]. In contrast, other researchers define heatwave risk as a function of the magnitude of the hazard, the sensitivity of the affected area to climate change, and the region’s adaptive capacity to respond to disasters [90].
Current research predominantly centers on economic vulnerability analysis, incorporating sensitivity and adaptability. However, significant gaps remain in spatialized assessments, and a standardized evaluation framework for heatwave risk assessment has yet to be developed. To address this, researchers have proposed the integration of exposure, hazard, vulnerability, and adaptability into the comprehensive hazard–exposure–vulnerability–adaptability (HEVA) framework, designed to holistically identify and assess risks associated with extreme high temperatures, which integrates the following four pillars:
(1)
Hazard: quantified via real-time thermal metrics.
(2)
Exposure: spatialized population density and mobility patterns.
(3)
Vulnerability: sociodemographic sensitivity.
(4)
Adaptability: cooling infrastructure and healthcare access.
The HEVA framework enhances the traditional risk triangle by adding adaptability—a dimension critical for dynamic risk mitigation. Unlike static models (e.g., HVI), HEVA quantifies adaptive capacity through various metrics, like cooling infrastructure and healthcare access, enabling proactive urban planning. This approach allows for a more comprehensive assessment of urban heatwave risks, particularly in the context of climate change and rapid urbanization. The HEVA framework is particularly suited for high-resolution spatial analysis, as it integrates both environmental and socioeconomic factors. For instance, Guo demonstrated the effectiveness of the HEVA framework in evaluating health risks through the lens of interactions among thermal radiation, human behavior, activities, and spatial characteristics, achieving high-resolution risk assessment results for a typical summer [99] (Figure 6).

4.2. Selection of Evaluation Indicators

4.2.1. Thermal Hazard Indicators

Heatwave hazards stem from external factors threatening the system, reflecting the extent of stress imposed on human health by elevated temperatures. These hazards are typically analyzed through metrics, such as heatwave duration [100,101], the maximum temperature during heatwaves [100,101], the frequency of heatwaves [102], or comprehensive thermal indices [78,103]. Both natural climatic variations and anthropogenic disturbances, such as the urban heat island effect, influence a region’s thermal hazards, which are ultimately reflected in its temperature characteristics [104]. Numerous studies have demonstrated a linear relationship between air temperature and remotely sensed land surface temperature [105,106]. Anomalous precipitation patterns often co-occur with extreme weather events, such as heatwaves, cold waves, floods, and droughts. Research has identified a linear relationship between precipitation and LST, with the strongest correlations occurring during summer months [106]. Consequently, indicators, such as near-surface air temperature, LST, heatwave frequency, and atmospheric precipitable water, are frequently employed to quantify heatwave intensity. Furthermore, some scholars conceptualize hazards as the physical impacts or trends of natural and anthropogenic events capable of causing damage to ecosystems, human lives, and property. Indicators, such as mortality and morbidity rates, are, thus, utilized to quantify health impacts [107,108,109].

4.2.2. Thermal Exposure Indicators

Exposure is defined as the extent and inherent characteristics of a system’s susceptibility to climate anomalies. Thermal exposure refers to the magnitude or value of disaster-relevant entities located in areas vulnerable to high-temperature stress [88,110], including individuals, buildings, infrastructure, ecosystems, cultural assets, and other elements. Studies indicate that urban underlying surfaces dominated by artificial structures are the primary contributors to the urban heat island effect [111]. Humans, as the primary entities impacted by heatwave disasters, play a critical role in determining the severity of disaster impacts. Consequently, indicators, such as vegetation cover, road density, impervious surface ratio, sky view factor, and surface roughness, alongside population density, are used to evaluate the exposure of heatwave-affected entities. Initial research on heat exposure emphasized pathological effects resulting from elevated temperatures. For instance, Semenza conducted a case–control study in Chicago, examining the relationship between high temperatures and mortality, with a focus on cardiovascular-related deaths [112]. Advancements in research have highlighted that the risks and impacts of heatwaves are determined not only by their frequency or intensity but also by human exposure and vulnerability. Consequently, thermal exposure is frequently linked to thermal comfort, with widely used indices including the universal thermal climate index (UTCI), physiological equivalent temperature (PET), and wet-bulb globe temperature (WBGT). For instance, Al-Bouwarthan employed WBGT to evaluate heat stress intensity and duration among construction workers in southeastern Saudi Arabia between June and September 2016 [113]. Similarly, Dong utilized UTCI to assess heatwave-related health risks across 177 neighborhoods in Wuhan, incorporating this metric into an assessment framework comprising “heat stress–social vulnerability–exposure” [90].

4.2.3. Thermal Vulnerability Indicators

Vulnerability is defined as the susceptibility of a system, subsystem, or system component to internal and external disturbances, alongside its limited resilience, which makes it prone to structural and functional changes [114]. Urban heatwave vulnerability, based on the broader concept of climate change vulnerability, is defined as a function that integrates the hazard level of heatwaves, the sensitivity of urban systems to climatic stressors, and their adaptive capacity [115]. Sensitivity denotes the degree to which a subject is affected by external environmental stressors, often determined by its internal structure. Adaptive capacity, on the other hand, represents the ability of urban social and economic systems to respond to and mitigate the adverse impacts of climatic events [116]. Initial research predominantly focused on sociodemographic factors, including age, gender, and educational attainment. For example, Reid examined a range of demographic characteristics, including education level, race, and income, along with spatial distributions of health conditions and air-conditioning usage, to develop heatwave vulnerability maps for the United States [117]. With advancements in data collection, biological variables, such as land surface temperature and vegetation cover, have increasingly been integrated into heatwave vulnerability studies [118]. Maier enhanced Reid’s model by incorporating land use, disease prevalence, and population data from Georgia, USA, to evaluate local heatwave vulnerability [119]. Later research revealed the influence of economic environments on human vulnerability to heatwave disasters, underscoring the importance of integrating socioeconomic factors into heatwave assessment frameworks [120,121,122]. In recent years, frameworks have increasingly incorporated the relationship between high temperatures and human health [123,124]. Studies commonly target vulnerable populations, including the elderly and young children, by integrating socioeconomic and environmental factors into thermal vulnerability indices to evaluate localized thermal vulnerability levels [125,126,127].

4.2.4. Thermal Adaptability Indicators

Adaptability is defined as a region’s or country’s capacity to respond effectively to disasters, encompassing both hard infrastructure and soft systems designed to enhance resilience, facilitate adaptation, and ensure rapid recovery from heat-related events. Regional adaptability to heatwave risks is influenced by local governments’ emergency response capabilities, economic conditions, and levels of technological advancement. Key adaptability factors include comprehensive healthcare systems, cooling infrastructure, facility availability, and natural features, such as vegetation and water bodies. These are often quantified using indicators, like income levels, access to medical and cooling facilities, and housing prices. Research demonstrates that greater vegetation and water body coverage is typically associated with lower heat-related mortality rates, as these natural features mitigate high temperatures through heat absorption [128,129]. Socioeconomic factors exhibit an inverse relationship with heat-related risks [121,122]. Generally, wealthier urban areas have brighter nighttime light, which can serve as an indirect proxy for socioeconomic status [130,131,132]. Additionally, the number of medical facilities is another critical indicator of adaptability [90].

4.3. Quantification of Evaluation Indicator Weights

Determining the weights of evaluation indicators is a critical step in the quantitative assessment of heatwave risks. Currently, methods for quantifying the weights of evaluation factors are primarily classified into four categories based on the sources and types of raw data, namely the overlay method, subjective weighting, objective weighting, and combined weighting.
The overlay method is one of the most commonly employed approaches in spatial assessments. This method assumes equal weights for all indicators influencing heatwaves and utilizes GIS technology to overlay relevant layers, thereby deriving the spatial distribution of vulnerability [133]. For example, Vescovi normalized four indicators representing socioeconomic vulnerability and applied equal weights in GIS to derive the spatial differentiation of socioeconomic vulnerability in Quebec City, Canada [134]. Similarly, Aubrecht employed a normalized and equally weighted overlay to assess vulnerability to heatwave hazards in Washington [135]. Despite its simplicity, ease of implementation in processing spatial data, and effectiveness in identifying regional distributions of heatwave risks, the overlay method fails to account for the varying impacts of different indicators due to the equal weighting of all factors, thereby limiting the accuracy and reliability of the results.
Subjective weighting is the earliest and most widely studied method. It involves experts assigning weights to different indicators based on their subjective judgment, typically with higher scores reflecting greater weights. Common methods for subjective weighting include the Delphi method, precedence chart method, analytic hierarchy process (AHP), fuzzy analytic hierarchy process (FAHP), ordered weighted averaging (OWA), outranking method (OM), binomial coefficient method, and decision alternative ratio evaluation system (DARE). Among these, the AHP is the most frequently employed. For instance, Bagdanaviciute used AHP to construct a coastal risk assessment system, allocating weights to various indicators related to coastal vulnerability and exposure indices [136]. Tran applied AHP to determine the weights of indicators based on three dimensions—exposure, sensitivity, and adaptability—in their health vulnerability assessment study in Vietnam [137]. Other methods, such as OWA, were employed by Rinner to present spatial distributions of heatwave vulnerability under optimistic, neutral, and pessimistic scenarios in Toronto [93]. El-Zein applied the OM method for heat vulnerability mapping in Sydney’s urban areas [96]. The advantage of subjective weighting lies in its ability to rank indicator weights based on specific issues, expert knowledge, and experience, with minimal discrepancies between the assigned weights and their actual importance. However, its limitation lies in the method’s inherent subjectivity, which can be influenced by the limitations of experts’ knowledge and experience.
To mitigate the excessive subjectivity in subjective weighting, scholars have proposed objective weighting methods. These methods determine the weights of indicators based on actual data, utilizing the performance of attribute differences in the evaluation for calculation. Common objective weighting methods include principal component analysis (PCA), the entropy weight method (EWM), and mean squared error (MSE); of these, PCA and the EWM are widely used in risk assessments. For instance, Alonso constructed urban heatwave vulnerability indices using AHP and PCA, respectively, to improve risk assessment accuracy [138]. Huang used the EWM to assess heatwave risks in Chongqing, China, to enhance the objectivity of weight assignment [139]. Guo applied the criteria importance through intercriteria correlation (CRITIC) method to calculate indicator weights. The CRITIC method comprehensively considers the relative importance of factors, retains the characteristics of raw data, and demonstrates greater flexibility and accuracy, making it particularly suitable for handling complex, multidimensional issues. The advantages of objective weighting methods lie in their strong objectivity, solid mathematical foundation, and the absence of subjective burdens on decisionmakers. However, their limitation lies in their inability to reflect decisionmakers’ subjective preferences for indicator importance, potentially leading to weights that contradict actual needs.
Combined weighting methods integrate the strengths of both subjective and objective weighting approaches. By considering decisionmakers’ subjective preferences while minimizing biases caused by subjective arbitrariness, these methods make the decision-making results more accurate and reliable. Common methods include the compromise coefficient method, linear weighted single-objective optimization method, entropy coefficient method, combined weighting method, and the Frank–Wolfe method. However, these methods involve complex algorithms, which can pose challenges for practical applications. Notably, the hesitant analytic hierarchy process (H-AHP) excels at reducing errors caused by decisionmakers’ hesitation, thereby improving overall evaluation accuracy, particularly in spatial data assessments. Wu applied H-AHP to assess the weights of exposure, sensitivity, and adaptability indicators, constructing a heat health vulnerability assessment model [140].

4.4. Construction of Comprehensive Evaluation Models

Based on the defined research conceptual framework, evaluation indicators, and their respective weights, two primary methods are used to establish comprehensive evaluation models, namely multiplication and division, and addition and subtraction. Aubrecht used the multiplication and division method to represent heatwave disaster vulnerability, calculating the product of natural environmental and socioeconomic factors [135]. El-Zein quantified vulnerability as “exposure × sensitivity ÷ adaptability”. On the other hand, Frazier used the addition and subtraction method to define natural disaster vulnerability as “exposure + sensitivity − adaptability”. Similarly, Guo calculated health risks from urban heat radiation using the addition and subtraction method, specifically as “hazard + exposure + sensitivity − adaptability”. In comparison, the multiplication and division method more effectively reflects the synergies among indicators and has gained widespread recognition in the academic community. It offers greater flexibility in expressing the interrelationships and weight effects of indicators. Due to their convenience in spatial assessments, both the multiplication and division method and the addition and subtraction method have been widely applied. Research has also shown that, without considering the weights at the indicator level, the accuracy of multiplication and division overlays is significantly superior to that of addition and subtraction overlays. However, when layers are not equally weighted, selecting a method with higher accuracy for constructing evaluation models remains an important direction for future research.

4.5. Discussion

The HEVA framework demonstrates significant potential for advancing sustainable urban heat resilience through its integrated assessment approach. Building upon traditional risk assessment models, this framework introduces adaptability as a critical fourth dimension, enabling more comprehensive evaluation of urban heatwave risks. Comparative analyses reveal that HEVA outperforms conventional frameworks, such as the risk triangle and heat vulnerability index across multiple metrics, including temporal resolution and policy alignment. The framework’s strength lies in its ability to bridge theoretical modeling with practical policy applications. By incorporating real-time spatial data and dynamic adaptability metrics, HEVA facilitates precision intervention planning at neighborhood scales. From a policy perspective, HEVA’s most significant contribution is its capacity to identify and address socio-spatial inequalities in heat vulnerability. The framework’s adaptability dimension provides new insights into the distribution of cooling resources and healthcare access, enabling more equitable heat resilience strategies. This represents a substantial advance over previous approaches that primarily focused on static vulnerability assessments. HEVA’s successful pilot tests in megacities (e.g., Beijing, Brussels) suggest its potential as a standardized heat-risk tool. However, expanding validation to arid and tropical cities is critical for broader applicability.
The findings of this study have significant implications for urban planning, architectural design, and climate adaptation strategies. From an urban planning perspective, the HEVA framework can identify high-risk areas, enabling targeted interventions, such as increasing green infrastructure, optimizing building layouts, and enhancing urban ventilation corridors. From an architectural standpoint, the integration of advanced materials, such as high-reflectivity coatings and phase-change materials, can significantly reduce indoor temperatures and mitigate heat-related health risks. Meanwhile, the integration of multi-source data (e.g., remote sensing and socioeconomic data) can support the development of dynamic heatwave risk maps, which can be updated in real-time to reflect changing conditions. For instance, recent studies in architectural science have demonstrated the effectiveness of using remote sensing data to optimize building orientation and material selection, thereby reducing urban heat island effects [141,142]. Additionally, the application of green roof technologies and reflective pavements has been shown to significantly lower surface temperatures in urban areas [143,144]. Additionally, socioeconomic disparities in heatwave vulnerability must be addressed through equitable access to cooling facilities and public health interventions. Finally, long-term climate adaptation strategies, such as the development of heatwave early warning systems and urban resilience planning, should be prioritized to ensure sustainable urban development in the face of increasing climate variability.
Previous studies on heatwave risk have primarily focused on vulnerability assessments based on traditional meteorological and socioeconomic data, with limited efforts to develop a comprehensive dynamic evaluation system using real-time spatial data. Heatwave risk assessment involves multiple indicators and levels, encompassing social, economic, and climatic factors. Future research should focus on the selection of assessment factors and the spatialization of traditional evaluation elements. Additionally, exploring the feasibility and applicability of using spatial data for risk assessment is crucial. Furthermore, it is essential to investigate how to develop a comprehensive dynamic evaluation model based on the dynamic changes in assessment factors in different regions, with a focus on enhancing the accuracy and reliability of the assessments.
The findings of this review highlight several critical areas for future research. First, the integration of real-time spatial data into heatwave risk assessment frameworks remains a significant challenge. Future studies should explore the feasibility of using dynamic data sources, such as satellite imagery and IoT sensors, to enhance the accuracy of risk assessments. Second, the development of hybrid weighting methods that combine subjective and objective approaches offers a promising avenue for improving the robustness of risk models. Finally, the application of these advanced frameworks in urban planning and policymaking should be further investigated, particularly in the context of climate change adaptation strategies.
Despite its innovative contributions, this study has several limitations that should be acknowledged. First, the HEVA framework’s current validation has primarily focused on Chinese megacities, which may limit its immediate applicability to cities with different urban morphologies or governance structures. Second, while the framework theoretically accommodates real-time data integration, most case studies to date have relied on periodic rather than continuous data streams due to technical and infrastructural constraints in many municipalities. Third, the weighting mechanisms for adaptability indicators remain context-dependent, requiring local calibration that may pose challenges for rapid deployment. Additionally, the framework’s effectiveness in informal settlements—where heat risks are often most acute— has not been systematically evaluated due to data availability issues. These limitations highlight important frontiers for both research and implementation.

5. Conclusions

This paper systematically reviews the global research progress on heatwave risk assessment, highlighting the integration of multi-source data and the development of hybrid weighting methods as key advancements. The proposed HEVA framework offers a comprehensive approach to assessing urban heatwave risks, addressing the limitations of traditional models. First, the HEVA framework can be used to identify high-risk areas within cities, enabling targeted interventions, such as increasing green infrastructure, improving building design, and enhancing emergency response systems. Second, the integration of multi-source data (e.g., remote sensing and socioeconomic data) can support the development of dynamic heatwave risk maps, which can be updated in real-time to reflect changing conditions. Finally, policymakers should prioritize the development of heatwave early warning systems, particularly in vulnerable communities, to reduce heat-related morbidity and mortality. These measures should be integrated into broader climate adaptation plans to ensure long-term resilience. Future research should focus on the spatialization of vulnerability and adaptability indicators, the integration of real-time data, and the application of advanced frameworks in urban planning and policymaking. Specifically, architectural research could explore the development of heat-resilient building designs, such as passive cooling systems and adaptive facades, to enhance thermal comfort in urban environments. Additionally, interdisciplinary studies combining architecture, environmental science, and public health could provide holistic solutions for mitigating heatwave risks, particularly in rapidly urbanizing regions. These efforts will contribute to the development of more accurate and reliable heatwave risk assessment systems, ultimately enhancing urban resilience to climate change.
Despite progress, no global standard for heatwave risk assessment exists, and methodological precision varies widely, highlighting the need for cross-regional validation of frameworks, like HEVA. It is essential to establish a comprehensive framework for heatwave risk assessment that integrates key dimensions, including the intensity of heatwave hazards, the exposure of vulnerable entities, the fragility of the hazard-prone environment, and adaptability to heatwave disasters. Identifying relevant indicators suitable for spatial evaluation, evaluating their significance and accessibility, and critically analyzing the strengths and limitations of different weight quantification methods are vital steps toward improving the accuracy and predictive capacity of heatwave risk assessments.
As a sudden climatic hazard, addressing heatwave risks requires a comprehensive and integrative approach to urban planning. This involves developing advanced optimization tools for analyzing urban climatic environments, with clearly defined control objectives, integration of diverse influencing factors, quantification of planning indicators, and the establishment of sophisticated design optimization platforms. Future research and practice should focus on optimizing thermal environments through urban design strategies that mitigate heat-related health risks, informed by robust risk assessment results. These efforts should aim to progressively establish comprehensive, long-term response mechanisms at scales ranging from regional to localized contexts. Urban policymakers, managers, and planners must develop targeted mitigation and adaptation strategies based on the spatial distribution of heat risks. Moreover, fostering collaboration among urban planning, environmental, and public health sectors is crucial. This interdisciplinary approach can enhance data accuracy and processing capabilities, promote innovative research, and provide precise urban design strategies to support the development of an efficient and reliable heatwave risk assessment framework.

Funding

This research was funded by China Ministry of Housing and Urban-Rural Development Scientific and Technological Project Plan (grant number 2022-K-184), Shandong Jianzhu University Doctoral Fund Project, Research on the Correlation between Urban Morphological Factors and Microclimate (grant number X20006Z), China Ministry of Education Humanities and Social Sciences Research Youth Fund Project (grant number 21YJC840038).

Conflicts of Interest

The authors declare no conflict of interest.

References

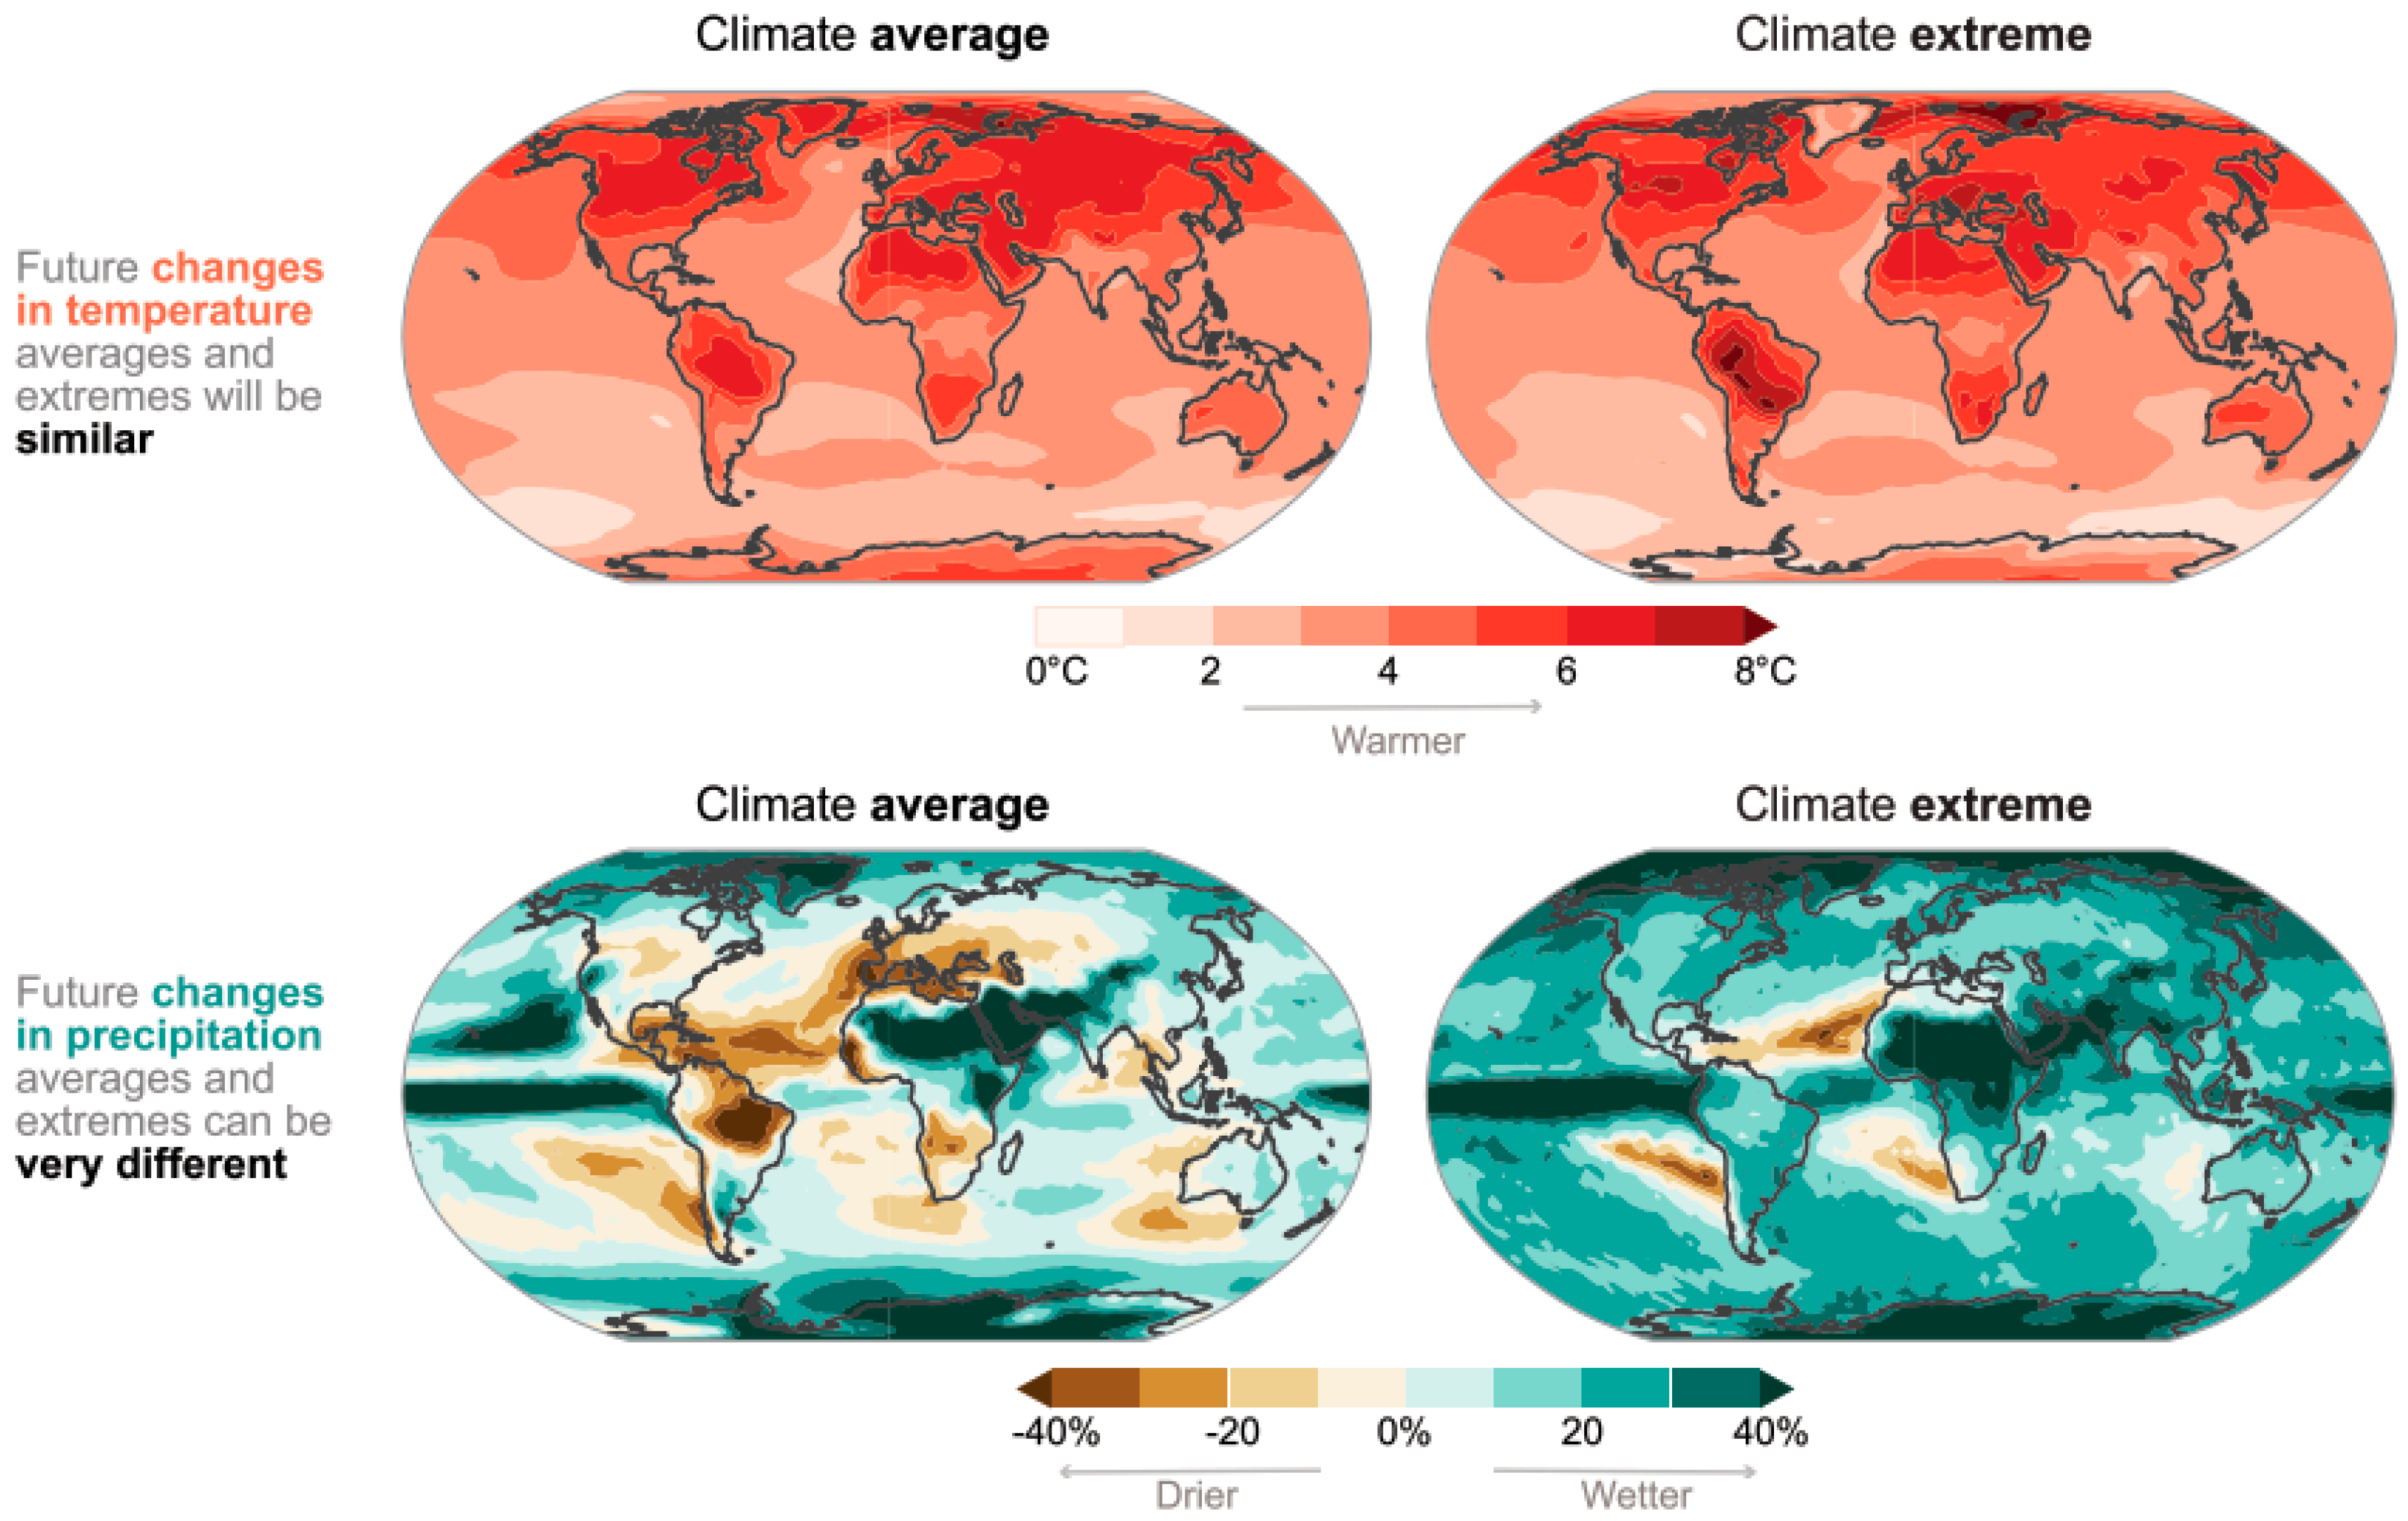
  1. IPCC. Climate Change 2021: The Physical Science Basis. Contribution of Working Group I to the Sixth Assessment Report of the Intergovernmental Panel on Climate Change; Cambridge University Press: Cambridge, UK, 2021. [Google Scholar]
  2. The Lancet. Global heating: An urgent call for action to protect health. Lancet 2022, 400, 1557. [Google Scholar] [CrossRef] [PubMed]
  3. Fang, Z.; Tang, T.; Zheng, Z.; Zhou, X.; Liu, W.; Zhang, Y. Thermal responses of workers during summer: An outdoor investigation of construction sites in South China. Sustain. Cities Soc. 2021, 66, 102705. [Google Scholar] [CrossRef]
  4. He, B.-J.; Zhao, D.; Dong, X.; Zhao, Z.; Li, L.; Duo, L.; Li, J. Will individuals visit hospitals when suffering heat-related illnesses? Yes, but…. Build. Environ. 2022, 208, 108587. [Google Scholar] [CrossRef]
  5. Goggins, W.B.; Chan, E.Y.Y.; Ng, E.; Ren, C.; Chen, L. Effect Modification of the Association between Short-term Meteorological Factors and Mortality by Urban Heat Islands in Hong Kong. PLoS ONE 2012, 7, e38551. [Google Scholar] [CrossRef]
  6. Wang, D.; Lau, K.K.-L.; Ren, C.; Goggins, W.B.; Shi, Y.; Ho, H.C.; Lee, T.-C.; Lee, L.-S.; Woo, J.; Ng, E. The impact of extremely hot weather events on all-cause mortality in a highly urbanized and densely populated subtropical city: A 10-year time-series study (2006–2015). Sci. Total Environ. 2019, 690, 923–931. [Google Scholar] [CrossRef]
  7. Guo, Y.; Punnasiri, K.; Tong, S. Effects of temperature on mortality in Chiang Mai city, Thailand: A time series study. Environ. Health 2012, 11, 36. [Google Scholar] [CrossRef]
  8. Guo, Y.; Gasparrini, A.; Armstrong Ben, G.; Tawatsupa, B.; Tobias, A.; Lavigne, E.; Coelho Micheline de Sousa Zanotti, S.; Pan, X.; Kim, H.; Hashizume, M.; et al. Heat Wave and Mortality: A Multicountry, Multicommunity Study. Environ. Health Perspect. 2017, 125, 087006. [Google Scholar] [CrossRef]
  9. Huang, C.; Cheng, J.; Phung, D.; Tawatsupa, B.; Hu, W.; Xu, Z. Mortality burden attributable to heatwaves in Thailand: A systematic assessment incorporating evidence-based lag structure. Environ. Int. 2018, 121, 41–50. [Google Scholar] [CrossRef]
  10. Heaviside, C.; Macintyre, H.; Vardoulakis, S. The Urban Heat Island: Implications for Health in a Changing Environment. Curr. Environ. Health Rep. 2017, 4, 296–305. [Google Scholar] [CrossRef]
  11. Zhou, W.; Wang, J.; Cadenasso, M.L. Effects of the spatial configuration of trees on urban heat mitigation: A comparative study. Remote Sens. Environ. 2017, 195, 1–12. [Google Scholar] [CrossRef]
  12. Amani-Beni, M.; Zhang, B.; Xie, G.-d.; Xu, J. Impact of urban park’s tree, grass and waterbody on microclimate in hot summer days: A case study of Olympic Park in Beijing, China. Urban. For. Urban. Green. 2018, 32, 1–6. [Google Scholar] [CrossRef]
  13. Qi, Q.; Meng, Q.; Dong, L.; Ren, P. Discussion on the Way of Combining between Urban Planning and Thermal Environment. J. Hum. Settl. West. China 2021, 36, 46–56. (In Chinese) [Google Scholar] [CrossRef]
  14. Ren, C.; Wu, E.; Lutz, K.; Feng, Z. The Development of Urban Climatic Map and Its Current Application Situation. J. Appl. Meteorol. Sci. 2012, 23, 593–603. (In Chinese) [Google Scholar]
  15. Scherer, D.; Fehrenbach, U.; Beha, H.D.; Parlow, E. Improved concepts and methods in analysis and evaluation of the urban climate for optimizing urban planning processes. Atmos. Environ. 1999, 33, 4185–4193. [Google Scholar] [CrossRef]
  16. Paszynski, J. Mapping urban topoclimates. Energy Build. 1991, 16, 1059–1062. [Google Scholar] [CrossRef]
  17. Gál, T.; Unger, J. Detection of ventilation paths using high-resolution roughness parameter mapping in a large urban area. Build. Environ. 2009, 44, 198–206. [Google Scholar] [CrossRef]
  18. Toshiaki, I.; Keisuke, H.; Kazuhiro, S. Impact of anthropogenic heat on urban climate in Tokyo. Atmos. Environ. 1999, 33, 3897–3909. [Google Scholar]
  19. Ren, C.; Ng, E.Y.Y.; Katzschner, L. Urban climatic map studies: A review. Int. J. Climatol. 2011, 31, 2213–2233. [Google Scholar] [CrossRef]
  20. He, X.D.; Miao, S.; Dou, J.; Shen, S. Preliminary establishment of Beijing Urban Climate Map (UCMap) system. J. Nanjing Univ. 2014, 50, 359–371. [Google Scholar]
  21. Stewart, I.D.; Oke, T.R. Local Climate Zones for Urban Temperature Studies. Bull. Am. Meteorol. Soc. 2012, 93, 1879–1900. [Google Scholar] [CrossRef]
  22. Verdonck, M.-L.; Demuzere, M.; Hooyberghs, H.; Beck, C.; Cyrys, J.; Schneider, A.; Dewulf, R.; Van Coillie, F. The potential of local climate zones maps as a heat stress assessment tool, supported by simulated air temperature data. Landsc. Urban. Plan. 2018, 178, 183–197. [Google Scholar] [CrossRef]
  23. Geletič, J.; Lehnert, M.; Savić, S.; Milošević, D. Inter-/intra-zonal seasonal variability of the surface urban heat island based on local climate zones in three central European cities. Build. Environ. 2019, 156, 21–32. [Google Scholar] [CrossRef]
  24. Zhou, Y.; Zhang, G.; Jiang, L.; Chen, X.; Xie, T.; Wei, Y.; Xu, L.; Pan, Z.; An, P.; Lun, F. Mapping local climate zones and their associated heat risk issues in Beijing: Based on open data. Sustain. Cities Soc. 2021, 74, 103174. [Google Scholar] [CrossRef]
  25. Kotharkar, R.; Bagade, A. Evaluating urban heat island in the critical local climate zones of an Indian city. Landsc. Urban. Plan. 2018, 169, 92–104. [Google Scholar] [CrossRef]
  26. Zhou, R.; Jiang, W.; He, X. Numerical simulation of the impacts of the thermal effects of urban canopy structure on the formation and the intensity of the urban heat island. Chin. J. Geophys. 2008, 51, 715–726. (In Chinese) [Google Scholar]
  27. Yang, J.; Ren, J.; Sun, D.; Xiao, X.; Xia, J.; Jin, C.; Li, X. Understanding land surface temperature impact factors based on local climate zones. Sustain. Cities Soc. 2021, 69, 102818. [Google Scholar] [CrossRef]
  28. Shi, Z.; Yang, J.; Zhang, Y.; Xiao, X.; Xia, J.C. Urban ventilation corridors and spatiotemporal divergence patterns of urban heat island intensity: A local climate zone perspective. Environ. Sci. Pollut. Res. 2022, 29, 74394–74406. [Google Scholar] [CrossRef]
  29. Zheng, B.; Chen, Y.; Hu, Y. Analysis of land cover and SUHII pattern using local climate zone framework—A case study of Chang-Zhu-Tan main urban area. Urban. Clim. 2022, 43, 101153. [Google Scholar] [CrossRef]
  30. Thomas, G.; Sherin, A.P.; Ansar, S.; Zachariah, E.J. Analysis of Urban Heat Island in Kochi, India, Using a Modified Local Climate Zone Classification. Procedia Environ. Sci. 2014, 21, 3–13. [Google Scholar] [CrossRef]
  31. Yu, Y.; Li, J.; Yuan, Q.; Shi, Q.; Shen, H.; Zhang, L. Coupling Dual Graph Convolution Network and Residual Network for Local Climate Zone Mapping. IEEE J. Sel. Top. Appl. Earth Obs. Remote Sens. 2022, 15, 1221–1234. [Google Scholar] [CrossRef]
  32. Rosentreter, J.; Hagensieker, R.; Waske, B. Towards large-scale mapping of local climate zones using multitemporal Sentinel 2 data and convolutional neural networks. Remote Sens. Environ. 2020, 237, 111472. [Google Scholar] [CrossRef]
  33. Yoo, C.; Han, D.; Im, J.; Bechtel, B. Comparison between convolutional neural networks and random forest for local climate zone classification in mega urban areas using Landsat images. ISPRS J. Photogramm. Remote Sens. 2019, 157, 155–170. [Google Scholar] [CrossRef]
  34. Thirumalai, K.; DiNezio, P.N.; Okumura, Y.; Deser, C. Extreme temperatures in Southeast Asia caused by El Niño and worsened by global warming. Nat. Commun. 2017, 8, 15531. [Google Scholar] [CrossRef] [PubMed]
  35. Phung, D.; Chu, C.; Tran, D.N.; Huang, C. Spatial variation of heat-related morbidity: A hierarchical Bayesian analysis in multiple districts of the Mekong Delta Region. Sci. Total Environ. 2018, 637–638, 1559–1565. [Google Scholar] [CrossRef]
  36. Russo, S.; Dosio, A.; Graversen, R.G.; Sillmann, J.; Carrao, H.; Dunbar, M.B.; Singleton, A.; Montagna, P.; Barbola, P.; Vogt, J.V. Magnitude of extreme heat waves in present climate and their projection in a warming world. J. Geophys. Res. Atmos. 2014, 119, 12500–12512. [Google Scholar] [CrossRef]
  37. Zampieri, M.; Russo, S.; di Sabatino, S.; Michetti, M.; Scoccimarro, E.; Gualdi, S. Global assessment of heat wave magnitudes from 1901 to 2010 and implications for the river discharge of the Alps. Sci. Total Environ. 2016, 571, 1330–1339. [Google Scholar] [CrossRef]
  38. Chen, Y.; Amani-Beni, M.; Chen, C.; Liang, Y.; Li, J.; Yang, L. Projection of urban land surface temperature: An inter- and intra-annual modeling approach. Urban. Clim. 2023, 51, 101637. [Google Scholar] [CrossRef]
  39. Kotharkar, R.; Bagade, A.; Ramesh, A. Assessing urban drivers of canopy layer urban heat island: A numerical modeling approach. Landsc. Urban. Plan. 2019, 190, 103586. [Google Scholar] [CrossRef]
  40. Russo, S.; Sillmann, J.; Sterl, A. Humid heat waves at different warming levels. Sci. Rep. 2017, 7, 7477. [Google Scholar] [CrossRef]
  41. Liu, D.; Chen, N.; Zhang, X.; Wang, C.; Du, W. Annual large-scale urban land mapping based on Landsat time series in Google Earth Engine and OpenStreetMap data: A case study in the middle Yangtze River basin. ISPRS J. Photogramm. Remote Sens. 2020, 159, 337–351. [Google Scholar] [CrossRef]
  42. Yu, Z.; Yao, Y.; Yang, G.; Wang, X.; Vejre, H. Spatiotemporal patterns and characteristics of remotely sensed region heat islands during the rapid urbanization (1995–2015) of Southern China. Sci. Total Environ. 2019, 674, 242–254. [Google Scholar] [CrossRef] [PubMed]
  43. Guo, G.; Wu, Z.; Chen, Y. Complex mechanisms linking land surface temperature to greenspace spatial patterns: Evidence from four southeastern Chinese cities. Sci. Total Environ. 2019, 674, 77–87. [Google Scholar] [CrossRef] [PubMed]
  44. Hajat, S.; Sheridan, S.C.; Allen, M.J.; Pascal, M.; Laaidi, K.; Yagouti, A.; Bickis, U.; Tobias, A.; Bourque, D.; Armstrong, B.G.; et al. Heat-health warning systems: A comparison of the predictive capacity of different approaches to identifying dangerously hot days. Am. J. Public Health 2010, 100, 1137–1144. [Google Scholar] [CrossRef] [PubMed]
  45. Jänicke, B.; Holtmann, A.; Kim, K.R.; Kang, M.; Fehrenbach, U.; Scherer, D. Quantification and evaluation of intra-urban heat-stress variability in Seoul, Korea. Int. J. Biometeorol. 2019, 63, 1–12. [Google Scholar] [CrossRef]
  46. Chen, L.; Yu, B.; Yang, F.; Mayer, H. Intra-urban differences of mean radiant temperature in different urban settings in Shanghai and implications for heat stress under heat waves: A GIS-based approach. Energy Build. 2016, 130, 829–842. [Google Scholar] [CrossRef]
  47. Pereira, C.T.; Masiero, É.; Bourscheidt, V. Socio-spatial inequality and its relationship to thermal (dis)comfort in two major Local Climate Zones in a tropical coastal city. Int. J. Biometeorol. 2021, 65, 1177–1187. [Google Scholar] [CrossRef]
  48. Matzarakis, A.; Rutz, F.; Mayer, H. Modelling radiation fluxes in simple and complex environments—Application of the RayMan model. Int. J. Biometeorol. 2007, 51, 323–334. [Google Scholar] [CrossRef]
  49. Gál, C.V.; Kántor, N. Modeling mean radiant temperature in outdoor spaces, A comparative numerical simulation and validation study. Urban. Clim. 2020, 32, 100571. [Google Scholar] [CrossRef]
  50. Guo, F.; Guo, R.; Zhang, H.; Dong, J.; Zhao, J. A canopy shading-based approach to heat exposure risk mitigation in small squares. Urban. Clim. 2023, 49, 101495. [Google Scholar] [CrossRef]
  51. Guo, F.; Guo, R. A new evaluation method for heat exposure risk integrated with outdoor spatial behaviour. World Archit. 2022, 9, 92–96. (In Chinese) [Google Scholar] [CrossRef]
  52. Santamouris, M. Recent progress on urban overheating and heat island research: Integrated assessment of the energy, environmental, vulnerability, and health impact. Synergies with the global climate change. Energy Build. 2020, 207, 109482. [Google Scholar] [CrossRef]
  53. Qi, X.; Li, D.; Jin, X.; Chen, Y. A review of Western research on heatwaves. Acta Ecol. Sin. 2016, 36, 2773–2778. (In Chinese) [Google Scholar]
  54. Kalkstein, L.S.; Jamason, P.F.; Greene, J.S.; Libby, J.; Robinson, L. The Philadelphia Hot Weather–Health Watch/Warning System: Development and application, summer 1995. Bull. Am. Meteorol. Soc. 1996, 77, 1519–1528. [Google Scholar] [CrossRef]
  55. Huynen, M.M.; Martens, P.; Schram, D.; Weijenberg, M.P.; Kunst, A.E. The impact of heat waves and cold spells on mortality rates in the Dutch population. Environ. Health Perspect. 2001, 109, 463–470. [Google Scholar] [CrossRef]
  56. Höppe, P.R. Heat balance modelling. Experientia 1993, 49, 741–746. [Google Scholar] [CrossRef]
  57. Matzarakis, A.; Mayer, H. Heat stress in Greece. Int. J. Biometeorol. 1997, 41, 34–39. [Google Scholar] [CrossRef]
  58. Huang, W.; Kan, H.; Kovats, S. The impact of the 2003 heat wave on mortality in Shanghai, China. Sci. Total Environ. 2010, 408, 2418–2420. [Google Scholar] [CrossRef]
  59. Wibig, J. Heat waves in Poland in the period 1951–2015: Trends, patterns, and driving factors. Meteorol. Hydrol. Water Manage. 2018, 6, 37–45. [Google Scholar] [CrossRef]
  60. Xie, W.; Zhou, B.; You, Q.; Zhang, Y.; Ullah, S. Observed changes in heat waves with different severities in China during 1961–2015. Theor. Appl. Climatol. 2020, 141, 1529–1540. [Google Scholar] [CrossRef]
  61. Meehl, G.A.; Tebaldi, C. More intense, more frequent, and longer lasting heat waves in the 21st century. Science 2004, 305, 994–997. [Google Scholar] [CrossRef]
  62. He, S.; Ge, Q.; Wu, S.; Li, M. Pre-estimation of spatiotemporal pattern of extreme heat hazard in China. J. Nat. Disasters 2010, 19, 91–97. (In Chinese) [Google Scholar] [CrossRef]
  63. Chen, R.; Lu, R. Comparisons of the circulation anomalies associated with extreme heat in different regions of Eastern China. J. Clim. 2015, 28, 5830–5844. [Google Scholar] [CrossRef]
  64. McCarthy, M.; Armstrong, L.; Armstrong, N. A new heatwave definition for the UK. Weather 2019, 74, 382–387. [Google Scholar] [CrossRef]
  65. Dian-Xiu, Y.; Ji-Fu, Y.; Zheng-Hong, C.; You-Fei, Z.; Rong-Jun, W. Spatial and temporal variations of heat waves in China from 1961 to 2010. Adv. Clim. Change Res. 2014, 5, 66–73. [Google Scholar] [CrossRef]
  66. Guo, X.; Huang, J.; Luo, Y.; Zhao, Z.; Xu, Y. Projection of heat waves over China for eight different global warming targets using 12 CMIP5 models. Theor. Appl. Climatol. 2017, 128, 507–522. [Google Scholar] [CrossRef]
  67. Steadman, R.G. The assessment of sultriness. Part I: A temperature-humidity index based on human physiology and clothing science. J. Appl. Meteorol. Climatol. 1979, 18, 861–873. [Google Scholar] [CrossRef]
  68. Steadman, R.G. A universal scale of apparent temperature. J. Appl. Meteorol. Climatol. 1984, 23, 1674–1687. [Google Scholar] [CrossRef]
  69. Jianguo, T. Development of relative comfort index for assessing heat stress in Shanghai summer. Trans. Atmos. Sci. 2005, 2, 213–218. (In Chinese) [Google Scholar] [CrossRef]
  70. Abrar, R.; Sarkar, S.K.; Nishtha, K.T.; Talukdar, S.; Shahfahad; Rahman, A.; Islam, A.R.; Mosavi, A. Assessing the spatial mapping of heat vulnerability under urban heat island (UHI) effect in the Dhaka Metropolitan Area. Sustainability 2022, 14, 4945. [Google Scholar] [CrossRef]
  71. Nalau, J.; Verrall, B. Mapping the evolution and current trends in climate change adaptation science. Clim. Risk Manag. 2021, 32, 100290. [Google Scholar] [CrossRef]
  72. Harlan, S.L.; Declet-Barreto, J.H.; Stefanov, W.L.; Petitti, D.B. Neighborhood effects on heat deaths: Social and environmental predictors of vulnerability in Maricopa County, Arizona. Environ. Health Perspect. 2013, 121, 197–204. [Google Scholar] [CrossRef] [PubMed]
  73. Markanday, A.; Galarraga, I.; Markandya, A. A critical review of cost-benefit analysis for climate change adaptation in cities. Clim. Change Econ. 2019, 10, 1950014. [Google Scholar] [CrossRef]
  74. Araya-Muñoz, D.; Metzger, M.J.; Stuart, N.; Wilson, A.M.W.; Alvarez, L. Assessing urban adaptive capacity to climate change. J. Environ. Manag. 2016, 183, 314–324. [Google Scholar] [CrossRef] [PubMed]
  75. Oberlack, C.; Eisenack, K. Alleviating barriers to urban climate change adaptation through international cooperation. Glob. Environ. Change 2014, 24, 349–362. [Google Scholar] [CrossRef]
  76. Masson, V.; Marchadier, C.; Adolphe, L.; Aguejdad, R.; Avner, P.; Bonhomme, M.; Bretagne, G.; Briottet, X.; Bueno, B.; de Munck, C.; et al. Adapting cities to climate change: A systemic modelling approach. Urban. Clim. 2014, 10, 407–429. [Google Scholar] [CrossRef]
  77. Solomon, S.; Qin, D.; Manning, M.; Chen, Z.; Marquis, M.; Avery, K.; Alley, R.; Berntsen, T.; Bindoff, N.; Chidthaisong, A. Climate Change 2001: The Physical Science Basis. Contribution of working group I to the Third Assessment Report of the Intergovernmental Panel on Climate Change; Intergovernmental Panel on Climate Change: Geneva, Switzerland, 2001.
  78. Li, S.; Zhang, D.; Liu, X. Spatiotemporal variability of heat waves in the Beijing-Tianjin-Hebei region and influencing factors in recent 54 years. J. Appl. Meteorol. Sci. 2015, 26, 545–554. (In Chinese) [Google Scholar]
  79. Krüger, T.; Held, F.; Hoechstetter, S.; Goldberg, V.; Geyer, T.; Kurbjuhn, C. A new heat sensitivity index for settlement areas. Urban. Clim. 2013, 6, 63–81. [Google Scholar] [CrossRef]
  80. Wang, S.; Sun, Q.C.; Huang, X.; Tao, Y.; Dong, C.; Das, S.; Liu, Y. Health-integrated heat risk assessment in Australian cities. Environ. Impact Assess. Rev. 2023, 102, 107176. [Google Scholar] [CrossRef]
  81. Crichton, D. The risk triangle. Nat. Disaster Manag. 1999, 102, 102–103. [Google Scholar]
  82. Dong, W.; Liu, Z.; Zhang, L.; Tang, Q.; Liao, H.; Li, X. Assessing heat health risk for sustainability in Beijing’s urban heat island. Sustainability 2014, 6, 7334–7357. [Google Scholar] [CrossRef]
  83. Morabito, M.; Crisci, A.; Gioli, B.; Gualtieri, G.; Toscano, P.; Di Stefano, V.; Orlandini, S.; Gensini, G.F. Urban-hazard risk analysis: Mapping of heat-related risks in the elderly in major Italian cities. PLoS ONE 2015, 10, e0127277. [Google Scholar] [CrossRef] [PubMed]
  84. Ho, H.C.; Lau, K.K.-L.; Ren, C.; Ng, E. Characterizing prolonged heat effects on mortality in a sub-tropical high-density city, Hong Kong. Int. J. Biometeorol. 2017, 61, 1935–1944. [Google Scholar] [CrossRef] [PubMed]
  85. Chen, G.; Li, S.; Knibbs, L.D.; Hamm, N.A.S.; Cao, W.; Li, T.; Guo, J.; Ren, H.; Abramson, M.J.; Guo, Y. A machine learning method to estimate PM(2.5) concentrations across China with remote sensing, meteorological and land use information. Sci. Total Environ. 2018, 636, 52–60. [Google Scholar] [CrossRef] [PubMed]
  86. Chen, Q.; Ding, M.; Yang, X.; Hu, K.; Qi, J. Spatially explicit assessment of heat health risk by using multi-sensor remote sensing images and socioeconomic data in Yangtze River Delta, China. Int. J. Health Geogr. 2018, 17, 15. [Google Scholar] [CrossRef]
  87. Verdonck, M.-L.; Demuzere, M.; Hooyberghs, H.; Priem, F.; Van Coillie, F. Heat risk assessment for the Brussels capital region under different urban planning and greenhouse gas emission scenarios. J. Environ. Manag. 2019, 249, 109210. [Google Scholar] [CrossRef]
  88. Field, C.B.; Barros, V.R.; IPCC. IPCC, 2014: Climate Change 2014: Impacts, Adaptation, and Vulnerability. Part A: Global and Sectoral Aspects; Contribution of Working Group II to the Fifth Assessment Report of the Intergovernmental Panel on Climate Change; Cambridge University Press: Cambridge, UK, 2014. [Google Scholar]
  89. Lapola, D.M.; Braga, D.R.; Di Giulio, G.M.; Torres, R.R.; Vasconcellos, M.P. Heat stress vulnerability and risk at the (super) local scale in six Brazilian capitals. Clim. Change 2019, 154, 477–492. [Google Scholar] [CrossRef]
  90. Räsänen, A.; Heikkinen, K.; Piila, N.; Juhola, S. Zoning and weighting in urban heat island vulnerability and risk mapping in Helsinki, Finland. Reg. Environ. Chang. 2019, 19, 1481–1493. [Google Scholar] [CrossRef]
  91. Zheng, M.; Zhang, J.; Shi, L.; Zhang, D.; Pangali Sharma, T.P.; Prodhan, F.A. Mapping Heat-Related Risks in Northern Jiangxi Province of China Based on Two Spatial Assessment Frameworks Approaches. Int. J. Environ. Res. Public Health 2020, 17, 6584. [Google Scholar] [CrossRef]
  92. Romero-Lankao, P.; Qin, H.; Dickinson, K. Urban vulnerability to temperature-related hazards: A meta-analysis and meta-knowledge approach. Glob. Environ. Change 2012, 22, 670–683. [Google Scholar] [CrossRef]
  93. Rinner, C.; Patychuk, D.; Bassil, K.; Nasr, S.; Gower, S.; Campbell, M. The Role of Maps in Neighborhood-level Heat Vulnerability Assessment for the City of Toronto. Cartogr. Geogr. Inf. Sci. 2010, 37, 31–44. [Google Scholar] [CrossRef]
  94. Solomon, S.; Qin, D.; Manning, M.; Chen, Z.; Marquis, M. IPCC 2007: Climate Change 2007: The Physical Science Basis. Contribution of Working Group I to the Fourth Assessment Report of the Intergovernmental Panel on Climate Change. IPCC 2007, 18, 95–123. Available online: http://www.ipcc.ch/publications_and_data/publications_ipcc_fourth_assessment_report_wg1_report_the_physical_science_basis.htm (accessed on 15 October 2024).
  95. Wolf, T.; McGregor, G. The development of a heat wave vulnerability index for London, United Kingdom. Weather. Clim. Extrem. 2013, 1, 59–68. [Google Scholar] [CrossRef]
  96. El-Zein, A.; Tonmoy, F.N. Assessment of vulnerability to climate change using a multi-criteria outranking approach with application to heat stress in Sydney. Ecol. Indic. 2015, 48, 207–217. [Google Scholar] [CrossRef]
  97. Nagy, G.J.; Filho, W.L.; Azeiteiro, U.M.; Heimfarth, J.; Verocai, J.E.; Li, C. An Assessment of the Relationships between Extreme Weather Events, Vulnerability, and the Impacts on Human Wellbeing in Latin America. Int. J. Environ. Res. Public Health 2018, 15, 1802. [Google Scholar] [CrossRef]
  98. Ozkan, A.; Ozkan, G.; Yalaman, A.; Yildiz, Y. Climate risk, culture and the COVID-19 mortality: A cross-country analysis. Sci. Direct World Dev. 2021, 141, 105412. [Google Scholar] [CrossRef]
  99. Guo, R.; Guo, F.; Dong, J.; Wang, Z.; Zheng, R.; Zhang, H. Finer-scale urban health risk assessment based on the interaction perspective of thermal radiation, human, activity, and space. Front. Archit. Res. 2024, 13, 682–697. [Google Scholar] [CrossRef]
  100. Zheng, Y.; Wu, R.; Yin, J. Temporal and spatial feature analyses of summer high temperature and heat wave in Jiangsu Province in past 50 years. J. Nat. Disasters 2012, 21, 43–50. (In Chinese) [Google Scholar] [CrossRef]
  101. Li, M.; Zhang, Y.; Liu, X. Spatiotemporal distribution of extreme maximum temperature in agro-pastoral zone of north China. J. Nat. Disasters 2014, 23, 190–199. (In Chinese) [Google Scholar] [CrossRef]
  102. Wu, R.; Liu, J.; Tan, J.; Xu, X.; Yu, Y. Trend analysis of high temperature disaster in large cities of the Yangtze River Delta. J. Nat. Disasters 2010, 19, 56–63. (In Chinese) [Google Scholar] [CrossRef]
  103. Shen, H.; Wang, P.; Kong, L. Analysis on heat waves variation features in China during 1961–2014. J. Meteorol. Sci. 2018, 38, 28–36. (In Chinese) [Google Scholar]
  104. Liu, J.; Wang, L. Thermal Health Risk Identification, Assessment and Urban Design Intervention in High-Density Cities from the Perspective of Climate Change: A Case Study of Macao. Urban. Plan. Int. 2022, 1, 1–14. (In Chinese) [Google Scholar] [CrossRef]
  105. Han, X.; Dou, F. Study of obtaining high resolution near-surface atmosphere temperature by using the land surface temperature from meteorological satellite data. Acta Meteorol. Sin. 2012, 70, 1107–1118. (In Chinese) [Google Scholar]
  106. Wei, J.; Xu, Q. Research on High Temperature Indices of Beijing City and Its Spatiotemporal Pattern Based on Satellite Data. Clim. Environ. Res. 2014, 19, 332–342. (In Chinese) [Google Scholar]
  107. Kaufman, J.; Deguen, S.; Benmarhnia, T.; Smargiassi, A. Vulnerability to Heat-related Mortality: A Systematic Review, Meta-analysis, and Meta-regression Analysis. Epidemiology 2015, 26, 781–793. [Google Scholar] [CrossRef]
  108. Bekkar, B.; Pacheco, S.; Basu, R.; DeNicola, N. Association of Air Pollution and Heat Exposure With Preterm Birth, Low Birth Weight, and Stillbirth in the US: A Systematic Review. JAMA Netw. Open 2020, 3, e208243. [Google Scholar] [CrossRef]
  109. Mac, V.V.T.; McCauley, L.A. Farmworker Vulnerability to Heat Hazards: A Conceptual Framework. J. Nurs. Scholarsh. 2017, 49, 617–624. [Google Scholar] [CrossRef]
  110. Yin, Z.E.; Yin, J.; Zhang, X. Multi-scenario-based hazard analysis of high temperature extremes experienced in China during 1951–2010. J. Geogr. Sci. 2013, 23, 436–446. [Google Scholar] [CrossRef]
  111. Ji, C.; Li, W.; Xuan, C. Impact of urban growth on the heat island in Beijing. Chin. J. Geophys. 2006, 49, 69–77. (In Chinese) [Google Scholar]
  112. Semenza, J.C.; Rubin, C.H.; Falter, K.H.; Selanikio, J.D.; Flanders, W.D.; Howe, H.L.; Wilhelm, J.L. Heat-Related Deaths during the July 1995 Heat Wave in Chicago. N. Engl. J. Med. 1996, 335, 84–90. [Google Scholar] [CrossRef]
  113. Al-Bouwarthan, M.; Quinn, M.M.; Kriebel, D.; Wegman, D.H. Assessment of Heat Stress Exposure among Construction Workers in the Hot Desert Climate of Saudi Arabia. Ann. Work. Expo. Health 2019, 63, 505–520. [Google Scholar] [CrossRef]
  114. Li, H.; Cheng, Y. Concepts and Assessment Methods of Vulnerability. Prog. Geogr. 2008, 27, 18–25. (In Chinese) [Google Scholar]
  115. Yang, H.; Tao, S.; Pan, J.; Liu, K.; Wu, M. Vulnerability to Heat Waves and Adaptation: A Summary. Sci. Technol. Rev. 2010, 28, 98–102. (In Chinese) [Google Scholar]
  116. Pei, X.; Wang, J.; Xue, J.; Zhao, J.; Liu, C.; Tian, Y. Assessment on Cities’ Adaptation to Climate Change in China. Urban. Dev. Stud. 2022, 29, 39–46, 52. (In Chinese) [Google Scholar] [CrossRef]
  117. Reid, C.E.; O’Neill, M.S.; Gronlund, C.J.; Brines, S.J.; Brown, D.G.; Diez-Roux, A.V.; Schwartz, J. Mapping Community Determinants of Heat Vulnerability. Environ. Health Perspect. 2009, 117, 1730–1736. [Google Scholar] [CrossRef]
  118. Imran, H.M.; Hossain, A.; Shammas, M.I.; Das, M.K.; Islam, M.R.; Rahman, K.; Almazroui, M. Land surface temperature and human thermal comfort responses to land use dynamics in Chittagong city of Bangladesh. Geomat. Nat. Hazards Risk 2022, 13, 2283–2312. [Google Scholar] [CrossRef]
  119. Maier, G.; Grundstein, A.; Jang, W.; Li, C.; Naeher, L.P.; Shepherd, M. Assessing the Performance of a Vulnerability Index during Oppressive Heat across Georgia, United States. Weather. Clim. Soc. 2014, 6, 253–263. [Google Scholar] [CrossRef]
  120. Song, C.; Wang, F.; Zhang, R.; Bai, C.; Liu, K.; Long, Q. Risk Analysis and Assessment of High-temperature and Heat-wave Disaster in Chinese Cities Under the Background of Climate Change. J. Catastrophology 2016, 31, 201–206. (In Chinese) [Google Scholar]
  121. Dong, J.; Peng, J.; He, X.; Corcoran, J.; Qiu, S.; Wang, X. Heatwave-induced human health risk assessment in megacities based on heat stress-social vulnerability-human exposure framework. Landsc. Urban. Plan. 2020, 203, 103907. [Google Scholar] [CrossRef]
  122. O’Neill, M.S.; Zanobetti, A.; Schwartz, J. Modifiers of the Temperature and Mortality Association in Seven US Cities. Am. J. Epidemiol. 2003, 157, 1074–1082. [Google Scholar] [CrossRef]
  123. Stillman, J.H. Heat Waves, the New Normal: Summertime Temperature Extremes Will Impact Animals, Ecosystems, and Human Communities. Physiology 2019, 34, 86–100. [Google Scholar] [CrossRef]
  124. Hajat, S.; Vardoulakis, S.; Heaviside, C.; Eggen, B. Climate change effects on human health: Projections of temperature-related mortality for the UK during the 2020s, 2050s and 2080s. J. Epidemiol. Community Health 2014, 68, 641. [Google Scholar] [CrossRef] [PubMed]
  125. Azhar, G.; Saha, S.; Ganguly, P.; Mavalankar, D.; Madrigano, J. Heat Wave Vulnerability Mapping for India. Int. J. Environ. Res. Public. Health 2017, 14, 357. [Google Scholar] [CrossRef]
  126. Xiang, Z.; Qin, H.; He, B.-J.; Han, G.; Chen, M. Heat vulnerability caused by physical and social conditions in a mountainous megacity of Chongqing, China. Sustain. Cities Soc. 2022, 80, 103792. [Google Scholar] [CrossRef]
  127. Bao, J.; Li, X.; Yu, C. The Construction and Validation of the Heat Vulnerability Index, a Review. Int. J. Environ. Res. Public Health 2015, 12, 7220–7234. [Google Scholar] [CrossRef] [PubMed]
  128. Bowler, D.E.; Buyung-Ali, L.; Knight, T.M.; Pullin, A.S. Urban greening to cool towns and cities: A systematic review of the empirical evidence. Landsc. Urban. Plan. 2010, 97, 147–155. [Google Scholar] [CrossRef]
  129. Zhang, W.; Zhu, Y.; Jiang, J. Effect of the Urbanization of Wetlands on Microclimate: A Case Study of Xixi Wetland, Hangzhou, China. Sustainability 2016, 8, 885. [Google Scholar] [CrossRef]
  130. Guo, B.; Bian, Y.; Zhang, D.; Su, Y.; Wang, X.; Zhang, B.; Wang, Y.; Chen, Q.; Wu, Y.; Luo, P. Estimating Socio-Economic Parameters via Machine Learning Methods Using Luojia1-01 Nighttime Light Remotely Sensed Images at Multiple Scales of China in 2018. IEEE Access 2021, 9, 34352–34365. [Google Scholar] [CrossRef]
  131. Mellander, C.; Lobo, J.; Stolarick, K.; Matheson, Z. Night-Time Light Data: A Good Proxy Measure for Economic Activity? PLoS ONE 2015, 10, e0139779. [Google Scholar] [CrossRef]
  132. Cai, J.; Huang, B.; Song, Y. Using multi-source geospatial big data to identify the structure of polycentric cities. Remote Sens. Environ. 2017, 202, 210–221. [Google Scholar] [CrossRef]
  133. Xie, P.; Wang, Y.; Peng, J.; Liu, Y. Health related urban heat wave vulnerability assessment: Research progress and framework. Prog. Geogr. 2015, 34, 165–174. (In Chinese) [Google Scholar]
  134. Luc, V.; Martine, R.; Florian, R. Assessing public health risk due to extremely high temperature events: Climate and social parameters. Clim. Res. 2005, 30, 71–78. [Google Scholar]
  135. Aubrecht, C.; Oezceylan, D. Identification of heat risk patterns in the U.S. National Capital Region by integrating heat stress and related vulnerability. Environ. Int. 2013, 56, 65–77. [Google Scholar] [CrossRef] [PubMed]
  136. Bagdanaviciute, I.; Kelpsaite-Rimkiene, L.; Galiniene, J.; Soomere, T. Index based multi-criteria approach to coastal risk assesment. J. Coast. Conserv. 2019, 23, 785–800. [Google Scholar] [CrossRef]
  137. Tran, D.N.; Doan, V.Q.; Nguyen, V.T.; Khan, A.; Thai, P.K.; Huang, C.R.; Chu, C.; Schak, E.; Phung, D. Spatial patterns of health vulnerability to heatwaves in Vietnam. Int. J. Biometeorol. 2020, 64, 863–872. [Google Scholar] [CrossRef]
  138. Alonso, L.; Renard, F. A Comparative Study of the Physiological and Socio-Economic Vulnerabilities to Heat Waves of the Population of the Metropolis of Lyon (France) in a Climate Change Context. Int. J. Environ. Res. Public Health 2020, 17, 1004. [Google Scholar] [CrossRef]
  139. Haijing, H.; Jinhui, M.J.; Yufei, Y. Spatial Identification and Risk Assessment of High-Temperature Heat Wave Disasters in Mountain Cities: A Case Study of Chongqing. Landsc. Archit. 2024, 31, 95–103. (In Chinese) [Google Scholar]
  140. Wu, X.L.; Liu, Q.S.; Huang, C.; Li, H. Mapping Heat-Health Vulnerability Based on Remote Sensing: A Case Study in Karachi. Remote Sens. 2022, 14, 1590. [Google Scholar] [CrossRef]
  141. Li, S.; Zhu, Y.; Wan, H.; Xiao, Q.; Teng, M.; Xu, W.; Qiu, X.; Wu, X.; Wu, C. Effectiveness of potential strategies to mitigate surface urban heat island: A comprehensive investigation using high-resolution thermal observations from an unmanned aerial vehicle. Sustain. Cities Soc. 2024, 113, 105716. [Google Scholar] [CrossRef]
  142. Almeida, C.R.; Teodoro, A.C.; Gonçalves, A. Study of the Urban Heat Island (UHI) Using Remote Sensing Data/Techniques: A Systematic Review. Environments 2021, 8, 105. [Google Scholar] [CrossRef]
  143. Mihalakakou, G.; Souliotis, M.; Papadaki, M.; Menounou, P.; Dimopoulos, P.; Kolokotsa, D.; Paravantis, J.A.; Tsangrassoulis, A.; Panaras, G.; Giannakopoulos, E.; et al. Green roofs as a nature-based solution for improving urban sustainability: Progress and perspectives. Renew. Sustain. Energy Rev. 2023, 180, 113306. [Google Scholar] [CrossRef]
  144. Nagar, C.; Verma, S.K.; Sen, S. Synergistic deployment of green infrastructure and reflective pavements for mitigation of UHI within urban blocks. Discov. Cities 2025, 2, 7. [Google Scholar] [CrossRef]
Figure 1. Global projections of future changes in long-term average (Left) and extreme conditions (Right) for surface temperature (Top) and precipitation (Bottom). (Source: IPCC Sixth Assessment Report).
Sustainability 17 03747 g001
Figure 2. Annual distribution of publications on urban heatwave risk assessment from 2007 to 2024.
Sustainability 17 03747 g002
Figure 3. Publication output of the top 20 countries in research from 2007 to 2024.
Sustainability 17 03747 g003
Figure 4. Co-occurrence diagram of the top ten keywords in urban heatwave risk assessment research from 2007 to 2024.
Sustainability 17 03747 g004
Figure 5. Crichton’ s risk triangle.
Sustainability 17 03747 g005
Figure 6. HEVA framework.
Sustainability 17 03747 g006
Table 1. Top 20 high-frequency keywords in 2007–2024.
OrderKeywordsNumberOrderCriteriaFocus
1Climate change8811Precipitation19
2Mortality5312Impacts15
3Impact5113Model15
4Temperature5114Thermal comfort14
5Risk3415City13
6Index2216Health13
7Waves2217Adaptation12
8Summer2018Heat waves12
9Variability2019Events11
10Climate1920Extreme heat11
Table 2. Definition and standards of heatwaves by different countries and organizations.
National/International OrganizationsMeasurement IndicatorsCriteriaFocus
World Meteorological Organization (WMO)Daily maximum temperature and durationDaily maximum temperature > 32 °C for more than 3 consecutive daysTemperature
China Meteorological AdministrationDaily maximum temperature and durationDaily maximum temperature ≥ 35 °C for more than 3 consecutive daysTemperature
Royal Netherlands Meteorological InstituteDaily maximum temperature and durationDaily maximum temperature > 25 °C for 5 days, with at least 3 days exceeding 30 °CTemperature
United KingdomDaily maximum and nighttime temperatures with durationDaily maximum temperature > 30 °C for 2 consecutive days, nighttime temperature > 15 °CTemperature
GreeceDaily maximum temperature and durationDaily maximum temperature ≥ 38 °C for more than 3 consecutive daysTemperature
India, MaltaDaily maximum temperatureDaily maximum temperature > 40 °CTemperature
Turkeyinstantaneous temperature and relative humiditytemperature > 27 °C and relative humidity > 40%Temperature and humidity
USA, Canada, IsraelHeat index (apparent temperature)Heat index > 40.5 °C for more than 3 h on 2 consecutive days, or >46.5 °C at any timeCombined temperature and humidity
GermanyPhysiological equivalent temperature (PET)PET > 41 °C as the threshold for heatwave warningHuman heat balance model
Disclaimer/Publisher’s Note: The statements, opinions and data contained in all publications are solely those of the individual author(s) and contributor(s) and not of MDPI and/or the editor(s). MDPI and/or the editor(s) disclaim responsibility for any injury to people or property resulting from any ideas, methods, instructions or products referred to in the content.

