1. Introduction
Sustainable cities are the new agenda for urban planning [
1,
2]. The goal is to reduce the footprint of our cities, particularly the ‘carbon footprint’, whilst improving the liveability. The authors suggest that the carbon reduction required can be achieved through better integration of ‘green’ technologies or ‘green’ infrastructure. While the term ‘green infrastructure’ has various interpretations within urban planning, the authors define it as alternative ways of supplying power and water and treating wastewater and solid waste that can help to achieve sustainability outcomes and reduce emissions. Green infrastructure is commonly based around decentralised or distributed systems, which are small-scale systems for dealing with resources at the local level, as these are increasingly being shown to be more efficient and environmentally sustainable [
1,
2,
3,
4].
In Australia, like all cities, neighbourhoods are based on precincts, and new developments within brownfield and greenfield areas are often planned at this level. Recently, the reduction of carbon emissions at the national level and, to a lesser extent, at the building scale has been the topic of much discussion. However, far less attention has been given to low-carbon development at the precinct-scale. As a result, the tools to help deliver low-carbon outcomes in individual precincts are not readily available.
This paper seeks to provide insight into the way in which precincts can be decarbonised, including discussion of the required greenhouse gas (GHG) measurements, the appropriate technologies, the necessary governance systems and the potential availability of some kind of precinct-scale carbon credits. Australian examples will be used to illustrate.
2. Carbon Claims and the Need for a Standardised Framework
New terminology has emerged in recent years to help describe the carbon reductions achieved within urban land developments around the world. These terms, which include carbon-neutral, carbon-zero (or zero-carbon), zero-emission, carbon-free, low-carbon, carbon-negative, carbon-positive, climate-positive and climate- neutral, are increasingly being used by developers who look for ways to tout themselves as being environmentally friendly. However, the myriad of terms and their varying definitions, or lack thereof, have led not only to confusion, but also to scepticism and mistrust, represented by the term greenwash or, perhaps more appropriately, carbonwash. Accompanying this lack of a consistent definition for carbon reduction is a lack of agreement both on the methodology for calculating emissions and, more importantly, on the way in which carbon reductions are ultimately to be achieved.
2.1. Definition of Carbon Reductions
Despite the widespread use of the new carbon terms within the public domain, no widely accepted international certification system has been established for recognising achievements in carbon reduction. Murray and Dey note that
carbon-neutral—one of the most commonly used terms—currently appears to be “defined by popular usage” [
3]. While the broad intention of the terms is to describe an atmospheric carbon reduction relative to the inputs and outputs of a product or service or, in this case, a city precinct, an increasing number of carbon terms—e.g., those including
zero,
negative,
positive,
free or
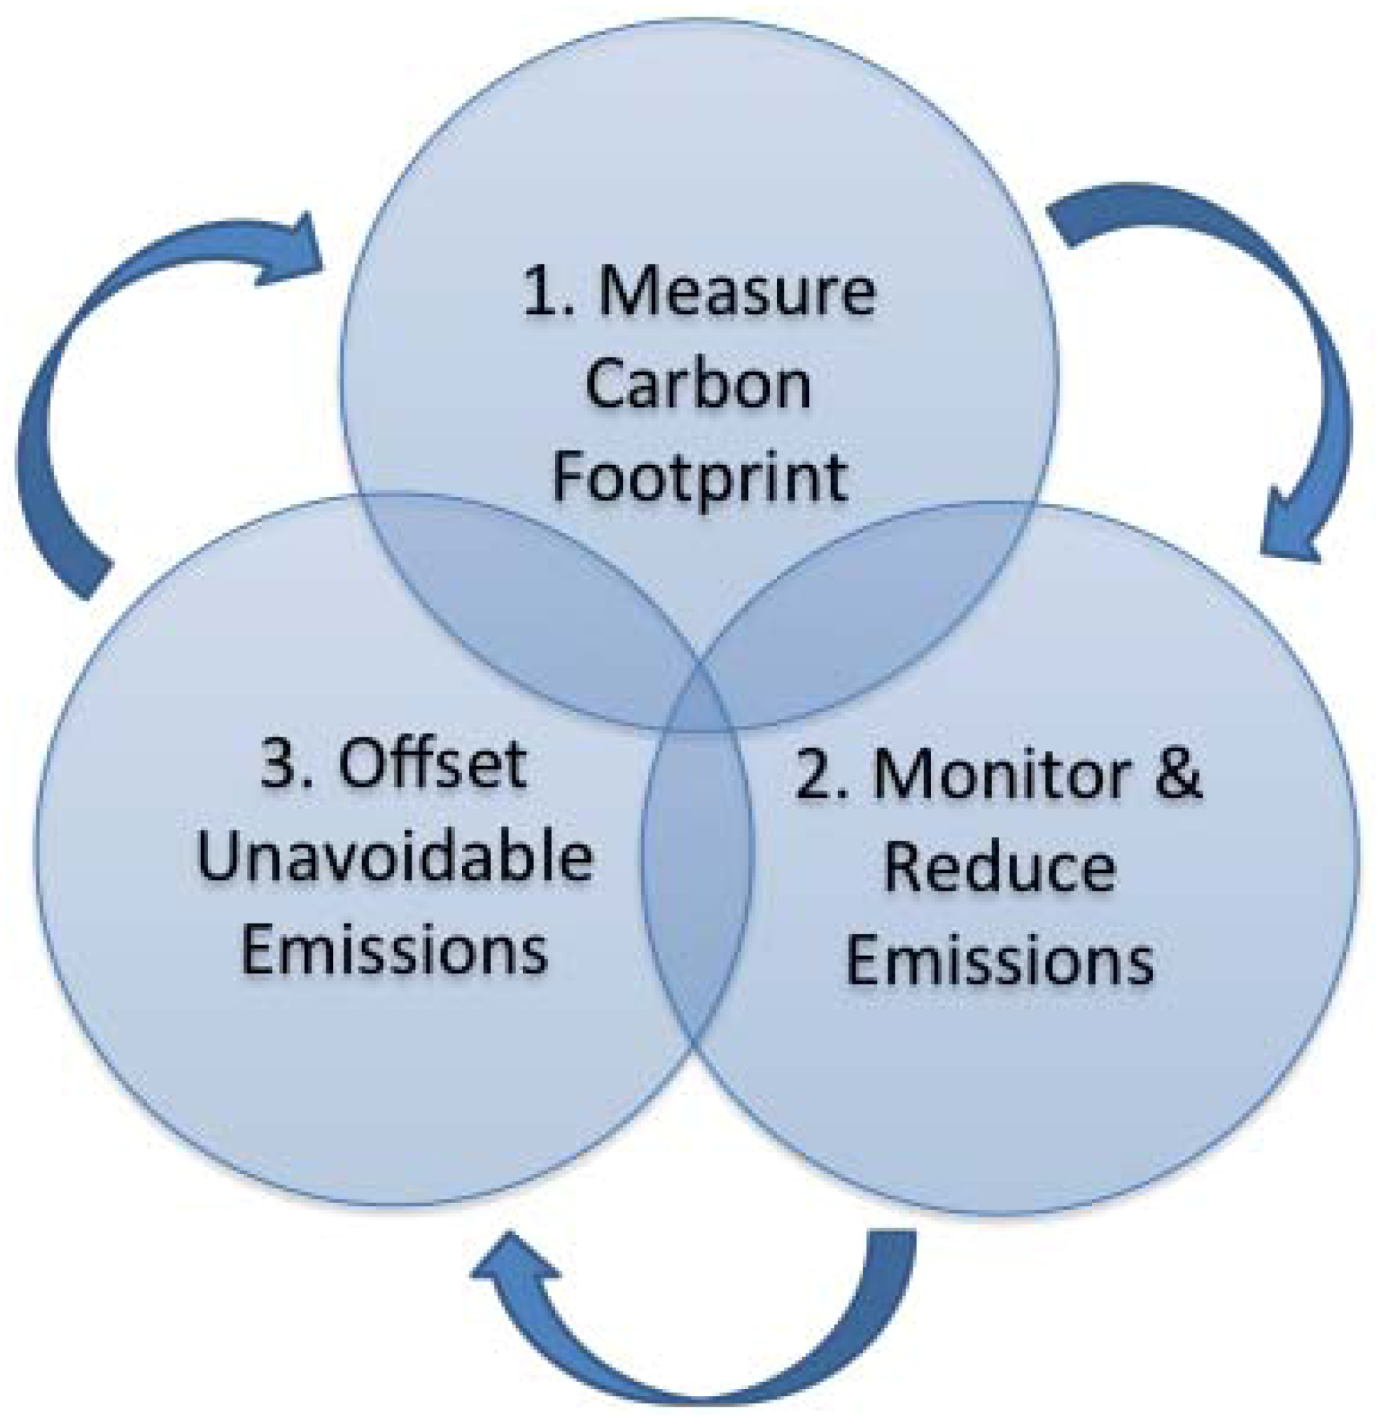
neutral—go beyond describing a mere reduction. Instead, these terms define a development that has
no net carbon associated with it. This is generally achieved via a three-step process, as illustrated in
Figure 1.
The first step involves measuring the carbon footprint of the development, for, as is commonly accepted by those working in the field, ‘you can’t manage what you don’t measure’. Identifying sources of emissions is essential to understanding where reductions can be made. With land development, this involves identifying a business-as-usual (BAU) scenario, in order to determine a baseline against, which reductions can be measured.
Figure 1.
The carbon reduction process.
Figure 1.
The carbon reduction process.
The second step involves identifying and implementing measures that aim to reduce emissions to the greatest extent possible. With the built environment, this reduction could be achieved through designing better buildings, creating a low-carbon transport infrastructure or switching to low carbon or renewable sources of energy.
The last step involves offsetting the remaining “unavoidable” emissions associated with the precinct development, including the embodied emissions in materials used for buildings and the construction of infrastructure. Several iconic precinct developments have demonstrated how offsets for those emissions can be generated using a city’s surrounding bioregion [
5].
In order to ensure that accurate carbon claims are made, the overall reduction process for urban development should be cyclical and iterative and require constant monitoring, reduction and offsetting of emissions.
Despite broad consensus around the general three-stage process, significant disagreement continues about how the task of carbon reduction should be undertaken. For example, clarity is required around: how a carbon footprint should be calculated,
i.e., which sources to include: to what extent emissions are reduced before being offset; and which offsets should be considered eligible. Without both a consistent framework for determining the emissions associated with urban development and a specific process for achieving carbon reductions, carbon claims will continue to lack a basis for comparison, to vary and, thus, to be unreliable, making them susceptible to allegations of greenwash. Internationally accepted standards, guidelines and protocols are gradually being developed to measure carbon reductions in a variety of areas, such as businesses, projects and even local governments [
6,
7,
8]. However, there remains no universal standard for assessing the emissions attributed to precinct-level urban development. Kennedy and Sgouridis [
9] also identify this issue, stating:
Given the complexity of material and social interactions on an urban scale, we find that there are no concrete definitions upon which these claims can be measured and compared. Therefore, in order to make the ambitious targets of low and zero carbon emissions meaningful concepts in the context of urban planning, a carbon accounting framework needs to be rigorously defined and adapted to the urban scale.
2.2. Development of a Framework for Assessing Low-Carbon, Sustainable, Precinct-Scale Emissions
Carbon footprints and inventories for precinct-scale emissions can vary considerably, depending on the inputs and decisions made on various issues. Therefore, to ensure not only the uniform calculation of these emissions, but also the transparency and comparability of carbon claims, criteria for the calculation should be clearly articulated. For example, clarification is needed about which types of greenhouse gases (GHG) should be included in a carbon footprint, about which unit a footprint should be measured in—
i.e., mass or land area—and about which emissions should be incorporated—
i.e., direct and/or indirect emissions [
3]. Kennedy and Sgouridis [
9] highlight the importance of identifying appropriate boundaries and scopes when determining the emissions associated with urban areas. Determining these key considerations for carbon footprint will ultimately affect the accounting methodology adopted—
i.e., inventory or lifecycle analysis [
10,
11,
12,
13].
The lifespan of buildings and infrastructure must be established in order to determine the totality of their emissions [
13,
14], which, in turn, influence the amount of offsets required to neutralise these emissions over time. The type—generated onsite or purchased—and amount of offsets used within a project also must be clearly articulated [
15]. These issues, which are outlined in
Table 1, clearly demonstrate the need for clarification.
Table 1.
Key considerations for carbon footprint and definitions.
Table 1.
Key considerations for carbon footprint and definitions.
| ISSUE | DESCRIPTION |
|---|
| GASES | Which gases are included in the analysis—e.g., only CO2 or various greenhouse gases (CO2-e)? |
| MEASUREMENT UNITS | Which unit is the carbon footprint measured in—weight, i.e., tonnes—or area, i.e., global hectares? |
| ACCOUNTING METHODOLOGY | Is an inventory approach or a lifecycle analysis (LCA) used? If LCA is chosen, which methodology—i.e., Process Analysis (PA), Environmental Input-Output (EIO) analysis or hybrid EIO-LCA? |
| BOUNDARIES | What are the overall system boundaries? Are the emissions purely operational emissions or are supply chain emissions included—e.g., the embodied emissions in materials? |
| SCOPES | Which scopes of emissions are included—i.e., direct, indirect or Scope 1, 2 or 3? |
| TIMEFRAME | If LCA is used, what lifetime is given to the embodied emissions in buildings and infrastructure? |
| EMISSION REDUCTION | Are any targets set for emission reduction? Which are the allowable emission reduction options? |
| OFFSETS | Are offsets included in the claim? If so, are they limited? Which offsets are eligible? Are they certified, credible offsets? |
Although numerous citywide and local government GHG frameworks currently exist, relatively few take into account land development, specifically, the carbon emissions associated with urban form and the built environment. This situation is largely due to the way in which boundaries are identified and the kind of accounting methodology adopted. City frameworks generally use an emissions inventory approach, which focuses primarily on operational emissions and assesses the activities occurring within the legislative or jurisdictional boundaries of the city. This approach does not measure or consider the emission abatement opportunities possible from different types of urban design or variations in building and resource management technologies. For example, significant emission reductions can occur if alternative (low-carbon) materials are used in construction, if more energy efficient building designs are adopted, if integrated public transport infrastructure is provided and if new approaches for managing resources are adopted—e.g., small-scale renewable or low-carbon energy generation or alternative water and waste management systems [
14,
15]. Therefore, a lifecycle approach is arguably more useful and appropriate in assessing the emissions associated with land development.
2.3. Development of a Framework for Low-Carbon, Sustainable, Precinct-Scale Land Development
The framework described below is proposed as a way to account for the emissions associated with precinct-scale urban development. This framework encompasses six key emission sources that a developer can affect. Traditionally, developers have ignored some of the sources that have commonly fallen outside their operational control and, therefore, their responsibility. Examples are energy production and transport infrastructure. However, new small-scale technologies and processes for supplying and managing resources—
i.e., energy, water and waste—at the precinct level are now being identified as key priorities for developers and are increasingly targeted in the design of developments [
5,
16]. In addition, many developers now recognise the value in locating urban development around public transport systems [
17]. Transit-oriented-developments or TODs not only require far less energy and, thus, produce fewer GHG emissions per person [
5,
18], but also reduce the transport costs for residents and improve their lifestyles and access to amenities [
14,
15].
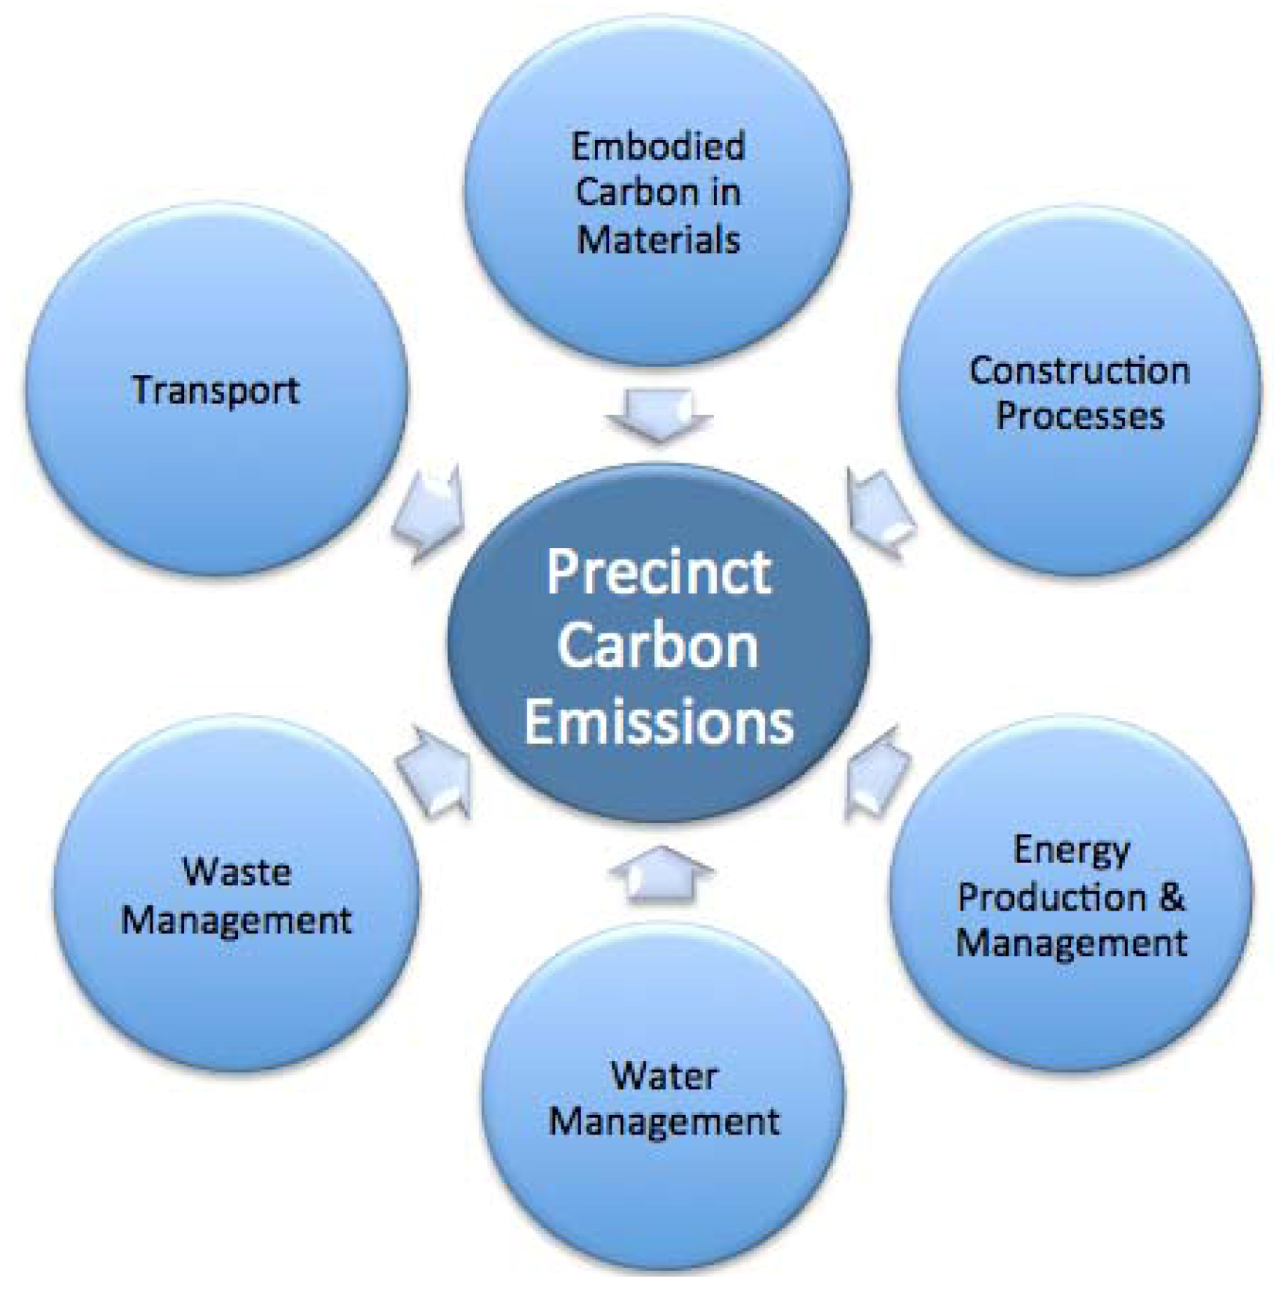
The six key emission sources, illustrated in
Figure 2, are proposed as integral factors to be included in any carbon analysis of a precinct development regardless of the final carbon claim. The sources have been chosen based on the significant amount of carbon abatement, as well as other savings, such as potable water use, that are achievable within each area if alternative practices are adopted [
19,
20,
21,
22,
23].
2.4. Proposed Framework for Low-Carbon, Sustainable, Precinct-Scale Land Development
When developers make carbon claims about their projects, their calculation of offsets must be scrutinised. Within the development industry, the surplus carbon-free renewable energy that is generated onsite and fed into the grid over one year is commonly classified as offsetting. In a process often called
netting [
24], these offsets are then applied against other sources of emissions within the development, such as embodied emissions in materials [
24]. Using this process, a development can claim to be net-zero carbon on an annual basis.
However, this concept and method of balancing emissions is generally not accepted under official carbon certification schemes, such as the Australian Federal Government’s National Carbon Offset Standard (NCOS) Carbon Neutral Program, which is based on internationally recognised protocols for offsetting [
25]. One of the key eligibility requirements for offsets under these protocols is that they meet the additionality criterion—that is, they must be considered additional forms of abatement relative to those, which would occur under a BAU scenario [
8].
Figure 2.
Key emission sources within precinct developments.
Figure 2.
Key emission sources within precinct developments.
Because energy generation is a covered sector under the Australian Federal Government’s new national carbon pricing legislation, developers are already paying the equivalent of a carbon tax on their emissions. This sector has already been fiscally encouraged to reduce carbon. Thus, any action to reduce emissions from energy production or use arguably would have occurred because of existing legislation. As a result, in Australia, energy-related offsets are not deemed additional voluntary forms of abatement [
26]. The only eligible domestic offsets under this legislation come predominantly from the Carbon Farming Initiative (CFI) and involve regional land management initiatives, such as environmental tree plantings and landfill diversion [
27].
Although guidelines exist for stipulating the types of offsets allowable under the standards, there are currently no specified limits on the number of credits that can be purchased or used to offset a precinct’s emissions. Thus, the only fully articulated guideline and certification scheme in Australia that could potentially recognise a precinct-scale development’s carbon reduction contains a rule that prevents onsite carbon reduction being recognised as an offset. Consequently, it is particularly difficult for developers to achieve a netting-based claim.
3. Assessment of the Impact of Technologies at a Precinct Scale
In recent years, the use of precinct-scale approaches has grown worldwide. In the UK, BedZED has attracted attention because of its distinctive design and its claim to be the first carbon-neutral development. It was completed in 2002 and includes a precinct-scale, biomass-powered district heating system, which ironically had to be decommissioned shortly after its installation because of operational issues resulting from the build-up of residues caused by the feedstock. Nevertheless, the potential of district energy systems was recognised. An increasing number of precinct scale systems were deployed using natural gas systems, most notably in the Borough of Woking and the City of London, where plans to create low-carbon municipalities were taking hold at the time with support from national low carbon goals [
28,
29,
30,
31,
32,
33,
34,
35]. Currently, the City of Sydney is the most significant Australian local government to announce the take-up of low carbon district energy.
As a case study of an existing precinct (or series of precincts), this section will discuss specific technologies in the context of their impacts on the City of Sydney and will then finish with a brief discussion of three smaller case studies of new precincts in Western Australia that are using similar approaches to reduce their emissions.
3.1. Sustainable Sydney 2030
Although all levels of government need to show leadership in the effort to reduce carbon emissions, instituting anything innovative at the precinct level is difficult, unless a local government is heavily involved. It is at the local government level that planning powers exist and that targets may be set for developers to meet. Combined with control over the public realm, these planning powers make possible the coordination and deployment of the green infrastructure needed to provide carbon-reducing opportunities to new developments and existing precincts alike.
In a display of leadership rare for a local government in Australia, the City of Sydney has set a bold 2030 target of reducing greenhouse gas emissions by 70% from 2006 levels, by 2030. The city is developing six master plans with the goal of directly impacting its carbon emissions. These plans encompass energy, including trigeneration, renewable energy and waste, renewable gas and automated solid waste.
The Australian company, Kinesis, had already been working with the City of Sydney, modelling its potential greenhouse gas reductions with the aim of achieving the 70% goal to which the city aspires. In doing this work, the company further developed its expertise at building carbon reduction models for commercial use. This modelling is discussed in more detail in
Section 3.2.
3.1.1. Trigeneration Master Plan
The key component in meeting the challenging target that the City of Sydney has set itself is the deployment of a decentralised energy network that can service both new and existing buildings with low-carbon electricity and zero-carbon heating and cooling. Trigeneration is the technology that makes all this happen. With Sydney, the trigeneration system is made up of reciprocating engines, the smallest of which is capable of driving a 1.2 MWe generator. The waste heat from the cooling jacket and the exhaust from the engines are captured and used to heat water, which then flows around the precinct. Any building that connects to this heated water can harness the available thermal energy through a simple heat exchanger. In order to meet the cooling demand, the heat can also be converted through an absorption chiller, providing the building with cooling. By effectively displacing the electricity normally used for heating and cooling, this technology reduces demand.
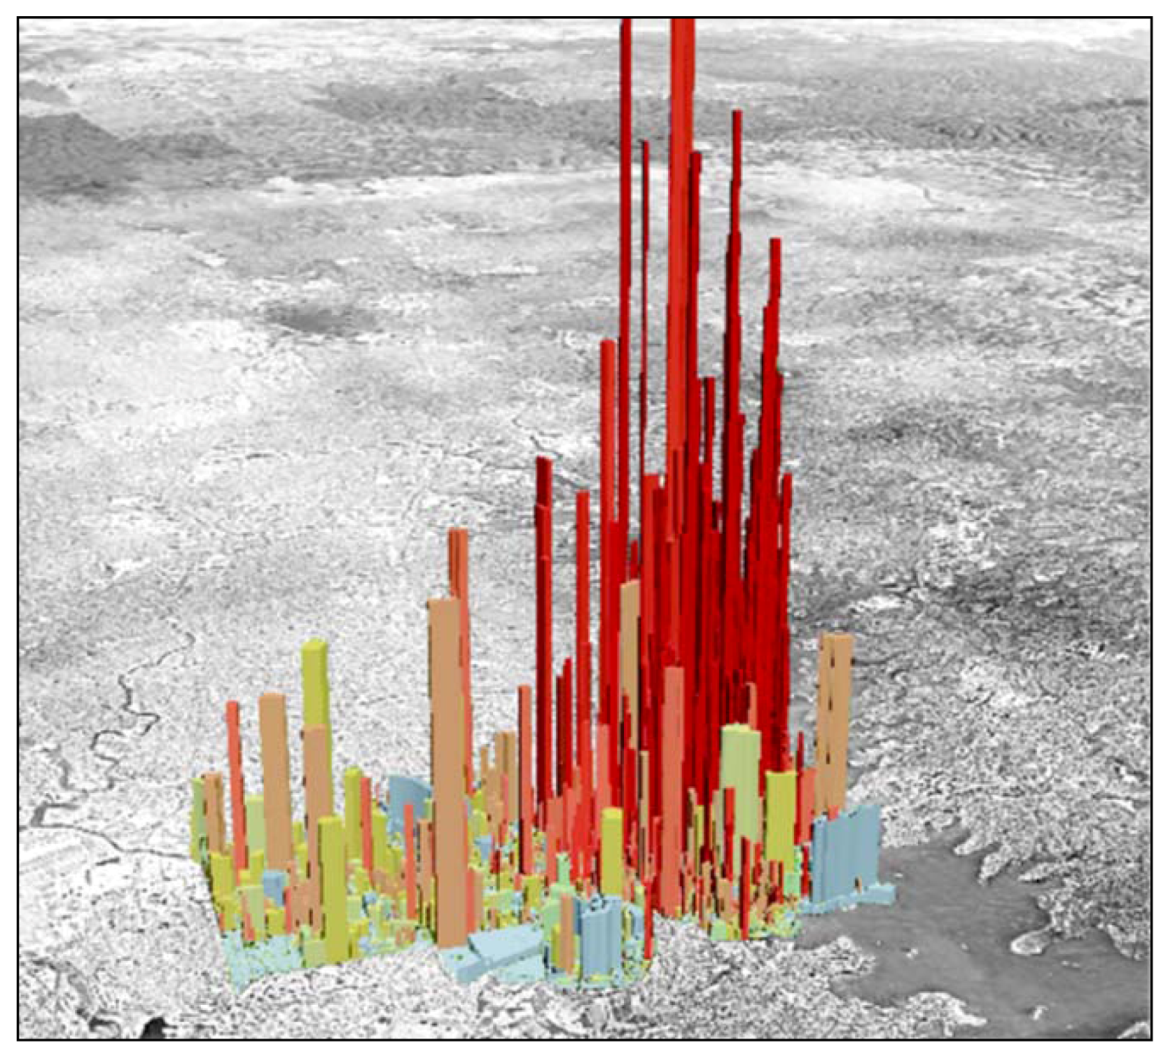
The obvious starting point for Sydney’s efforts was to establish which parts of the city were responsible for the highest intensity of greenhouse gas emissions.
Figure 3 demonstrates the amount of emissions by the height of each stack on a city block, while the colour indicates the intensity of emissions per square metre of lot area: the darker the colour, the higher the intensity. By 2030, a total of 15 plants will have been constructed across four low-carbon infrastructure zones. These plants were originally conceived to have a total capacity of 360 MWe of low-carbon electricity; that capacity has now been expanded to a possible 447 MWe with the inclusion of additional stand-alone projects that have been identified as carbon hot spots around the city. The 360 MWe of trigeneration capacity amounts to 40% of the city’s overall target of reducing greenhouse gas emissions for the entire local government area (LGA) by 70%.
Figure 3.
Mapping the greenhouse gas (GHG) emissions profile of the City of Sydney.
Figure 3.
Mapping the greenhouse gas (GHG) emissions profile of the City of Sydney.
This scheme in itself is hardly innovative in a global context. Decentralised energy networks, including trigeneration, are relatively commonplace around the world, in particular. in Northern Europe. The innovative thinking that is happening in Sydney relates to the deployment of a system in the face of fierce criticism, emanating not just from developers, but also from advocates of alternative solutions to reduce CO2 in the power sector. The most notable source of this criticism is Beyond Zero Emissions (BZE), a not-for-profit organisation with a stationary energy plan that advocates a move to large-scale renewable electricity and that argues against any technology that does not fit this mould [
36,
37]. This approach would not suit a low carbon precinct. There are also issues with the suitability of particular precincts for doing low carbon decentralised energy. The appetite that a developer has to buy-in to such a system will vary. If a developer owns a building with a heating, cooling and air conditioning (HVAC) system that is near the end of its life then the opportunity to connect to a low carbon energy source may be an attractive one. However, if a building contains a newly commissioned HVAC system with an operational life of 15–20 years, the developer who has just invested significantly in the system will hardly want to replace it in order to connect to the City’s Low Carbon system. What is recognised by the City (if not Sydney’s developers) is that the system will take some time before it is fully utilised.
3.1.2. Renewable Energy and Waste
In order to contribute towards achieving the ambitious 70% target by 2030 for the entire LGA, the City of Sydney will meet 30% of its own energy needs with renewables or low-carbon energy. Trigeneration will provide the remaining 70%. In fact, precinct-scale trigeneration underpins a number of the city’s strategies. Renewable electricity, which will make up approximately half of the targeted reduction, will be sourced fairly evenly between urban and rural areas. Renewables in the form of solar photovoltaics (PV) also will play an important role, and the city has shown leadership in this area by installing a 48 kW system on the roof of the town hall. This is one of many new solar PV projects that will eventually make up a total of 1.25 MW contributing to the 30% renewable energy goal that the city has set itself. When it is released for public consultation in 2013, the Renewable Energy Master plan will also include an analysis of potential energy sources, including the wind (onshore and offshore), the ocean, geothermal and concentrating solar thermal (CST).
3.1.3. Renewable Gas
The key and possibly the most innovative part of the renewable energy plan will focus on renewable gas. Although decentralised energy networks may be conventional in many parts of Europe, the idea of producing thermal energy with a renewable fuel is a relatively new concept.
Many potential sources of feedstock exist, including municipal waste, commercial and industrial waste, sewage and landfill gas. If opportunities beyond the city boundary are explored, additional sources should become available. For now, the City of Sydney is looking at what potential—e.g., agricultural and forestry residues and livestock manure—lies within a 125 km radius. In doing so, officials cite the proximity principle [
38], which is intended to reinforce links with the nearby rural community and to minimise any inefficiencies that may occur in the delivery of low-carbon energy across long distances.
As an important carrier of energy, gas has significant advantages over electricity. Its flexibility allows it to be converted to liquefied natural gas (LNG) and transported to where it is needed. This action was taken in the UK at Newlands Corner, Surrey, where the feedstock was not located near any grid (gas or electricity) [
39]. In this instance, after being converted to LNG, the gas is transported into the City to provide a source of fuel for delivery trucks and public transport vehicles. This contributes to reducing motor vehicle emissions, which is the second largest source of emissions behind those produced from the generation of electricity.
A number of alternative strategies for deploying renewable gas could be considered. Finland, Denmark and Germany are developing long-term strategies for injecting renewable gas into the grid. This strategy is particularly important in Europe, where gas generally has a greater penetration into the energy supply chain than it does in Australia. In Sydney, natural gas is seen as a transitional fuel for the city’s trigeneration network, and renewable gas provides the link to drive emissions down, in line with the city’s long-term goals. Thus, as each new precinct is developed within the trigeneration network, renewable gas will help to contribute to the ultimate goal of greening the gas grid [
40].
3.1.4. Automated Solid Waste
Sydney also has an automated solid waste plan, unique in the country, which is as symbolic as it is practical, for Australia will be the last continent on the planet to have such a system. Municipal automated solid waste collection involves sucking waste through an underground network of pipes to one or several collection points within a city. This can dramatically reduce the transport emissions associated with waste collection, improve the efficiency of recycling and add amenity by reducing the number of garbage trucks on the road. The technology is described by Allan Jones, Chief Development Officer for Energy and Climate Change at the City of Sydney, as “moving waste collection into the 21
st century” [
41]. For many centuries in ancient cities, like Rome and Istanbul, sewage has been collected through a series of underground pipes (arguably, the
first green infrastructure). It’s not difficult to see that the collection of solid waste in a similar manner is simply the next step in the evolution of designing clean, modern cities. In the future, solid waste will become a valuable energy commodity. As soon as waste is viewed from this perspective, the way in which it is managed will undoubtedly change for the benefit of all, as 95% of emissions from garbage trucks will be saved [
41].
The City of Sydney is showcasing one way to decarbonise a city—precinct by precinct. However, even though considerable potential is being demonstrated by cost-effective, precinct-scale technology, change will not automatically happen.
3.2. Modelling and Assessing Precincts
Planning assessment and design tools with the functionality to provide the metrics required for measuring carbon emissions at a precinct scale are scarce. Those that currently exist tend to be combinations of rating tools and checklists, only able to provide one or two of the metrics that would contribute to the overall emissions for which a development would be responsible. Researchers, Beattie
et al. [
42], assessed a range of tools and highlighted C
CAP Precinct, a tool that was developed in Australia by Kinesis, a consultancy that was born out of the NSW Planning Department and that has the ability to measure carbon emissions across a range of areas within urban developments. The measured emissions include those from energy and water usage, land use, transport and embodied emissions in materials [
42]. Other tools are on the horizon, such as Melbourne University’s ‘MUtopia’ and the Green Building Council’s ‘Communities’ tool, which may provide viable alternative options in the near future. Eventually, all these tools will be made public and will be fully transparent, but until then, the use of numbers depends on getting access to one or other of the tools. The importance of having data to compare is more significant than the lack of full transparency in the model used, especially when it fits the generally accepted quantitative expectations due to urban form changes [
14,
18].
In recent years, a series of scenario planning assessments has been done in Australian precincts using Kinesis’ C
CAP Precinct modelling tool [
43,
44]. This tool was developed to service a niche market identified by Landcom, the New South Wales land development agency, following the modelling exercises that Kinesis completed for the City of Sydney. It has now been adopted across all Australian State land development agencies to assess a number of sustainability key performance indicators (KPI). The tool compares a development proposal with a business-as-usual model and provides a range of metrics demonstrating the impact that specific technology and policies will have on each KPI. The metric chosen for the current analysis is tonnes of greenhouse gas emissions using the Federal Government’s greenhouse accounts factors to calculate the results. Energy and water consumption is calculated using building and precinct designs held within the tool and the actual energy and consumption data from local utilities, which are linked to Bureau of Meteorology data and, which have been measured at half hourly intervals over a year. Transport outcomes are calculated using a regression model designed to estimate the reduction in vehicle kilometres travelled (VKT) from private motor vehicle use based on a number of variables focusing on land use mix, public transport availability and parking control measures within the precinct.
The results of some of these planning assessments are summarised in
Table 2. The size and density of the precinct, the main technologies and practices adopted for the scenarios and the results in terms of reduced carbon and reduced car use are presented with greenhouse gas reduction as the key performance indicator. The exception is the City of Stirling transport figure, which, at the request of the client, is shown as an improvement in VKT.
3.3. The City of Sydney and New Development Examples
Although the City of Sydney example aggregates reductions across the entire LGA, the majority are in precincts where trigeneration systems are sited and where the City has been able to deploy large-scale renewable systems in their own property portfolio.
Trigeneration shows consistent reductions of around 20% for the City of Sydney precincts and the Stirling City Centre; however, there clearly is not enough data to draw any conclusions. Sydney’s introduction of renewable fuels contributes dramatically (an additional 20%) to its overall energy/GHG reductions and is possibly the key to it achieving such impressive results.
Improved building energy efficiency has a relatively low impact (6%) on overall GHG reductions. This result is arguably due to the fact that retrofitting energy efficiency into the building fabric is, with the exception of surface interventions, such as replacing inefficient light fittings, quite difficult. In contrast, the examples of Stirling City Centre and North Port Quay demonstrate an average of 18% reduction in GHG emissions from improved energy efficiency. Both these developments are new build and, thus, are required to conform to the Building Codes of Australia, which mandates much improved thermal performance of the building fabric over older buildings, primarily through thermal insulation, efficient lighting and thermal performance in general.
North Port Quay is an unusual project in that the developers’ brief was to create a carbon-neutral project focusing on renewables. (trigeneration, which is only low-carbon, was excluded from the plan.) The developer decided to use solar photovoltaics (PV), with the intent to cover 75% of the available roof area with panels. Given that solar is an intermittent generator with a very specific operating time frame (peaking between 12:00 pm and 2:00 pm), matching specific loads as they occur outside that timeframe is difficult. With electricity being difficult to store, the alternative is to export it to the local grid. These two facts combine to result in the 111% figure shown for energy/GHG reductions. Over the course of the year, the 11% excess energy was exported to the local grid when production outstripped on-site demand.
Table 2.
Modelled emissions reductions in selected existing and proposed developments in precincts in Australia.
Table 2.
Modelled emissions reductions in selected existing and proposed developments in precincts in Australia.
| | Area (ha) | Density (hh/ha) | Comm Area | Energy/GHG Reductions | Transport | Cap. Cost | Comment |
|---|
| Technologies &Practices Adopted | | | | Low-carbon
(Trigeneration) | Renewables | Building Energy
Efficiency | Renewable Fuel | SUB-TOTAL | Reduced Private
Vehicle Use | | |
| City of Sydney | 2600 | 36 (avg.) | 32 million
sq.m. (including residential) | 20% | 19% | 6% | 20% | 65% | n/a | n/a | The City of Sydney is based on a number of existing precincts—the results shown are combined. |
| Cockburn Coast, WA | 332 | 60 | 148,149
sq.m. | 55% | 0% | 55% | 35% (GHGe) | $5,600/
Dwelling or $44/m2 of fl. area | Based on the District Structure Plan developed by Landcorp |
| Stirling City Centre, WA | 215 | 40 | 886,723
sq.m. | 21% | 5% | 17% | 0% | 43% | 34% (VKT) | $76/m2 of fl. area | Based on the Structure Plan developed by the Stirling Alliance |
| North Port Quay, WA | 245 | 42 | 257,460Sq.m. | 0 | 111% | 19% | 47% | 177% | 13% (GHGe) | $200/m2 of fl. area | Hypothetical model pushing boundaries of Renewable Energy to achieve a zero carbon outcome |
Transport is also modelled in the new development scenarios with planning controls on density and mix, as well as reduced availability of residential parking to discourage car use and encourage the uptake of public transport. A high frequency light or heavy rail was included in all the examples. As an existing site, the City of Sydney cannot be modelled in the same way. All the examples show significant reduction in GHG or VKT similar to that achievable for trigeneration.
Costs are also covered in the modelling, although not on a comparative basis. The Cockburn Coast costing came out at just $5,600 per dwelling extra in capital costs or around 1% of a typical mortgage. The City of Stirling came out higher, primarily because of significantly higher deployment of solar thermal, which is used not only for domestic hot water, but also to boost the thermal energy produced by the trigeneration system. North Port Quay costs are significantly higher again, due to its large amount of solar PV (69 MW compared with 2 MW for the Stirling City Centre). The model provides a high level view of the costs, presenting a dollar value per square metre of development. Therefore, the data need further exploration to identify the business cases and governance models that can be used to make the deployment of the technologies feasible. For example, energy generators/retailers will be keen to identify opportunities from the perspective of their core businesses. The costs of building trigeneration will likely fall with them, not on the developer. However, some community energy models might possibly be structured differently (see
Section 4).
As can be seen from this data, very significant and potentially low cost reductions in carbon are feasible when the precinct scale of action is the focus for decarbonising the economy. However, these kinds of reductions can occur only if the governance approach is flexible and innovative in response to the needs of the low carbon technologies currently tried, tested and available.
4. Governance for Low-Carbon, Sustainable Precincts
If precincts are the appropriate scale to achieve major reductions in carbon, it is essential that a parallel set of innovations enable them to become the appropriate scale for governance. To accomplish this goal and instigate rapid and decisive action, a shift must occur in the way in which decisions are made about the mitigation of climate change. The current reliance on centralised, top-down, governmental decision-making must give way to broader community participation and decentralised, precinct-oriented governance. The first signs that this adjustment is occurring are just beginning to be recorded. Councils are being given greater autonomy to respond to needs in their jurisdictions and flexibility to cooperate with organisations, enterprises and communities to build capacity for low-carbon development in their precincts [
45,
46]. However, the process of change is very slow and many barriers in governance must yet be overcome.
Because they are much closer to changes at a precinct level than are the traditional utilities that operate at a much larger scale, local authorities are typically responsible for many urban planning decisions that directly affect a city’s carbon footprint. Therefore, greater attention should be given to facilitating the way in which councils implement and manage their infrastructure networks and mechanisms for service delivery. Developing better local governance that supports cheaper, more efficient, integrated low-carbon energy, water, waste and transport services will help cities reduce their overall impact on carbon emissions and become more resilient to climate change. Four key principles for assisting this process are outlined below.
4.1. Strengthening Decentralised, Inter-Municipal Collaboration
As the concept of precinct-scale governance of infrastructure spreads, collaboration among neighbouring municipalities will become more important, especially if a precinct crosses boundaries. There are likely to be important advantages for providing a diversity of load for green technology options to the whole municipality. For instance, because it can benefit a mix of residential, commercial and retail end-users, trigeneration is likely to perform much better if able to serve a more diversified load of multiple sites across municipal boundaries. The trigeneration project’s financial returns in the form of savings on network charges and electricity bills can in turn be re-injected into more low-carbon, precinct-level urban infrastructure development [
47].
Infrastructure networks, which often provide shared resources across municipalities, are interconnected and mutually interdependent in nature; therefore, restructuring less carbon-intensive infrastructure systems lends itself to fostering greater municipal cooperation and collaboration among precincts. As opposed to isolated, hierarchical and generalised systems, stronger local-level, inter-municipal ties and linkages at finer scales will help build local capacity to detect, quickly respond to and deal with cross-boundary urban challenges [
48].
This multi-layered and cooperative governance style mirrors the emerging networked and localised distributed-systems approach to water, waste and energy services. This style, which fosters mutual learning, cooperative management and innovation, involves specialised niches of employees working with a diverse network of organisations to solve complex local issues that require a high degree of information and resource exchange [
49].
4.2. Public-Private Infrastructure Partnerships
Pooling financial resources from multiple municipalities will also help to build capital and attract private sector funds for investment in precinct-scale green infrastructure projects. Many organisations—for example, pension funds and insurance companies—are seeking to demonstrate a low-carbon profile either through their shareholders or their boards of directors through their investments and operations [
47]. These actions are being taken based on good marketing decisions, genuine concern for the environment and a desire to support innovation in the emerging green economy. Thus a strong incentive already exists for private sector engagement with the public sector and both local government and precinct governance can benefit from this interest.
4.3. Building New Roles for Low-Carbon, Sustainable Precinct Communities and Creating Synergies with Other Sectors
Growing concerns in Australia about energy and water security, waste management, rising carbon emissions and increasing utility bills have prompted communities to become more actively engaged in the management of their local resources. This trend is leading to the emergence of new roles and responsibilities for local businesses, councils and communities. This is likely to grow in the Age of Scarcity [
14].
Traditional consumers within precincts are becoming producers and providers of local power, water and waste services [
49]. Western Australia’s Independent Power Producers Association, for example, helps local enterprises become utility providers. Moreover, communities are increasingly seeking more flexibility to choose where they buy their electricity and water—for example, from brown coal plants or trigeneration systems. These trends hold great potential for both land developers wishing to establish independent, integrated utility services and property owners interested in buying into low-carbon precincts that use recycled water or renewable power. In addition, precinct-scale markets encourage local governments and their communities to jointly implement innovative infrastructure strategies that give them the financial backing to buy their own resource assets, whether water systems [
48] or wind farms.
Potential also exists for these small precinct producers to trade across local networks or, along with other municipalities, they could build synergies with agriculture [
49], industry, farming or fisheries. For instance, precinct wastewater could be used to service nearby industries or surplus precinct renewable energy could power fishing or leisure vessels at nearby marine harbours. Similarly, resources used by certain sectors situated on the periphery of precincts could be re-used to meet the needs of those nearby communities. Thus, as described above, agriculture or farming waste could be used as renewable gas to power precinct trigeneration schemes, but only if the governance is in place.
Communities must give greater consideration to their assets in terms of the inflow and exchange of resources with their precinct and the surrounding area. They should also consider processing those resources within the local biosphere. Finding these synergies and trade-offs at a fine-grain level will increase the resilience and continuous supply of resources and fundamentally drive the economic viability and overall sustainability of low-carbon precincts.
4.4. Removing Barriers for Low-Carbon, Sustainable Precincts
If Australian cities, or any other cities, are to emerge as a part of the new, green economy, it is imperative that their communities move beyond simply discussing ambitious carbon-mitigating strategies to actually implementing more resilient, low-carbon infrastructure networks and low-carbon precincts. However, most urban planning and regulatory systems are constructed around centralised infrastructure. They, therefore, have many barriers that constrain innovative action and progress towards decarbonising precincts. Existing regulations are often costly and inefficient and favour centralised business-as-usual power, water and waste services. These regulations must be updated to accommodate low-carbon, distributed options for production, distribution and consumption of resources [
50]. In addition, precinct electricity and water licence costs must be adjusted to more fairly reflect the value of decentralised systems, and complicated, arduous processes that differ on a case-by-case basis—e.g., for grid connection—must be standardised and streamlined [
30]. These actions will build confidence in the market and stimulate more investment from the private sector. Peter Verwer [
51], the CEO of the Property Council of Australia, claims that innovative property owners are “frustrated by approval processes and regulatory regimes that block them at every turn”.
More guidance is required for municipalities and private enterprises in choosing business or funding models that are appropriate for implementing and managing low-carbon solutions to local challenges. This guidance must include more clearly defined pathways for obtaining approvals and complying with regulations. At present, because not enough research has been done on established low-carbon precincts in Australia, much uncertainty exists both about the risks and benefits inherent in their creation [
51] and about who should get involved in decision-making and what participants’ roles should be [
52]. This lack of research affects the overall viability and widespread adoption of low- or zero-carbon technology options [
52]. Furthermore, market uncertainties drag out the decision-making and implementation processes, thus creating additional costs and disincentives [
51].
If Australia is to succeed in the transition towards a low-carbon economy and society, it will need to overcome these barriers and move from the use of centralised water, waste and fossil fuel electricity systems to the creation of complementary green grids that are integrated with low-carbon water and waste solutions [
50]. These two structures should gradually evolve into localised, interdependent eco-resource networks for low-carbon, sustainable precincts—the eco-precincts of the future.
4.5. Some Emerging Governance Models
Increasing interest from municipalities in developing low-carbon precincts that provide low- or-zero carbon power, water and waste services to residents has meant new business models and financing mechanisms are emerging to support the operation and management of these decentralised networks for precincts. Two examples from Australia are provided below.
4.5.1. The City of Sydney: Low-Carbon, Sustainable Precincts
In 2008, the City of Sydney released its Sustainable Sydney 2030 plan to dramatically reduce its carbon emissions. In 2012, the city became Australia’s first officially certified carbon-neutral local government. Released in 2010, the Trigeneration Master plan is a central part of Sydney’s decarbonisation strategy. The plan’s business model involved procuring Cogent Energy, a private distributed energy company, to design, finance, build, operate and maintain the city’s trigeneration network. Having this network will enable the city to remove 230 buildings and 21,000 street lighting columns from the grid and to create a series of low-carbon, sustainable precincts [
47]. The council acts as an anchor customer for the trigeneration system and owns the thermal reticulation network (TRN) that connects the energy centres and distributes thermal energy across the city. Cogent Energy is responsible for retailing the electricity and thermal energy and for operating and maintaining the TRN [
33].
Employing a fund-reimbursement financial mechanism, the council forwards funds for the construction of the thermal network and gets increasing returns on its investment as each customer connects to the network. Once the network load reaches 20 megawatts, the council is reimbursed and begins to benefit from returns on investment [
47]. By dispersing funds in a targeted way to ensure that a larger, more economically viable system is connected [
47], this mechanism has allowed the city to overcome regulatory and economic hurdles that exist in the private sector.
Under the energy sales agreement for supplying trigeneration, generating at a few sites will supply low-carbon electricity to all the council’s buildings and streetlights. Using Cogent Energy’s specialised software technology and expertise, the council can apply the trigeneration system mechanism—
i.e., market-compliant metering, data collection and aggregation, settlements and billing—to export solar electricity. Because the council owns the solar PV, the generated solar electricity comes out of the council’s collective bill before the Cogent-owned supply of trigeneration electricity is tapped. By piggy-backing onto the same trading system, Cogent has set up for trigeneration, the council has reduced the cost of carbon abatement from $65 per tonne to $30 per tonne, a reduction that significantly improves the economics of renewable energy [
53].
5. Certifying Carbon Reductions in Land Development
In the future, precinct-scale land development will play an important role in helping to decarbonise cities and nations. The choices made by developers at this scale can affect various sectors of the economy, including transportation, resource management, construction, industry and manufacturing. Yet, despite the potential for considerable carbon reductions, few incentives exist to encourage developers to make low-carbon choices. This situation contrasts with what is occurring in the energy markets, where certificates and carbon credits are available to help drive the transition to low-carbon fuels and technologies at the front-end of the economy.
The primary incentives available on the end-user side of the economy originate in the voluntary carbon market. In Australia, the voluntary market has benefitted from the introduction of the Australian Federal Government’s Nation Carbon Offset Standard (NCOS) Carbon Neutral Program. This program certifies petitioning organisations, products and events that achieve net-zero emissions. By increasing the credibility and integrity of carbon claims, it has created additional marketing opportunities for certified entities to demonstrate their commitment to the environment. It has also proven to developers and the general public that reducing their carbon footprint can produce significant financial savings, particularly from energy efficiency improvements. As a result, countless businesses organisations, local governments and even schools have embraced the opportunity to be recognised for their carbon reduction achievements [
56,
57].
However, despite the rigorous and stringent guidelines currently underpinning the new NCOS program, no specific methodology is mandated for calculating the emissions associated with precinct land development and no specific criteria are established for certification of developments. Furthermore, as discussed above, the issues surrounding the eligibility of offsets remain a key challenge for developers. The NCOS guidelines make it difficult and expensive for developers to achieve certification using conventional offsetting methods—i.e., purchasing certified offsets. There appears no other model available globally to achieve this kind of precinct certification that can be used for carbon credits. Research to pursue new options in this space is required.
6. Conclusions
The need for low-carbon, sustainable cities is now recognised. One of the main ways in which to achieve this goal is to focus on change at the precinct level, where the high potential for delivering low-carbon outcomes within the built environment has been demonstrated. Several Australian case studies show that mass reductions employing available technologies are feasible at low cost. While several barriers still exist, particularly around issues of governance, the first examples are beginning to demonstrate how these obstacles can be overcome. The City of Sydney is an established leader in doing so.
A new and unique framework, comprising six key areas, has been proposed for calculating the emissions associated with land development at the precinct scale. To accelerate the transition to a low-carbon economy, further research is now required to investigate how this framework could be used to develop a program that acknowledges and rewards innovative systems that reduce emissions within the built environment. This could involve developing a new method for producing carbon offsets from emission abatement measures delivered onsite. With this program as its basis, the possibility for developing a carbon trading market specifically for urban development should be pursued.


