1. Introduction: Beyond the Sick Building Syndrome
In recent years, several high-tech developing countries have become sensitive and proactive towards green solutions for the tropical built environment. The “Rainforest Alliance” based in New York is a globally operating body for the tropics. Colombia and Singapore belong to those countries having established green building councils. Over the past decade, several national Green Building certification indices have emerged . The American LEEDS, the German DNGB or the British BREAM are all considered as measurement tools for environmental-friendly housing in the tropical hemisphere. Since 2009, such tools for countries in the Northern “colder” hemisphere have been adapted towards tropical countries (e.g., the Singaporean Green Mark Index). Since Malaysia established its Green Building Index and committed to saving 40% of CO
2 emission by 2020 (it has been spearheaded as a country embarking on viable environmental survival strategies, along with Germany [
1]. Countries like these find themselves at a pivotal point to turn green ideas into practice (
cf. [
2]). Due to their much higher electricity costs, the so-called developed countries in the colder hemisphere are far more restricted in their energy consumption. Since 1990, some of them have already devised and monitor a wide variety of energy regulations and accordingly have developed renewable technologies that might be adaptable to green buildings [
3].
This contribution focuses on the adaptation and implementation of the Energy Performance Certificate (EPC)—which two decades ago was established by nations in the European Union—for a tropical country in South-East Asia [
4]. Occupants are no longer simply victims of the offending “sick building syndrome” [
5]. Supporting their need for transparency and simplicity in understanding their building in terms of its vulnerability against the climate, the tool is implemented with an easy to understand scientific tool kit to measure CO
2—including emissions, insulation, thermal comfort and cost considerations. With the assistance of a green building consultant, it sketches a staggered procedure of how to save CO
2 as the first priority. Hence, the proposed and tested toolkit starts with the question of “how green the building is” along the rainbow scale.
We can consider a property developer or a landlord ambitious to sell his or her green and energy efficient tropical building. The person has invested in green measures and enjoys both higher thermal comfort and reduced monthly electricity bills. He or she can claim to be a greener person, contributing in some ways to save the environment. Will the achievement be rewarded when the person attempts to sell the building for more revenue as compared to a landlord who did not go green? At first, let us study to the following simulated conversation between a potential house buyer and the present landlord about a Tropically-Adapted Energy Performance Certificate (TEPC) for residential housing.
Potential Buyer: “Before we negotiate about the price of the terrace house you intend to sell, can I see your TEPC?”
Owner: “My Building was assessed 3 years ago, and you can see it is green in terms of all four criteria. So, the price is about 10% higher than the neighbouring unit, but you will feel comfortable. As you will save 70% of the energy needed to cool it down, your predicted payback timeframe is about 3.5 years.”
2. Energy Assessment Tool for Residential Housing
Application of an Energy Demand Certificate (EDC) for new residential buildings and an Energy Performance Certificate (EPC) for existing residential buildings is the current practice within the European Union, with so far at least five countries requiring their implementation for any building. Furthermore, a growing number of countries outside Europe have also adapted these tools. Effective since 2009, e.g., in Italy or Portugal every seller of real estate has to enclose the energy performance certificate as an appendix to the sales agreement (e.g., [
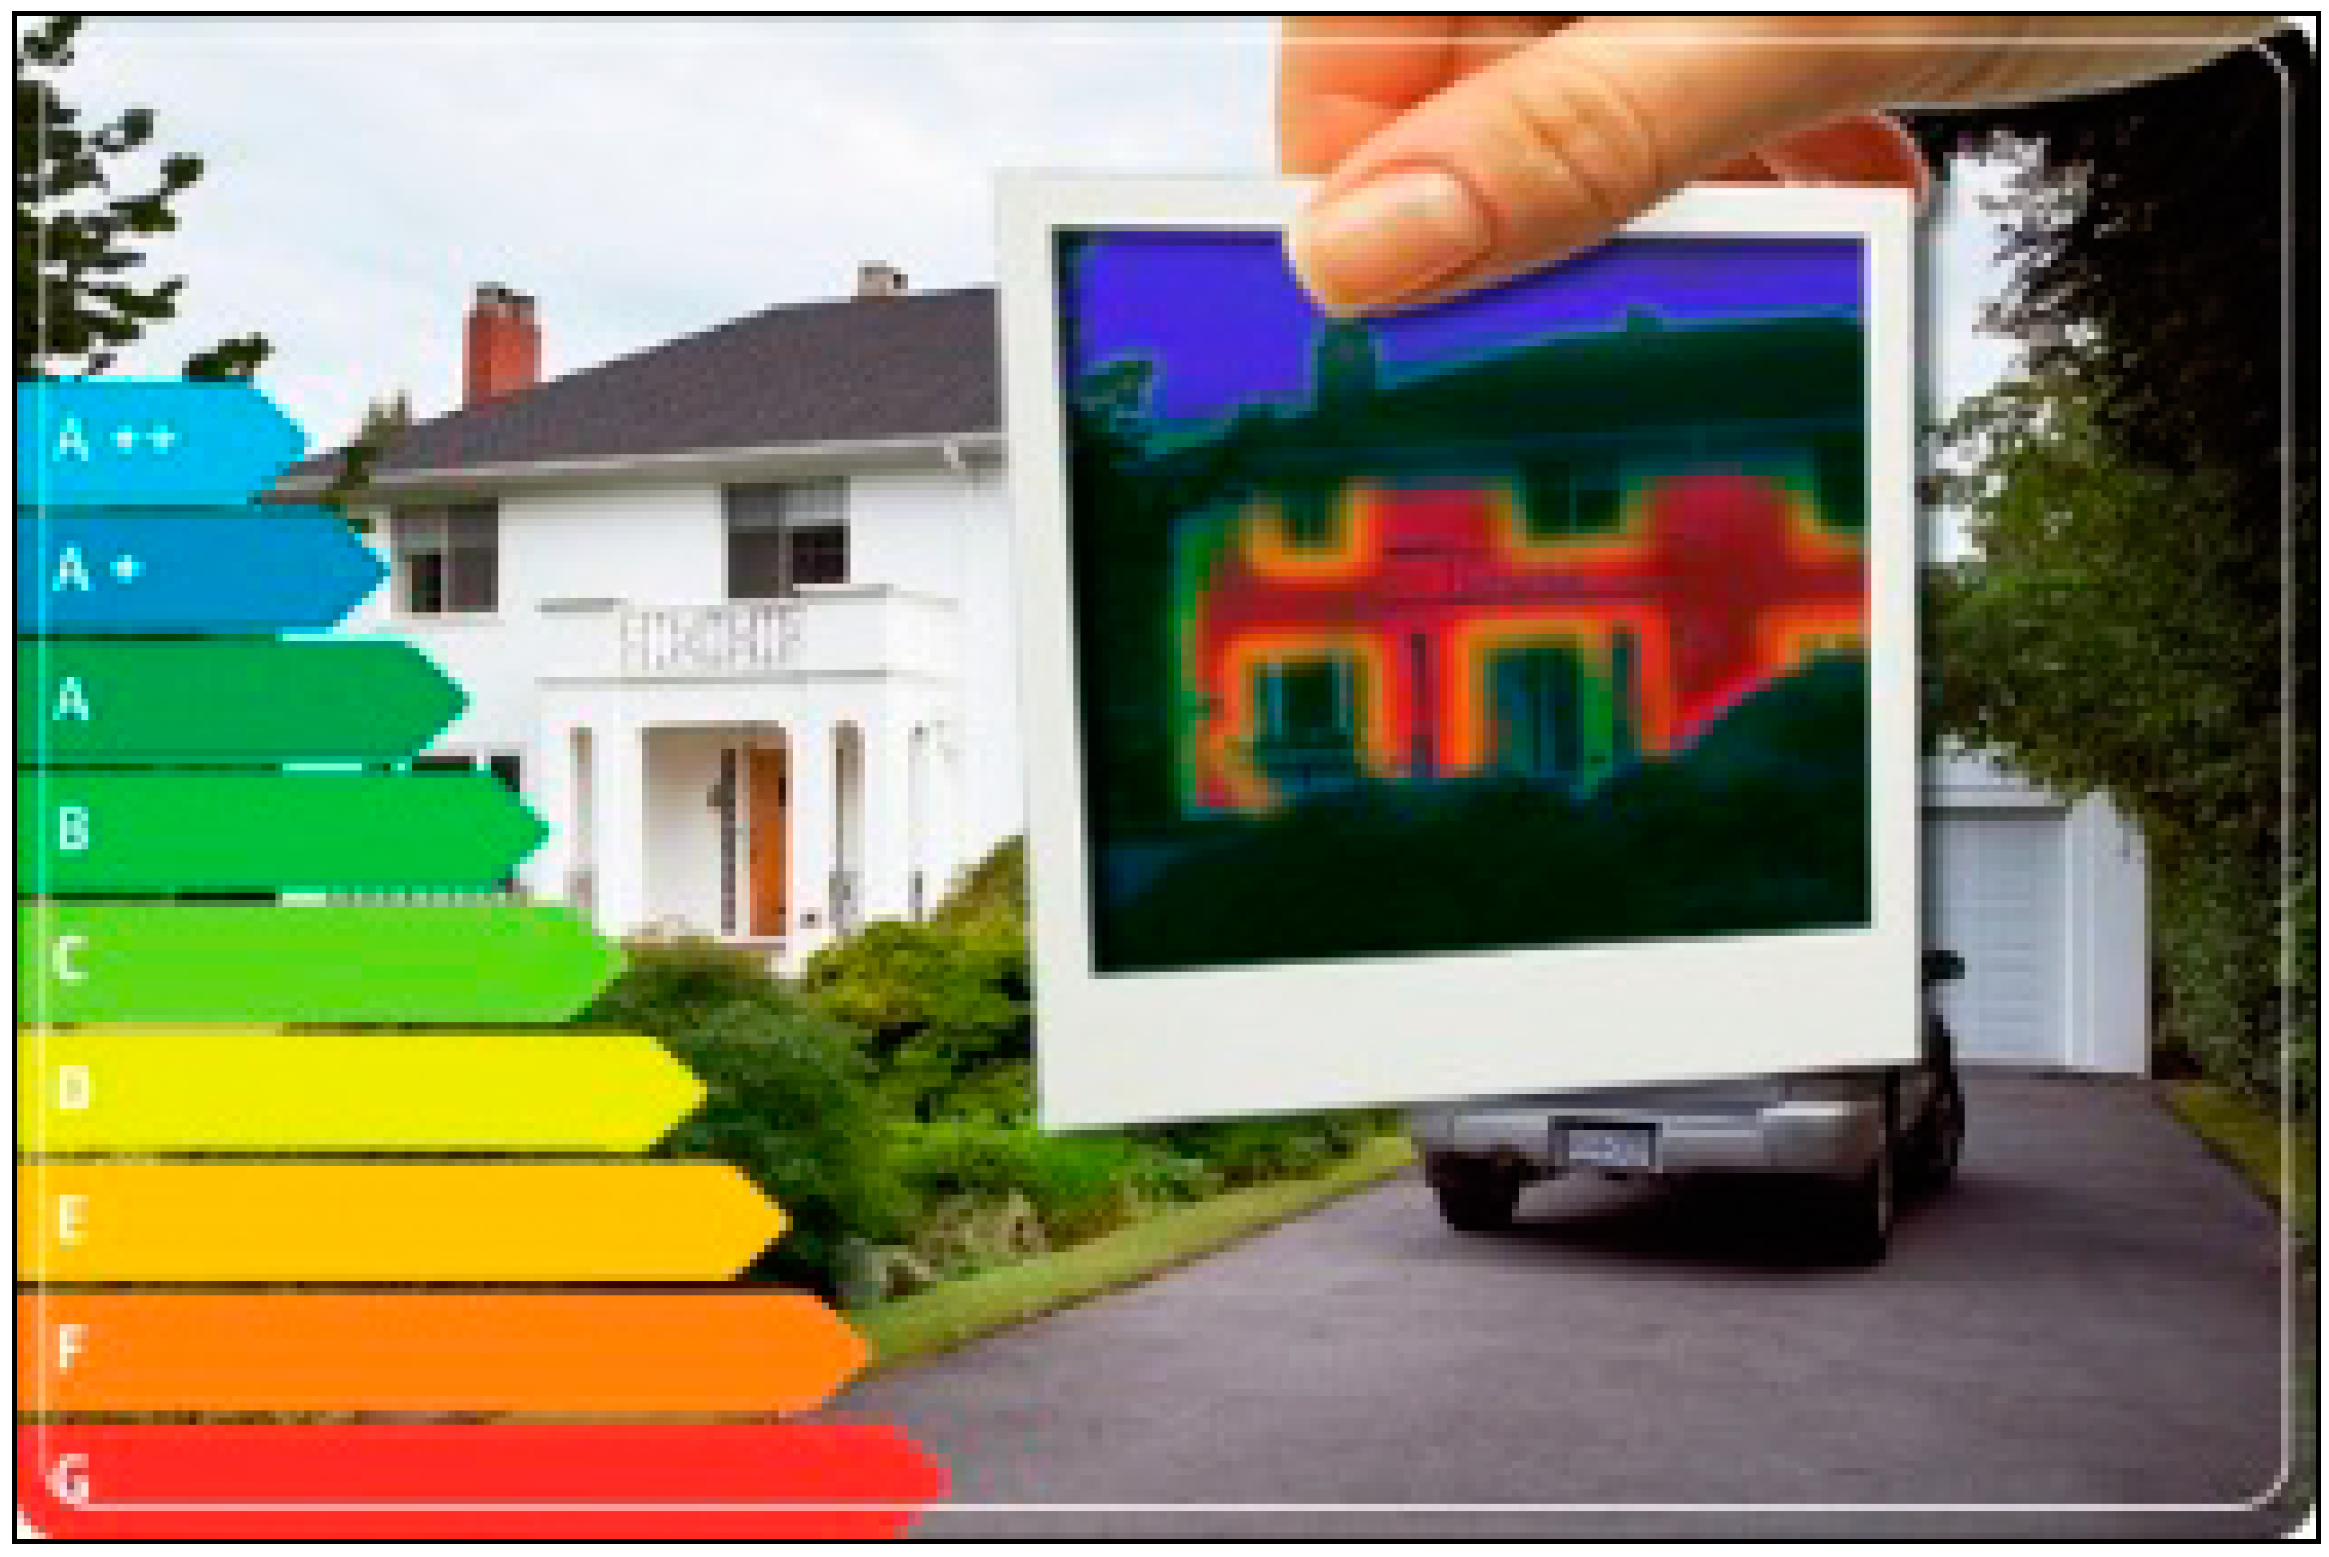
6]).The tropical EPC which is outlined within this paper suggests a cautious adaptation to a warm country where cooling is by far the major environmental issue triggering operational costs of the modern built environment. This tool provides no status of platinum, gold or silver. As
Figure 1 shows, it rather caters for a detailed scoring-based school mark system from A+ to G aligned with the spectral colours (
cf. [
7]):
Figure 1.
Energy Performance Certificate (EPC) for buildings (respective of the thermographic profile) (
cf. [
8]).
Figure 1.
Energy Performance Certificate (EPC) for buildings (respective of the thermographic profile) (
cf. [
8]).
Following both the school marks system and the thermographic profile, any building’s energy performance can be certified between red and blue. A building which is fully independent or is producing its own renewable energy, or can even can feed electricity into the grid will be granted a mark higher than “A” or green for its energy consumption [
9]. The blue A+ building itself-sustainable like all natural life on our blue planet. In their extremes, A+-buildings are power producers that hence might supply the grid under the Feed-In Tariff (“FIT”), e.g., in Malaysia since 2012 [
10].
Hence, the practical implication of the TEPC is not a green label solely shown to relatives, neighbours and friends of how “green” and perhaps, also energy-efficient the building is. It is there to assist the occupant and a prospective buyer to gauge to what extent it is to save energy and hereby save CO
2 in the future. In addition, selling will be easier, and the certificate is affordable (following some prevailing European standards the price would be about 100 EUR). The tool is distinct from more sophisticated Green Building Indices such as LEEDS—USA, BREAMS—United Kingdom, Green Star—Australia, DGNB—Germany or GBI—Malaysia [
11]. The reason is that the EPC is solely interested in evaluating (a) the strength of insulation and subsequently; (b) the greenness of the electricity consumption in terms of energy efficiency.
Along with two further criteria derived below, the TEPC certificate will show to what extent a building is capable of saving on energy usage and, in the blue case it will even produce renewable energy for the grid and other households. In its radical version as a passive house, it is clearly benchmarked against other reference buildings. The following example shows the overall energy consumption comparing different reference buildings with different standards (retrofitted, newly erected on the scale of the most recent German Energy Regulation 2014 (EnEV).
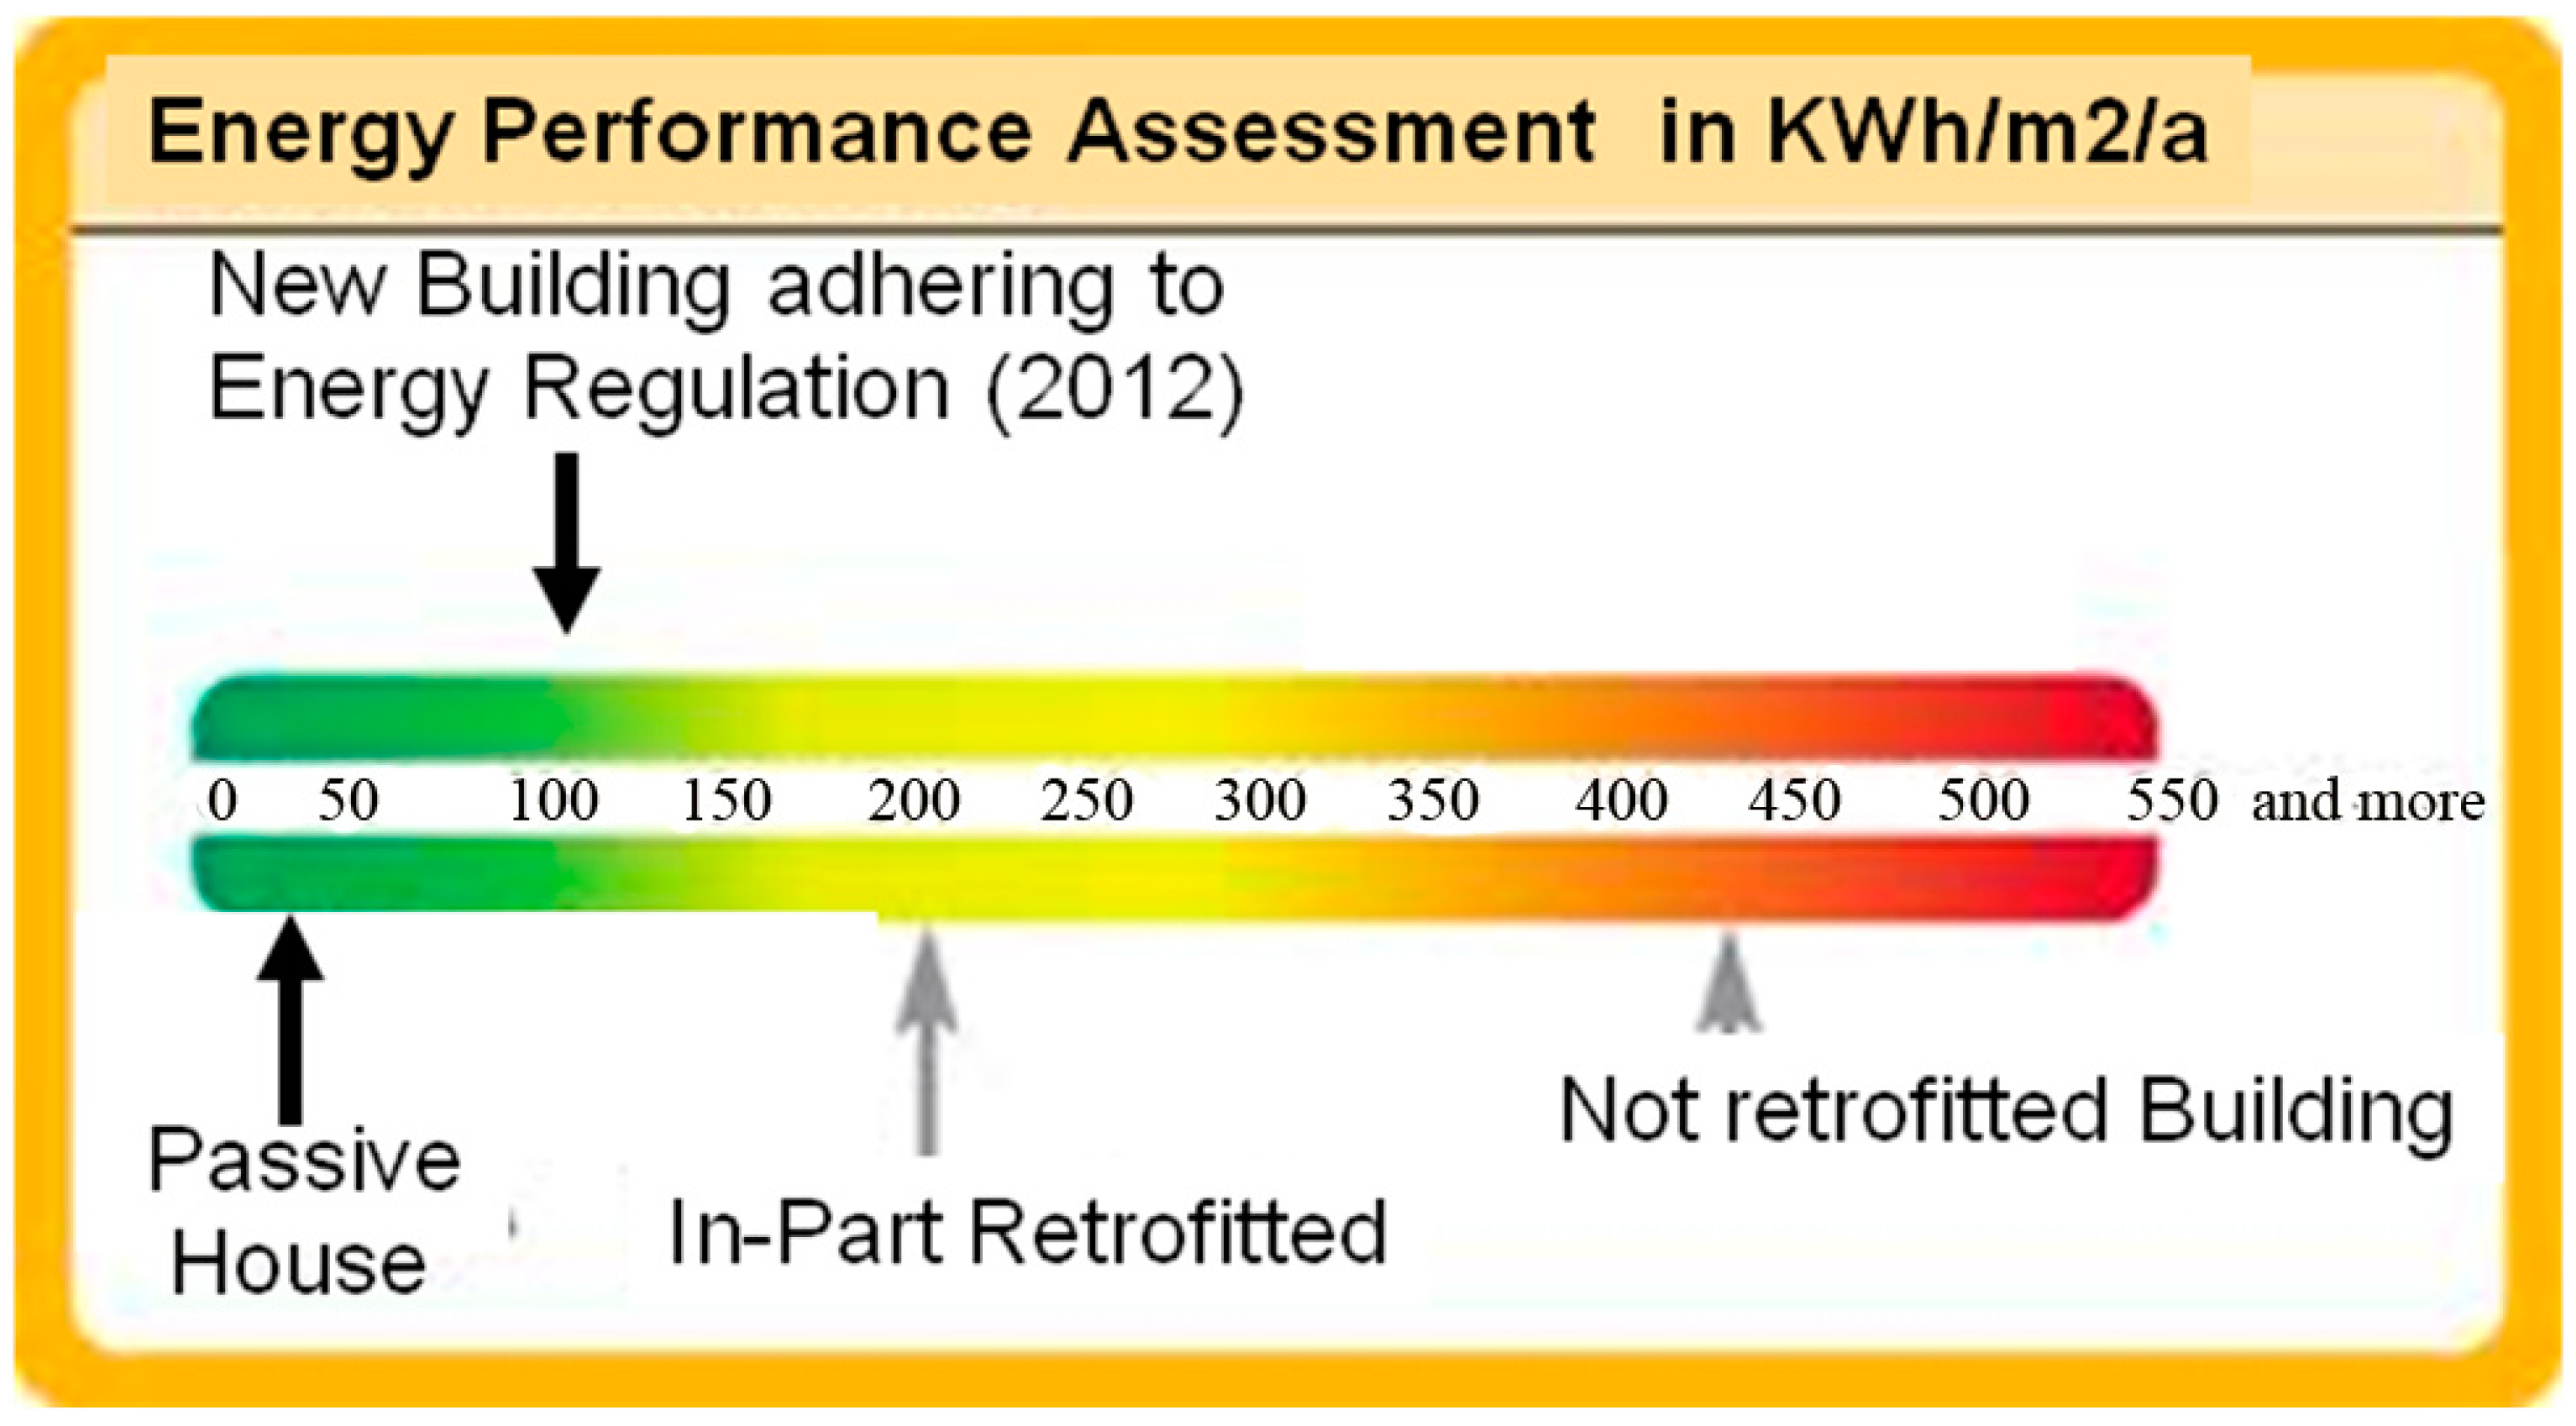
If a house were to comply with the official regulations for a new building adhering to Energy Regulation (2012), according to figure 2 the primary energy demand would have an allowable maximum consumption of 100 kWh/m
2 [
12]. Furthermore, the “light-yellow” in-part retrofitted building in the yellow zone may consume a maximum 200 kWh/m
2p.a. of primary electricity. That would mean that in some cases of existing houses major renovations—like the not retrofitted building with 425 kWh/m
2p.a have to be undertaken in order to bring them from a higher kWh/m
2p.a. consumption. They enable the building to attain the permitted 200 kWh/m
2p.a of an in-part retrofitted building in our example in the subsequent
Figure 2). Proven methods include replacing single with double glazing with the effect that the primary energy demand per annum will decrease below the targeted value of 200 kWh kWh/m
2p.a—if the green building consultant’s recommendation (e.g., consumption is monitored by an energy saving smart system and mechanical night-time cross ventilation) is implemented.
Figure 2 exhibits the status of a passive house and energy regulations in Germany benchmarking real buildings scaling their distances.
Figure 2.
General scale of EPC KWh/m2—summary and examples of yellow and red zone building legal requirements in Germany.
Figure 2.
General scale of EPC KWh/m2—summary and examples of yellow and red zone building legal requirements in Germany.
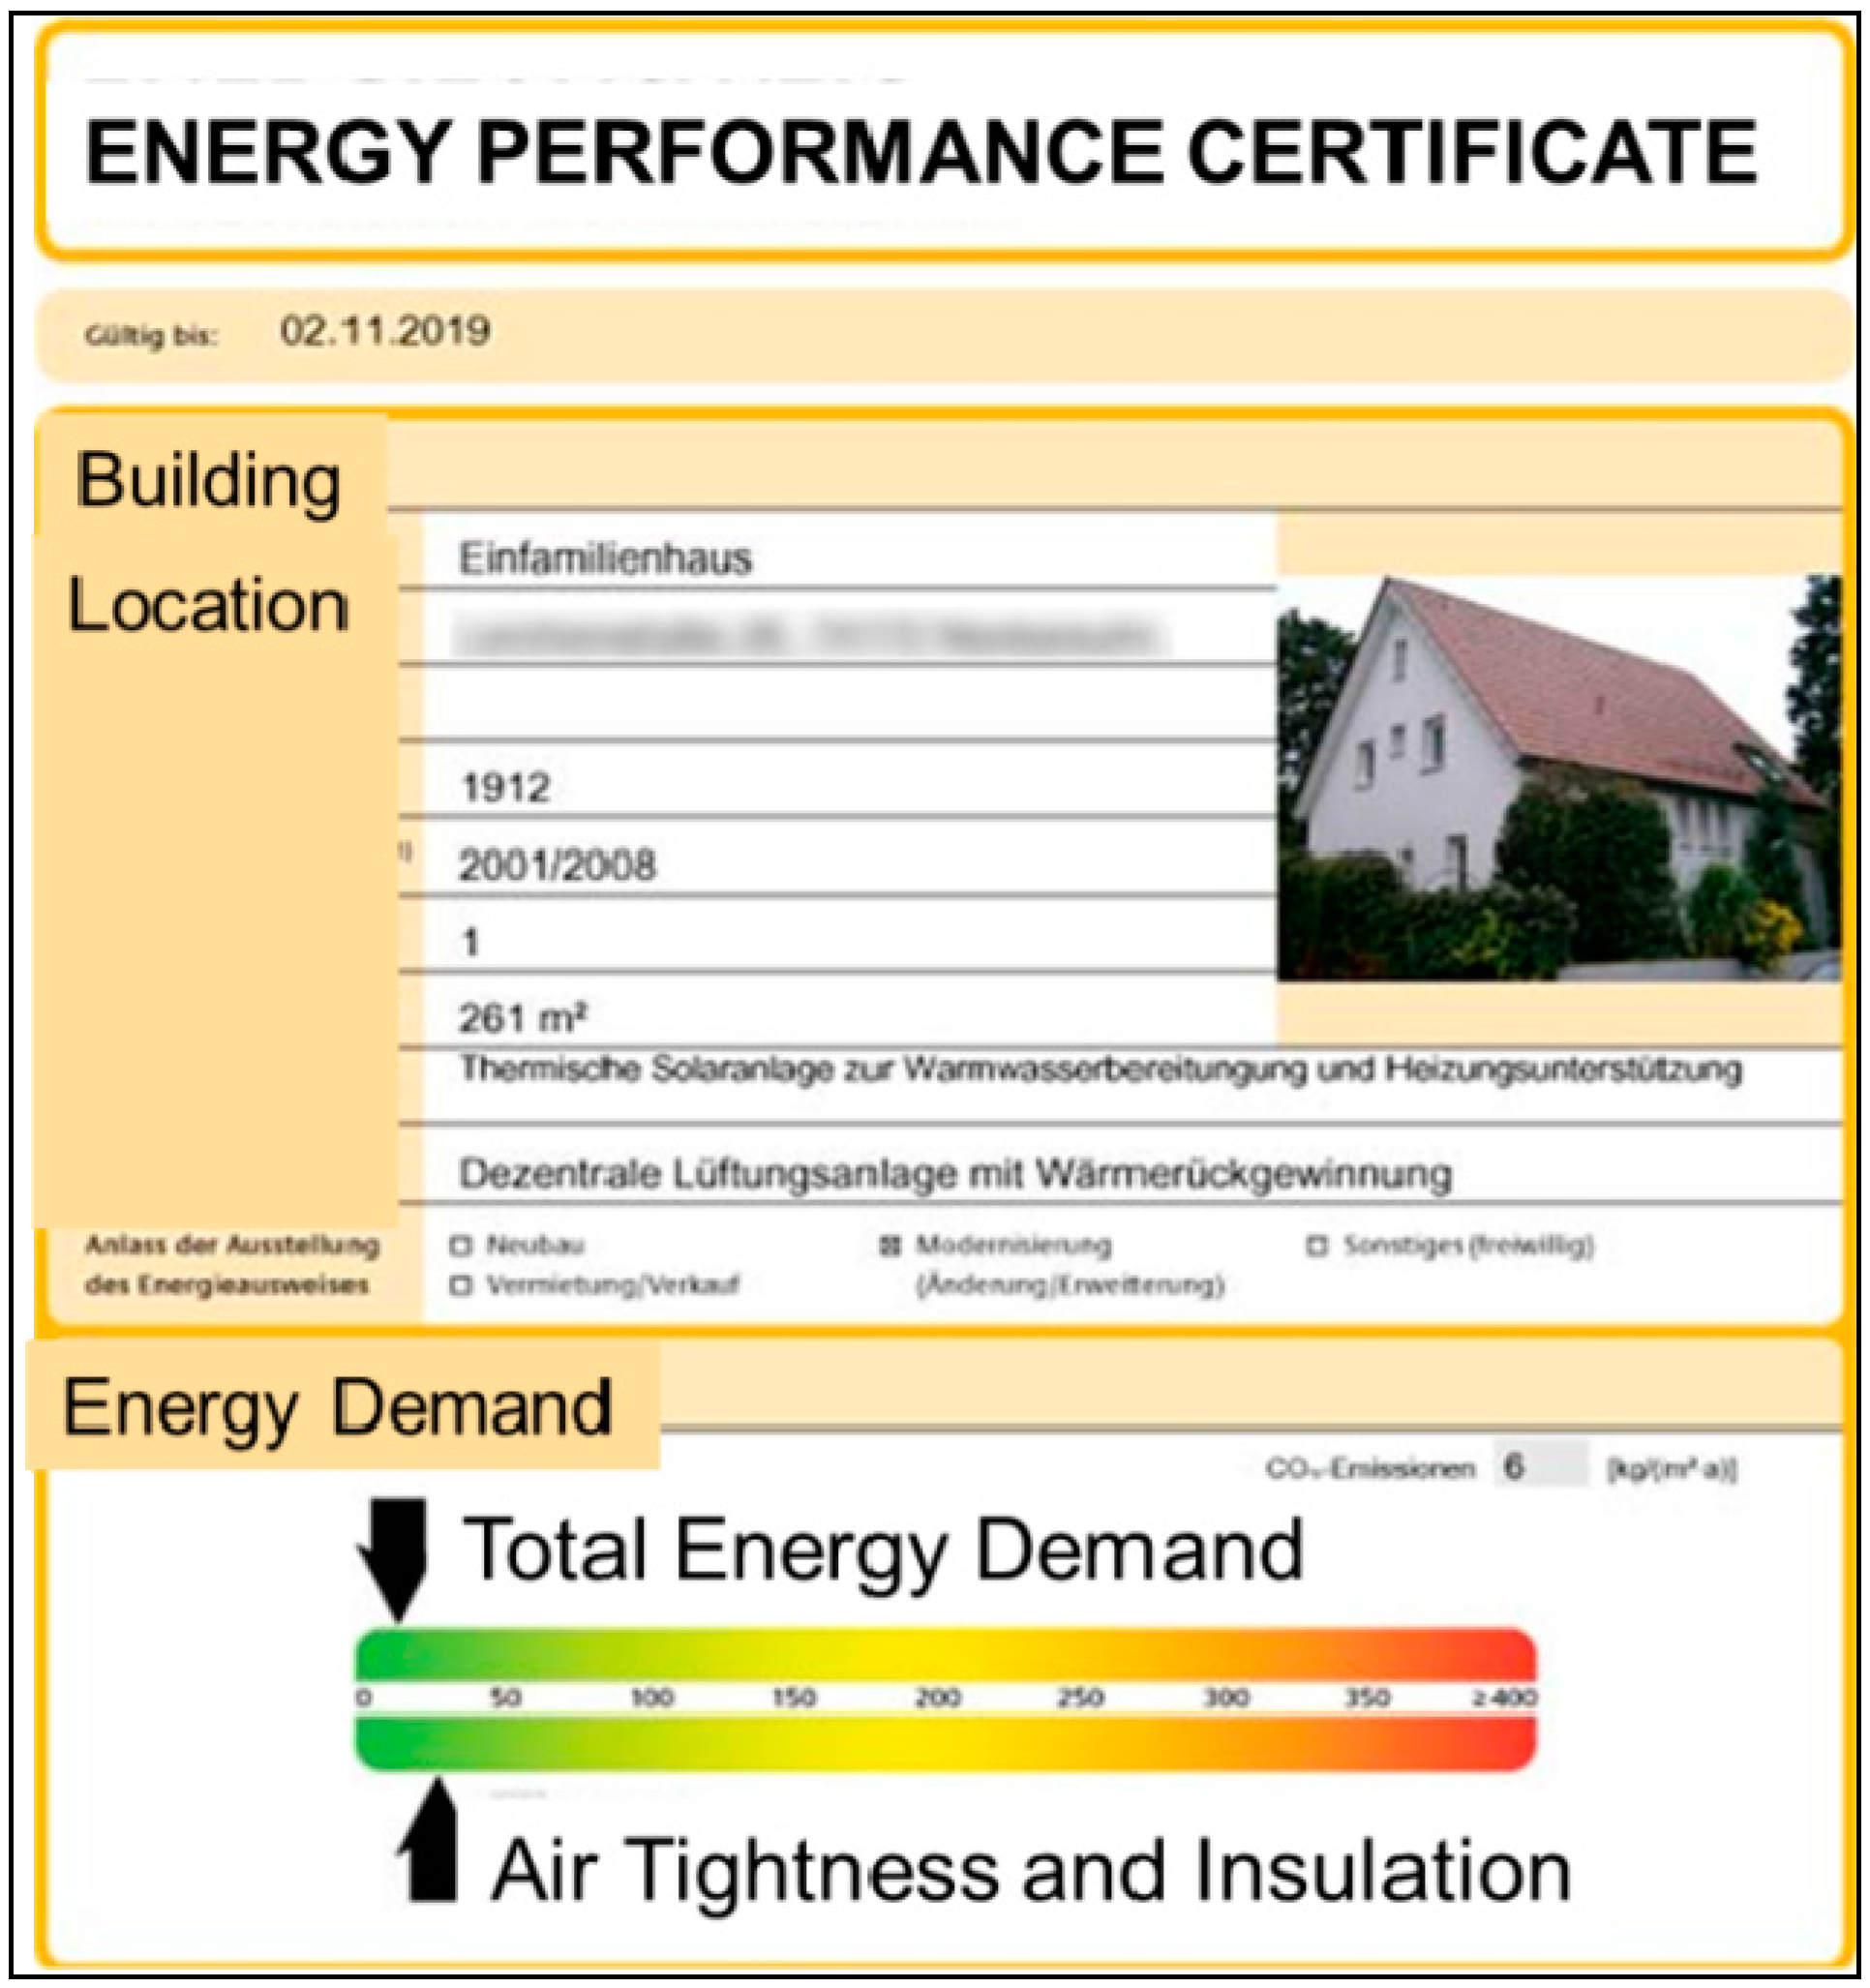
The following depiction shows the fully-fledged energy performance certificate of a retrofitted building near Stuttgart, Germany. The house consumes 12 kWh/m
2p.a. of power and has 26 kWh/m
2p.a primary energy demand which renders it already quite green. With this performance certificate, when selling the house, the new owner will have an indication of the greenness of the building and this will help to negotiate accordingly towards a reasonably higher market price compared to a common red or yellow building [
6]. As pointed out above, the fully-fledged certificate form is an official document obligatory to be presented for a purchase in several countries of the EU.
3. Measuring the Status Quo in a Residential Building
Throughout the following pages, in total, four core dimensions of the Tropically Adapted Energy Performance Certificate (TEPC) will be derived from the Triple Bottom Green Line mentioned above.
CO
2emission, thermal comfort and cost saving are the three “triple” output-factors posing as a “magic triangle” for green and energy efficient buildings. Conversely, minimum heat transmission (by optimum insulation, up to air-tightness) is considered an enabler or input factor for the three output factors. Basically, the four factors can be individually measured between green and red. The occupant or owner of a building in
Figure 3. receives feedback whether these items are green, red or somewhere in between in the rainbow scheme.
Figure 3.
Energy Performance Certificate residential building (Germany) [
13].
Figure 3.
Energy Performance Certificate residential building (Germany) [
13].
Instead of measuring two parameters like for the original European tool which has also been commonly transferred to other parts of the world, the TEPC does not only distinguish between CO
2 emission as well as heat transmission and insulation rate. In addition, thermal comfort and cost considerations are introduced as two more parameters of the Tropically Adapted Energy Performance Certificate. Different from countries in the colder hemisphere, where thermal comfort seems to be taken for granted within the certification tools, the achievement of thermal comfort is very questionable especially for non-automated tropical residential buildings [
14]. Furthermore, cost consideration is a decisive element to create awareness, reflect and utilise the purchasing power of potential green building buyers. Bringing cost considerations into the fray seems to create new business terrain in a market place where it appears that Returns of Investment (ROIs) comparing green and red had never been calculated in a systematic and meaningful manner.
The following four subunits provide a closer look into the four categories paving the way for further discussion.
3.1. Heat Transmission and Insulation Rate
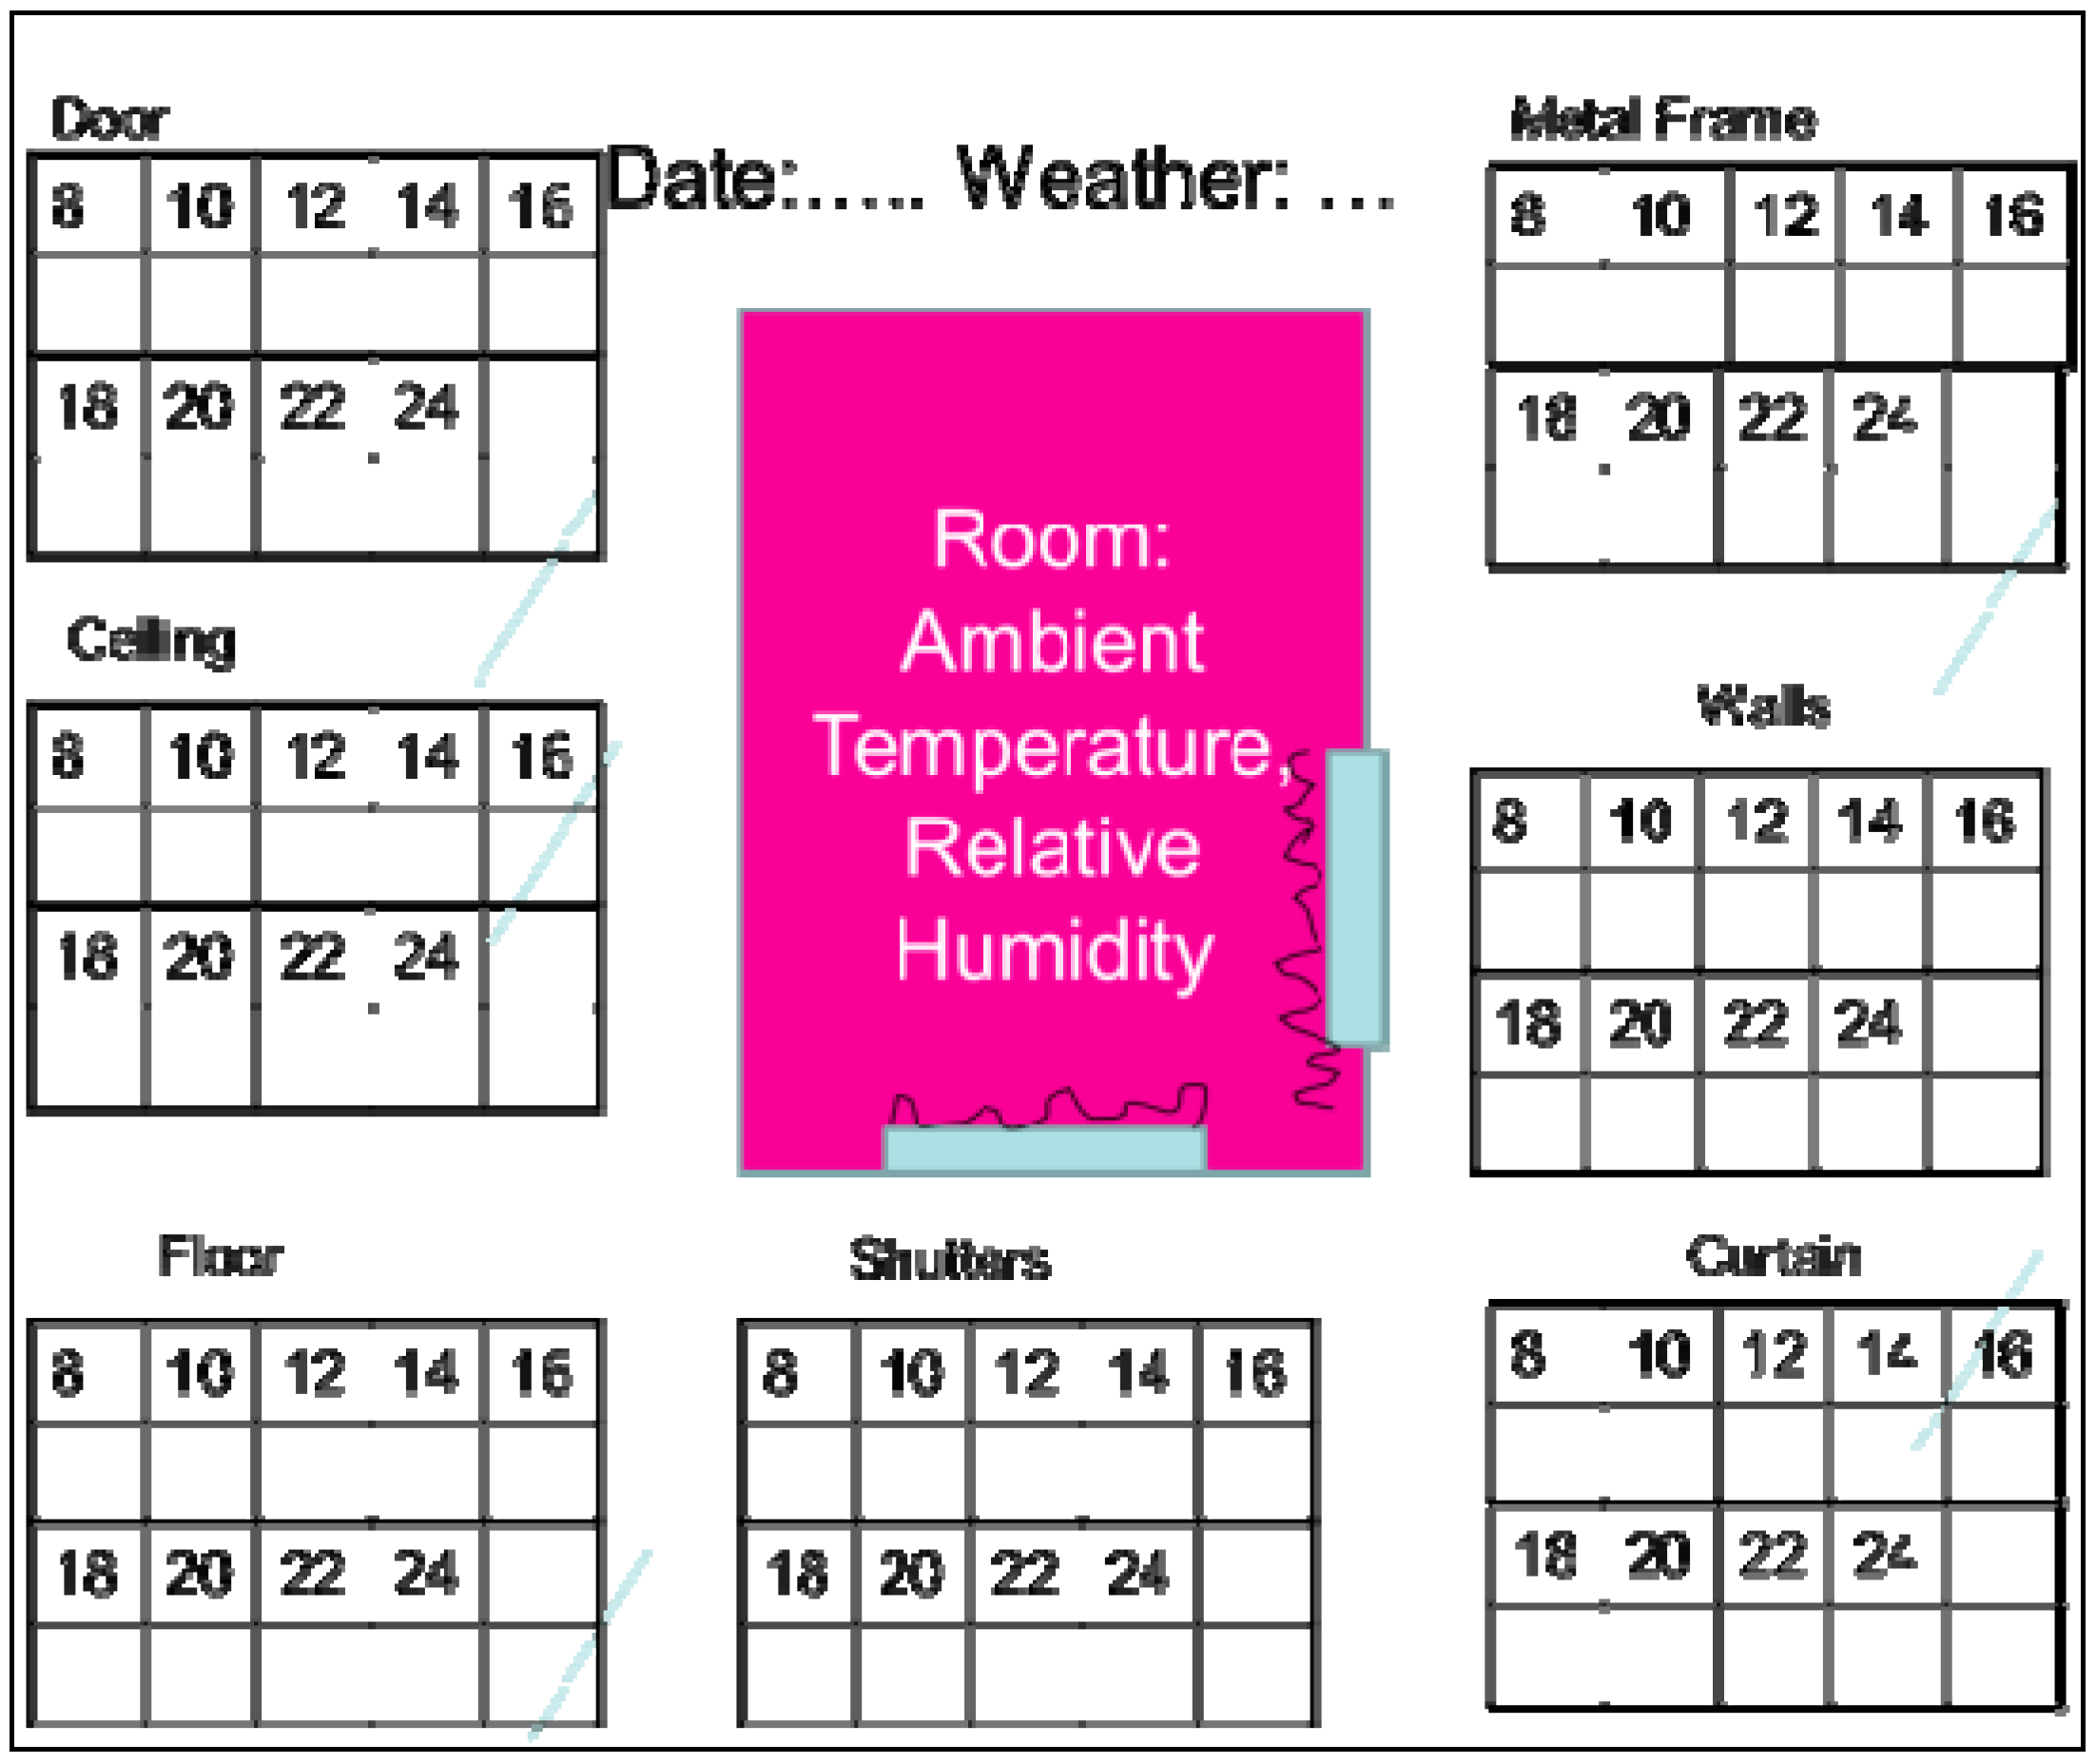
Within the current measurement, it is a rising imperative and common practice in the green building industry to measure heat rejection indicators such as R-values or summarised U-values, A-values, CHI-values and so forth. Within the TEPC, these values are enablers to reduce the basic temperature and try to help to determine the Roof Thermal Transfer Value (RTTV) and the Energy Thermal Transfer Value (ETTV). As a concerted action, however, the approach mobilised here is also quite different and easy to understand for its occupants who might not be engineers or architects. Still, we are utilising materials in terms of heat reduction, but in the end there is only one relevant factor to determine the greenness or redness of a building’s insulation. The radiant “surface” temperature of all of the following nine parameters at peak values during a set of five typical sunny/cloudy “overcast” afternoons are considered with the following measurement tool.
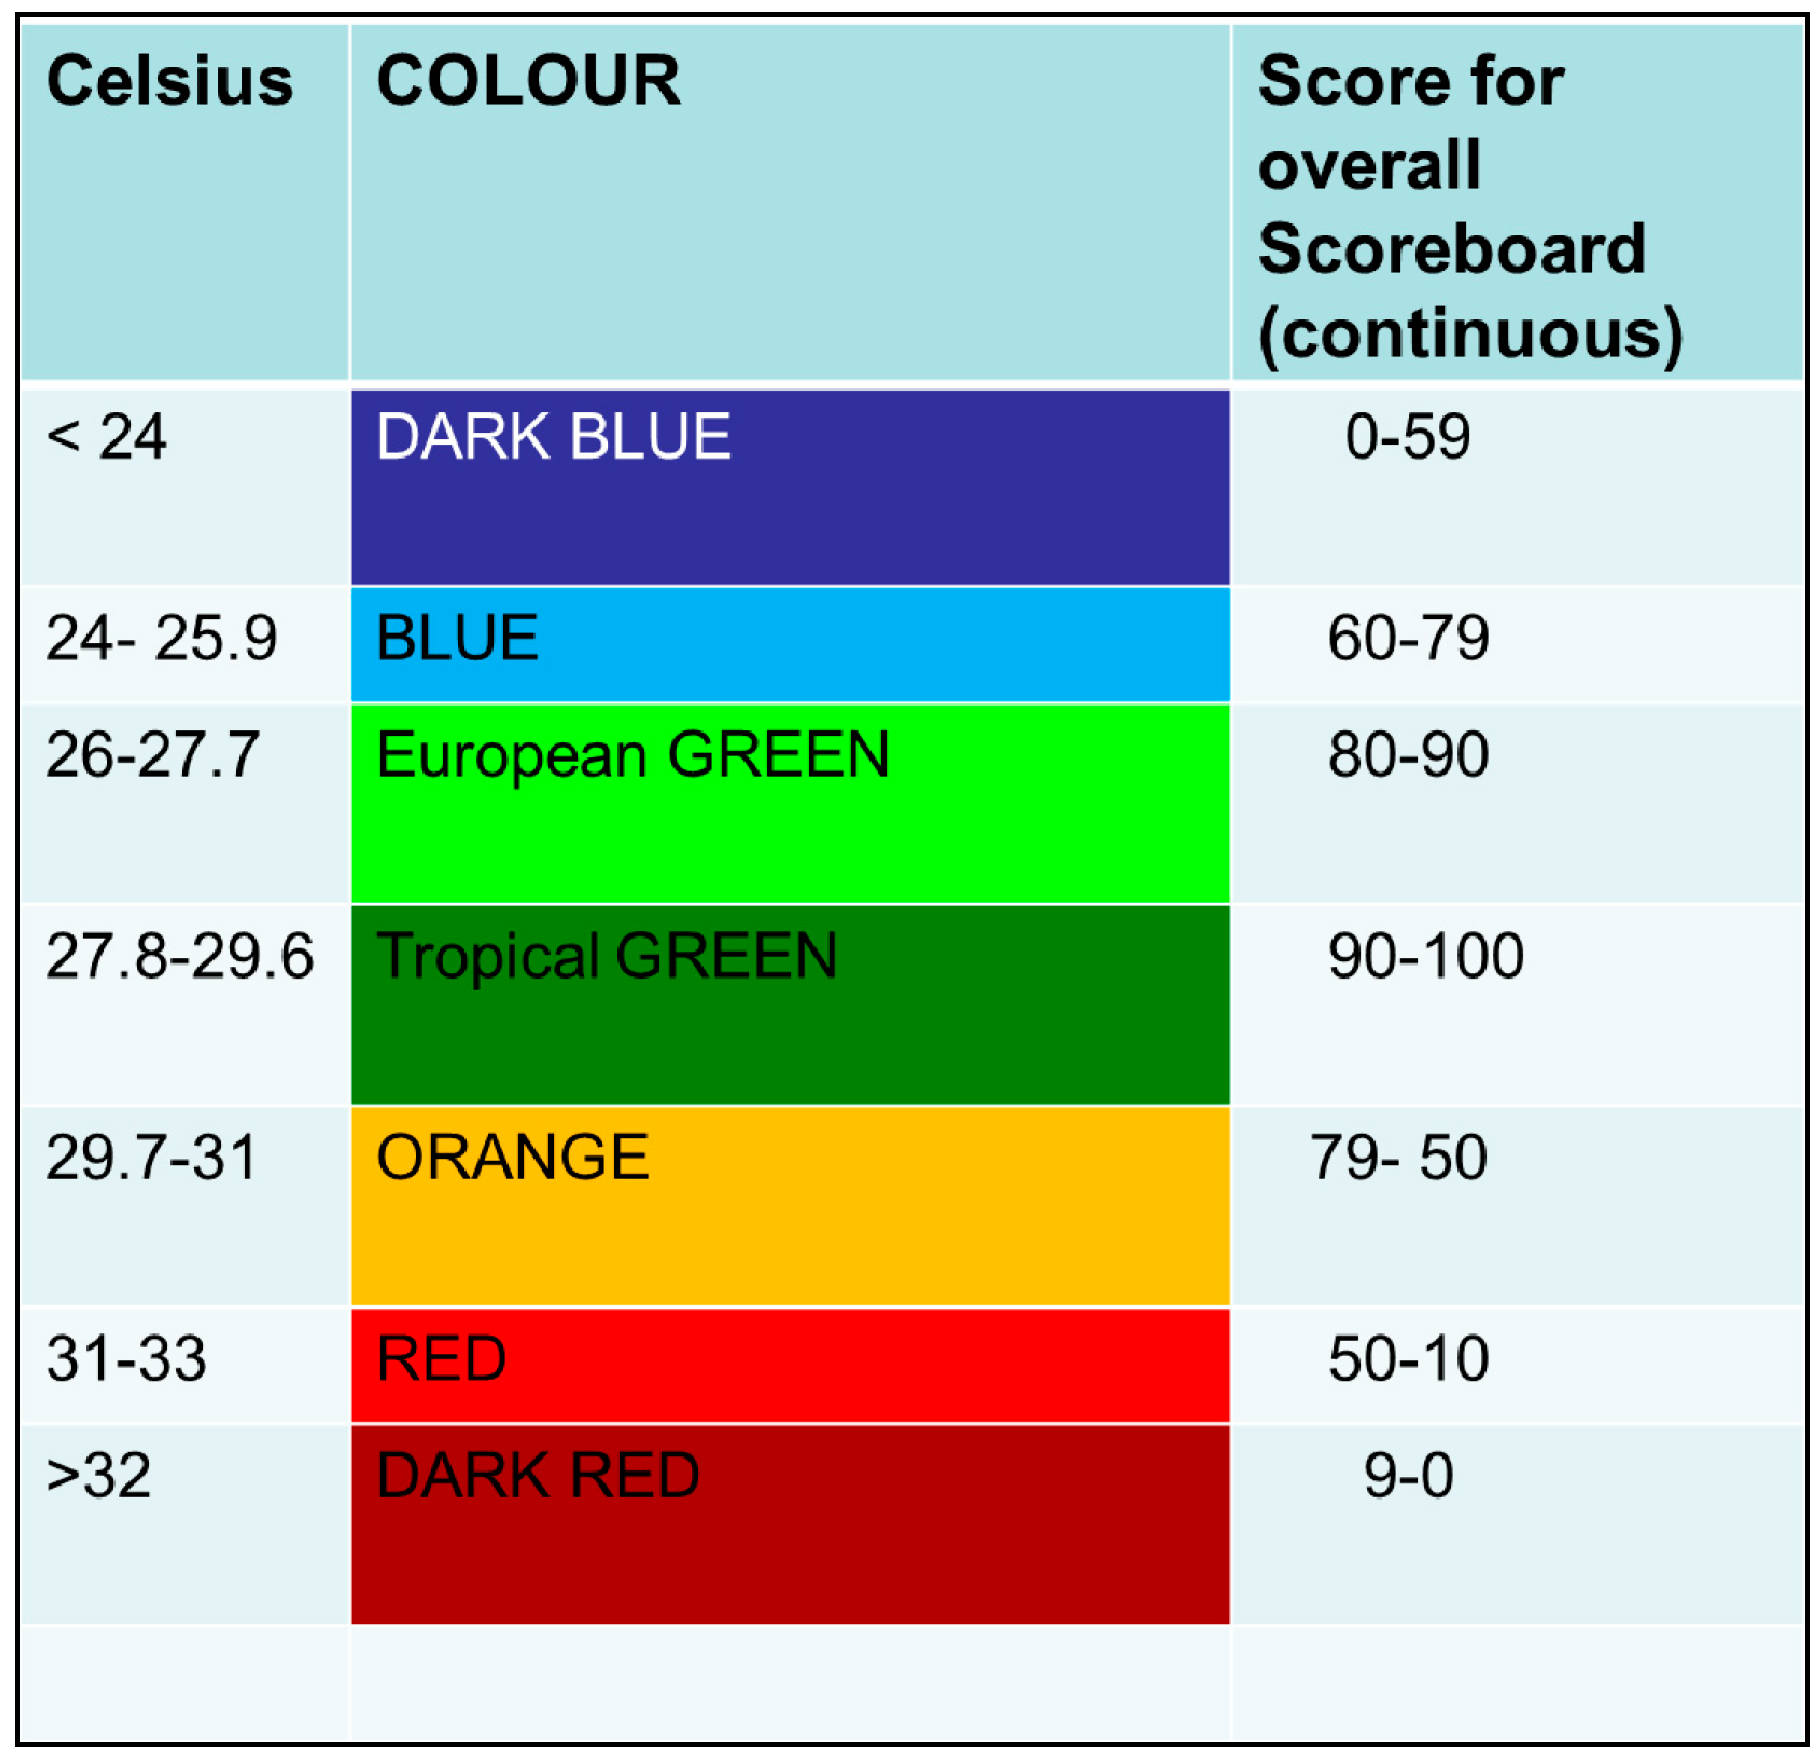
According to this template, the radiant temperature is considered as an input factor which enables a building to create a more or less agreeable ambient temperature inside. It is possible to calculate the ambient temperature by using the single parameters above. The precise way most likely lies in mathematical formula yet to be developed. The easier way is to rely on the statistical values of one’s own research as we did in case of a room in an urban high rise in comparison to a suburban semi-detached building. The following rule of thumb calculation at this point in time is based upon empirical evidence in the author’s own house: The average of the radiant temperature of the room’s eight surrounding modules in figure 4 minus 1 = ambient room temperature at the same point in time. That means if we are able to bring down the radiant average peak day temperature to 29.6 °C, the ambient temperature will be 28.6 °C. This is the allowable maximum in range of the tropical thermal comfort zone devised below [
9,
15]. If the average radiant temperature of the surroundings is still above 29.6 °C, it would be necessary to cool the respective room module further or to decrease the ambient temperature until it is in range and can be maintained. Therefore, the colour scale along with a more detailed scale from 0–100 scores can serve as an overall TEPC-scoreboard as per
Figure 4:
Figure 4.
Ambient temperature of a room and radiant temperature of its seven surrounding modules measured nine times daily (in correlation with outside temperature).
Figure 4.
Ambient temperature of a room and radiant temperature of its seven surrounding modules measured nine times daily (in correlation with outside temperature).
In contrast to the A+ value of the blue European energy performance certificate, blue in a tropical sense of surface temperature would mean the delivery of too-cold radiant temperatures. According to a normal distribution elaborated in
Section 3.3 under thermal comfort, this temperature has not been requested by the majority of tropical occupants. Therefore, the scores (max. 100, min. 0) are also low, similar as if the surface temperature average exceeds 29.6 °C.
Figure 5 presents the application of the TEPC scaling radiant inside temperatures of the building envelope and related parameters like windows and doors.
Figure 5.
Input U-/G-value replaced by output radiant temperature of 6–7 parameters [
14].
Figure 5.
Input U-/G-value replaced by output radiant temperature of 6–7 parameters [
14].
3.3. Thermal Comfort/Thermal Sensation
We define “thermal comfort” as the state of mind that expresses satisfaction with the temperature, humidity and velocity of the surrounding environment (according to the ISO 7730 or, likewise [
17,
18]. Together with (a) environmental sustainability and (b) long-term cost saving, (c) creating and maintaining thermal comfort for occupants of buildings or other enclosures is the third of the three important output objectives of triple green building architecture and engineering. Thermal comfort constitutes a basic individual need. Presuming it is granted, in a concerted effort with other physical needs, it enables us to climb up the ladder of Maslow’s renowned motivational pyramid of needs from basic needs. Conversely, in its absence, any thermal gain or loss above or beyond its essential borderlines may generate a sensation of discomfort. Examples are school children in tropical low-cost buildings who are expected to do their homework in temperatures of 32 °C and above. They become victimised as they will not be in a condition to perform well.
3.3.1. Ambient Temperature
A typical Northern conception of thermal comfort has been based on the idea that the inside temperature for offices should be 21.1 °C on average with variations of ±2.5 °C (like in the ASHRAE Handbook [
17]. Of course, in a cold country every °C that does not need to be heated during the predominant cold seasons can save tremendously on energy and budget. In recent years, the average figure for thermal comfort has been even proposed to be altered for European offices to 24.5 °C, which means an enormous deviation from the internationally renowned previous ASHRAE-standard. For Northern countries, this is questionable for environmental reasons because of higher energy demand. For tropical countries, however, it sounds very reasonable. Busch [
19] carried out a pioneering field study for Thai offices in Bangkok and found that the optimum thermal sensation for air conditioned and naturally ventilated buildings alike was between 24.5 °C and 28.5 °C. A similar range of “neutral” conducive temperature was determined for a Malaysian School (Ibrahim Hussein, M. Hazrin A. Rahman [
20], based on PMV regression of 25.9 °C with a comfort range between 24.4 °C and 27.4 °C. The trend to increase the temperature in offices and public cooled down areas also follows the in-part demise of the common dress code with suits and ties. This trend was translated into the 2011 policy e.g., by the Malaysian government requesting all state-owned office buildings to set-point the temperature not lower than 24 °C.
Abdul Rahman [
21] in his ground-breaking study found that the most comfortable indoor temperature in Malaysia for tropical residential areas ranges higher than as for offices. His tolerated set-point of 25.5–28 °C narrows down the general recommendation by the World Health Organization (1990) ranging from 18–28 °C to its upper limits. Similarly, a research team from the University of Technology Malaysia concluded in their research that a 2.5 °C range between 26.1 °C and 28.6 °C is optimal in tropical countries, even for adapted people from Northern countries [
14]. Others’ and our own findings clearly confirm that the optimal residential area temperature for a normal distribution including about 85% of tropical occupants at its highest comfortable end should not be lower than 23.6 °C and not exceed 28.6 °C. As a conclusion, “the comfort band for the Kuala Lumpur area for all building types is between 23.6 °C and 28.6 °C with an optimum medium temperature in Malaysian households of 26.1 °C” with the upper space limit (USL) set at 28.6 °C [
14]. Two reasons can be given. (1) The lower cost when putting the highest set-point in a tropical warm country; (2) the perception by people living in tropical regions is different from those in temperate and cold regions (Wang and Wong [
22] or Singh
et al. [
23]. The perception is based on lifestyle and habits, and economic necessities. All of these factors contribute to understanding the following comparison.
As researchers proved several decades ago, the acceptable high temperature of 28.6 °C is not necessarily only restricted to Caucasians or any other human from the colder hemisphere who accepts lower temperatures, or a tropical human being who favours higher temperatures.
Devising the tropically adapted concept of energy performance for thermal comfort with these higher temperature bandings can cause a steep increment in terms of energy saving potentials. A saving of 4%–7% of CO
2 and energy costs with each degree centigrade the temperature is increased can be achieved [
24].
Unfortunately, with the USL (upper space limit)temperature set to its highest end at 28.6 °C, in a typical uninsulated concrete building, walls, windows, ceiling and roof still serve inadvertently as permanent heat traps. Hence, tropical thermal comfort without the aid of strongly blowing ventilators or air conditioners can often not be achieved. During the heat peak hours of a typical overcast sunny/cloudy day, this is difficult. Even in kampong (Malay village) areas located outside the city, which are affected by the heat island effect [
4], the ambient temperature during the heat peak hours often exceeds an intolerable 30 °C.
Table 1 zooms in different temperature comfort bandings.
Table 1.
Comparison of different thermal comfort definitions [
25].
Table 1.
Comparison of different thermal comfort definitions [25].
| Country | Min. Temp. °C | Median Temp. °C | Max. Temp. °C | Reference |
|---|
| Northern Countries | 19.1 | 21.1 | 23.1 | [17] |
| “New” Approach” (offices) | 22.5 | 24.5 | 26.5 | [26] |
| Tropical Malaysia (residential) | 23.6 | 26.6 | 28.6 | [9] |
Apart from environmental issues, it can be concluded that whether a building yields blue, dark green or light green in terms of thermal comfort temperatures is a matter of individual sensation and well-being, verified by normal distribution based studies with different populations.
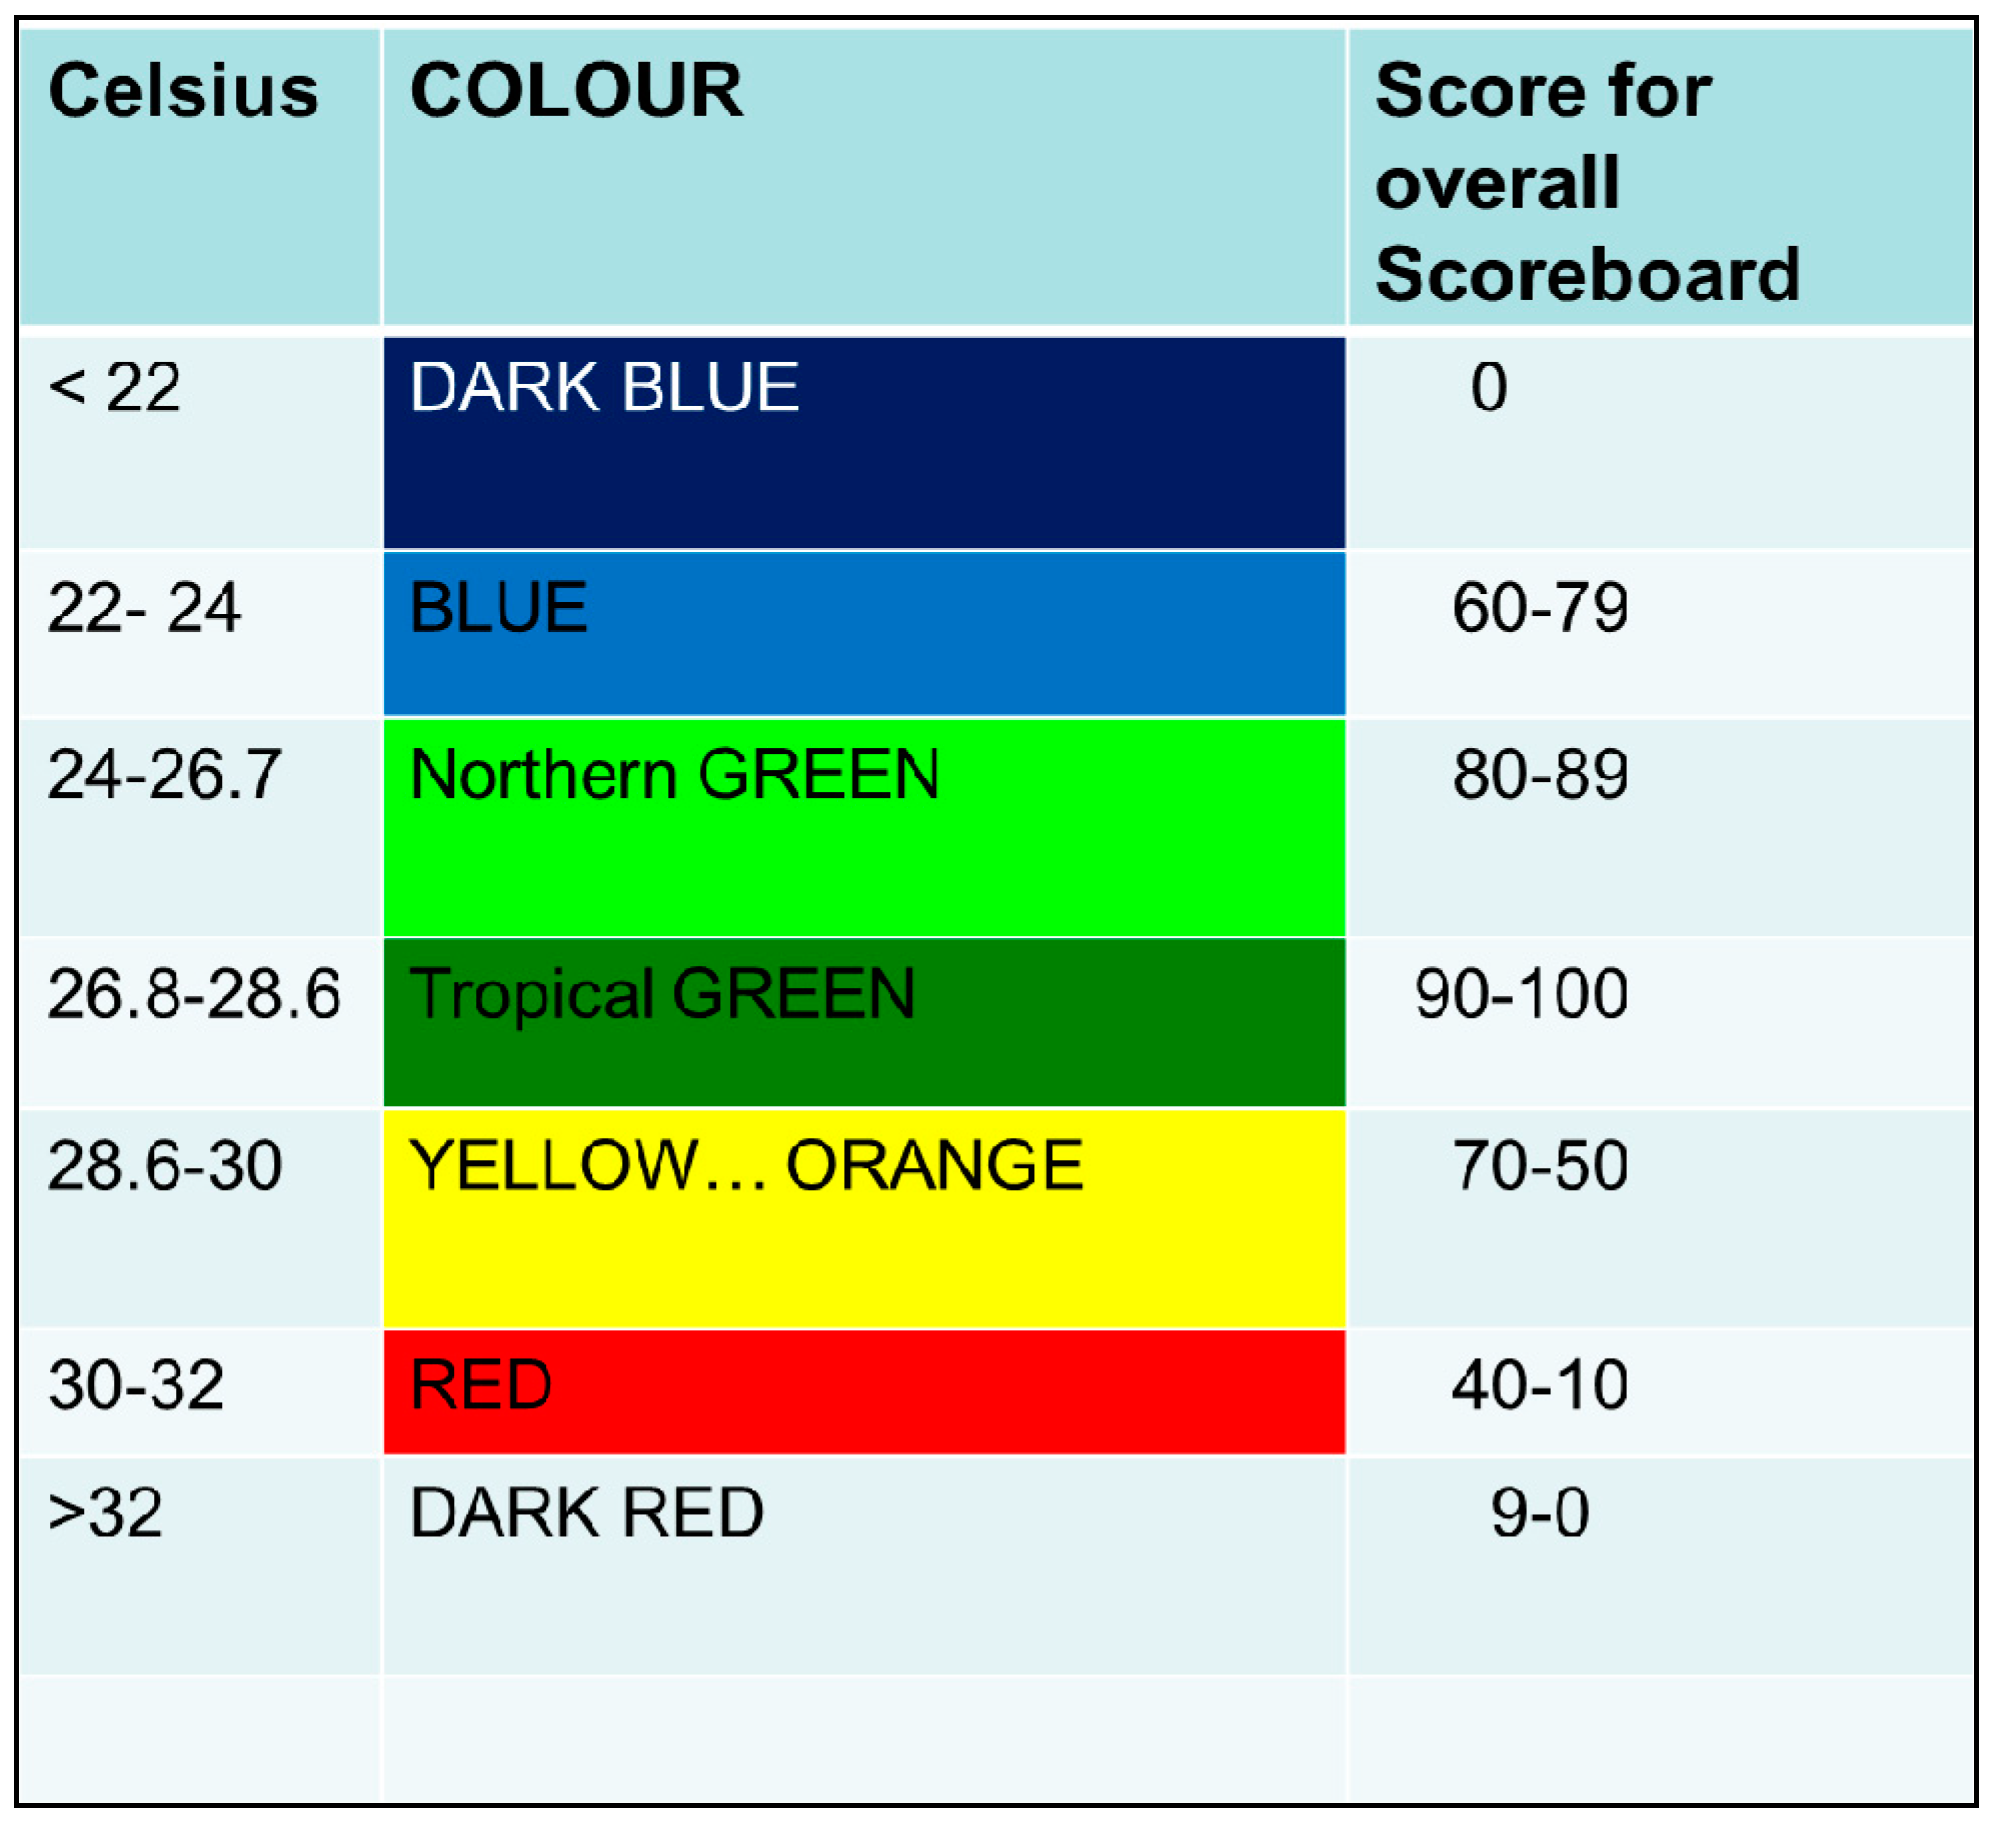
In a DoE setup (design of experiments), the average scores are now measured three times daily during the dry season’s heat peak hours with sunny/cloudy conditions after two consecutive days without rain. As indicated in
Figure 8, thermal comfort in Northern and Tropical zones may have different weightages. If the temperature is between 26.8 and 28.6 °C, the highest scores can be achieved for the tropics. The definition of green in Northern countries constitutes lower temperatures, receiving the highest scores in the Northern atmosphere. However, the longer a person lives in a tropical country, the more he or she seems to be adaptable to the local standard of thermal comfort [
27]. Altogehter, the overall bandings of ambient temperatures provided by the TEPC become clear by
Figure 8:
Figure 8.
Thermal comfort: residential ambient temperature banding [
14].
Figure 8.
Thermal comfort: residential ambient temperature banding [
14].
3.3.2. Relative Humidity (RH)
So far, as the second parameter of thermal (dis)comfort, relative humidity (RH) has not yet been considered for the TEPC. At this point in time, the author removed relative humidity as a consideration, but not just for simplicity reasons. The degree of moisture in the air is volatile and admittedly still hard to control by water- or velocity-based green cooling tools without the aid of air conditioners. Conversely, green cooling by water or air may make the already existing humidity more humid. Only if we would be able to live according to rules of a green lifestyle, we would not consider the high humidity as a serious or even the prime issue when it comes to thermal comfort banding; the tool is not yet complete. Subsequently, the relative humidity’s effects for thermal sensation are determined by different metabolism rates, our behaviour of taking showers, not eating too late and too heavy, and by utilising stronger ventilation to decrease the ambient temperature to diminish the effects of high humidity at the same time.
After some years, researchers have abandoned the idea of accepting the cold-hemisphere-borne ASHRAE-standard in terms of temperature; it is the time to question the same standard in the tropical experience having an obsolete borderline of 60% for relative humidity. Questioning this standard, the author does not stand alone. Local tropical researchers confirm have confirmed in conferences that “above 60%” is a dissatisfactory borderline when, across the board, the RH in urban and sub-urban areas is almost always 10%–20% higher. ASHRAE is only statically defined by the amount of moisture that can be digested by our skin without causing sweating. The 60% standard presumes that tropical countries without artificial dehumidification will never have livable homes—unless they use air conditioners or not yet marketable dehumidifying gadgets. However, as studies have not yet been undertaken, there is nothing in writing to verify the question behind the 60% borderline. Hence, we must await further applied research in the tropics that comes up with more empirical evidence in order to argue this issue in depth beyond academic discussion.
3.4. Cost Considerations
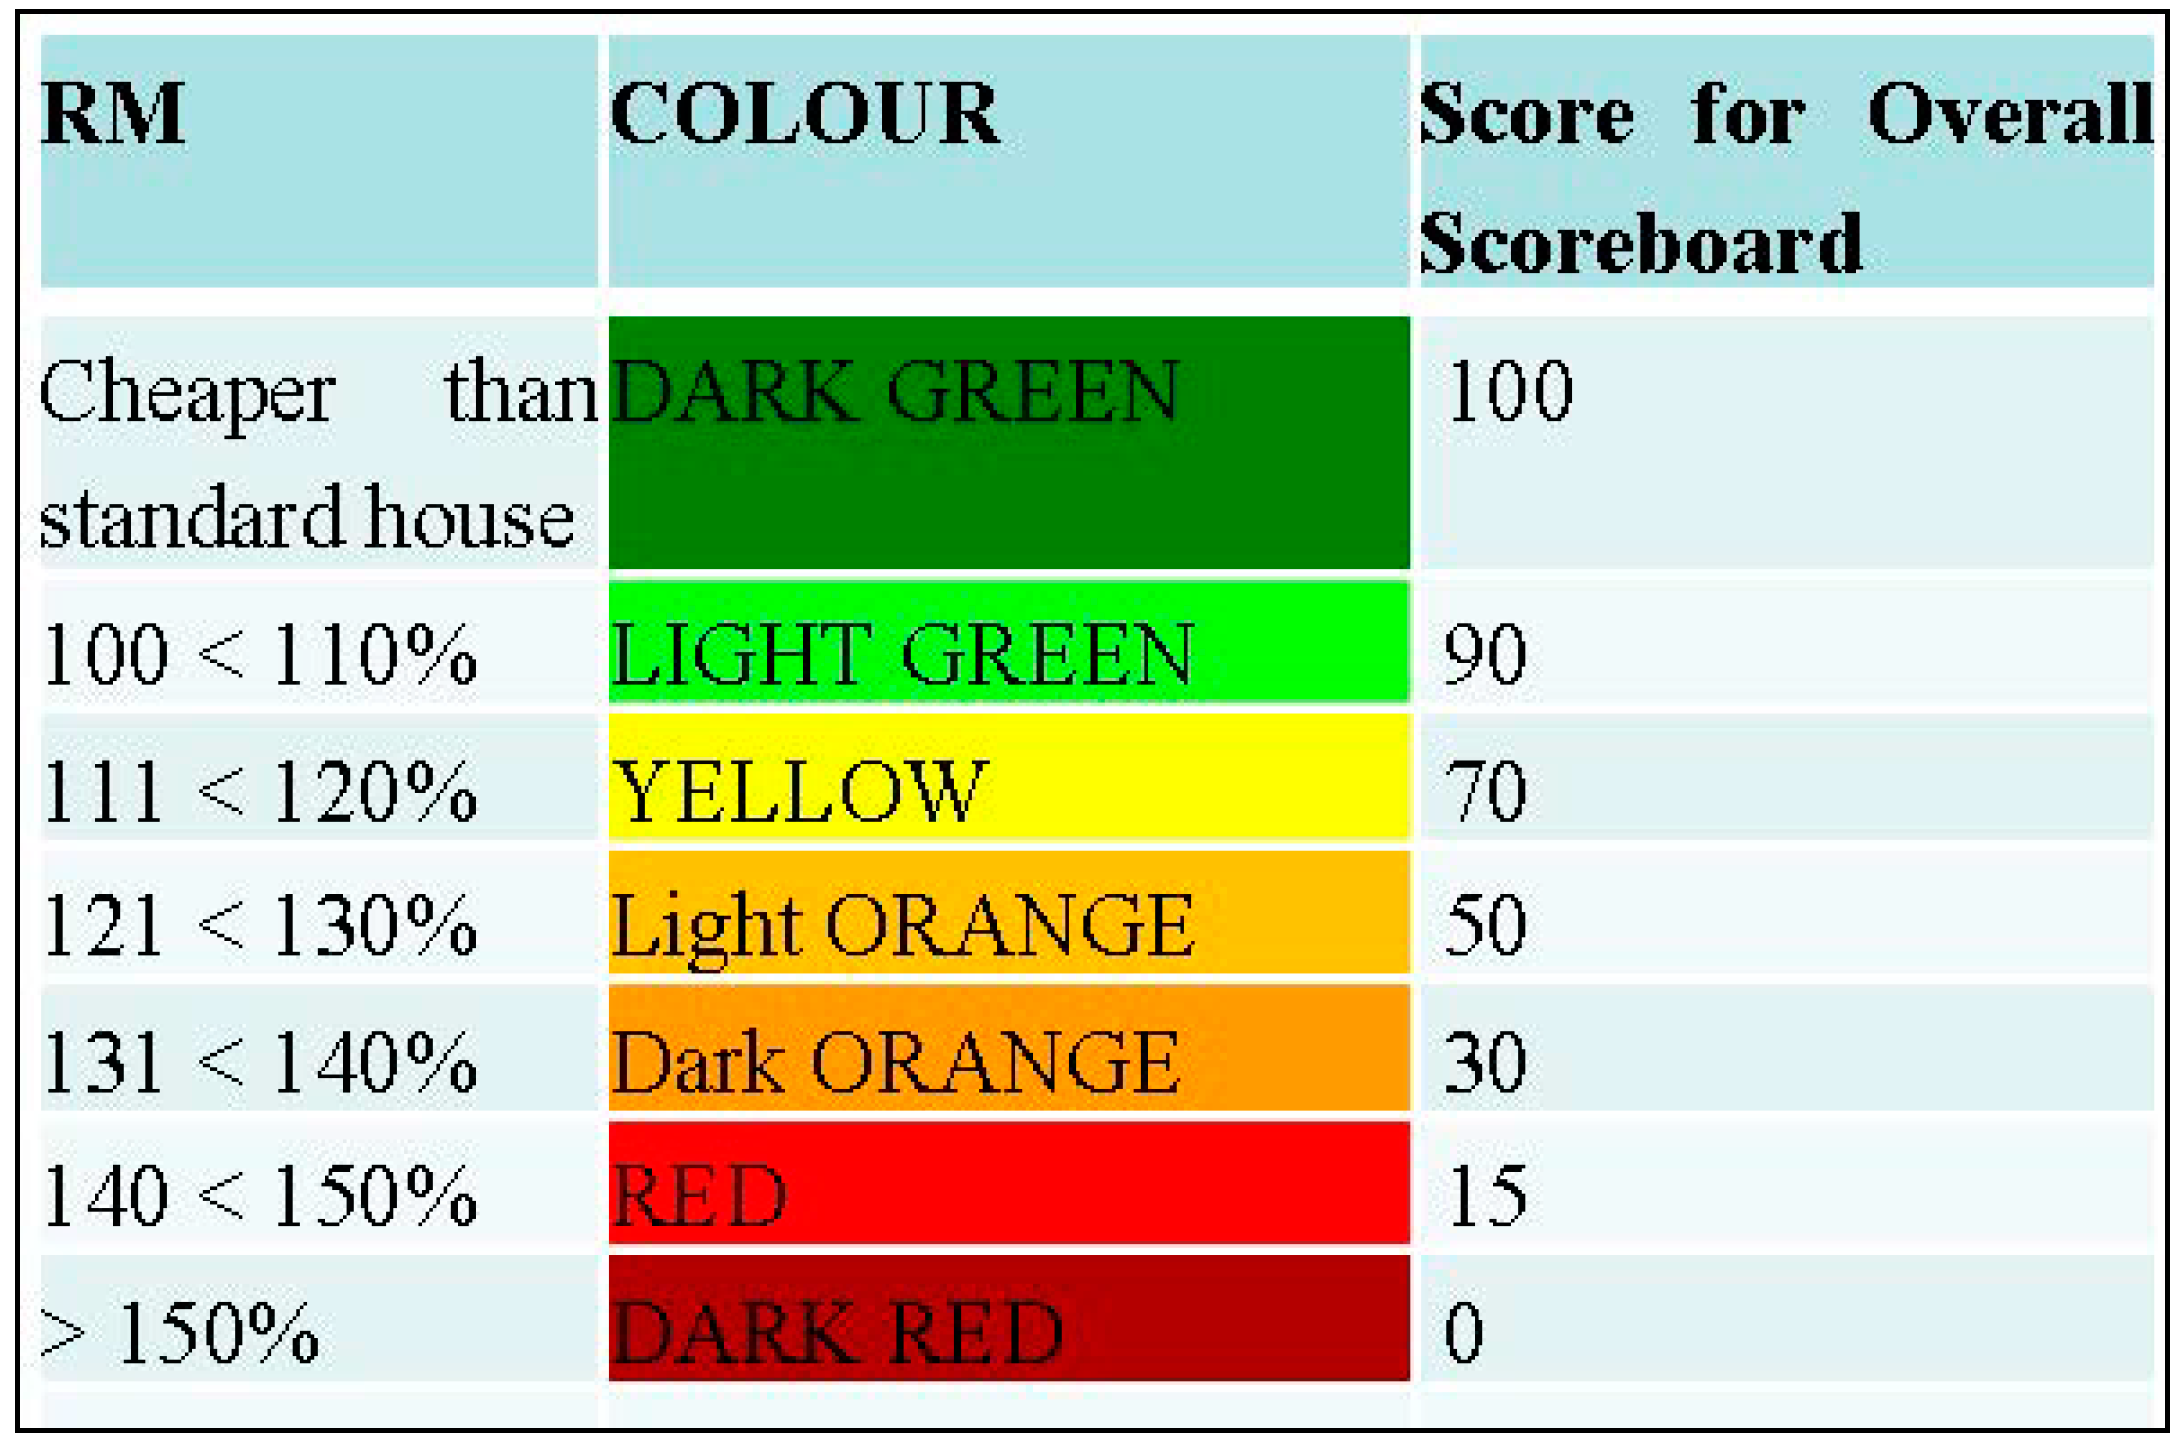
The last variable is dedicated to answering the question of the 3rd angle of the magic triple green triangle: Who can afford our green and energy efficient building? Whereas the other three criteria above tend to refer more to static measurement methods, the standards of cost considerations must be adapted, because the individual household’s purchasing power via monthly cash flow p.m. is considered along the rainbow colours. Hence, this is a vital subjective question, as it is widely perceived that green buildings are necessarily quite expensive and therefore a NO-GO for mid- and low-income households. Therefore, those who know and would appreciate acquiring a greener home keep believing that they are not able to purchase a new unit. Those who are already inhabitants refrain from retrofitting their existing one due to cost considerations.
For new buildings we can state that by following the European principle a passive house (as the most radical version of the green and energy efficient building) may not exceed 110% of the investment costs of a conventional red building. Due to cost savings from the first moment the building is in operation, reasonable pay-back periods of 1–5 years can be expected [
28]. In terms of the following scale echoing the values for a new residential building, this is still considered light green.
Figure 9.
Exemplified red–green TEPC-scale in terms of affordability (new buildings). [
14].
Figure 9.
Exemplified red–green TEPC-scale in terms of affordability (new buildings). [
14].
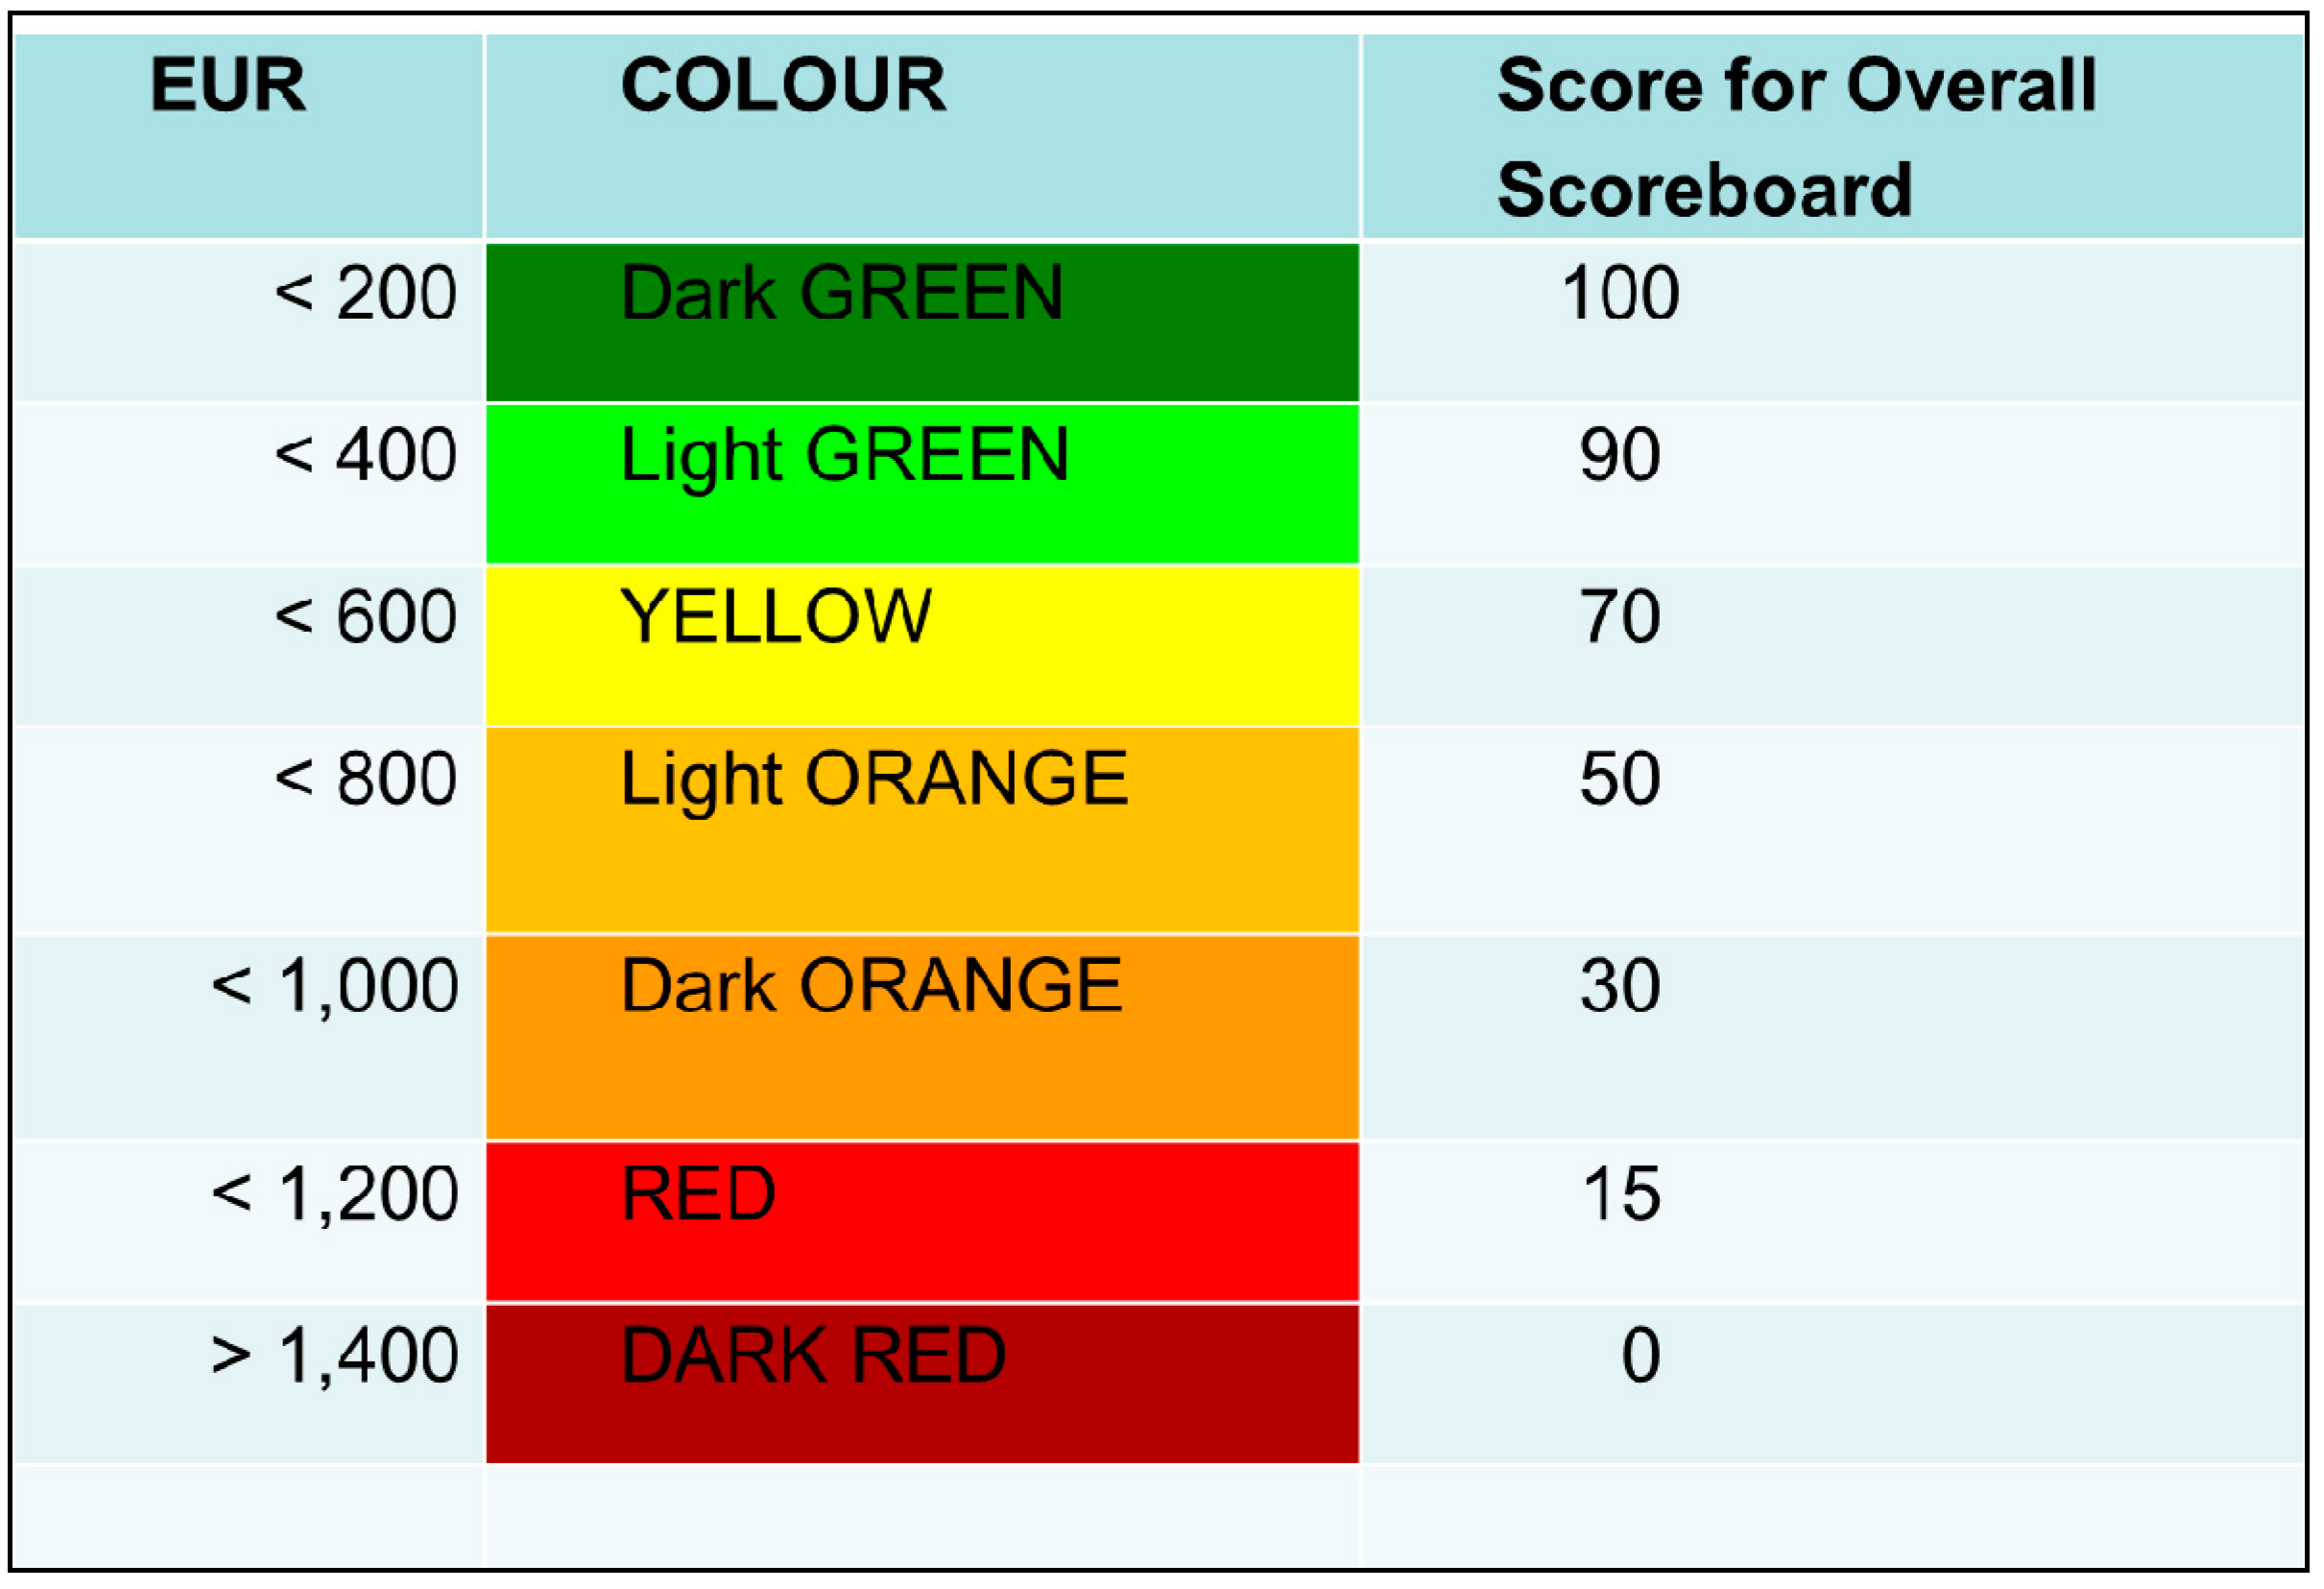
The case of an existing standard residential building to be retrofitted is even a more subjective question and answer. Whether it can be greened like in the case of the reference buildings with an additional investment of less than 200 EUR and the possibility to break even after a maximum 5 years, it might be “green” or “red”. This will mainly depend on three parameters: (a) the household’s income; (b) the monthly cash flow and, first and foremost; (c) the readiness to invest in green. Furthermore, one caveat and prerequisite is that the building does a “smart” job. That means green cooling plus building automation can adjust the desired temperature according to the occupant’s wishes at heat peak hours, and react flexibly due to the building frame’s ability to serve for already much colder temperatures compared to a standard building (elaborated above under pillar 2—electricity consumption).
Hence, the following scorecard is more subjective and situational. It presumes that this mid-class household in a developing tropical country has a monthly cash flow of 600 EUR. Therefore, it could easily digest green retrofitting expenditures of 12 times 200 EUR p.a. and would still have another 100 EUR for other cost positions. That would mean that 200 EUR could easily be absorbed, and up to 400 EUR are still at “light-green” status if the household is ready to invest in green, as elaborated further on in
Figure 10.
Figure 10.
Exemplified red–green TEPC-scale in terms of affordability (existing buildings) [
14].
Figure 10.
Exemplified red–green TEPC-scale in terms of affordability (existing buildings) [
14].
In the dark red end of the spectrum, this exemplified scale is left open on purpose with an amount of “above 1400 EUR” which might be quite hard to invest for a middle class income household. Of course, the “below 200 EUR” rule for dark green needs to be adapted not only towards the financial capacities of the occupants which are usually the owners, but also towards the size of the building.
Both scales (new and retrofitting) can now be compared with the payback periods of the necessary green investments. The ROI-calculation will be made due to lower operational costs in terms of energy consumption.
4. Case Study
Within the limited scope of this paper and with the infancy of the TEPC, it is not yet possible to demonstrate the practical value of the TEPC through a significant number of cases. Among those that had been scrutinised by the author in detail are three out of the four common tropical residential houses,
i.e., bungalow, terrace house, village house and high rise apartment [
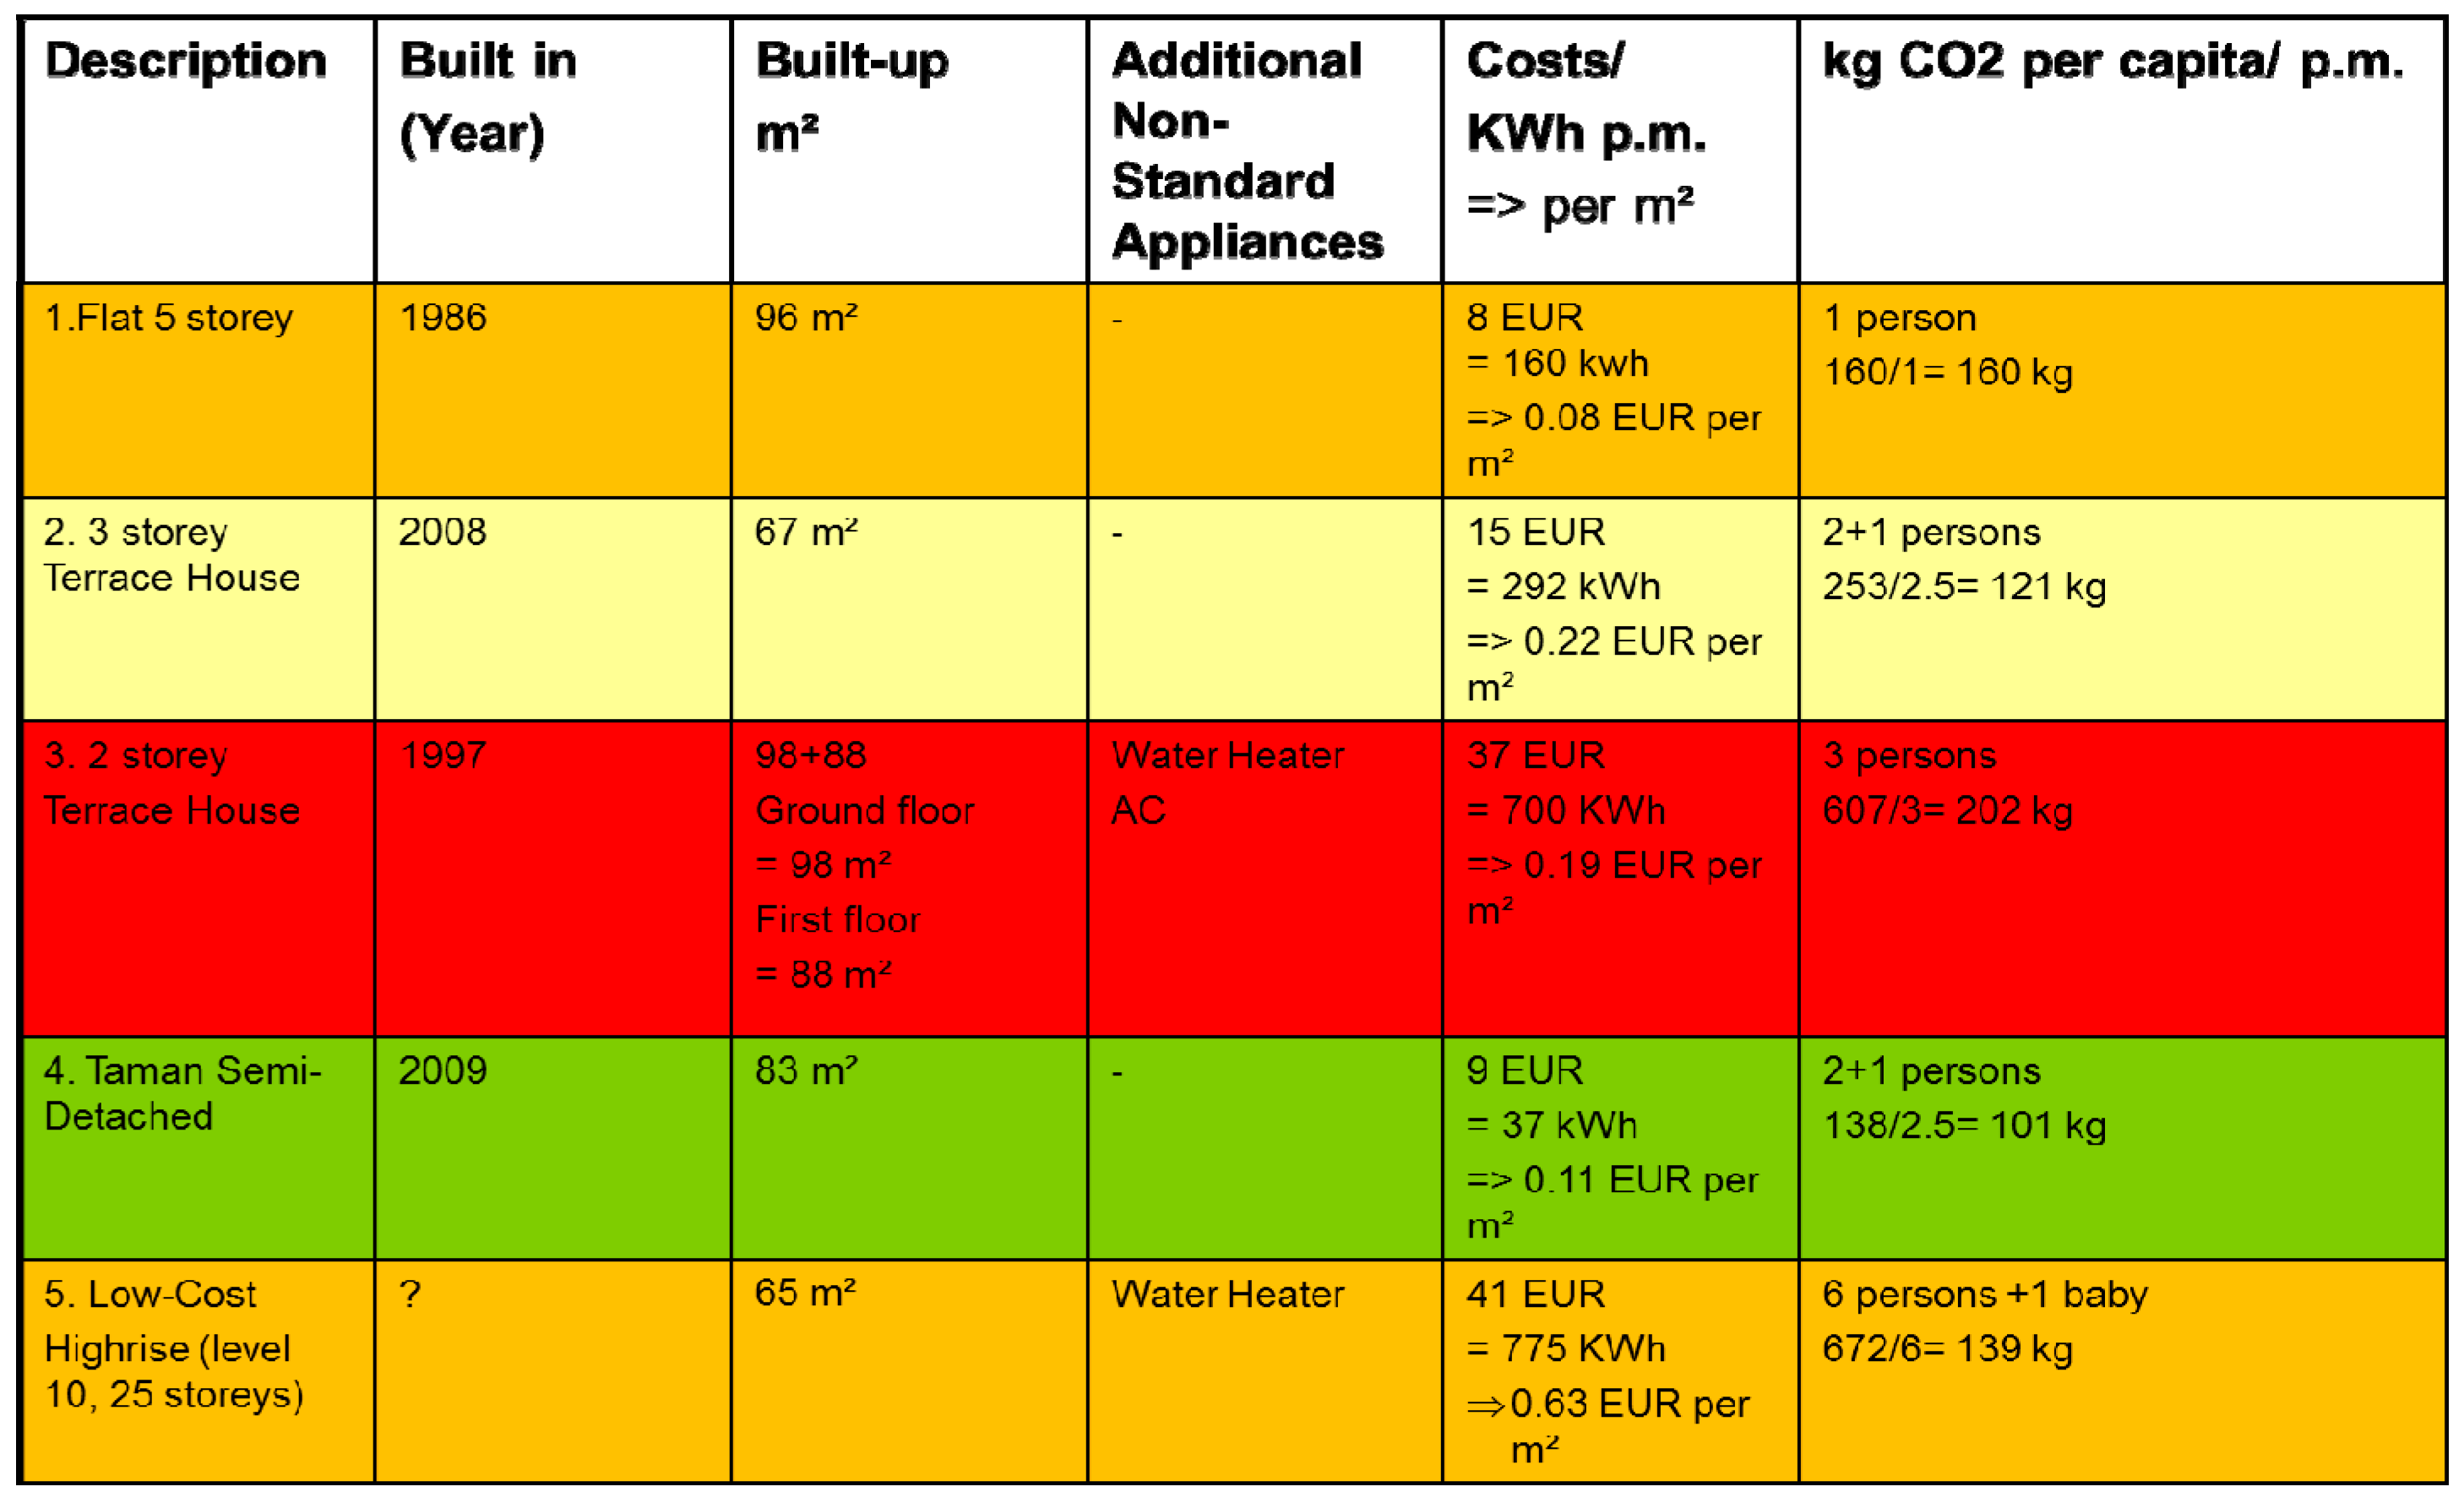
15]. In order to illuminate the applicability of the TEPC, prior to generic research the five examples in
Figure 7 above for retrofitting have been referred to for the criterion CO2consumptiononly. Out of these, due to the limited space, only case 3 as a terrace house has been chosen to demonstrate how the tool works and to demonstrate the operability of the TEPC for a tropical house (
Figure 11 and
Figure 12).
Typical Terrace House Center (Kuala Lumpur Area (built 1997)
Size: Ground floor = 98 m2, first floor = 88 m2 (cooling load 558 m3), Car park area = 56 m2
Location: Suburban area (not affected by city heat stack effect) with evening temperatures at peak heat days reaching tropical thermal comfort level at sunny/cloudy conditions between 8 and 12 p.m.
Occupants: 5 Adults
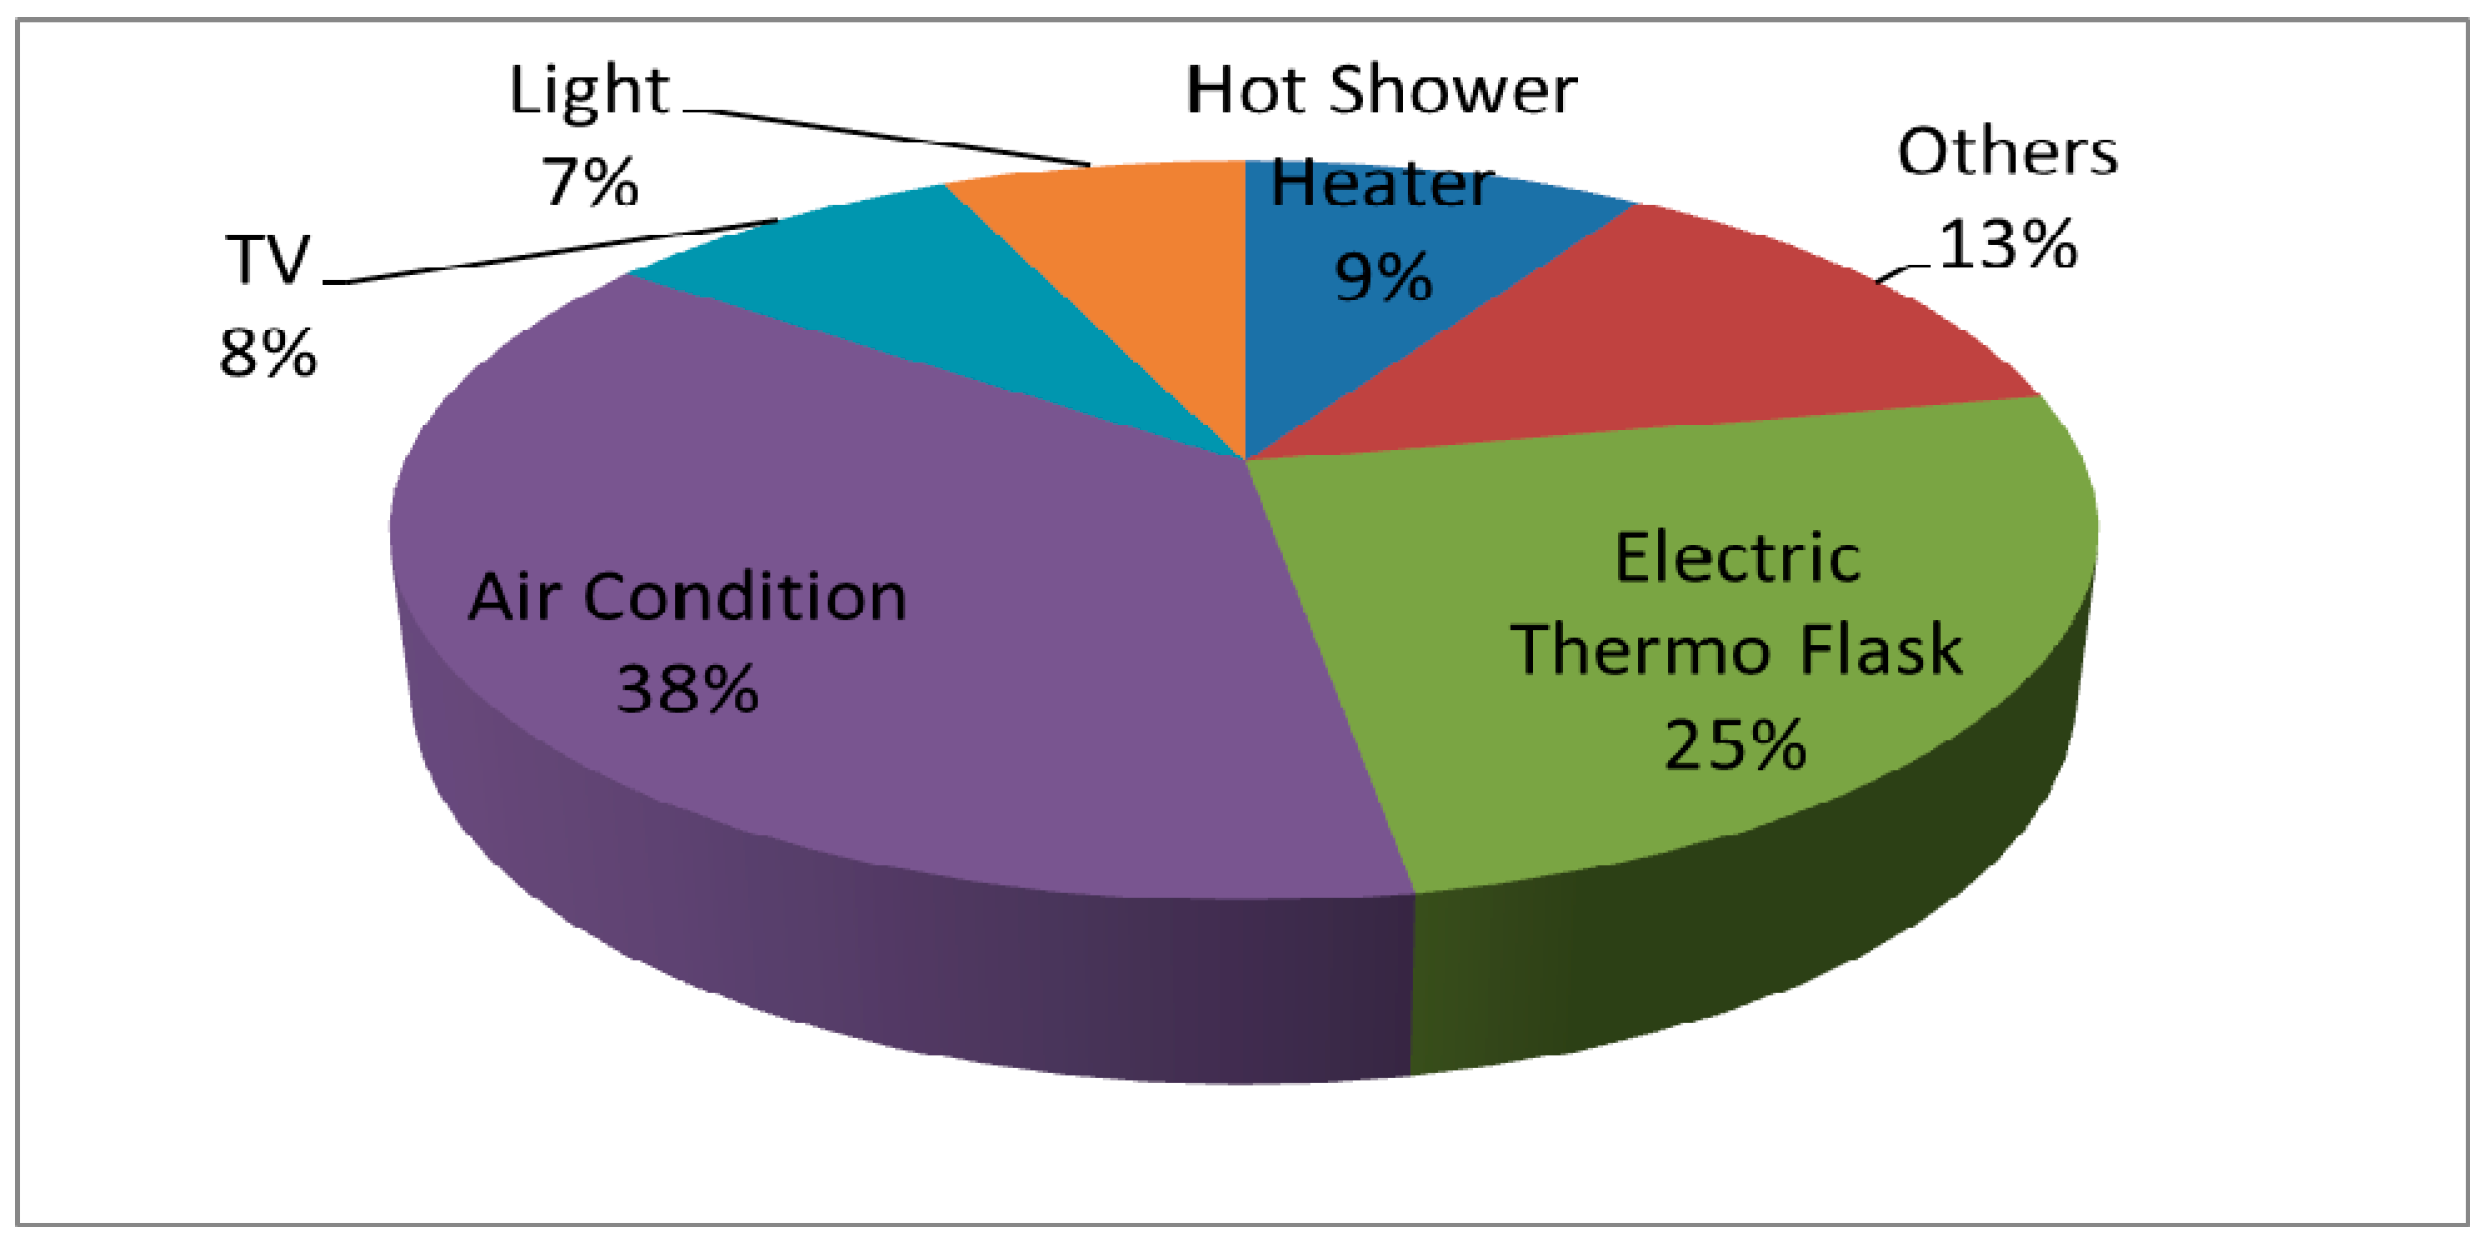
The average electricity consumption p.m. is about 700 kWh = 46$ per month. The following appliances are in use (one common air conditioner used 8 h usually during nighttime)
Figure 11.
Energy consumption of terrace house Kuala Lumpur [
14].
Figure 11.
Energy consumption of terrace house Kuala Lumpur [
14].
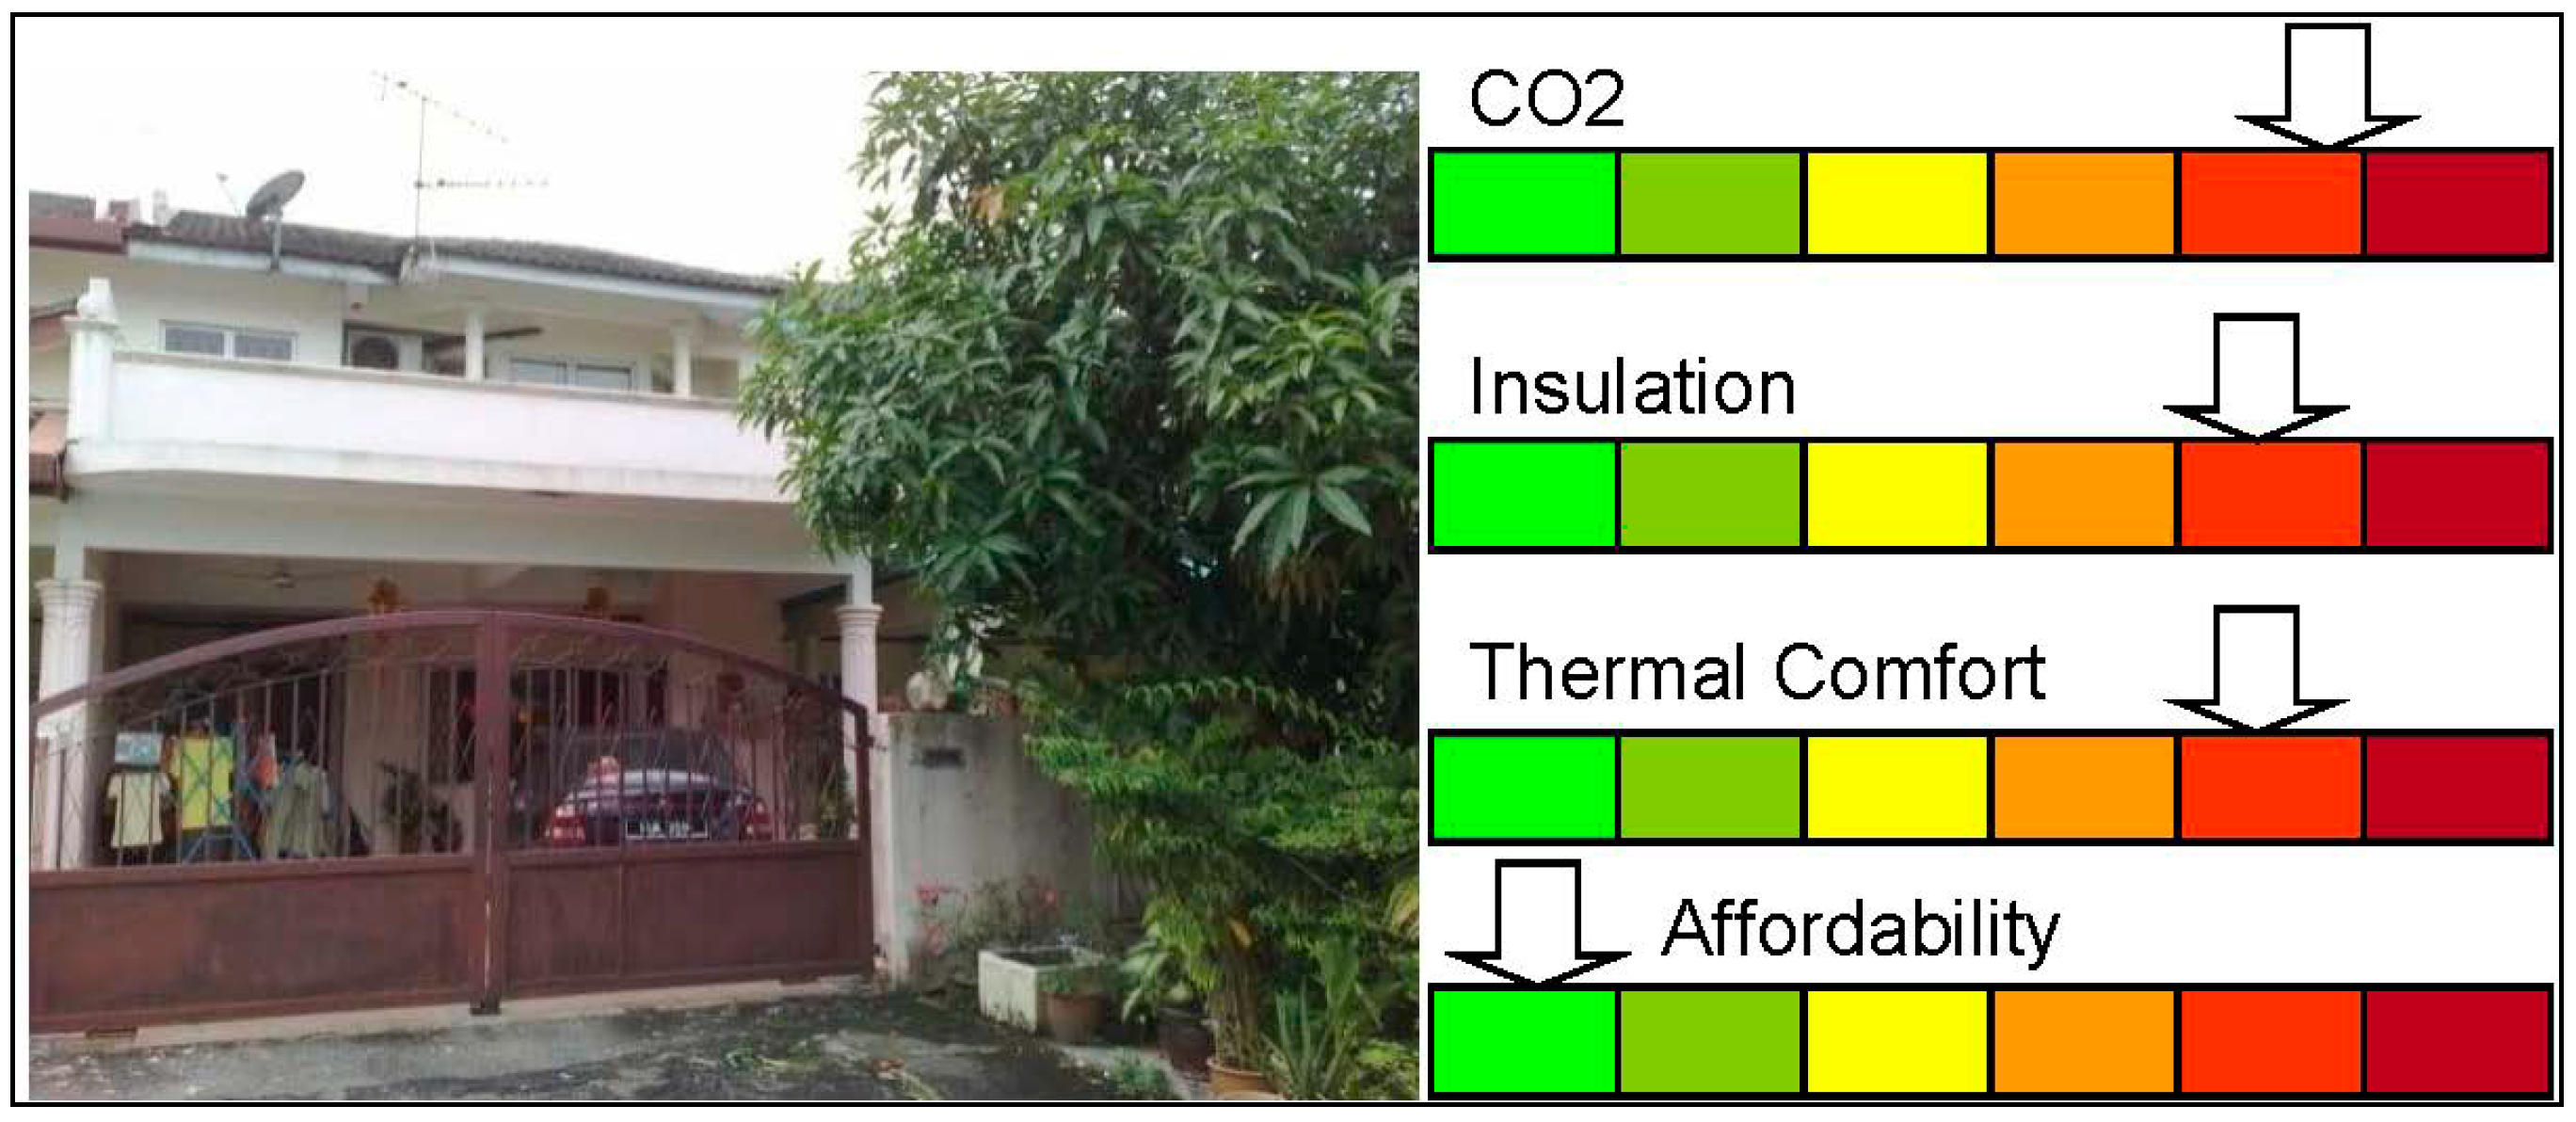
Figure 12.
Case study oftypical terrace house center (Kuala Lumpur) area (1997) and applied TEPC) [
14].
Figure 12.
Case study oftypical terrace house center (Kuala Lumpur) area (1997) and applied TEPC) [
14].
As indicated by the arrows in
Figure 8, the TEPC will yield the following results:
- (1)
CO2 = Due to the air conditioner and the all-time stand-by thermo flask, the electricity consumption can be classified as red.
- (2)
Building envelope’s radiant temperature average (measured as proposed above at overcast stable weather heat peak hours at 4.30 p.m.): 32 °C = red.
- (3)
Thermal comfort.
At the same peak hour around 4.30 p.m., the thermo-logger yielded 31 °C = red. However, the lowest temperature during the nighttime is 23 °C = blue (night time average temperature sleeping room at the same day with air conditioning unit)
- (4)
Affordability = green:
In order to bring items 2 and 3 into the green zone, the following investments can be proposed:
- (1)
Air conditioning unit in three sleeping rooms to be fitted with interrupter, auto-switch into cross-ventilation mode. Lighting can be replaced with low-energy or LED-tubes r bulbs) (300 EUR).
- (2)
Insulation of the roof (3000 EUR).
- (3)
Add on insulation foldable wood-wool shutters to all eight windows (100 EUR × 8 = 800 EUR).
- (4)
Insulation of walls and doors (6000 EUR)
As the cash flow of this family with three adults working equals 900 EUR per month, this expenditure can be considered as affordable green.
As a conclusion, even though this building is in RED areas in terms of CO2 emission, insulation and thermal comfort if no air conditioning is used, it has very high potential compared to other case studies. The total family income and the monthly cash flow are considerably high. Hence, the chances to green this building are equally high if the occupant (who is also the landlord) creates awareness and applies the EPC to guide the family.
5. Conclusions and Outlook
In order to assist tropical countries to reduce their CO2 emissions, the TEPC can play a role as it h continually done in some European counties and a growing number of other countries. It can become a widely popular tool as it contains not only an awareness model for thermal comfort, but also a clear, affordable business model for landlords and even tenants. Research in mock-up buildings, simulations and negotiations with internationally operating certification bodies like the TÜV or the Green Mark® tool will demonstrate in the near future whether the approach is viable for developing countries in the tropical and subtropical belt. However, these are potential impasses we may have to face.
- ❖
Lack of reliable research data. So far, we only can rely on selected case studies rather than on a multiple of generic cases to green tropical sustainable and energy-efficient buildings.
- ❖
Availability of system knowledge (playing together as a “green orchestra”): the TEPC has yet to explore the idea of looking at the building from a holistic perspective (especially the backlog in terms of factoring in life cycle analysis and humidity issues).
- ❖
Transparency of professional research-based benefits (Return of Investment -ROI). (Reliable data have not yet been generated to forecast the monthly saving on the part of the electricity bill to establish impetus to green a building further.
- ❖
Availability of resources: A visit to green expos shows that both knowledge and tropical greening tools are available. Nevertheless, the market is not transparent when it comes down to sourcing green suppliers that can provide solutions.
- ❖
No financial incentives (to create market value like with some European energy regulations). Success will be achievable only if policy makers take the first step by the timely and staggered introduction of energy regulations to enforce green strategies via the TEPC.
- ❖
Mindset of owners and tenants (short-term thinking and other priorities—Demand Preference Structure (DPS)). Of course, the greatest challenge of all is to create a change of mindset within the population. Beyond academia, this can only be achieved with a generic roll-out plan compiled by a committed team spearheaded by a highly effective business organisation.
- ❖
The extension to humidity measurement, along with other potential effectors, e.g., life cycle analysis, waste reduction, recycling green building materials, utilisation of renewable green energy or other indicators is possible. However, there is a danger that it could overrule and even undermine the tool’s Unique Selling Proposition (USP) of the TEPC compared to more promising, but at the same time, much more expensive indices available on the green building market.


