4.1. Evaluation of the Current Situation
We have mined the UNFAO data for different product categories, including vegetal foods, meat, milk, eggs, crop-fiber, wood, paper and wood-fiber and estimated the total NPP demand expressed in million metric tons of carbon (MTC) for five different time periods between 1995 and 2007 (
Table 2). Except for crop-fiber, which shows a substantial decrease from 1995 to 2007, NPP demand increased for all other food products. The largest relative increase was associated with milk, which almost doubled between 1995 and 2007, followed by meat and then vegetal food, which increased by about 27.30%. The increase in milk consumption is believed to be associated with extensive government efforts granted for the importation of improved breeds, the extension of breeding techniques and the fight against animal diseases, which have made the dairy products more readily available in Morocco [
18]. On the other hand, an improved standard of living in both urban and rural households promoted the consumption of dairy products during the period [
19]. Overall, the NPP demand for food products has increased by 6.17 MTC or 34.5% between 1995 and 2007, primarily reflecting a 16.5% increase in population (
Table 2) and an implicit improvement of living conditions in Morocco [
19].
Table 2.
Net primary production (NPP) demand (million metric tons of carbon (MTC)) and absolute and relative changes between 1995 and 2007.
Table 2.
Net primary production (NPP) demand (million metric tons of carbon (MTC)) and absolute and relative changes between 1995 and 2007.
| Population (million) | Vegetal | Eggs | Meat | Milk | Crop Fiber | Total Food Products | Wood | Paper | Wood Fiber | Total Wood Products | Total Appropriation |
|---|
| 1995 | 27.21 | 11.91 | 0.64 | 4.83 | 0.38 | 0.15 | 17.91 | 6.35 | 0.30 | 0.11 | 6.75 | 24.66 |
| 2000 | 29.14 | 13.10 | 0.77 | 5.74 | 0.51 | 0.11 | 20.24 | 4.46 | 0.34 | 0.08 | 4.87 | 25.11 |
| 2003 | 30.21 | 13.94 | 0.76 | 6.26 | 0.54 | 0.11 | 21.61 | 4.57 | 0.38 | 0.20 | 5.15 | 26.76 |
| 2005 | 30.93 | 14.54 | 0.63 | 7.10 | 0.60 | 0.005 | 22.88 | 6.18 | 0.44 | 0.11 | 6.73 | 29.61 |
| 2007 | 31.70 | 15.16 | 0.67 | 7.56 | 0.69 | 0.01 | 24.08 | 5.12 | 0.44 | 0.09 | 5.65 | 29.73 |
| Absolute change | 4.49 | 3.25 | 0.03 | 2.73 | 0.31 | −0.15 | 6.17 | −1.23 | 0.14 | −0.02 | −1.10 | 5.07 |
| Relative change (%) | 16.50 | 27.30 | 4.56 | 56.54 | 80.37 | −96.71 | 34.45 | −19.33 | 48.66 | −18.08 | −16.33 | 20.54 |
The NPP demand associated with wood has neatly decreased in 2000 and 2003 compared to the 1995. A subsequent increase has been observed in 2005 and is believed to be linked to the global recession at the start of the century and the consequent increase in fuel cost in Morocco during late 2002 [
20]. Overall, however, the NPP demand for wood consumption has decreased by 19.3% over the study period. Our analysis shows that NPP appropriation for paper has increased by 48.7% or about 0.14 MTC compared to 1995, corresponding to an increase in actual paper consumption of 0.4 kg per capita per year. This is an important rate of increase for a country with an annual average per capita consumption of 13.16 kg, an increasing rate of use of electronic media [
21] and an increase in the recycling rate [
22]. However, it is not an alarming rate considering neighboring industrialized countries, such as Spain, which consumes about 150 kg per capita per year, and a developing country, such as Tunisia, with a yearly per capita consumption of 35 kg [
23]. The constant appropriation of paper between 2005 and 2007 is probably a reflection of the recycling program introduced in 2005 [
22]. The NPP demand for wood-fiber is small and indicates a decrease of about 18.1% over the period of analysis. Overall, the appropriation of total wood products (wood, paper and wood-fiber) shows substantial interannual variation around an average value of 5.83+/−0.88 MTC and a decrease of about 16.3% in 2007 compared to the 1995 baseline.
Based on our field survey, the urban population in Morocco
ca. 2010 represents only 55.9% of the total population, yet it appropriates a substantial fraction, nearly 70%, of the total NPP demand. Except for wood, the urban population has larger appropriation than the rural one for all other products. The consumption of wood in urban settings is mainly for use as fuel in the traditional public communal bathhouses ‘Hammams’, which are still in use in many modern cities of Morocco. At the country level, the total NPP demand for all products increased by about 5.1 MTC or 20.5% between 1995 and 2007 (
Table 2). The division of crop and wood fibers with equal weight between the urban and rural populations was assumed and not based on survey results, which were the basis for all other results. While this may affect the appropriation distribution between urban and rural populations, it does not affect the total appropriation from which the fiber represents only a small portion (~3%).
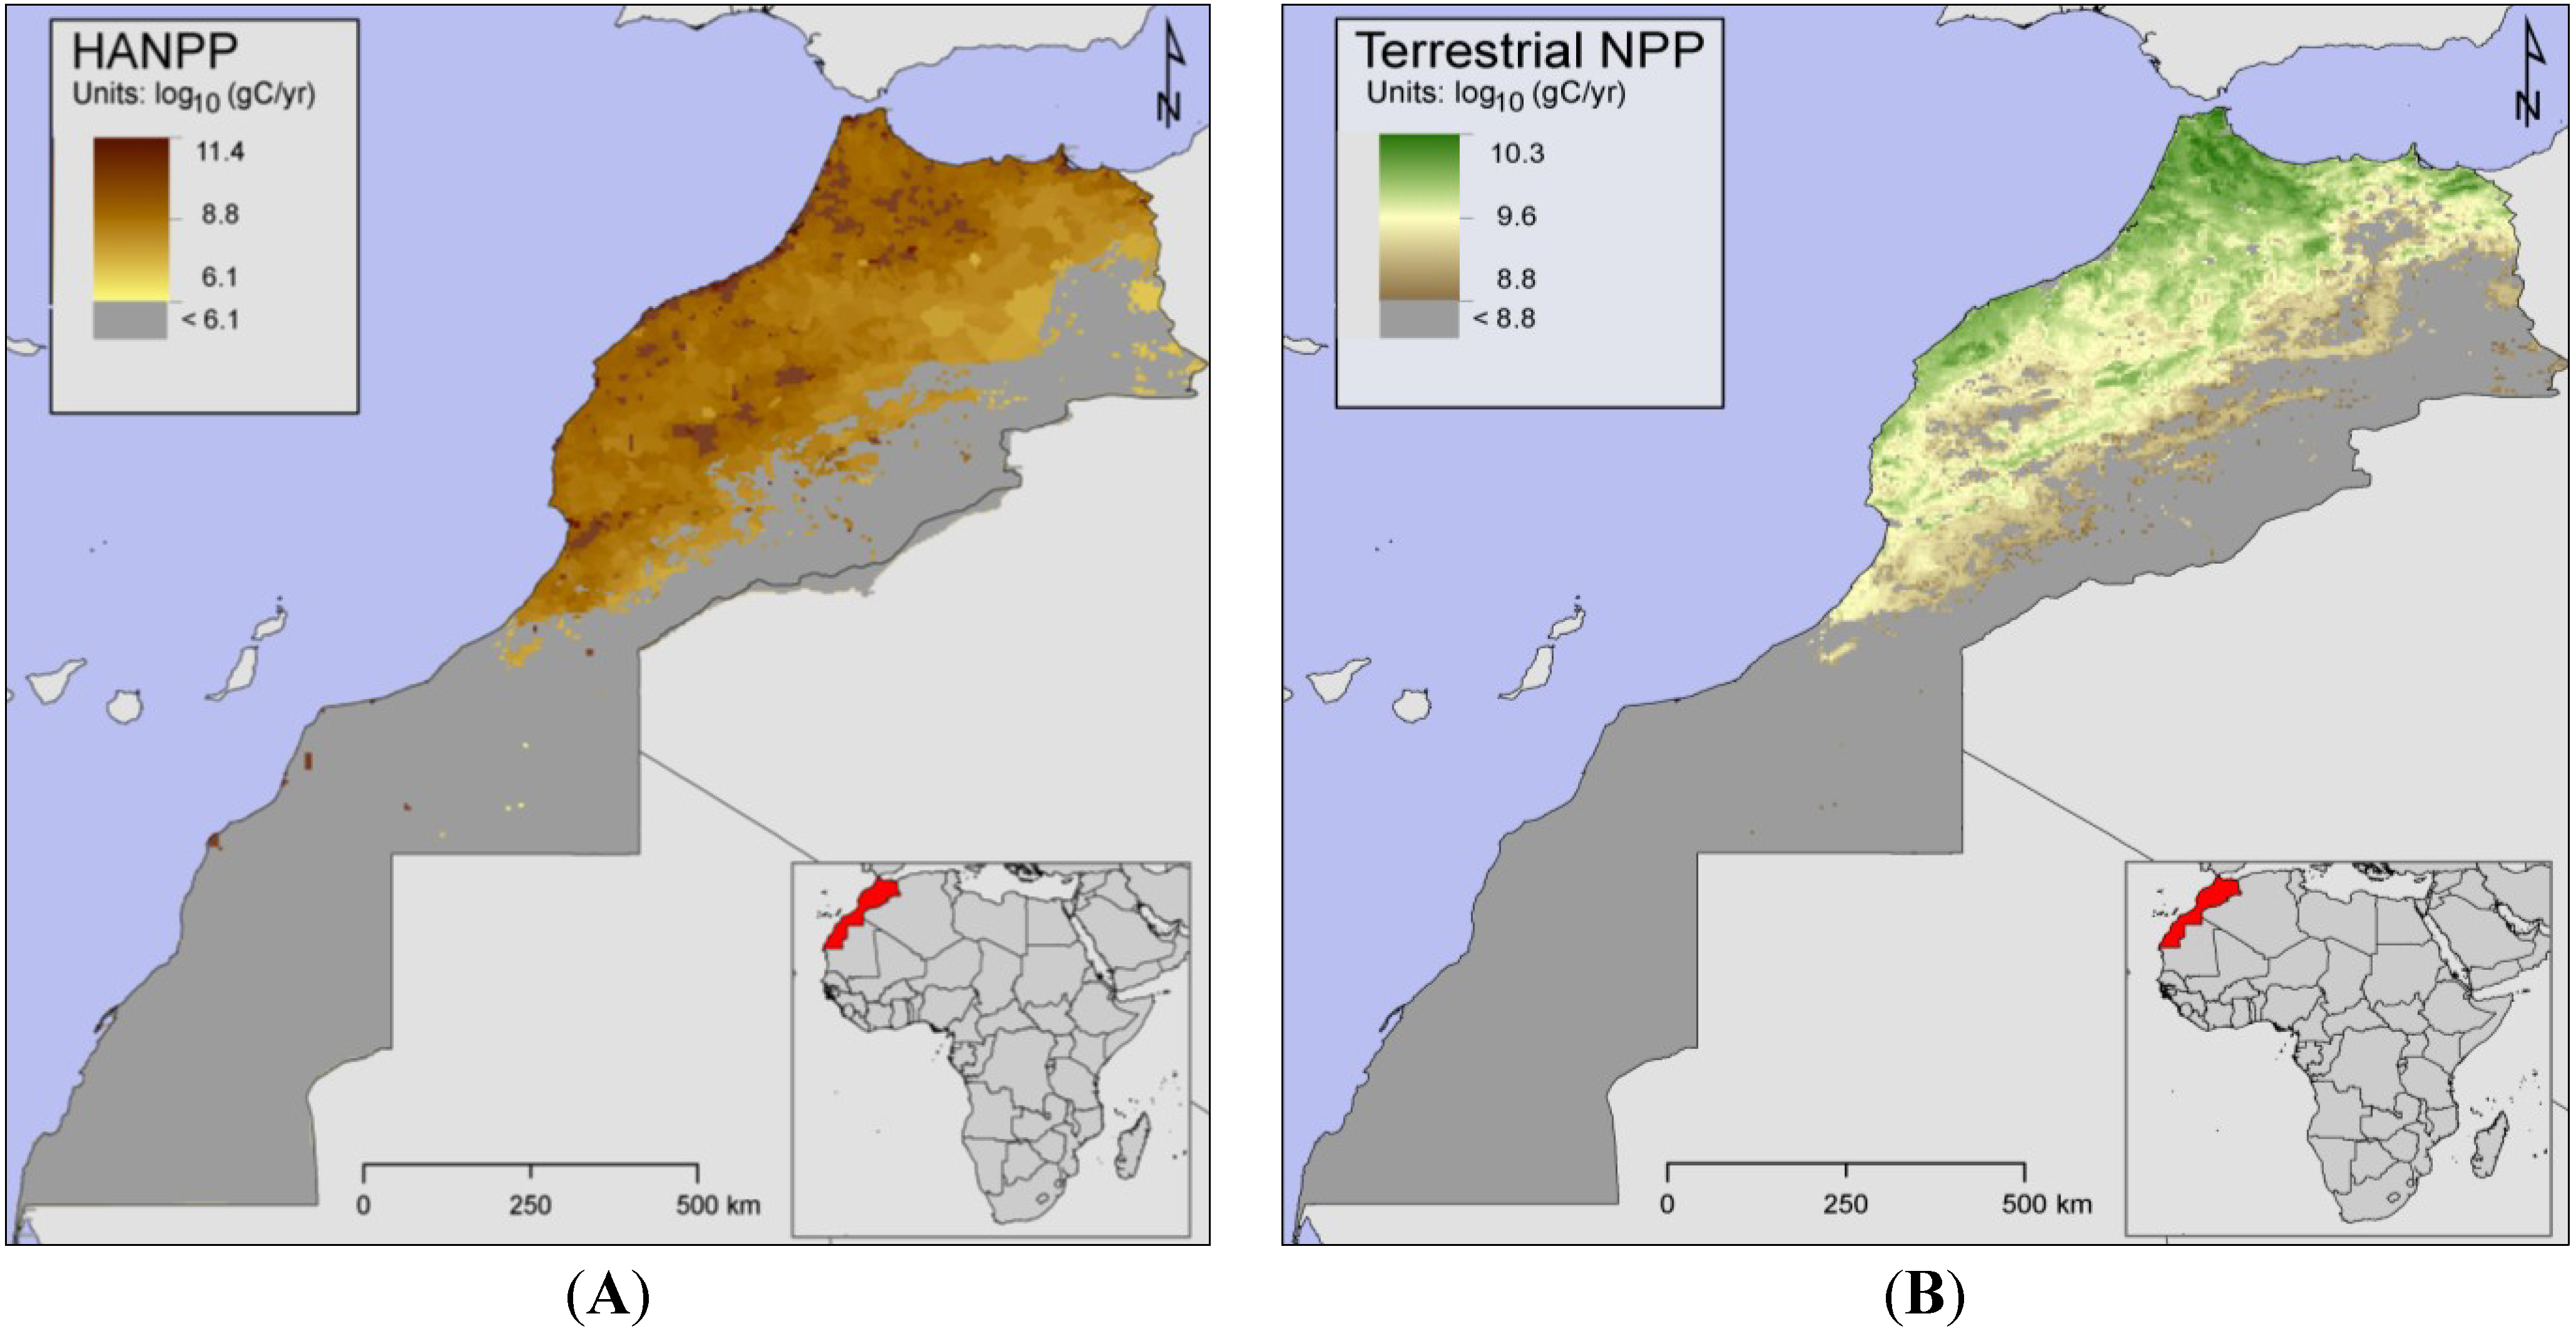
The distribution of the total NPP required for human appropriation (NPP demand), as well as the total NPP generated on the landscape (NPP supply) is shown in
Figure 1. We estimate the spatially integrated total annual amount of NPP demand required to support the Moroccan population to be 29.73 MTC in 2007 (
Figure 1A) when the total NPP produced and available on the landscape (supply) for the same year was 60.24 MTC (
Figure 1B). This NPP demand value is at the lower end of the range of regional estimates found in Imhoff and Bounoua [
10] and indicates that the population appropriated about 50% of the country’s natural NPP resources in 2007. As expected, and as reported in Imhoff and Bounoua [
10], the NPP appropriation is mostly centered on large populated urban centers.
Figure 1.
Distribution of annual total: (A) NPP demand for human appropriation (B) NPP supply (see the text for details).
Figure 1.
Distribution of annual total: (A) NPP demand for human appropriation (B) NPP supply (see the text for details).
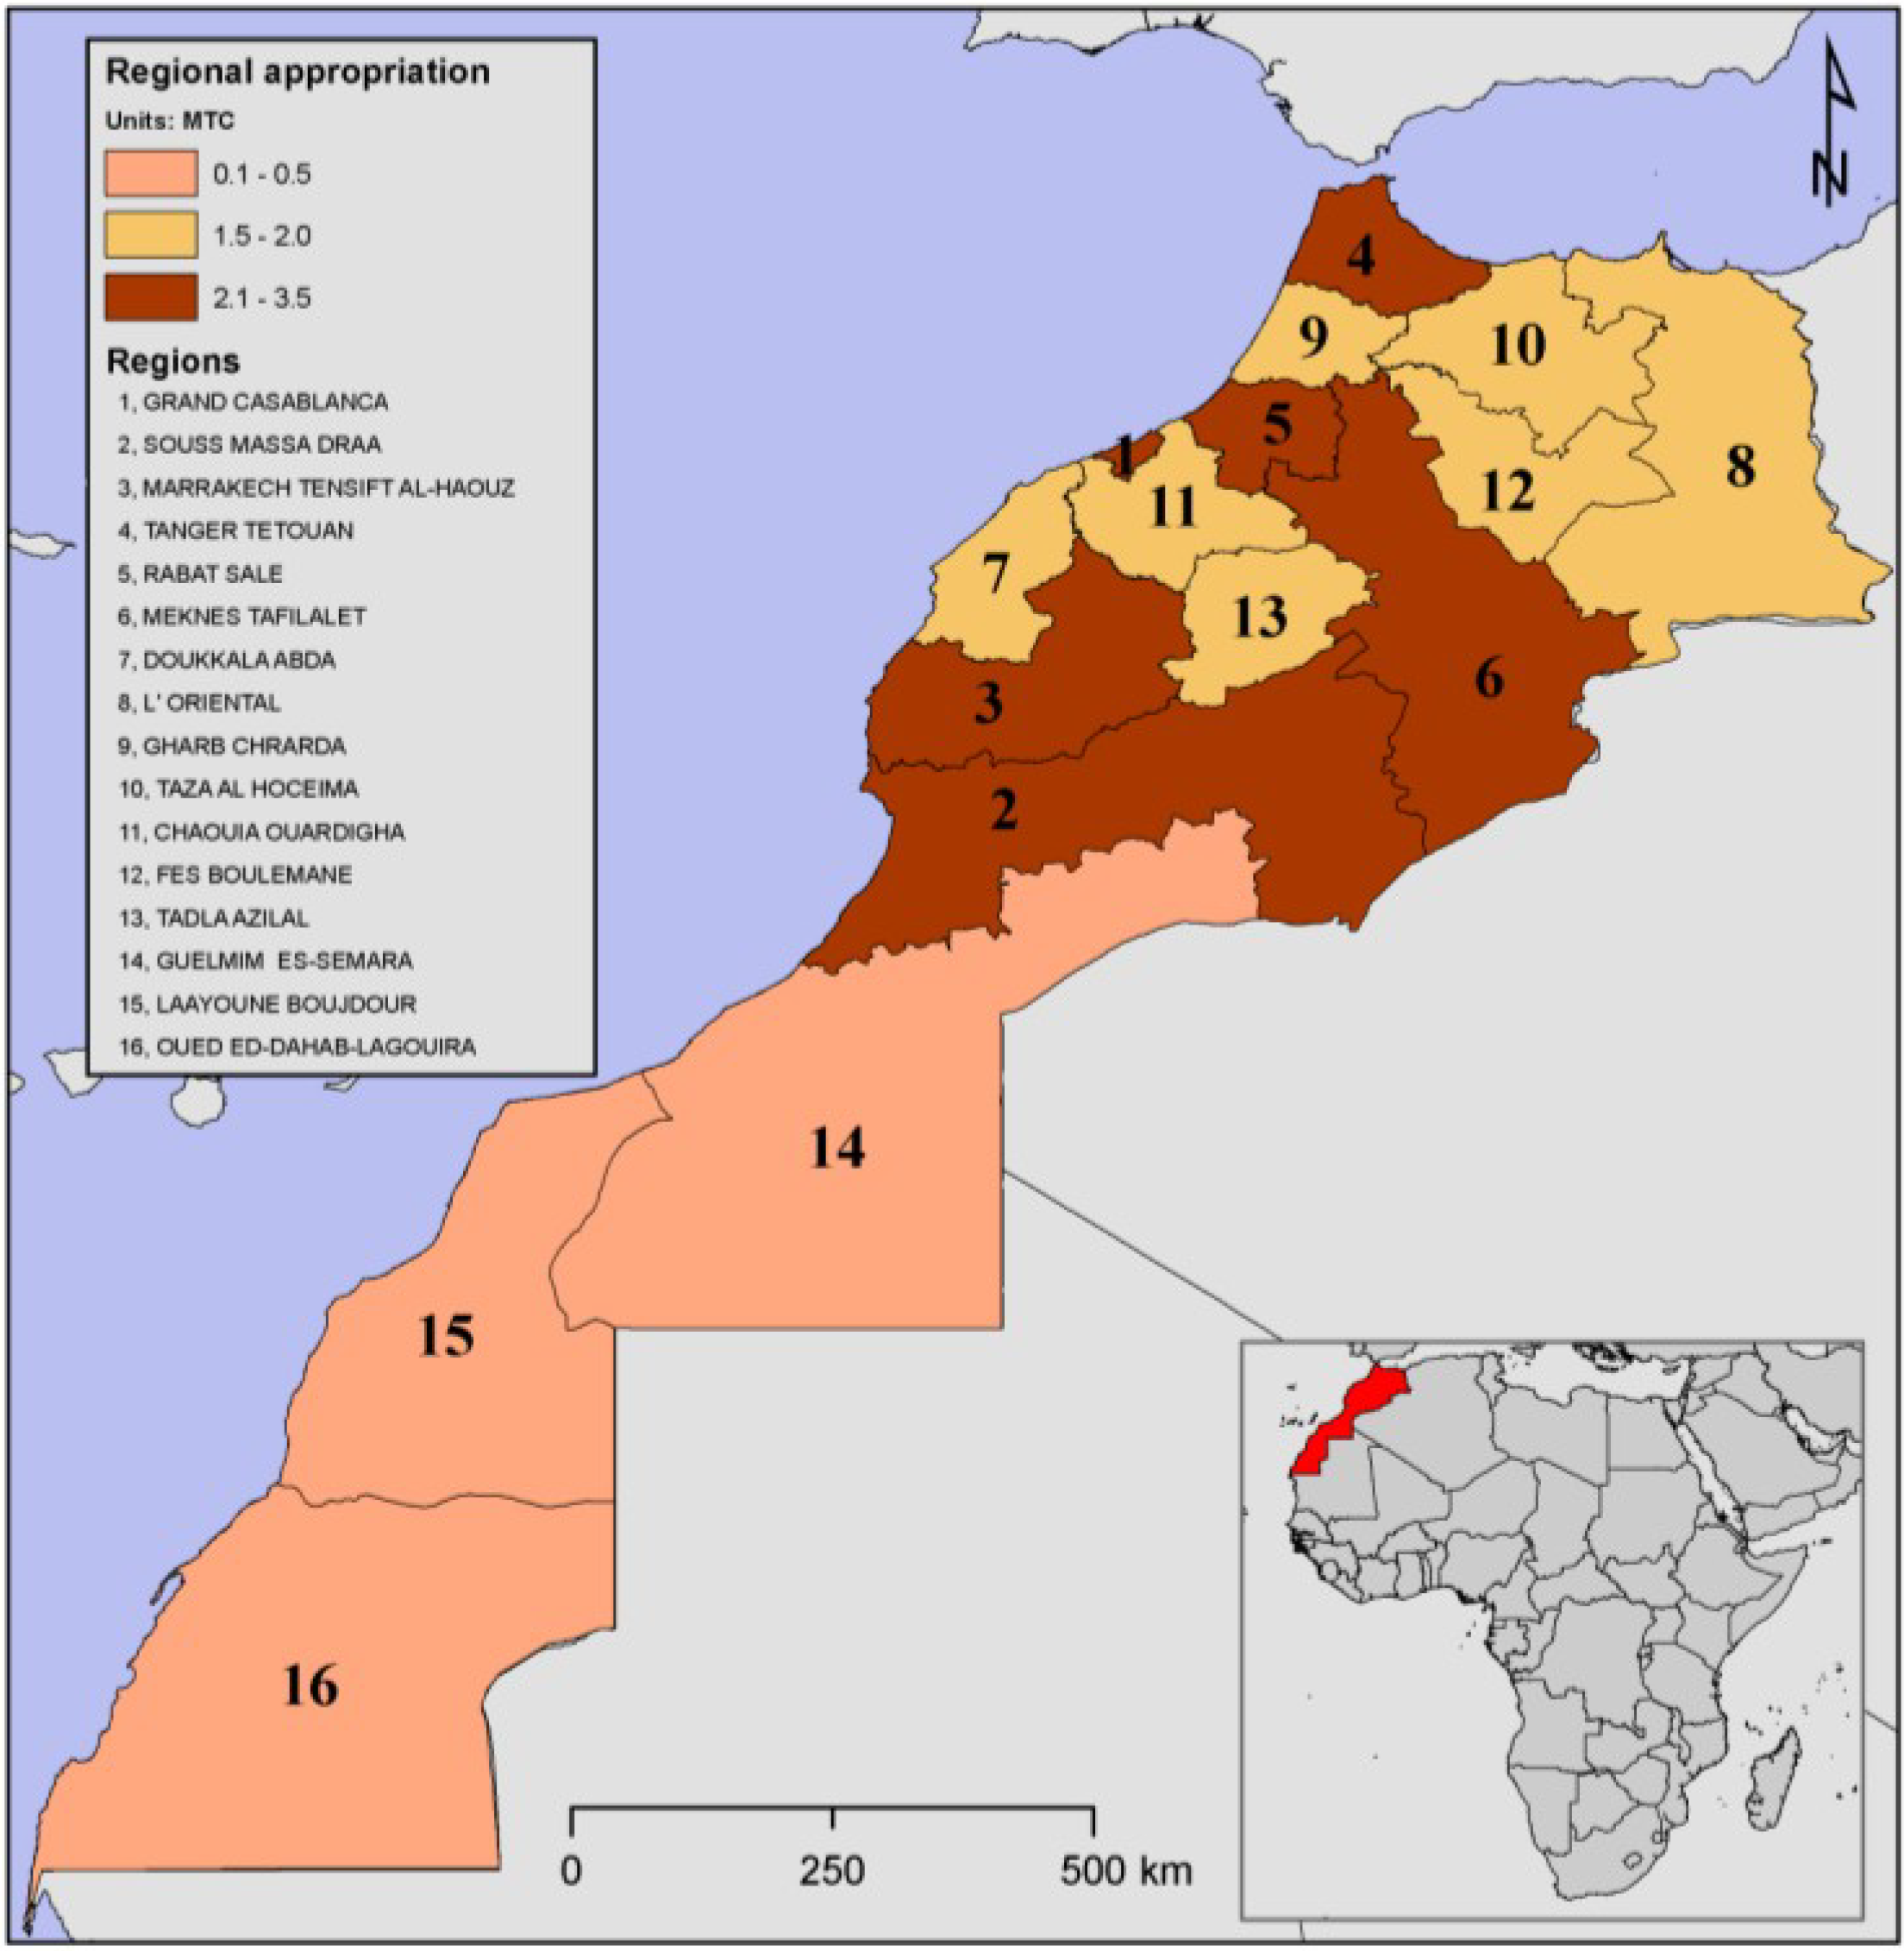
The distribution of the total NPP demand shows three broad groups of regions (
Figure 2). A group with an annual appropriation ranging from about 2.1–3.5 MTC, which includes large urban regions, such as the Grand Casablanca, Marrakech Al-Haouz, Tanger-Tetouan and the region of Meknes Tafilalet. A second group with appropriation ranging from 1.5–2.0 MTC includes other large agricultural regions, such as Doukkala, l’oriental, le gharb, Fez and Tadla-Azilal; and a third group with the smallest annual appropriation from 0.1–0.5 MTC, including the arid regions of Es-Semara, Laayoune and Oued Ed-Dahab.
Figure 2.
Regional distribution of total NPP demand in MTC for the year 2007.
Figure 2.
Regional distribution of total NPP demand in MTC for the year 2007.
In order to assess the vulnerability in food and wood products separately, we conducted a detailed analysis, whereby NPP demand for food products is compared directly to NPP supply generated on agricultural lands and the NPP demand for wood products is compared to NPP supply generated on forests and woodlands. For the computation of the NPP demand for food products, we separated the fraction of meat produced using pasture lands [
24,
25] and included only the component that used grain for feed, so that the total NPP demand for food products can be compared to the NPP generated from agricultural lands. Similarly, in the computation of the NPP supply for wood products, we partitioned the MODIS woody savannahs class into wooded and savannah components using fractions provided by [
26,
27] and included only the wooded part in the computation.
The NPP supplies from agricultural and wooded lands were estimated from satellite data and aggregated over the corresponding land cover classes. We considered food products to be supplied by classes labeled cropland and cropland/natural vegetation mosaic, including cereals in the MODIS classification scheme [
27], while the NPP for wood products is supplied by forests and other wooded classes. We have computed these requirements from 2000 to 2007, as the supply part from MODIS is only available starting in 2000 [
28].
Table 3 indicates that the NPP demand for food as a percent of the supply is more than 80% for all years, but does not exceed 100%, except for 2005, when it reached 103.7%. It is generally known that 2005 was a drought year over Morocco, and the national cereal production was reduced by about half [
29]. This is also captured in the MODIS data, which shows an average NPP value of about 22.73 MTC for 2000, 2003 and 2007 and a low value of only 19.50 MTC in 2005. Had 2005 been a normal year with an average supply value, the demand would have been only 89.0% of it. These results indicate that in Morocco, as of 2007, the NPP supply in all exploited agricultural lands is barely enough to balance the NPP demand for food consumption, including the imported component. This represents a high level of vulnerability and leads to the speculation that if population increases or climate conditions worsen, this balance may be altered in a way that makes the local population more food insecure, if no action is taken to mitigate or otherwise adapt to future conditions.
We also note that while the demand for wood products is continuously increasing over time, the supply in wood as reflected by the satellite record of total NPP in woodlands and forests remains insufficient to balance population demand. For the entire period, the ratio of the NPP demand to NPP supply exceeds 180% of the wooded ecosystems potential, suggesting that the population in Morocco appropriates in one year about twice as much wood products as the land can produce, indicating a high level of vulnerability. The absence of large stocks of wood product supplies in Morocco is compensated for by imports; a high cost to the economy and a remote ecological footprint.
Table 3.
Evolution of NPP for food and wood products demand and supply for 2000, 2003, 2005 and 2007 in MTC.
Table 3.
Evolution of NPP for food and wood products demand and supply for 2000, 2003, 2005 and 2007 in MTC.
| | 2000 | 2003 | 2005 | 2007 |
|---|
| Food | | | | |
| NPP demand | 18.08 | 19.26 | 20.22 | 21.24 |
| NPP supply | 22.23 | 23.79 | 19.50 | 22.17 |
| Demand/supply (%) | 81.31 | 80.98 | 103.68 | 95.83 |
| Wood | | | | |
| NPP demand | 4.88 | 5.16 | 6.74 | 5.65 |
| NPP supply | 2.67 | 2.51 | 2.27 | 2.95 |
| Demand/supply (%) | 182.44 | 205.72 | 297.07 | 191.54 |
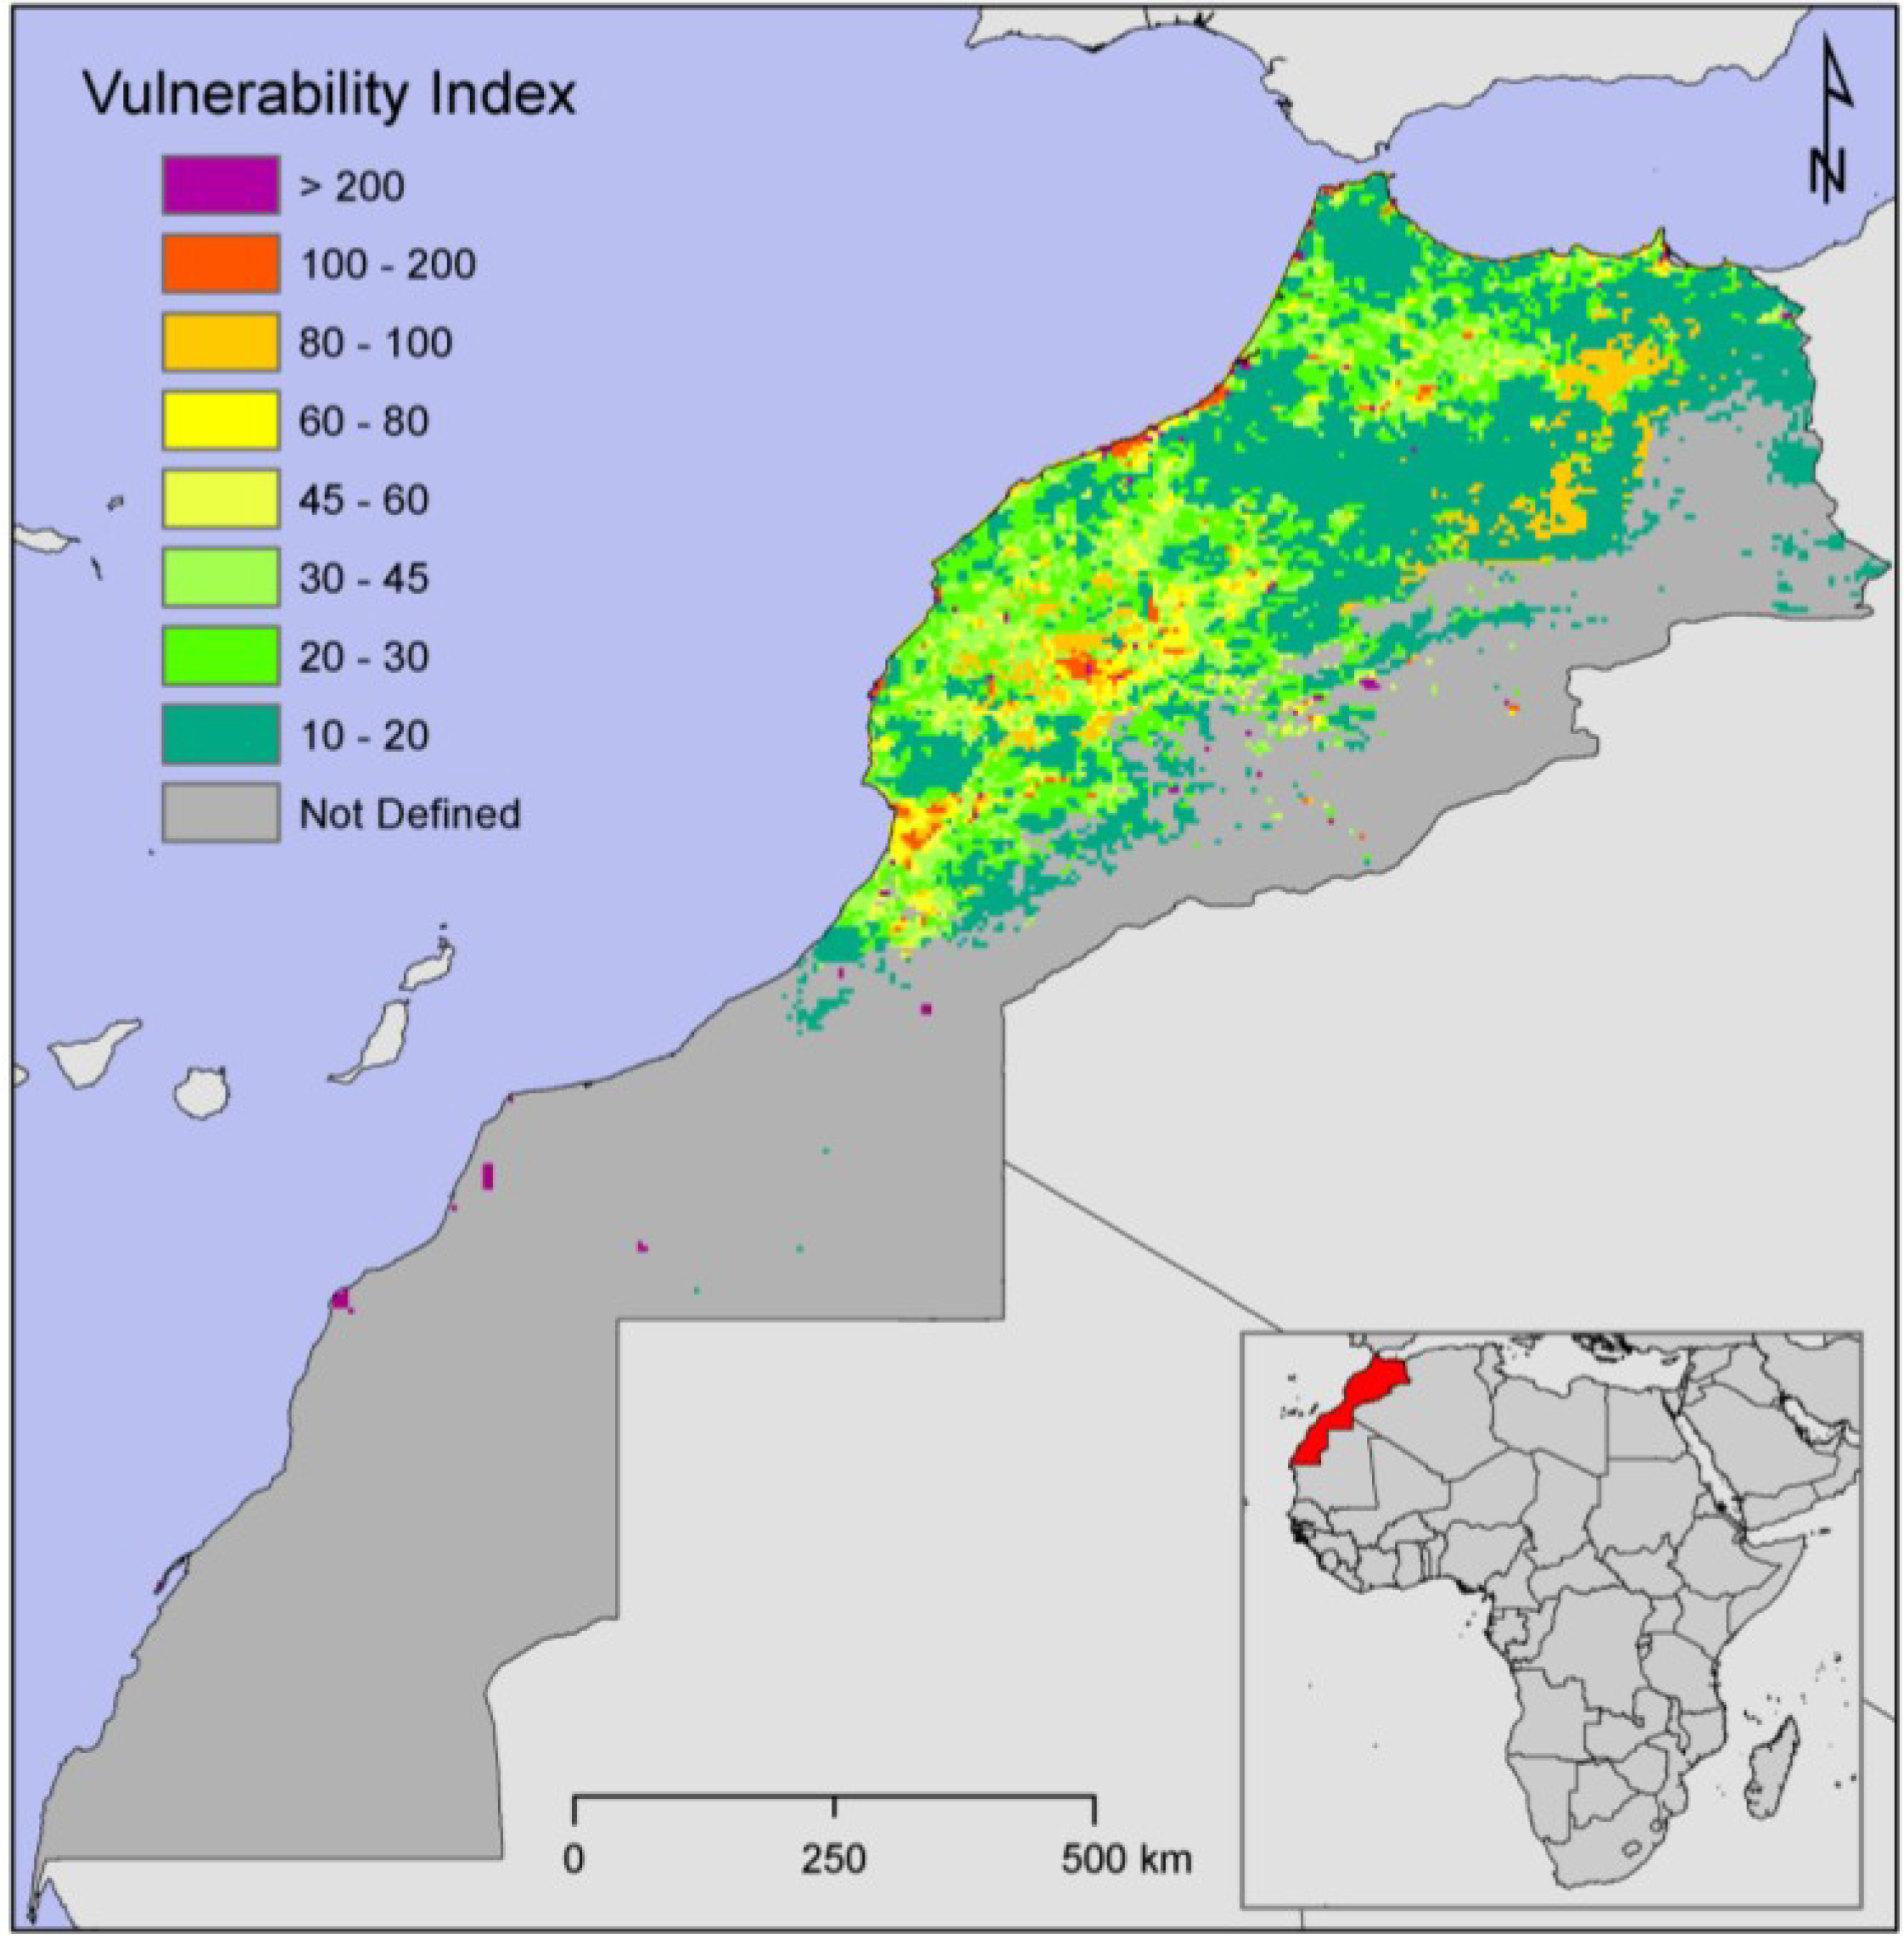
This annual amount of NPP demand was compared to a map of annual NPP supply to produce a spatially distributed vulnerability index over the entire country (
Figure 3). Results show large variations in VI across the country, reflecting the population distribution and land productivity. The largest indices are apparent over urban regions with large populations and where the productivity of the landscape, altered by urbanization, is low. The vulnerability index is from 100% to 200% in most urban areas and exceeds 200% in urban centers, suggesting an annual NPP demand much higher than what the local natural landscape can produce. Urban suburbs experience a VI from 45% to 80%, whereas in remote rural areas, the vulnerability index is less than 45%, partly due to higher land productivity and clement climate and partly to small and sparsely distributed rural populations. In the semi-arid regions south of the Atlas Mountain, where soils are poor and the climate is harsh, even a small appropriation led to large VI. In large cities, such as Es-Semara, Laayoune and Dakhla in the extreme south and Errachidia in the east with a high population count and low productivity, the vulnerability index is larger than 200%. In desert areas, where the gridded NPP supply is null and the population is small, VI is not defined.
These results are in line with those from Imhoff
et al. [
10], which show at a global scale a ratio of NPP demand to supply varying from nearly 0% in sparsely populated areas to over 30,000% in large urban agglomerations with low productivity. As seen in
Table 3, the vulnerability index is dominated by the appropriation for food and wood products and may increase, due to changes in forcing factors, such as over-exploitation of the landscape, increases in population or worsening of climate conditions, all of which are already happening in Morocco. Given this level of vulnerability, the country should renew its emphasis on shoring up its domestic food supply to avoid dependence on costly food imports and develop a national food security policy to improve the access for all its people and at all times to adequate food for a healthy and productive life through increases in production, productivity, and trade [
30].
Since the NPP demand depends on population size and distribution, technology and affluence, any change in these forcings will affect VI. Similarly, the VI will be affected by changes in the supply component through changes in climate signatures, such as temperature and precipitation, whether induced by interannual variations or long-term climate trends.
Increased pressure on agricultural production is likely to require an expansion in agricultural land use in an attempt to compensate for a decrease in production due to unfavorable climate change and to accommodate for a larger urban population. Some new land could be brought into cultivation, but the competition for land for other human activities makes this an increasingly unlikely and costly solution [
31]. This could be especially true in Morocco, where arable lands are confined to a relatively narrow region north of the Atlas Mountain, water is scarce, technological development is average and population growth not yet stabilized, leading, thus, to an increasingly growing demand for agricultural products.
Figure 3.
Vulnerability map (%) showing the ratio of NPP supply to demand at 5 km × 5 km resolution. Vulnerability index (VI) values of 100% indicate that the population appropriates in one year all the landscape production.
Figure 3.
Vulnerability map (%) showing the ratio of NPP supply to demand at 5 km × 5 km resolution. Vulnerability index (VI) values of 100% indicate that the population appropriates in one year all the landscape production.


