1. Introduction
While a major concern in modern society is the generation of large amounts of municipal solid waste (MSW), the challenges faced by local authorities in its management can seem overwhelming. Urbanization, population increase and higher consumer demand are some of the many factors [
1] causing this rapid growth in Europe. In this context, the EU issued laws and regulations for better waste management. The old and new Member States, including Romania since 2007, have to comply with all of the new directives.
The European Parliament and Council Directive 2008/98/EC [
2] from 19 November 2008, regarding wastes was enacted by Romania through Law No. 211/2011 [
3]. In accordance with Article 17, Chapter 10 of this law, waste producers and local authorities have the responsibility to achieve, by 2020, a level of preparation for reuse and recycling of at least 50% of the total waste quantities, such as paper, metal, plastic and glass from household waste and, if necessary, from other sources, to the extent that these waste streams are similar to household wastes.
In this context, performing a complete analysis of the characteristics and composition of household waste is an important element in national, regional and local strategies and represents an instrument for local governments and sanitation operators in setting and achieving targets for waste recycling/recovery.
In the EU, 33.9% of the MSW generated in 2003 was recycled and treated in a different way from incineration and landfill disposal [
4]. In Romania, between 2004 and 2008 (one year after becoming an EU member), the landfilled MSW decreased by almost 1% per year [
5].
The latest information available concerning the composition and generation rate of MSW dates back to the period from 1998 to 2002 [
6]. For the same period of time, in the EU, the waste generated by households was about 82% between 1998 and 2001 [
7]. On a per capita basis in 2006, the Western European countries produced about 550 kg of MSW per person annually compared to the USA’s generation rate of 764 kg [
8]. In Romania, in the year 2007, a national average of approximately 472 kg of MSW per inhabitant annually was generated [
9,
10]. Worldwide the MSW management is different according to region/state [
11,
12,
13,
14]. For example in Greece, Portugal and the U.K., landfilling is used as the main solution for 92%, 75% and 74%, respectively. In comparison with the European countries, the USA relies on landfills for 55%. In the EU, the countries that have high recycling rates are the Netherlands with 64%, Austria with 59%, Germany with 57% and Belgium with 52%, whereas the U.S. recycles about 33% of its MSW [
15]. In 2000, about 18% of MSW was incinerated and 25% recycled in Western Europe, whereas incineration and recycling accounted for 6% and 9%, respectively, in Central and Eastern Europe [
16]. In the EU, MSW thermal processing represents 30% of the total MSW treatment options [
16,
17,
18,
19].
Worldwide, there are different types of technologies for the same thermal treatment processes [
19,
20,
21,
22,
23,
24,
25,
26]. Source reduction, generation, recovery and disposal [
27,
28] constitute some of the most important segments of integrated MSW management (IMSWM). Some of the wastes are recovered through recycling and composting, for example, enhancing the organic component of the waste through anaerobic digestion processes, even operating on very particular wet fractions [
29,
30], and others converted into thermal or electrical power [
31,
32]. In the framework of the EU directives, the Member States have encouraged systems of selective collection (SC) and the recycling of several MSW components. Different types of collection systems, generically called selective collection, are used among the EU Member States, such as drop-off collection, collection point systems and curbside collection [
7].
Recycling of the main packaging waste fractions reached a level of 40.47% of the total 46.74% recovered in Romania in 2009 [
33]. The plastics, paper/cardboard and wood fractions were recycled using systems, such as drop-off collection or a collection point, and part of the recovered material was further incinerated at the local level for energy production.
Romania has to comply with the EU strategy, which requires that, by 2020, MSW should be managed 50% by recycling and 45% through energy recovery (energy recovery systems), and only 5% should be stored [
9].
The landfill Directive 1999/31/EC [
34] promotes the reduction of wastes that are landfilled and requires that, by 16 July 2016, biodegradable municipal solid waste (BMSW) going to the landfill should be reduced to 35% of the total amount of MSW produced in 1995. Depending on different conditions, such as climate or degree of industrialization, in European countries, between 60% and 70% of MSW is represented by BMSW [
35].
For achieving these targets, strategies, such as applying SC in urban and rural areas, should be developed at a larger scale. SC has not been applied in Romania at a national scale yet, but it has existed only locally, because of the implementation of pilot systems developed with EU funds. Therefore, small projects at the local level, with support provided by the municipalities, have been developed and consist of a number of collection points, where different types of materials are collected (metals, paper, cardboard and plastics), but also drop-off collection systems for small communities in urban and rural areas. There are no exact data about the SC percentage reached nationwide, but overall, it does not exceed 10% [
33]. However, SC represents a relevant parameter in the evaluation of a waste management system.
The aim of this article is to provide a proper basis for developing clear and realistic forecasts in current municipal waste management, based on the MSW composition and generation index determined for the year 2011. This will lead to practical solutions for successfully meeting the main objectives concerning recycling and reuse of recyclable materials, the pre-collection/collection/treatment/recovery/disposal of the waste material group, types of settlements and the number of inhabitants, all to meet the targets imposed by the European Union.
The method used for this study, which is presented below, assumes sampling from different sites in Romania, in areas with different economic development levels, thus making it suitable for use in other states that are facing the same problems as newly-entered European Union states. This methodology involves the qualitative and quantitative analysis of MSW at a specific time and target area, taking into account the actual constraints of the authorities. This methodology was chosen for consistency reasons, being used before in several MSW characterization campaigns in the years 2005–2010; consequently a continuous and unitary method can be ensured, enabling a better comparison between the previously obtained results and the ones coming from this study. The success of this methodology depends on the amount of available funds, no matter the state where it is applied (Romania or other European states). With the increase of sampling campaigns, the rigor of the method is higher and the results are closer to reality.
3. Results
In the case of hazardous wastes (coming from MSW) characterization campaigns, the following components were separated and weighed: solvents, paints, inks, adhesives and resins, cytotoxic drugs, pesticides, etc.
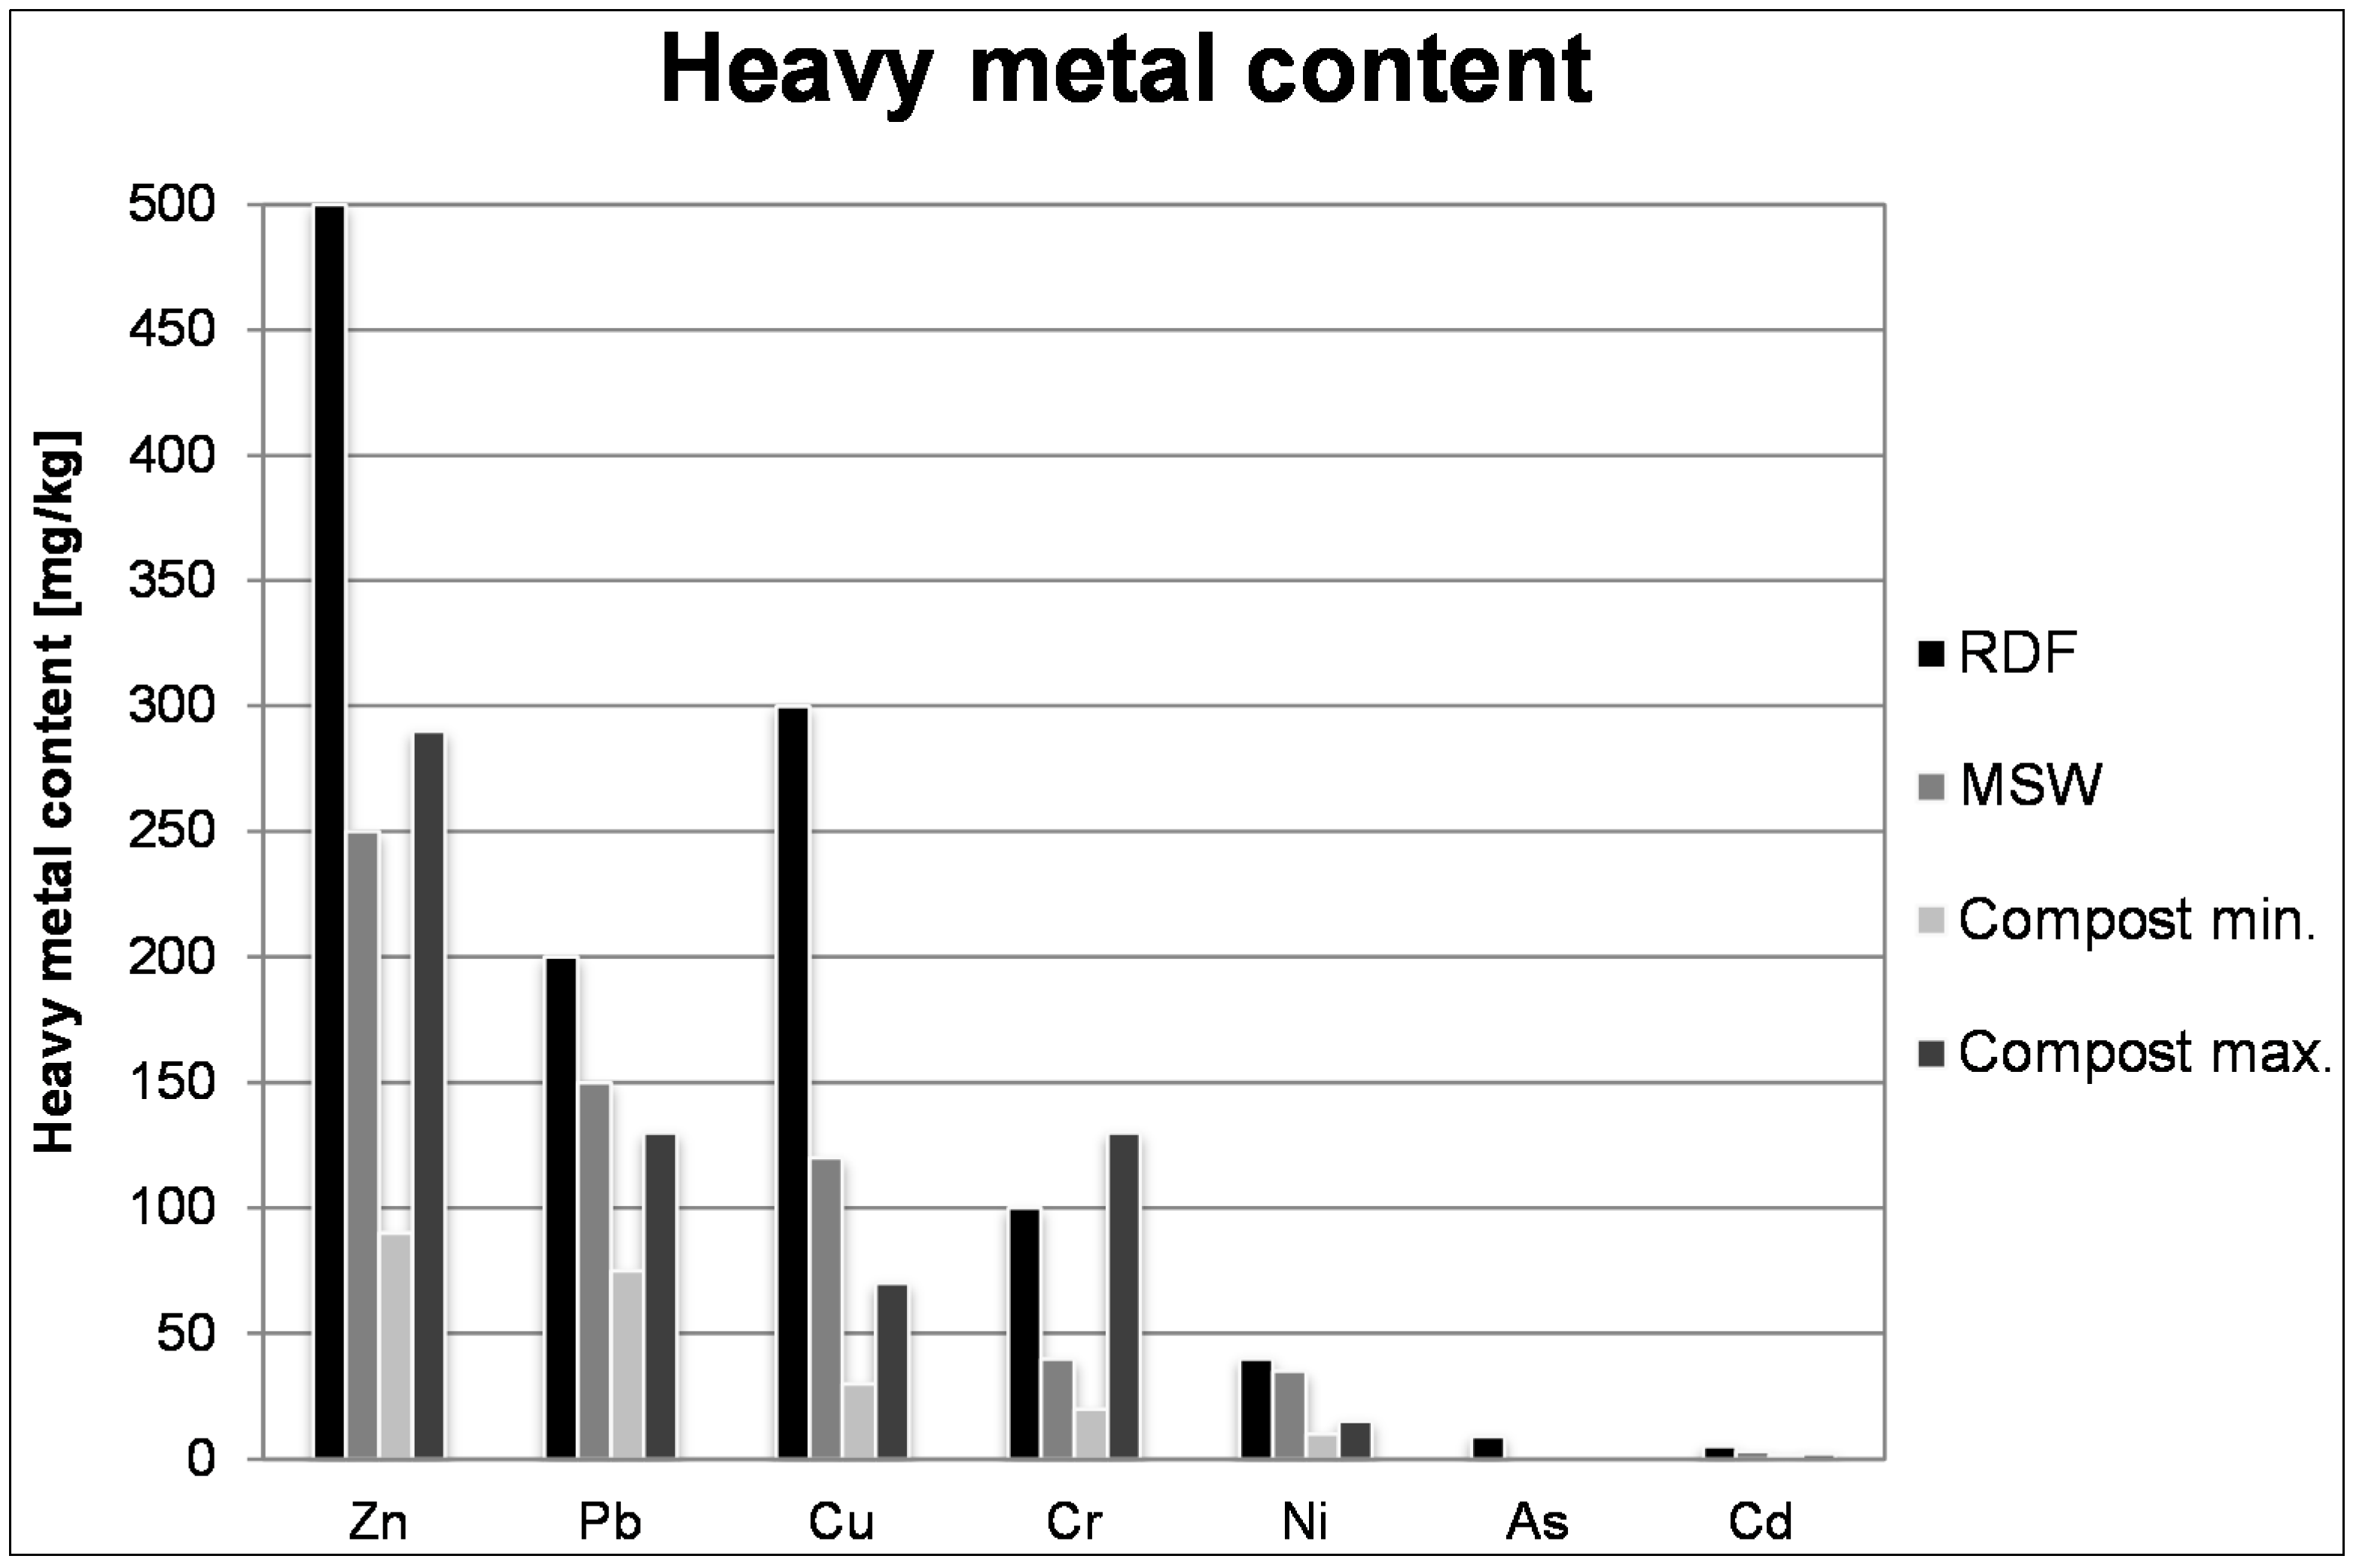
Considering the Romanian MSW composition, the heavy metal content is 30%–35% lower than in other industrialized countries [
38]. The amount of heavy metals for the Romanian MSW, found during the development of the research, is presented in
Figure 1, along with the limit values for refuse-derived fuel (RDF) [
39] and compost [
38] imposed by the EU normative.
Figure 1.
Heavy metal content in the Romanian MSW. RDF, refuse-derived fuel.
Figure 1.
Heavy metal content in the Romanian MSW. RDF, refuse-derived fuel.
Romanian wastes could easily be transformed into SRF (solid recovered fuel), because the heavy metal content is much lower than the one allowed by the EU standard. Given the fact that the MSW comes from mixed collection, the application of SC to organic fractions will enable the BMSW to become high quality compost in the future.
Analyses for establishing the composition and waste generation index were achieved for all eight regions of Romania. Four representative areas (of the total areas where sampling campaigns were performed) from different parts of Romania were chosen to be detailed in
Table 2 in terms of MSW composition: Sector 6 from Bucharest (Dense Urban Area 1) and the city of Timisoara (Urban Area 2), where MSW mixed collection applies, Sercaia, Brasov County (rural area), where MSW separate collection applies, and a touristic resort, Baile Felix, Bihor County. The quantities were weighed, and their percentage average was measured for five days sampling campaigns and presented in
Table 2.
For each of these locations, the following aspects were withdrawn from the five-day sampling campaigns:
Urban Area 1: ~2.2 tMSW were analyzed, resulting in the generation of 0.92 kgMSW·inh−1·day−1;
Urban Area 2: ~20 tMSW; generation = 0.95 kgMSW·inh−1·day−1;
rural area: ~14.2 tMSW; generation = 0.42 kgMSW·inh−1·day−1;
touristic area: ~3 tMSW; generation = 0.88 kgMSW·inh−1·day−1.
The differences between the rural and urban areas in MSW composition are evident. The plastic fraction is significantly higher in urban areas, almost six-times higher generation by inhabitant annually than in rural areas. Higher quantities of plastics generated in urban areas considerably increase the calorific value of MSW and, consequently, their possibility of being valorized for energy recovery. The calorific value of MSW in dense urban areas and in the touristic area was estimated based on the composition, at 8686 kJ/kg and 7668 kJ/kg, respectively. In Urban Area 2, the calorific value of MSW was estimated at 6801 kJ/kg. As expected, the lowest calorific value of MSW is found in the rural area, 5613 kJ/kg. The calorific values of MSW for each representative area were determined on a wet basis. SC and the existence of collecting points for all combustible materials will facilitate the relationship between the population and the authorities and future existing valorization plants [
40]. Based on the results obtained in the sampling campaigns and on the data provided by the Romanian National Agency of Environment Protection, by landfills operators and by sanitation operators from local, county and regional agencies, the MSW composition was proposed for the eight Romanian regions (
Table 3).
Table 2.
MSW composition in four urban and rural representative areas.
Table 2.
MSW composition in four urban and rural representative areas.
| Area | Urban 1 | Urban 2 | Rural | Touristic |
|---|
| Type of Waste | (%) | (%) | (%) | (%) |
|---|
| Biodegradable waste | 60.02 | 39.60 | 57.98 | 41.20 |
| Paper and cardboard | 7.17 | 6.92 | 5.02 | 6.50 |
| Composite (tetra pack) | 1.08 | 2.06 | 3.06 | 3.70 |
| Textile | 3.26 | 1.36 | 1.04 | 1.10 |
| Sanitary textile | 3.80 | 1.78 | 1.50 | 1.50 |
| Hazardous from MSW | 0.28 | 1.78 | 0.14 | 0.10 |
| Plastic | 16.51 | 12.30 | 5.16 | 12.50 |
| Wood | 0.05 | 1.60 | 1.00 | 1.00 |
| Glass | 2.59 | 5.18 | 1.64 | 2.00 |
| Ferrous metals | 1.18 | 1.08 | 1.24 | 1.50 |
| Nonferrous metals | 0.53 | 3.52 | 1.10 | 3.10 |
| Construction wastes | 2.64 | 2.56 | 2.64 | 3.00 |
| Not specified wastes | 0.80 | 1.42 | 2.60 | 6.80 |
| Inert | 0.09 | 18.84 | 19.50 | 16.00 |
Table 3.
MSW composition at the national level on a wet basis.
Table 3.
MSW composition at the national level on a wet basis.
| Region | Paper and cardboard | Plastic | Glass | Metal | Biodegradable Waste | Other Waste | Bulky Waste | Wood |
|---|
| (%) | (%) | (%) | (%) | (%) | (%) | (%) | (%) |
|---|
| Northeast | 9.63 | 9.64 | 3.16 | 1.40 | 60.86 | 13.83 | 0.01 | 1.48 |
| Southeast | 10.50 | 9.62 | 4.25 | 3.42 | 56.41 | 12.13 | 0.14 | 3.54 |
| South | 10.51 | 8.65 | 3.63 | 3.13 | 68.89 | 3.02 | 0.00 | 2.16 |
| Southwest | 3.47 | 3.54 | 1.78 | 0.71 | 66.25 | 23.18 | 0.00 | 1.07 |
| West | 15.43 | 16.43 | 3.94 | 3.10 | 53.84 | 2.49 | 1.79 | 2.98 |
| Northwest | 13.50 | 13.70 | 3.92 | 2.48 | 46.77 | 14.69 | 2.59 | 2.34 |
| Center | 14.64 | 10.87 | 7.49 | 4.05 | 53.28 | 2.77 | 3.74 | 3.16 |
| Bucharest-Ilfov | 13.87 | 8.20 | 6.84 | 4.86 | 55.30 | 8.91 | 0.00 | 2.02 |
| Total | 11.85 | 10.38 | 4.52 | 3.03 | 56.78 | 10.01 | 1.02 | 2.41 |
In the Romanian MSW, an important part is represented by biodegradable waste, approximately 50%–60%, which contributes to the overall decreases of the MSW calorific value. Because of the high percentage of BMSW, Romania must implement pretreatment methods before energy valorization of its wastes.
In rural areas, the biodegradable fraction is used in many cases as feed for farm animals. The rural population habits make organic waste SC, anaerobic digestion or composting unsuitable options. Instead, in the urban areas, SC could be a promising solution for MSW pretreatment before valorization. With this solution, Romania can comply with the EU request regarding recycling and reuse.
The MSW Romanian composition differs from other Western European states [
5,
7] with respect to the BMSW fraction, which is higher, due to the great contribution given by rural areas. Concerning the plastics and paper/cardboard fractions, the percentage in the Romanian MSW composition is lower, up to 5%–10% lower than in other Western European states (European Commission), due to the lower and smaller degree of industrialization in Eastern European countries. Romania is not a unitary state in terms of education or income, and thus there appear quite large differences between rural and urban areas. This is generally encountered in countries with decentralized political power, which is common in Eastern Europe states.
The MSW generation index (GI) was determined using the following formulae:
where:
IGyear: MSW generation index for that specific year;
QMSW: total amount of MSW collected in that specific year;
Pyear: population in that specific year.
The results concerning the generation rate at the national level are presented in
Table 4. The MSW generation index at the national level is obtained after considering the results arising from our campaign at the local level (representative areas) and the ones provided by national agencies, the same as in the MSW composition at the national level.
Table 4.
MSW generation rate at the national level.
Table 4.
MSW generation rate at the national level.
| Region | Inhabitants in Urban Area (inh) | Inhabitants in Rural Area (inh) | Region Average (kg·day−1) | Urban Average (kg·day−1) | Rural Average (kg·day−1) |
|---|
| Northwest | 1,449,002 | 1,269,646 | 0.80 | 1.05 | 0.47 |
| Center | 1,500,331 | 1,024,160 | 0.60 | 0.84 | 0.37 |
| Northeast | 1,605,008 | 2,109,042 | 0.50 | 0.69 | 0.31 |
| Southeast | 1,549,279 | 1,263,476 | 0.78 | 1.02 | 0.49 |
| South | 1,355,452 | 1,915,755 | 0.45 | 0.63 | 0.28 |
| Bucharest-Ilfov | 2,077,430 | 179,113 | 1.01 | 1.07 | 0.66 |
| Southwest | 1,074,789 | 1,175,776 | 0.52 | 0.73 | 0.33 |
| West | 1,212,225 | 709,475 | 0.88 | 1.02 | 0.52 |
Statistical calculation results show that the precision of the sampling campaign depends mainly on the number of samples analyzed and the heterogeneity of household waste and not their quantity produced in the study area. Thus, it is necessary to sort a minimum of five samples of whatever campaign characterized flow, even for the most modest areas.
Considering the obtained results, the MSW generation index increases annually by 0.8%, leading to a generation rate of 0.9 kg
MSW·inh
−1·day
−1 for the urban region and 0.4 kg
MSW·inh
−1·day
−1 for the rural region. These results are correlated with the National Waste Management Plan for 2007–2013, where the same increase of 0.8% was assumed, and based on this method, all of the funding applications for European projects were made. The obtained MSW composition and the MSW generation index are presented in
Table 5 as forecasts for MSW fractions for the year 2018, with respect to the production of MSW in the year 2010.
Table 5.
The MSW fraction prognosis for the year 2018.
Table 5.
The MSW fraction prognosis for the year 2018.
| MSW Fraction | Urban Area in 2018 | Rural Area in 2018 |
|---|
| Paper and cardboard | 3% increase | 7% increase |
| Glass | 1% increase | constant percentage |
| Plastics | 3% increase | 6% increase |
| Metal | 2% increase | 2% increase |
| Wood | constant percentage | constant percentage |
| Biodegradable waste | 8% decrease | 15% decrease |
MSW forecasts were made taking into account the estimated evolution of the packaging waste market and, implicitly, of packaging waste generation. The glass fraction is increasing in a lower proportion, because it was assumed that a part of it would be reused by the year 2018. For the BMSW, it was assumed that some composting would be available to treat the biodegradable fraction. This assumption was made taking into consideration the EU request regarding the decrease of BMSW sent to the landfill. For light packaging, it was supposed that high efficiency SC, mainly for polyethylene terephthalate (PET) and high density polyethylene (HDPE), would be developed, as indicated also in the literature [
41].
Nowadays, Romania is still in the stage of developing programs regarding recycling, valorization and reuse, and the plants for treating the MSW fraction collected separately are still in progress, being at the starting level, and in the process of being authorized. MSW composition analysis offers information on the types and value of materials that come from a specific waste stream. The analysis highlights the various materials present in the waste stream and also their relative quantity. Performed at certain periods of time, the analysis can reveal the differences that appear between seasons.
Collecting complete information may contribute to national database development and better decision making by the involved authorities. This leads to the prognosis of the MSW that is generated in a specific area and helps the development of MSW reuse, recycling and valorization proposals/systems, in accordance with EU regulations.
4. Discussion and Proposals
Based on the obtained results from this study and also on the prognosis made (
Table 5), two proposals for the urban and the rural areas in Romania were developed for MSW treating options improvement.
As an incipient stage for implementing SC in the rural area, the following fractions (and in which percentage) were considered to be collected separately: 10% organic, 20% plastic, 70% glass, 20% paper and cardboard, 70% metal and 20% tetra pack. The BMSW fraction is not taken into account when discussing rural SC, because it is most commonly used by the rural population in different mixtures as cattle food or deposited individually in the field. As a long-term solution, after developing education campaigns among the rural population, organic SC could be implemented, and the collected wastes could be sent to composting, bio-stabilization or even bio-drying [
42,
43,
44]. Withal paper, cardboard and wood does not require separate collection in rural area, as it is reused in the households for individual heating.
In the urban areas of Romania, SC could be implemented effectively mostly with the involvement of local authorities responsible for each urban area sector. Higher SC efficiencies are expected in this case, although the MSW collection system must be applied on a larger number of inhabitants. The higher education level of the population and the more available funds coming from the municipality enable SC of 50% of the organic fraction, 70% glass, 60% paper and cardboard, 25% plastic, 30% tetra pack, 70% metal and 20% wood. After applying the SC with the efficiencies assumed above, the compositions of the residual municipal solid waste (RMSW) for the urban and rural area are presented in
Table 6.
Table 6.
The urban and rural residual municipal solid waste (RMSW) composition after selective collection (SC).
Table 6.
The urban and rural residual municipal solid waste (RMSW) composition after selective collection (SC).
| Type of Waste | Urban RMSW (%) | Rural RMSW (%) |
|---|
| Biodegradable wastes | 19.80 | 52.18 |
| Paper/cardboard | 2.76 | 4.01 |
| Composite (tetra pack) | 1.44 | 2.44 |
| Textile | 1.36 | 1.04 |
| Sanitary textile | 1.78 | 1.5 |
| Hazardous from MSW | 1.78 | 0.14 |
| Plastic | 9.22 | 4.12 |
| Wood | 1.28 | 1 |
| Glass | 1.55 | 0.49 |
| Ferrous metals | 0.32 | 0.37 |
| Nonferrous metals | 1.05 | 0.33 |
| Construction wastes | 2.56 | 2.64 |
| Not specified wastes | 1.42 | 2.6 |
| Inert | 18.84 | 19.5 |
The calorific values of the obtained RMSW are approximately similar, 4577 kJ/kg for the urban region and 4907 kJ/kg for the rural region, based on the calorific value of each fraction and its contribution to the new RMSW obtained for the urban and rural regions. Taking into account the SC efficiencies for these two scenarios, the overall SC efficiency is approximated at 35% for urban area and 8%–10% for rural area.
Given the higher quantities of MSW generated in the urban areas as compared to rural areas, the main focus stays on solving the problems with the household waste produced by the urban population, by minimizing the quantity of MSW sent to landfill. The need is to promote MSW advanced treating options to align with European implementation practices for final elimination solutions of RMSW remaining after SC, such as thermal treatment.
According to the MSW Management Plan, after 2013, it is possible to implement MSW energy recovery in Romania. In
Figure 2, an alternative energetic recovery solution is proposed based on the separate collection scenarios, considering an overall SC efficiency of 27% for Romania. If higher SC efficiencies will be achieved in the future, the waste to energy scenario could still be applicable, although higher recycling efficiencies will be reached.
In this scenario, the total amount of RMSW will be sent for incineration and energy recovery. The resulting ash [
45] is reused in construction in a proportion of 60%, thus minimizing the quantity sent to landfill. The remaining slag together with the residue resulting from the baling process represents 22% of the initial MSW subjected to the proposed treatment solution.
Figure 2.
Proposed system to be adopted for Romanian urban areas.
Figure 2.
Proposed system to be adopted for Romanian urban areas.
The design of such an incinerator is still at an incipient stage, the research for this project being conducted by the Institute of Studies and Power Engineering (ISPE). The costs for the design and the construction of the energy recovery treatment plant will be supported by municipality associations and EU funds.
5. Conclusions
Establishing the MSW composition and generation index nationwide in urban and rural areas was conducted in accordance with the ROMECOM methodology.
The analysis of heavy metals revealed important aspects of the Romanian MSW future trends. If BMSW is collected separately, for this specific fraction, composting could be applied successfully. Instead, if we refer to energy recovery, the heavy metals are found in the bottom ash; thus, such analyses are important when MSW is incinerated.
The accuracy of the results of waste characterization campaigns is based on the number of samples analyzed and the heterogeneity of MSW from the population, as well as the amount of collected waste.
Establishment of a generation index and MSW composition helps to develop a strategy and national, regional or county waste management plans. This determines the management of MSW from the waste collection to the waste disposal phase.
The MSW prognosis was made taking into account the expected evolution of packaging materials marketing, thus, implicitly, packaging waste generation, and data from other European countries. The results revealed that, increasingly, MSW generation rates would lead to the increase of household waste components.
The proposed MSW management system is thus characterized by a source separation level, as indicated above, with subsequent recovery of the separated materials and energy recovery of the residual waste in a large-scale WTE plant operating in a combined heat and power mode. Moreover, when a decision has to be made on how much to increase the overall source separation level in integrated waste management systems, the efficiency of energy recovery from the residual waste plays a major role in defining the optimum balance between material and energy recovery [
17].
In conclusion, the analysis based on MSW composition and generation rate contributes to the improvement of waste management systems by implementing and the development of new MSW recycling systems in accordance with EU regulations. Better results for efficient SC systems could be achieved by supporting all of the above with education campaigns for the population and the correct implementation of all sanctions by the authorized bodies.
Projects for the implementation of integrated waste management systems have already been carried out in many countries, alongside conventional systems (separate collection, transportation, transfer, sorting, aerobic composting in mechanical biological treatment plants, storage, co-incineration) within which recycling and material recovery (paper and cardboard, plastic, glass, metal, etc.) are stated.
This sampling and forecasting method could be applied to any area, especially for new EU Member States, which have to comply with the legislation requirements.


