Abstract
Southwest China (SC) has suffered a series of super extreme droughts in the last decade. This study analyzed the temporal and spatial variations of drought in SC from 1961 to 2012. Based on precipitation anomaly index (PAI) that was derived from 1 km gridded precipitation data, three time scales (month, year and decade) for the drought frequency (DF) and drought area were applied to estimate the spatio-temporal structure of droughts. A time-series analysis showed that winter droughts and spring droughts occurred frequently for almost half of the year from November to March. Summer droughts occasionally occurred in severe drought decades: the 1960s, 1980s and 2000s. During the period of observation, the percent of drought area in SC increased from the 1960s (<5%) to the 2000s (>25%). A total of 57% of the area was affected by drought in 2011, when the area experienced its most severe drought both in terms of area and severity. The spatial analysis, which benefitted from the gridded data, detailed that all of SC is at drought risk except for the central Sichuan Basin. The area at high risk for severe and extreme droughts was localized in the mountains of the junction of Sichuan and Yunnan. The temporal and spatial variability can be prerequisites for drought resistance planning and drought risk management of SC.
1. Introduction
Drought is estimated as the most costly cause of natural disasters in the world and can lead to crop losses and economic havoc in many areas [1], affecting more people globally than any other natural hazard [2]. Drought can be regarded as regional and time-series water deficit processes, resulting in diminished water resource availability and ecosystem carrying capacity [3,4,5]. However, there is no universal definition of drought because of its large-scale spatiotemporal variability in timing and duration [6]. Typically, droughts are characterized into four categories including “meteorological”, “hydrological”, “agricultural” and “socioeconomic” [7,8]. Meteorological drought refers to atmospheric conditions resulting in the absence or reduction of precipitation; agricultural drought indicates soil desiccation that can reduce crop production; hydrological drought is defined by deficiencies in water supply; and socioeconomic drought focuses on socioeconomic effects [9].
To identify and quantify the magnitude, duration, intensity and spatial extent of a drought, numerous drought indices were formulated by integrating variables such as precipitation, evapotranspiration, temperature, Terrestrial water storage (TWS), vegetation, etc. [2,4,10,11]. However, drought is a slow-onset natural hazard and a recurrent phenomenon. To evaluate meteorological drought quantification over a region for a period of time, precipitation is the most representative parameter [12]. As an input parameter of precipitation in the hydrologic cycle, sustained deficiency in precipitation may also induce “agricultural drought”, “hydrological drought” and “socioeconomic drought” to some extent [13]. Herewith, precipitation can be considered as a direct parameter to monitor droughts and detect more realistic drought process compared to other parameters such as the vegetation index [4]. Additionally, precipitation is an essential monitoring parameter of in situ monitoring networks, such as weather stations and hydrological stations. By comparison, the monitoring of other long-term parameters (e.g., evapotranspiration, TWS, and vegetation) with in-situ networks is not straightforward due to the cost of the equipment and strict requirements of measurement [14], which hinder further application of such variable based indices in drought evaluation at the regional scale.
For the advantages of precipitation in long-term drought estimation, various indices based on precipitation have been derived to measure meteorological droughts [15]. Among these indices, the precipitation anomaly index (PAI) [4,16,17], Palmer Drought Severity Index (PDSI) [18], Z-score or standardized rainfall anomalies [19], Standardized Precipitation Index (SPI) [20], and the standardized precipitation evapotranspiration index (SPEI) [21] are the most commonly used meteorological droughts indices. However, a simple measure may be applied more easily than using complex indices to evaluate drought disaster at large scale [22]. For example, PDSI requires soil moisture, runoff, evapotranspiration, potential evapotranspiration, and other factors of plant growth in addition to precipitation to assess droughts. The retrieval difficulties of various parameters for PDSI calculation make the complicated drought assessment more dubious. Furthermore, PDSI does not allow the identification of drought at short time scales, e.g., less than nine months [18]. Compared to complex indices, such as PDSI, SPI based on precipitation alone maybe a better index, as it also compares drought conditions among different time periods and regions [20]. Unfortunately, the computation of SPI requires previously fitting the long-term precipitation to an appropriate probability distribution function (PDF) before an equiprobability transformation of the aggregated precipitation into a standard normal variable, which is a significant cause of large errors in SPI-based drought assessment [23]. Among these indices, PAI is the simplest index that uses precipitation alone; it is a dimensionless number in which negative/positive values indicate dry/wet conditions. Due to the advantages of simple computation, spatio-temporal consistency, and easy comparison to historical records, PAI is an important meteorological drought index for large area drought assessment in China [24].
In the present work, drought in a region of Southwest China (SC) is evaluated using the meteorological index of PAI and derived DF both on the short and the long-time scales from 1961 to 2012. The aims of this study are to estimate the temporal and spatial variability of droughts in Southwest China. Moreover, this study intends to investigate spatial patterns as estimated at different timescales and sub-regional characters of droughts on a regional scale.
2. Methodology
2.1. Study Area
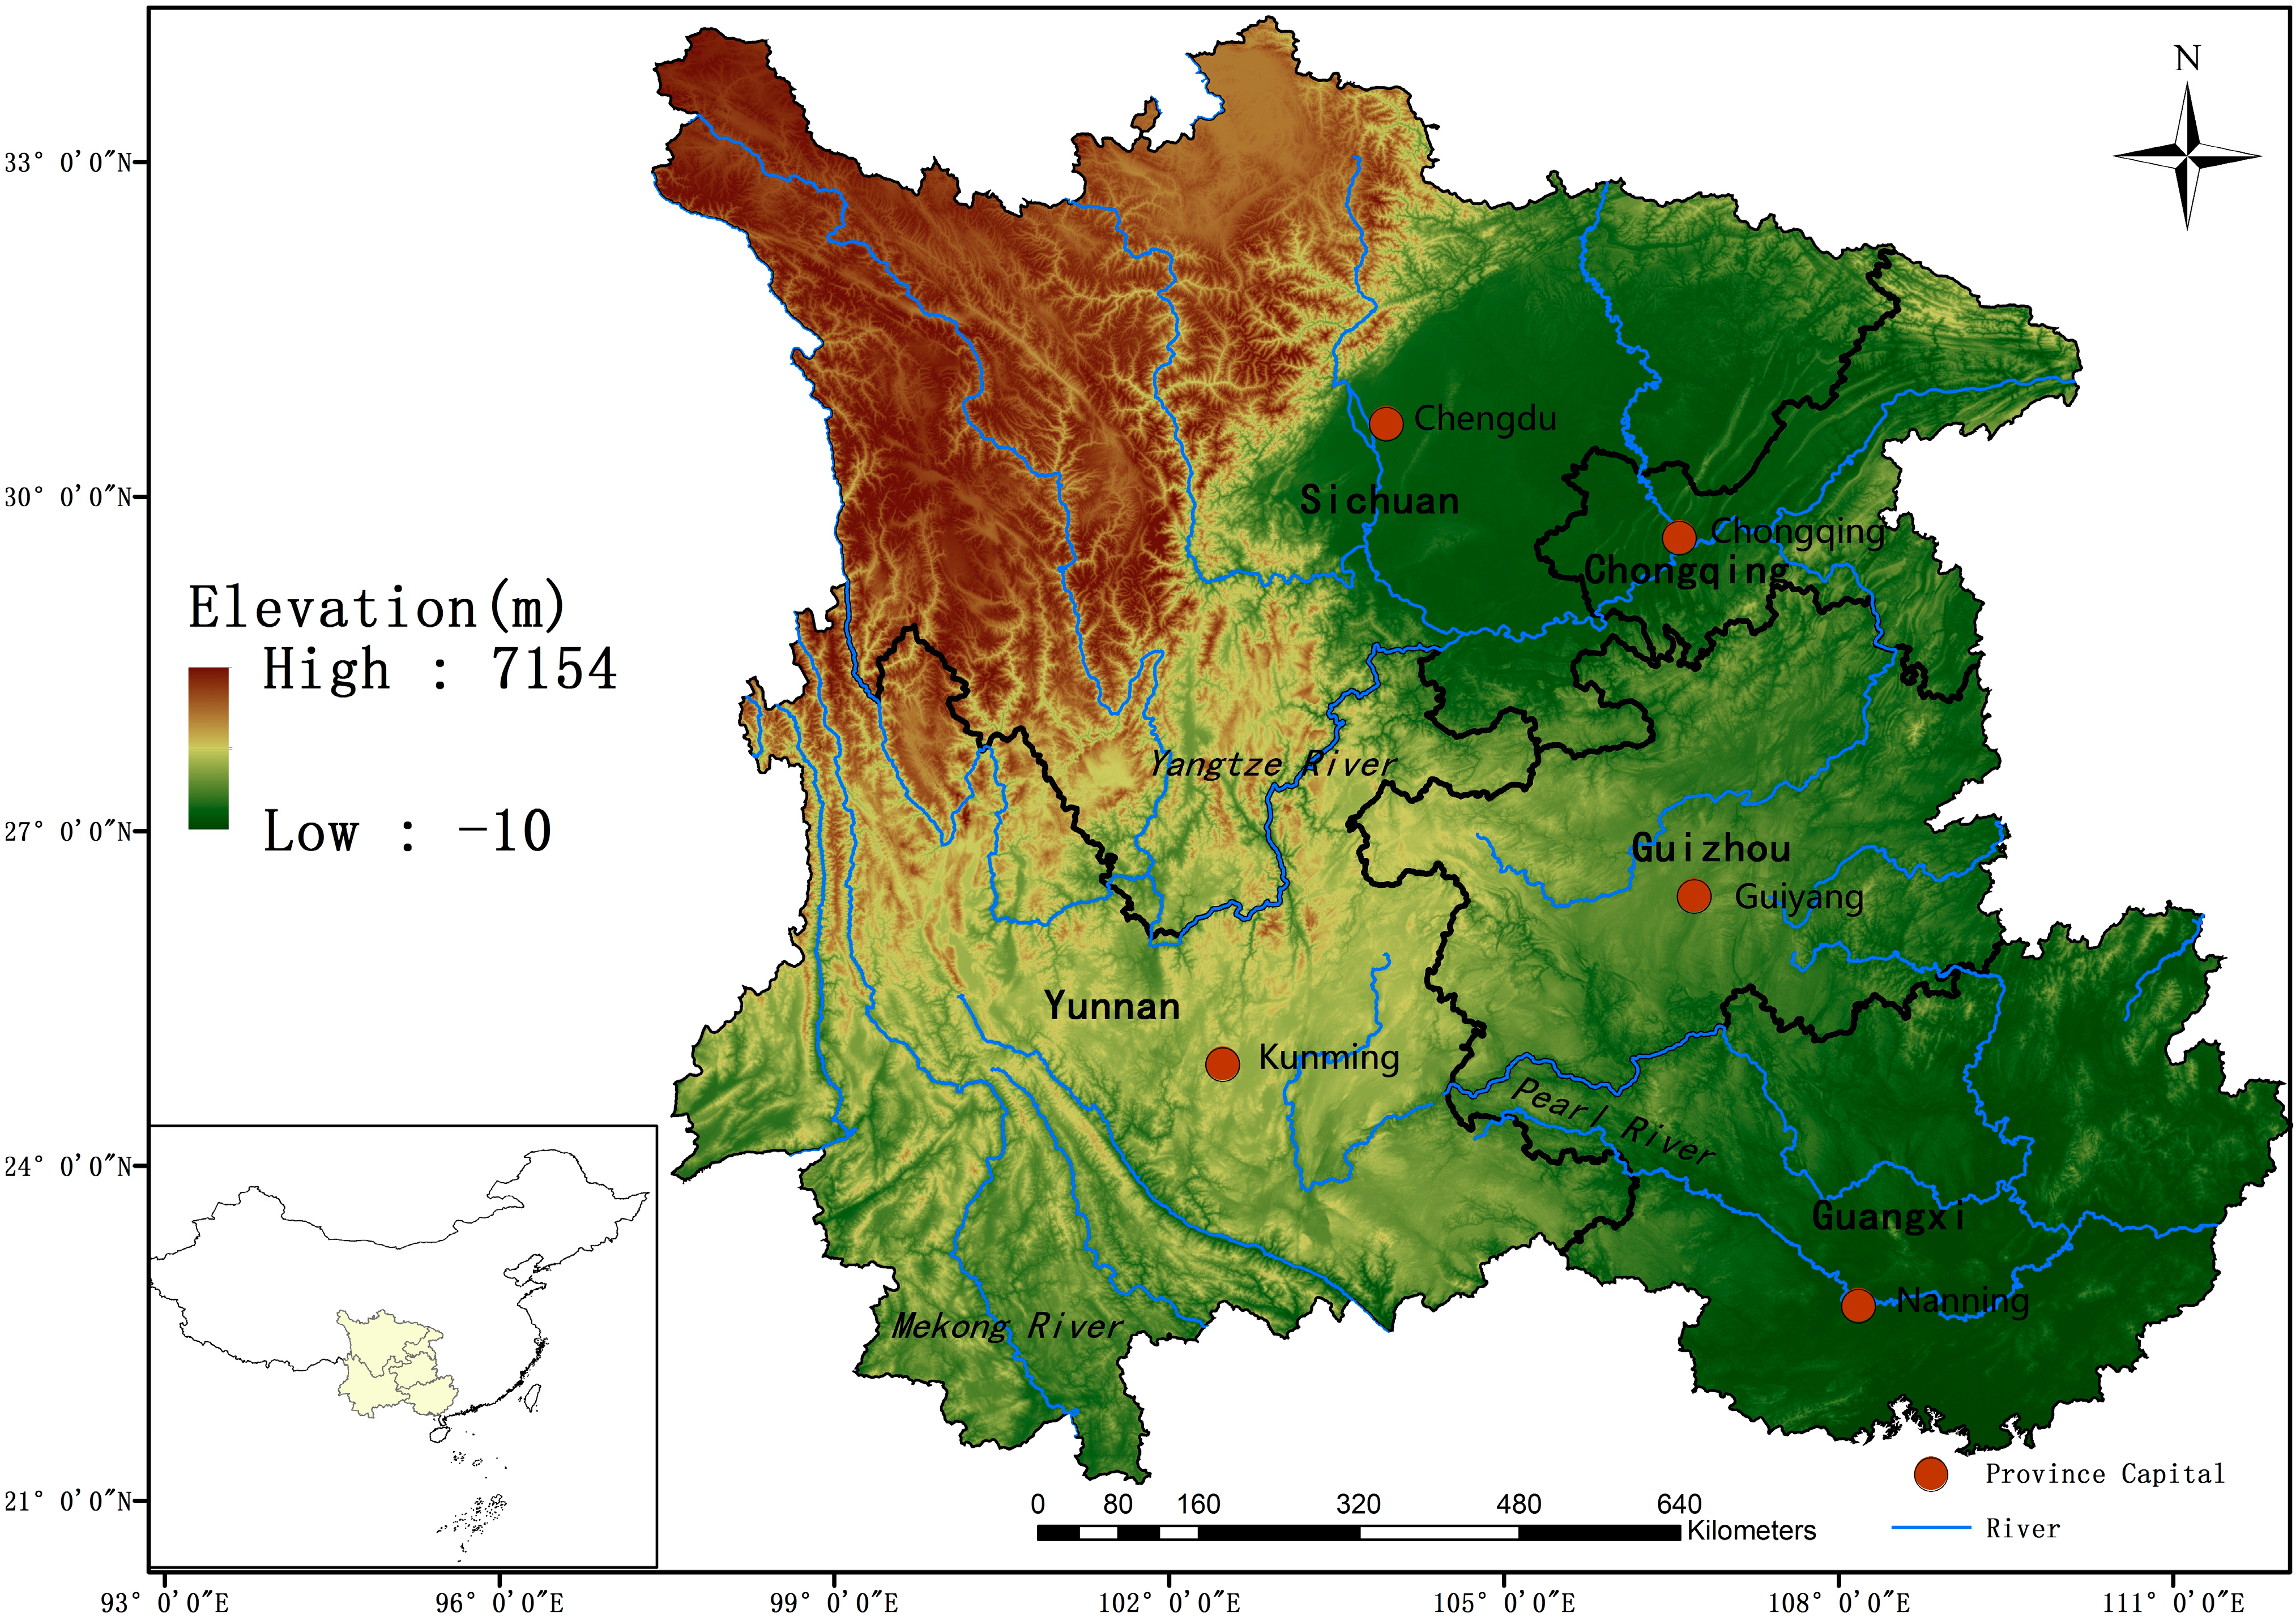
Southwest China consists of the municipality of Chongqing and the four provinces of Guangxi, Yunnan, Guizhou, and Sichuan, 21°07′N to 34°14′N, 97°30′E to 112°05′E (Figure 1). The total area of FSP is more than 1.16 million km2, and more than 60% of its area is mountainous. The elevation of SC, which ranges from higher than 7150 m to below 3 m in the east, decreases from the western Yungui Plateau to the eastern Sichuan Basin. SC is dominated by a humid and semi-humid subtropical monsoon climate, with cold, dry winters and hot, humid summers. The spatio-temporal distribution of precipitation within the basin is uneven, with a multiyear average of 1000–1600 mm/year [25,26]. Recent studies have detected a significant warming trend over the western plateau, as well as decreases in precipitation in the eastern basin [25,26,27,28,29]. Severe droughts have been prevalent since 2000 (e.g., droughts in SC during the summer of 2003, spring drought in Yunnan in 2005, extreme summer drought in Sichuan and Chongqing in 2006, and a prolonged drought in SC from autumn 2009 through spring 2010). SC is located in the upper reaches of the Yangtze River and Pearl River, which is an important region for strategic water resource reserves and hydropower [30]. In Addition, SC is an ecologically fragile area with more than 242 million populations; droughts have occurred frequently in recent years, significantly affect the regional ecological and human drinking water safety [31]. It is particularly important to highlight the spatio-temporal variations in droughts in SC.

Figure 1.
Location of study area.
Figure 1.
Location of study area.
2.2. Data and Methods
2.2.1. Gridded Precipitation
In this study, the meteorological droughts index of PAI was used for drought analysis. PAI was calculated from the monthly precipitation data from the China meteorological data sharing service system (CMDSSS) of the China meteorological administration (CMA) [32]. The original monthly precipitation data was calculated based on observations of 756 meteorological stations in China that covered the period 1961 to 2012. To analyze the spatio-temporal variations of droughts, the software ANUSPLIN, developed by Hutchinson, Australian National University [33], was applied to generate gridded precipitation data with a spatial resolution of 1 km × 1 km. ANUSPLIN calculates and optimizes thin plate smoothing splines that are fitted to datasets distributed across an unlimited number of climate station locations, which use elevation as a third variable in the spline interpolation. It allows for regional climate variations that are associated with latitude and continentality to be taken into account simultaneously with elevation and rain shadow effects, provided that these effects are captured sufficiently by the station network [34]. ANUSPLIN has been widely applied in precipitation interpolation in China. The Gridded precipitation based on ANUSPLIN showed great precision, which was quality-checked by a number of studies [35,36,37]. Mathematical details of the interpolation process are given in the cited references [33,38,39].
2.2.2. Estimation of Droughts
For the purpose of drought estimation, the PAI from 1961 to 2012 in SC was calculated as follows:
where P denotes the precipitation of the drought estimating period (year, month) and is the long term average precipitation of the same period as P, which is calculated using the data from all 52 years from 1961 to 2012 in this paper.
Because absolute droughts are difficult to evaluate, we used the meteorological drought level to estimate the drought severity. The relationship between the PAI and meteorological drought level is shown in Table 1. The lower PAI value represents more severe level of drought. As show in Table 1, droughts for PAI were classified in three temporal scales of month, season and year. Drought estimation in a longer time-scale exhibits a shorter PAI interval by considering the cumulated effect of precipitation for droughts.

Table 1.
Drought level definition for PAI [24].
| Classification | Droughts Level | PAI (%) | ||
|---|---|---|---|---|
| Month | Season | Year | ||
| 1 | No drought | −40 < PAI | −25 < PAI | −15 < PAI |
| 2 | Mild drought | −60 < PAI < −40 | −50 < PAI ≤ −25 | −30 < PAI ≤ −15 |
| 3 | Moderate drought | −80 < PAI < −60 | −70 < PAI ≤ −50 | −40 < PAI ≤ −30 |
| 4 | Severe drought | −95 < PAI ≤ −80 | −80 < PAI ≤ −70 | −45 < PAI ≤ −40 |
| 5 | Extreme drought | PAI ≤ −95 | PAI ≤ −80 | PAI ≤ −45 |
Additionally, the index of drought frequency (DF) is proposed to further analyze the spatial variations of droughts occurring in SC. The DF is calculated from statistics of drought events from 1961 to 2012:
where n is the number of years in which a drought occurred, N is number of years in the study [40]. In this paper, N is 52 for the period 1961–2012.
3. Result and Discussion
3.1. Variability of the Spatial Distribution of Drought
To investigate the spatial distribution variability of DF at different timescales, the monthly and annual time-scale variability of DF in SC were calculated and analyzed based on the above mentioned methods.
3.1.1. Monthly and Annual Scale Variability of DF
The spatial distribution variability of DF of 12 months from 1961 to 2012 in SC is shown as Figure 2. DF showed a large variability in different months. SC suffered from droughts in a large area for a period of half a year (January, February, March, October, November and December). During spring and winter, most of the drought events were reported in the study area [41]. As shown in Figure 2, the eastern (Yunnan Province) and southern (Guangxi Province) portions are severely drought-afflicted areas. The monthly variability of DF also displayed a drought pattern over time. From January to March, most of the droughts (DF > 40%) occurred in central and eastern Yunnan Province, southwestern Sichuan Province, and southern Guangxi Province. In May, the drought area rapidly narrowed. The area of DF > 40% was located in a limited extension of Yunnan Province. From June to September, the DF in the study area was low with a slightly increase. The distribution of droughts was spread from east to west. In October, droughts began to occur again in a large area, when DF > 40% and DF > 30% were detected in eastern Guangxi Province and northwestern Yunnan Province, respectively. The drought area increased rapidly from November. It is clearly found that half of study area is at a high drought risk. The DF of the entire Yunnan Province in western SC is greater than 40%. Except for the limited extension of the central portion, the DF of most of the area of Yunnan Province exceeded 50% in December, meaning that these regions suffered droughts biyearly.

Figure 2.
Spatial distribution of the monthly DF in SC from 1961 to 2012.
Figure 2.
Spatial distribution of the monthly DF in SC from 1961 to 2012.

The annual DF of SC during period of 1961–2012 was calculated to illustrate the spatial distribution of drought variability. As shown in Figure 3, the annual droughts DF were scattered, in contrast to the monthly scale. More than 61% of the area in SC had a relatively high DF that exceeded 15%, meaning that all of SC has been a region of high drought risk for more than half century. An area with high drought frequency was identified in the southern and eastern mountain zones. In contrast, Sichuan Basin, which occupies a large portion of the study area with relatively flat and fertile grounds, suffered fewer droughts events.

Figure 3.
Spatial distribution of annual DF in SC from 1961 to 2012.
Figure 3.
Spatial distribution of annual DF in SC from 1961 to 2012.

3.1.2. Decade Time Scale Variations of the Drought Severity Distribution
Decade variations in drought severity distribution were also examined by dividing the study period into four 10-year sub-periods (1961–1970, 1971–1980, 1981–1990, and 1991–2000) and one 12-year sub-period (2001–2012). The annual drought severity as estimated by the meteorological drought level was calculated based on Table 1. For the other drought severity levels, such as severe drought or extreme drought, which were not inevitable, we only plotted the spatial distribution of DF of mild drought severity for five-decade periods (Figure 4).
During the 1960s, most of SC suffered from mild droughts with a DF greater than 20% (Figure 4a). Whereas, droughts that were worse than moderate in nature did not occurred. Moderate droughts sporadically occurred in limited areas in Chongqing and Guangxi Provinces. In the 1970s, the mild drought area narrowed down rapidly (Figure 4b), which just occurred in northeastern and northwestern area. However, severe droughts were detected at the junction of Sichuan and Yunnan Provinces. In the 1980s, the droughts aggravated. Mild droughts spread to the eastern SC (Figure 4c). In addition to the severe droughts that occurred in some portions of Guangxi and Sichuan Provinces, extreme droughts were detected at the junction of Sichuan and Yunnan Provinces, which was the severe drought area in the 1970s. The droughts were moderated in the 1990s, when no droughts worse than moderate occurred. The mild droughts were just located in a limited area of northeastern Sichuan Province (Figure 4d). The analysis of drought severity distribution clearly indicated that the 2000s was the most severe drought period considering the magnitude, duration and extent of a negative PAI. In addition to the mild droughts that occurred in large extended areas, the four provinces of Sichuan, Yunnan, Guangxi and Guizhou in SC suffered from severe droughts and extreme droughts. The area of severe droughts and extreme droughts area peaked in 2011, which was consistent with other study [42].

Figure 4.
Decadal spatial distribution of DF of mild drought severity from 1961 to 2012. (a) 1960s; (b) 1970s; (c) 1980s; (d) 1990s; (e) 2000s.
Figure 4.
Decadal spatial distribution of DF of mild drought severity from 1961 to 2012. (a) 1960s; (b) 1970s; (c) 1980s; (d) 1990s; (e) 2000s.

3.2. Variability of Drought Areas
The droughts area is an important index for the estimation of drought magnitude. We evaluated the variations in droughts area of three time scales: decade, year and month. Figure 5 shows the decade variations in drought area from the 1960s. Similar to the result in Section 3.1.2, there is an abnormal decrease in the 1990s. The drought area in SC increased overall from less than 5% to more than 25%, indicating that the droughts of SC rapidly aggravated over 52 years, which may be caused by global change and human activities.

Figure 5.
Decade drought area percentage.
Figure 5.
Decade drought area percentage.

An annual analysis detailed the variability in drought area (Figure 6). Except for the highest value of 86.1% in 1963, when a severe drought occurred that last for 217 days [41], the drought area percentage remain steadily low during the 1960s and the 1970s. From the mid-1980s, several high values appeared, such as 37.5% in 1989, 34.2% in 1992, 37% in 2006, 46% in 2009 and the maximum of 57% in 2011. These results indicate the droughts have become more severe in recent years.
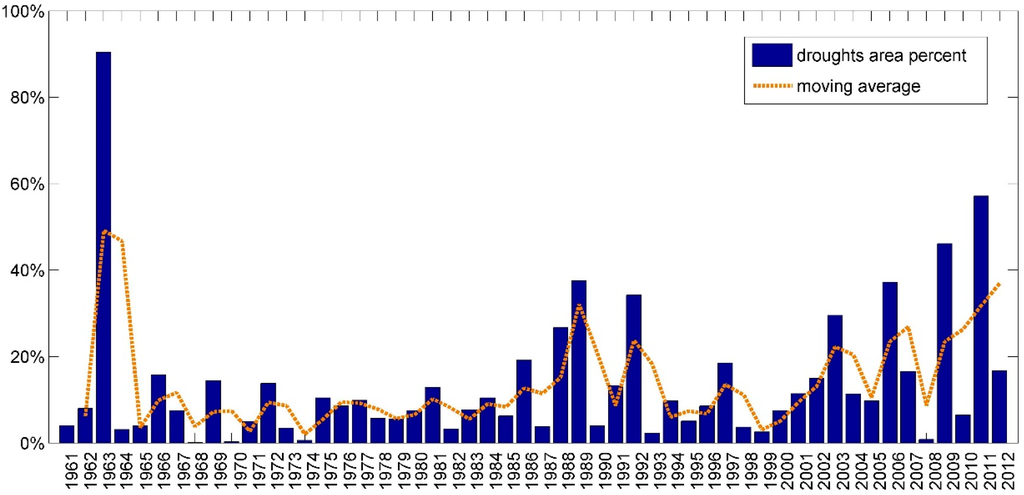
Figure 6.
Annual drought area percentage.
Figure 6.
Annual drought area percentage.

Figure 7 shows the monthly drought area variability over five decades. Region-wide droughts were not unusual from November to March, with a drought area percentage of greater than 80% in all five of the study periods. The values exceeded 90% in two severe droughts periods of the 1960s and 2000s, indicating that winter drought and spring drought were common in SC. The drought area percentage decreased rapidly from April and reached the minimum trough in May, which is the rainy period. Although the drought area increased from May, there was a wide variation in the five decades. For the 1960s, the 1980s and the 2000s, widespread droughts occurred in June, July and August, with high drought area percent of 95.1%, 96.3% and 89.5%, respectively. Occasional summer droughts also need to be noted.
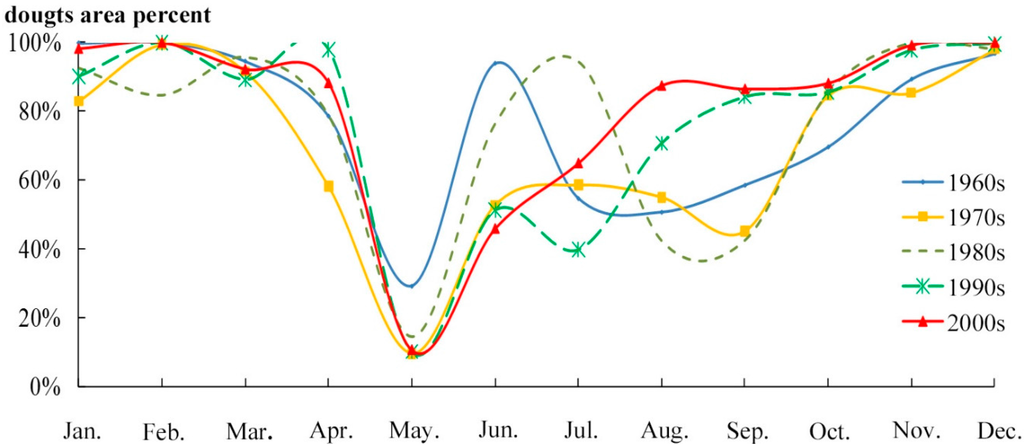
Figure 7.
Monthly drought area percentage over five decades.
Figure 7.
Monthly drought area percentage over five decades.

4. Conclusions
The present study explored the regional drought frequency and drought area analysis in SC from 1961 to 2012 considering the spatio-temporal structure of droughts. The drought tendency, affected area and severity and joint distributions were constructed at monthly, annual and decade time scales. The simple PAI approach was utilized to capture different time scales meteorological droughts over space and time in SC. This analysis result demonstrated that droughts occurred commonly in SC from the 1960s. Winter droughts and spring droughts occurred from November to March and were not peculiar, with more than 80% of the area suffering droughts. In contrast, summer droughts occasionally occurred during severe drought periods with a less temporal pattern, which can be an indicator of drought severity. The decade drought analysis showed that both the drought area and severity in SC increased except for in the 1990s. The frequency and intensity of drought became the most frequent and strongest in the 2000s and peaked in 2011 with a drought area percentage of 57%. The spatial variability analysis based on 1 km PAI gridded data showed that all of SC is at drought risk except for the central Sichuan Basin. The area at high risk of severe droughts and extreme droughts was in the mountains at the junction of Sichuan and Yunnan Provinces. These results indicate that gridded precipitation data can further the application of PAI in the estimation of the spatial distribution of drought. This study has analyzed the characteristics of regional meteorological droughts in SC. However, further research on temporal and spatial variability of droughts in SC in still warranted. Research on revealing the deterministic mechanism of droughts in SC is currently underway.
Acknowledgments
This project was supported by National Natural Science Foundation of China (Grant No. 51309210).
Author Contributions
The study was designed by Yaohuan Huang, Haijun Yang and Jianhua Wang. The data was collected and analyzed by Chen Xu and Chuanpen Zhao. The paper was wrote by Yaohuan Huang and Chen Xu. Model design and English corrections were completed by Haijun Yang, Jianhua Wang and Dong Jiang.
Conflicts of Interest
The authors declare no conflict of interest.
References
- Logan, K.E.; Brunsell, N.A.; Jones, A.R.; Feddema, J.J. Assessing spatiotemporal variability of drought in the U.S. central plains. J. Arid Environ. 2010, 74, 247–255. [Google Scholar] [CrossRef]
- Bryant, E. Natural Hazards; Cambridge University Press: Cambridge, UK, 2005. [Google Scholar]
- Lu, X.L.; Zhuang, Q.L. Areal changes of land ecosystems in the Alaskan Yukon River Basin from 1984 to 2008. Environ. Res. Lett. 2011. [Google Scholar] [CrossRef]
- Wang, J.H.; Jiang, D.; Huang, Y.H.; Wang, H. Drought Analysis of the Haihe River Basin Based on GRACE Terrestrial Water Storage. Sci. World J. 2014. [Google Scholar] [CrossRef] [PubMed]
- Raziei, T.; Saghafian, B.; Paulo, A.A.; Pereira, L.S.; Bordi, I. Spatial patterns and temporal variability of drought in Western Iran. Water Resour. Manag. 2009, 23, 439–455. [Google Scholar] [CrossRef]
- Hong, X.J.; Guo, S.L.; Xiong, L.H.; Liu, Z.J. Spatial and temporal analysis of drought using entropy-based standardized precipitation index: A case study in Poyang Lake basin, China. Theor. Appl. Climatol. 2014. [Google Scholar] [CrossRef]
- Wilhite, D.A.; Glantz, M.H. Understanding the drought phenomenon: The role of definitions. Water Int. 1985, 10, 111–120. [Google Scholar] [CrossRef]
- Keyantash, J.; Dracup, J.A. The quantification of drought: An evaluation of drought indices. Bull. Am. Meteorol. Soc. 2002, 83, 1167–1180. [Google Scholar]
- American Meteorological Society. Meteorological drought—Policy statement. Bull. Am. Meteorol. Soc 1997, 78, 847–849. [Google Scholar]
- Lu, X.L.; Zhuang, Q.L. Evaluating evapotranspiration and water-use efficiency of terrestrial ecosystems in the conterminous United States using MODIS and AmeriFlux data. Remote Sens. Environ. 2010, 114, 1924–1939. [Google Scholar] [CrossRef]
- Huang, Y.H.; Wang, J.H.; Jiang, D.; Zhou, K.; Ding, X.Y.; Fu, J.Y. Surface water deficiency zoning of China based on surface water deficit index (SWDI). Water Resour. 2014, 41, 372–378. [Google Scholar] [CrossRef]
- Vicente-Serrano, S.M. Differences in spatial patterns of drought on different time sales. An analysis of the Iberian Peninsula. Water Resour. Manag. 2006, 20, 37–60. [Google Scholar] [CrossRef]
- Li, S.; Xiong, L.H.; Dong, L.H.; Zhang, J. Effects of the three gorges reservoir on the hydrological droughts at the downstream yichang station during 2003–2011. Hydrol. Process. 2013, 27, 3981–3993. [Google Scholar] [CrossRef]
- Leblanc, M.J.; Tregoning, P.; Ramillien, G.; Tweed, S.O.; Fakes, A. Basin-scale, integrated observations of the early 21st century multiyear drought in Southeast Australia. Water Resour. Res. 2009. [Google Scholar] [CrossRef]
- Loukas, A.; Vasiliades, L. Probabilistic analysis of drought spatiotemporal characteristics in Thessaly region, Greece. Nat. Hazards Earth Syst. Sci. 2004, 4, 719–731. [Google Scholar] [CrossRef]
- Zhang, Q.; Li, J.F.; Singh, V.P.; Xu, C.Y.; Deng, J.Y. Influence of ENSO on precipitation in the East River basin, South China. J. Geophys. Res. D: Atmos. 2013, 118, 2207–2219. [Google Scholar] [CrossRef]
- Kisaka, O.; Mucheru-Muna, M.; Ngetich, F.; Mugwe, J.N.; Mugendi, D.; Mairura, F. Rainfall variability, drought characterization and efficacy of rainfall data reconstruction: Case of Eastern, Kenya. Adv. Meteorol. 2014. [Google Scholar] [CrossRef]
- Guttman, N.B. Comparing the Palmer drought index andthe standardized precipitation index. J. Am. Water Resour. Assoc. 1998, 34, 113–121. [Google Scholar] [CrossRef]
- Jones, P.D.; Hulme, M. Calculating regional climatic time series for temperature and precipitation: Methods and illustrations. Int. J. Climatol. 1996, 16, 361–377. [Google Scholar] [CrossRef]
- Patel, N.R.; Chorpa, P.; Dadhwal, V.K. Spatiotemporal analysis of meteorological drought variability in the Indian region using standardized precipitation index. Meteorol. Appl. 2007, 14, 329–336. [Google Scholar] [CrossRef]
- Vicente-Serrano, S.M.; Beguería, S.; López-Moreno, J.I. A multiscalar drought index sensitive to global warming: The standardized precipitation evapotranspiration index. J. Clim. 2010, 23, 1696–1718. [Google Scholar] [CrossRef]
- Oladipo, E.O. A comparative performance analysis of three meteorological drought indices (Nebraska). J. Climatol. 1985, 5, 655–664. [Google Scholar] [CrossRef]
- Mishra, A.K.; Singh, V.P. A review of drought concepts. J. Hydrol. 2010, 391, 202–216. [Google Scholar] [CrossRef]
- Zhang, Q.; Zou, X.K.; Xiao, F.J. Classification of Meteorological Droughts, GB/T20481-2006; Standards Press of China: Beijing, China, 2006; pp. 1–17. [Google Scholar]
- Liu, M.; Xu, X.; Sun, A.Y.; Wang, K.; Liu, W.; Zhang, X. Is southwestern China experiencing more frequent precipitation extremes? Environ. Res. Lett. 2014, 9, 064002. [Google Scholar] [CrossRef]
- Liu, M.; Xu, X.; Sun, A. Decreasing spatial variability in precipitation extremes in southwestern China and the local/large-scale influencing factors. J. Geophys. Res.: Atmos 2015. [Google Scholar] [CrossRef]
- Ma, Z.G.; Fu, Z.B. Facts on the drying trend of northern China during 1951–2004. Chin. Sci. Bull. 2006, 51, 2429–2439. [Google Scholar] [CrossRef]
- Liu, X.R.; Li, G.P.; Fan, G.Z.; Gheng, B.Y.; Li, H.Q. Spatial and Temporal Characteristics of Precipitation Resource in Southwest China during 1961–2000. J. Nat. Resour. 2007, 22, 783–792. [Google Scholar]
- Liu, X.Y.; Li, D.L.; Wang, J.S. Spatiotemporal characteristics of droughts over China during 1961–2009. J. Desert Res. 2012, 32, 473–483. [Google Scholar]
- Ma, J.H. The revelation and Countermeasure of drought disaster in Southwest China. J. Yangtze River. 2010, 41, 7–12. [Google Scholar]
- Li, Y.B.; Hou, J.J.; Xie, D.T. The recent development of research on karst ecology in Southwest China. Sci. Geogr. Sin. 2002, 22, 365–370. [Google Scholar]
- China Meteorological Data Sharing Service System. Available online: http://cdc.nmic.cn/home.do (accessed on 2 October 2015).
- Michael, F.H.; Xu, T.B. Anusplin Version 4.4 User Guide; The Australian National University, Fenner School of Environment and Society: Canberra, Australia, 2013. [Google Scholar]
- Fleming, M.D.; Chapin, F.S.; Cramer, W.; Hufford, G.L.; Serreze, M.C. Geographic patterns and dynamics of Alaskan climate interpolated from a sparse station record. Glob. Change Biol. 2000, 6, 49–58. [Google Scholar] [CrossRef]
- Liu, Z.J.; Yu, X.X.; Wang, S.S.; Shang, G.D. Comparative analysis of three covariates methods in Thin-Plate Smoothing Splines for interpolating precipitation. Progr. Geogr. 2012, 31, 56–62. [Google Scholar]
- He, B.; Lu, A.F.; Wu, J.J.; Zhao, L.; Liu, M. Drought hazard assessment and spatial characteristics analysis in China. J. Geogr. Sci. 2011. [Google Scholar] [CrossRef]
- Qian, Y.L.; Lu, H.Q.; Zhang, Y.H. Application and assessment of spatial interpolation method on daily meteorological elements based on ANUSPLIN software. J. Meteorol. Environ. 2010, 26, 7–15. [Google Scholar]
- Michael, F.H. Interpolation of Rainfall Data with Thin Plate Smoothing Splines—Part I: Two Dimensional Smoothing of Data with Short Range Correlation. J. Geogr. Inf. Decis. Anal. 1998, 2, 139–151. [Google Scholar]
- David, T.P.; Daniel, W.M.; Ian, A.N.; Michael, F.H.; Jennifer, L.K. A comparison of two statistical methods for spatial interpolation of Canadian monthly mean climate data. Agric. For. Meteorol. 2000, 101, 81–94. [Google Scholar]
- Bao, Y.X.; Meng, C.L.; Shen, S.H.; Qiu, X.F.; Gao, P.; Liu, C. Temporal and spatial patterns of droughts for recent 50 years in Jiangsu based on meteorological drought composite index. Acta Geogr. Sin. 2011, 66, 599–608. [Google Scholar]
- Li, Y.J.; Ren, F.M.; Li, Y.P.; Wang, P.L.; Yan, H.M. Characteristics of the regional meteorological drought events in Southwest China during 1960–2010. J. Meteorol. Res. 2014, 28, 381–392. [Google Scholar] [CrossRef]
- Xu, K.; Yang, D.W.; Xu, X.Y.; Lei, H.M. Copula based drought frequency analysis considering the spatio-temporal variability in Southwest China. J. Hydrol. 2015, 527, 630–640. [Google Scholar] [CrossRef]
© 2015 by the authors; licensee MDPI, Basel, Switzerland. This article is an open access article distributed under the terms and conditions of the Creative Commons Attribution license (http://creativecommons.org/licenses/by/4.0/).