
Exploring Promising Research Frontiers Based on Knowledge Maps in the Solar Cell Technology Field


Abstract
:1. Introduction
2. Methods
2.1. Background
2.1.1. Research Frontier
2.1.2. Bibliometric Analysis
2.1.3. Knowledge Map
2.2. Research Methodology
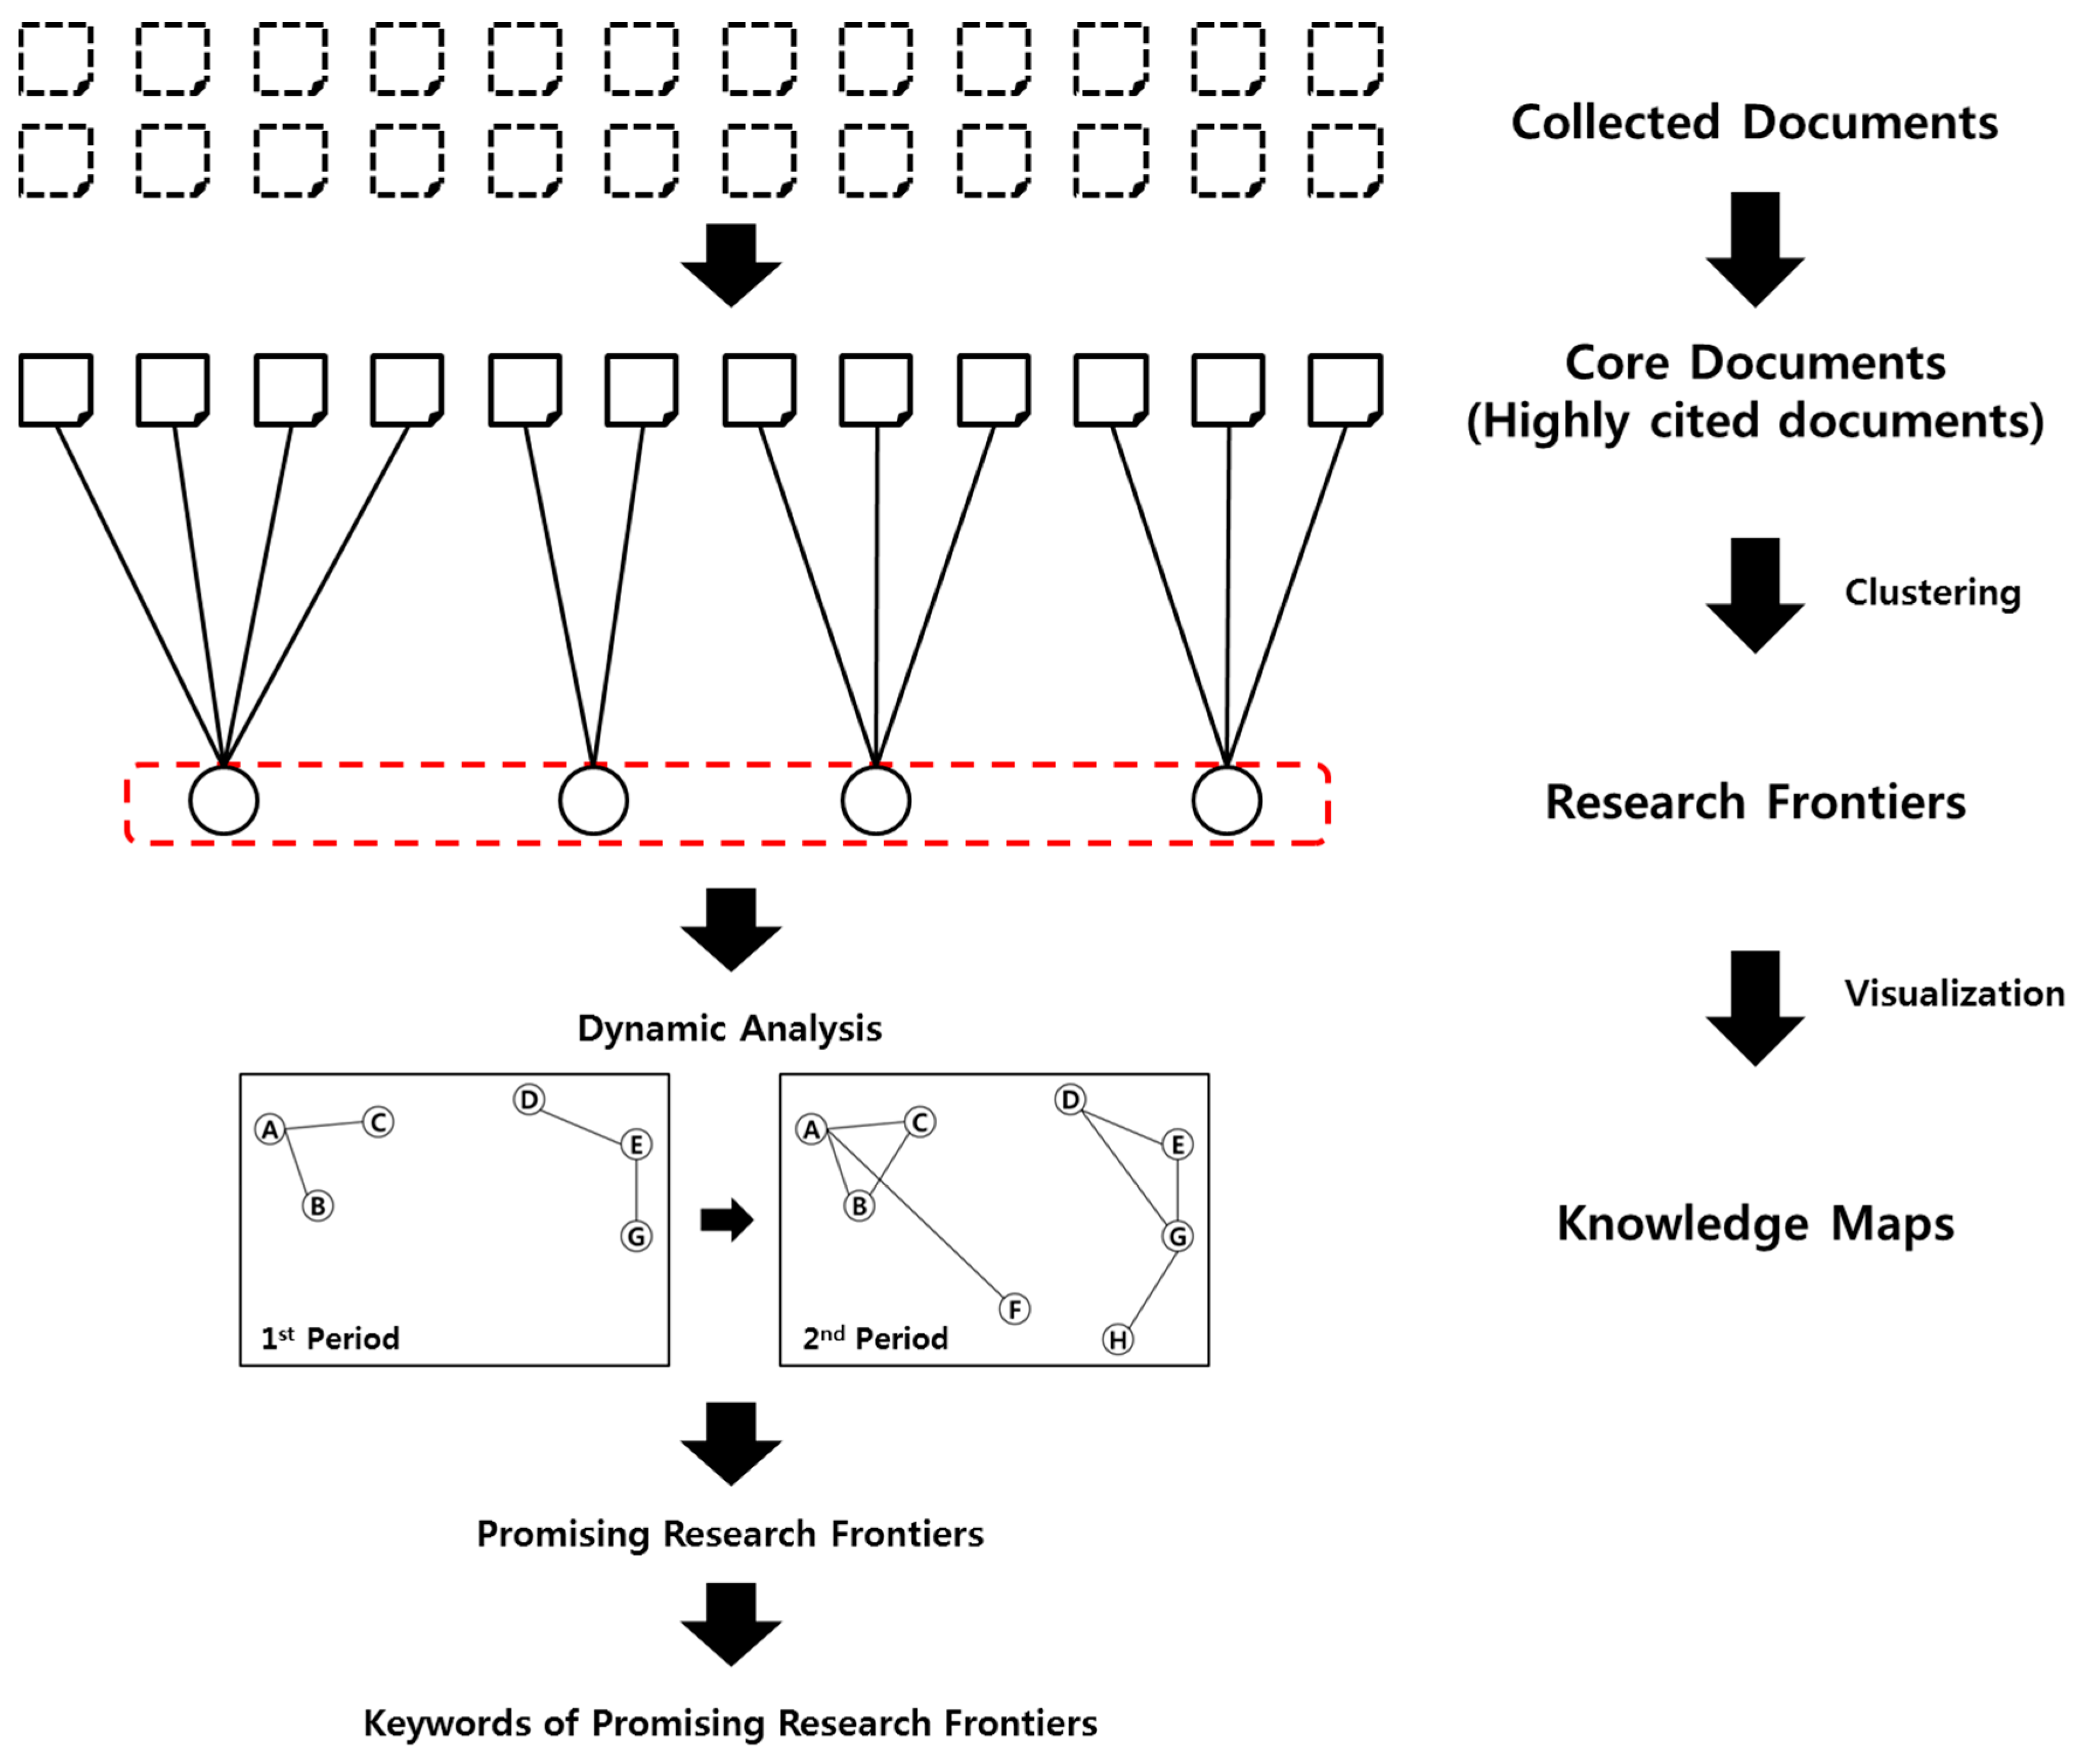
2.2.1. Research Concept

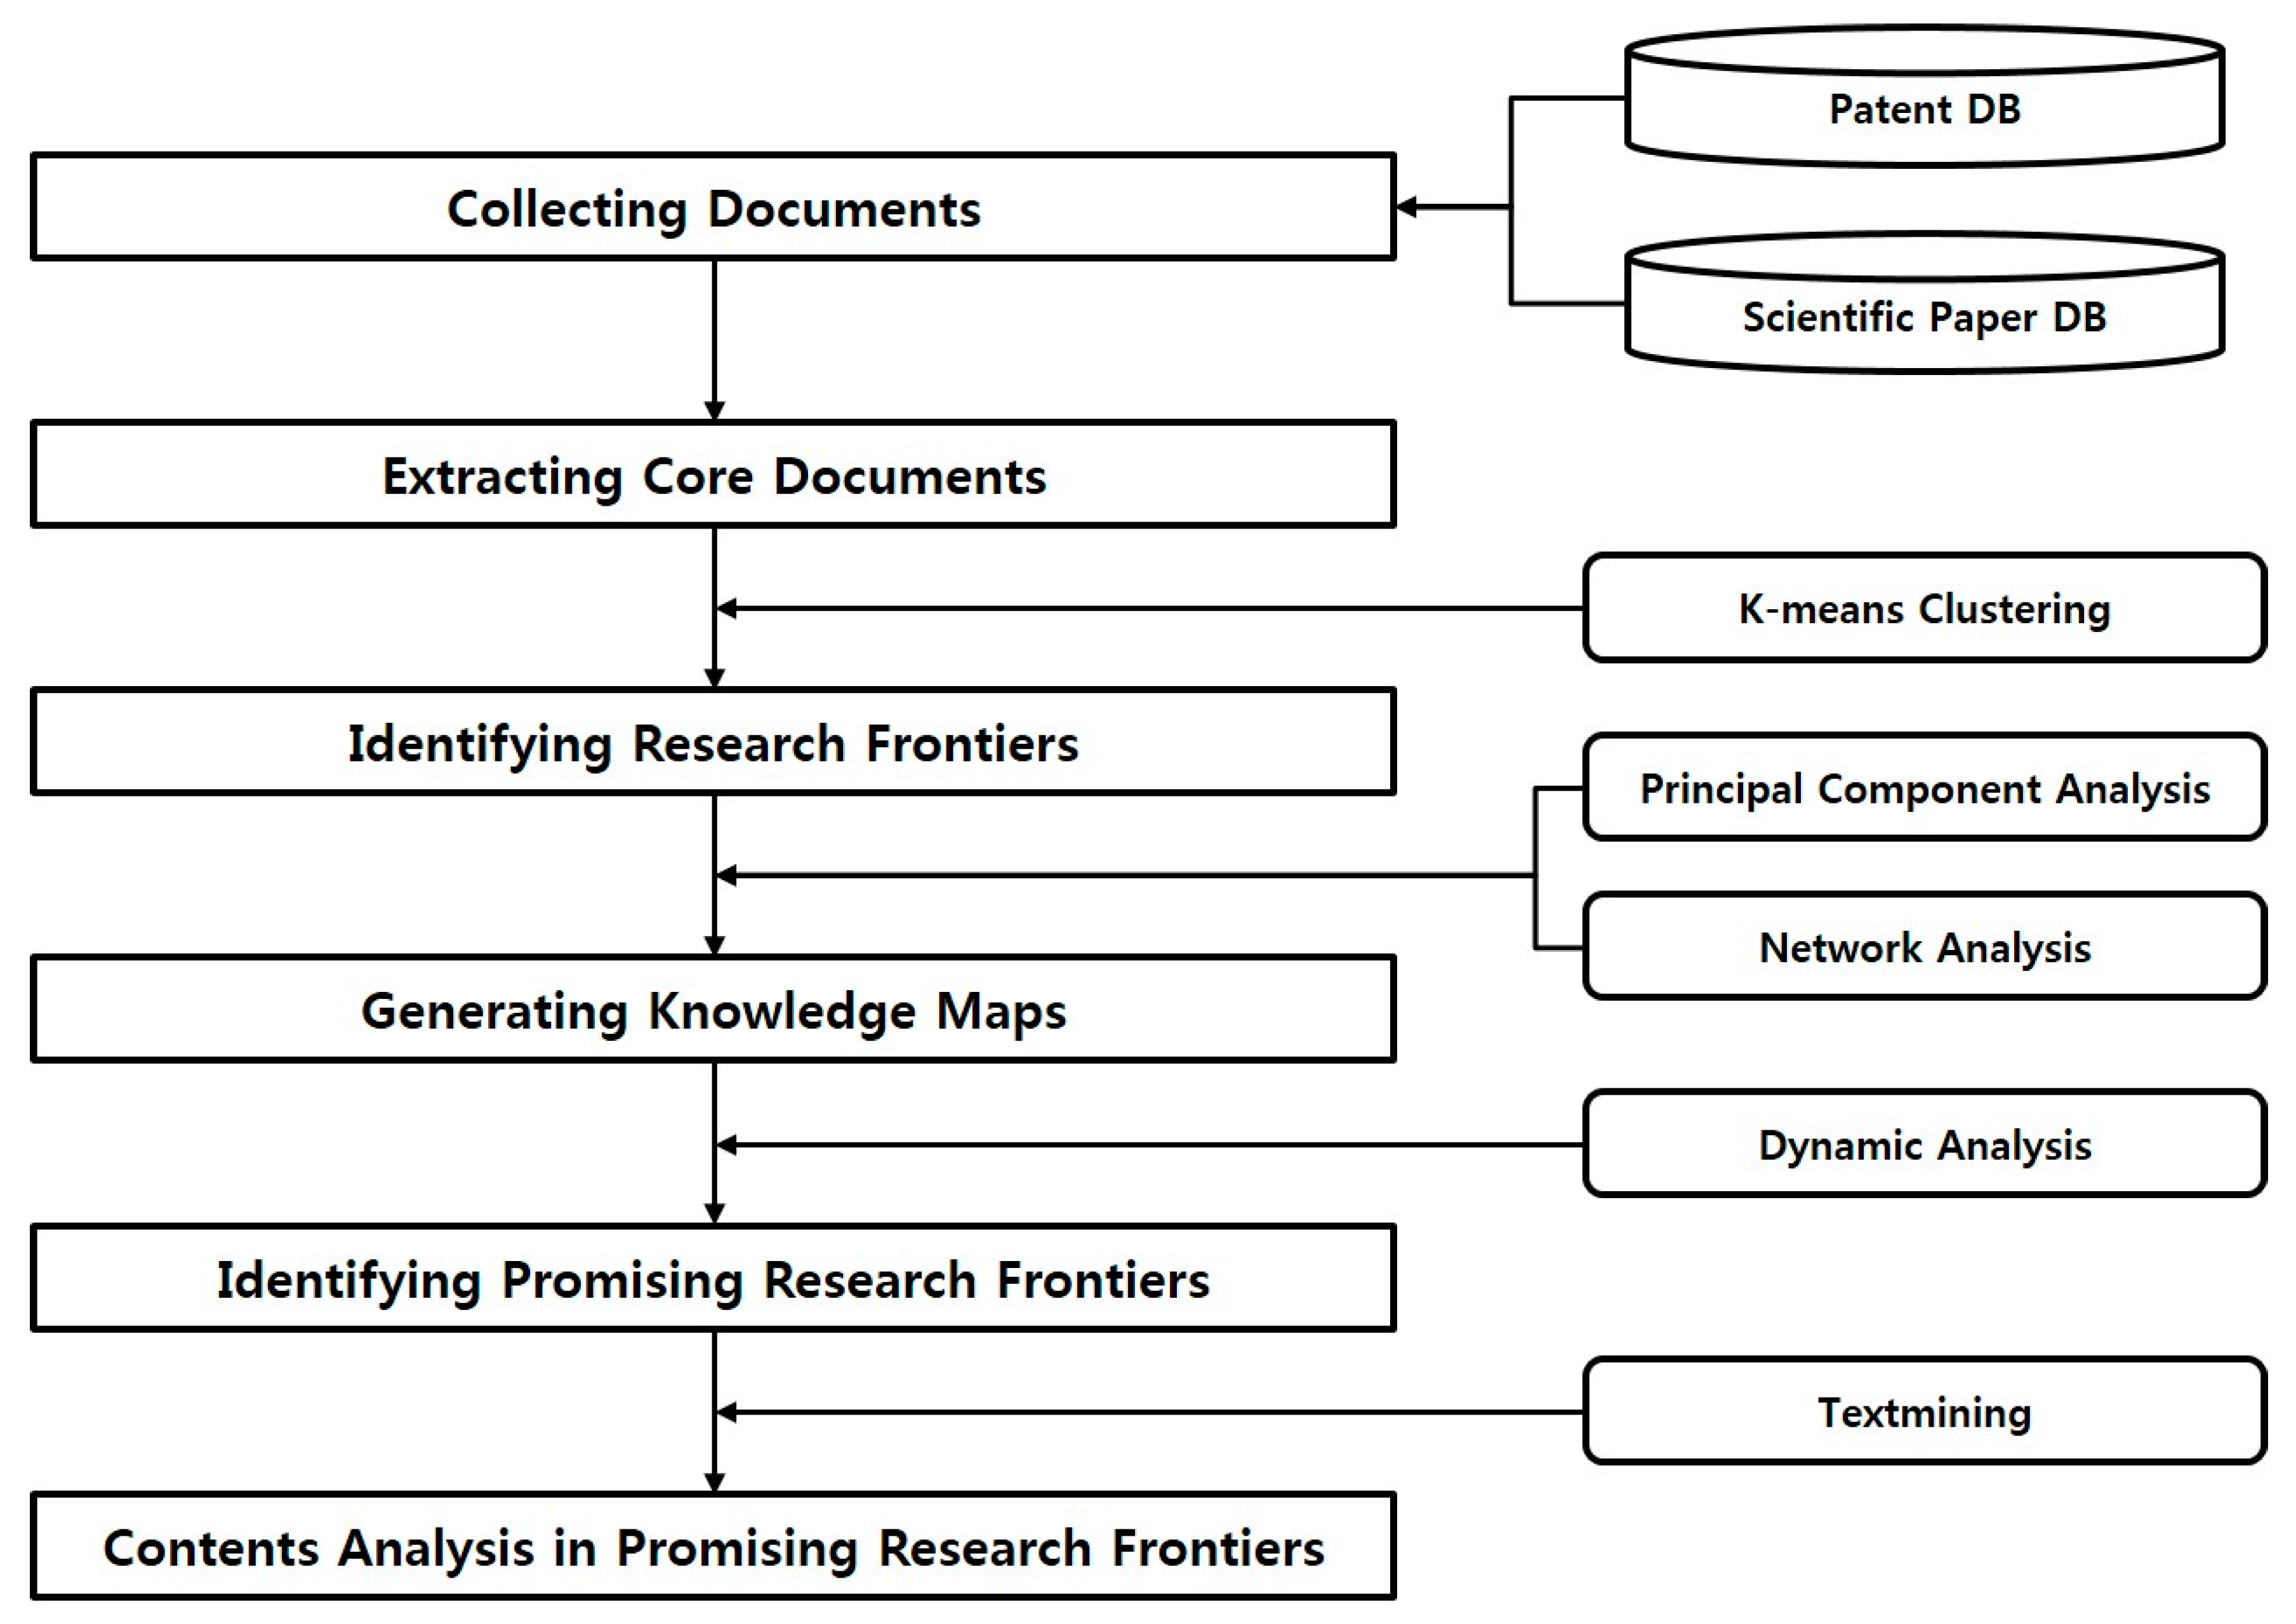
2.2.2. Research Framework

2.2.3. Detailed Procedures
Data Collection
Core Documents Extraction
Research Frontiers Identification

| Ref. 1 | Ref. 2 | … | Ref. n − 1 | Ref. n | |
|---|---|---|---|---|---|
| Doc. 1 | 1 | 1 | … | 0 | 0 |
| Doc. 2 | 0 | 0 | … | 1 | 1 |
| … | … | … | … | … | … |
| Doc. n − 1 | 0 | 1 | … | 0 | 0 |
| Doc. n | 0 | 1 | … | 0 | 1 |
Knowledge Maps Generation

| Ref. 1 | Ref. 2 | … | Ref. n − 1 | Ref. n | |
|---|---|---|---|---|---|
| RF 1 | 2 | 0 | … | 10 | 0 |
| RF 2 | 0 | 0 | … | 3 | 1 |
| … | … | … | … | … | … |
| RF n − 1 | 0 | 1 | … | 0 | 3 |
| RF n | 0 | 12 | … | 9 | 4 |
| Doc. 1 | Doc. 2 | … | Doc. n − 1 | Doc. n | |
|---|---|---|---|---|---|
| Doc. 1 | 2 | 0 | … | 10 | 0 |
| Doc. 2 | 0 | 5 | … | 1 | 12 |
| … | … | … | … | … | … |
| Doc. n − 1 | 10 | 1 | … | 12 | 9 |
| Doc. n | 0 | 12 | … | 9 | 4 |
| RF 1 | RF 2 | … | RF n − 1 | RF n | |
|---|---|---|---|---|---|
| RF 1 | 1 | 0.56 | … | 0.76 | 0.32 |
| RF 2 | 0.56 | 1 | … | 0.44 | 0.67 |
| … | … | … | … | … | … |
| RF n − 1 | 0.76 | 0.44 | … | 1 | 0.11 |
| RF n | 0.32 | 0.67 | … | 0.11 | 1 |
Promising Research Frontiers Identification
Contents Analysis in Promising Research Frontiers
3. Results
3.1. Data Collection and Core Documents Extraction
| Citation Frequency | Number of Patent | Cumulative Number of Patent | Rate | Cumulative Rate |
|---|---|---|---|---|
| 91 | 1 | 1 | 0.06% | 0.06% |
| 72 | 1 | 2 | 0.06% | 0.12% |
| 62 | 1 | 3 | 0.06% | 0.18% |
| …… | …… | …… | …… | …… |
| …… | …… | …… | …… | …… |
| 5 | 35 | 175 | 2.10% | 10.49% |
| 4 | 52 | 227 | 3.12% | 13.61% |
| 3 | 70 | 297 | 4.20% | 17.81% |
| 2 | 146 | 443 | 8.75% | 26.56% |
| 1 | 269 | 712 | 16.13% | 42.69% |
| 0 | 956 | 1668 | 57.31% | 100.00% |
| Total | 1668 | 100.00% |
| Citation Frequency | Number of Paper | Cumulative Number of Paper | Rate | Cumulative Rate |
|---|---|---|---|---|
| 1686 | 1 | 1 | 0.01% | 0.01% |
| 1675 | 1 | 2 | 0.01% | 0.02% |
| …… | …… | …… | …… | …… |
| …… | …… | …… | …… | …… |
| 194 | 1 | 131 | 0.01% | 1.00% |
| …… | …… | …… | …… | …… |
| …… | …… | …… | …… | …… |
| 2 | 1072 | 9836 | 8.14% | 74.73% |
| 1 | 1244 | 11,080 | 9.45% | 84.18% |
| 0 | 2082 | 13,162 | 15.82% | 100.00% |
| Total | 13,162 | 100.00% |
3.2. Research Frontiers
| Research Area (RA) | RF No. | Research Frontier (RF) | Core Patent Frequency |
|---|---|---|---|
| Crystalline silicon solar cell | RF2 | Back contact-type solar cell | 1 |
| RF3 | Back side contact solar cell | 1 | |
| RF7 | Contact for a photovoltaic cell | 1 | |
| RF9 | Crystal silicon solar cell | 1 | |
| RF14 | Hetero-junction crystalline silicon solar cell | 2 | |
| RF20 | Metal contact structure for solar cell | 1 | |
| RF25 | Poly silicon ingot | 1 | |
| RF27 | Process and system for semiconductor wafer | 1 | |
| RF30 | Single crystal silicon solar cell | 5 | |
| RF32 | Solar cell contact formation | 1 | |
| RF39 | Texturing silicon surface in solar cell | 1 | |
| RF45 | High-efficiency crystalline silicon solar cell | 2 | |
| Thin film solar cell | RF4 | Bifacial thin film solar cell | 1 |
| RF5 | Bulkheterojunction thin film solar cell | 1 | |
| RF6 | CIGS based thin film | 10 | |
| RF8 | Contact layers for thin film solar cells | 2 | |
| RF13 | Forming crystalline layer | 1 | |
| RF15 | Integrated thin-film solar cell | 2 | |
| RF17 | Large-scale production of thin-film solar cells | 2 | |
| RF19 | Material for thin film photovoltaic cell fabrication | 2 | |
| RF21 | Multijunction thin film solar cell | 3 | |
| RF24 | Photovoltaic module architecture | 7 | |
| RF29 | Silicon based thin film solar cell | 2 | |
| RF37 | Tandem-type thin film solar cell | 2 | |
| RF41 | Thin film solar cell manufacturing | 21 | |
| RF42 | Thin film solar cell module | 2 | |
| RF43 | Three-dimensional thin-film solar cells | 6 | |
| RF44 | Treatment of thin film photovoltaic cell | 8 | |
| Organic/ quantum dot/nano convergent solar cell | RF1 | A process for producing metal oxide thin films | 1 |
| RF10 | Dye-sensitized solar cell | 14 | |
| RF22 | Nano- solar cells | 7 | |
| RF23 | Organic solar cell | 15 | |
| RF28 | Quantum dot solar cell | 9 | |
| RF40 | Thin film of organometallic compound | 1 | |
| The other solar cell | RF11 | Electrode for photovoltaic cells | 9 |
| RF12 | Forming a tiled substrate structure | 1 | |
| RF16 | Laminated solar battery | 1 | |
| RF18 | Manufacturing method for solar modules | 11 | |
| RF26 | Power generation system | 1 | |
| RF31 | solar arrays | 3 | |
| RF33 | Substrate and collector grid structures | 5 | |
| RF34 | Substrate for transparent electrodes | 1 | |
| RF35 | Sunlight detecting system | 1 | |
| RF36 | System for cleaning surface of solar cell | 1 | |
| RF38 | Terminal box | 3 |
| Research Area (RA) | RF No. | Research Frontier (RF) | Core Paper Frequency |
|---|---|---|---|
| Crystalline silicon solar cell | RF30 | Single crystal silicon solar cell | 1 |
| RF45 | High-efficiency crystalline silicon solar cell | 8 | |
| Thin film solar cell | RF5 | Bulkheterojunction thin film solar cell | 17 |
| RF19 | Material for thin film photovoltaic cell fabrication | 1 | |
| RF37 | Tandem-type thin film solar cell | 2 | |
| RF41 | Thin film solar cell manufacturing | 3 | |
| Organic/quantum dot/nano convergent solar cell | RF10 | Dye-sensitized solar cell | 24 |
| RF22 | Nano- solar cells | 15 | |
| RF23 | Organic solar cell | 13 | |
| RF28 | Quantum dot solar cell | 5 | |
| The other solar cell | RF11 | Electrode for photovoltaic cells | 1 |
| RF46 | Polymer solar cell | 34 | |
| RF47 | Plasmonic solar cell | 4 | |
| RF48 | Mesoscopic solar cell | 1 | |
| RF49 | Solar water splitting | 1 |
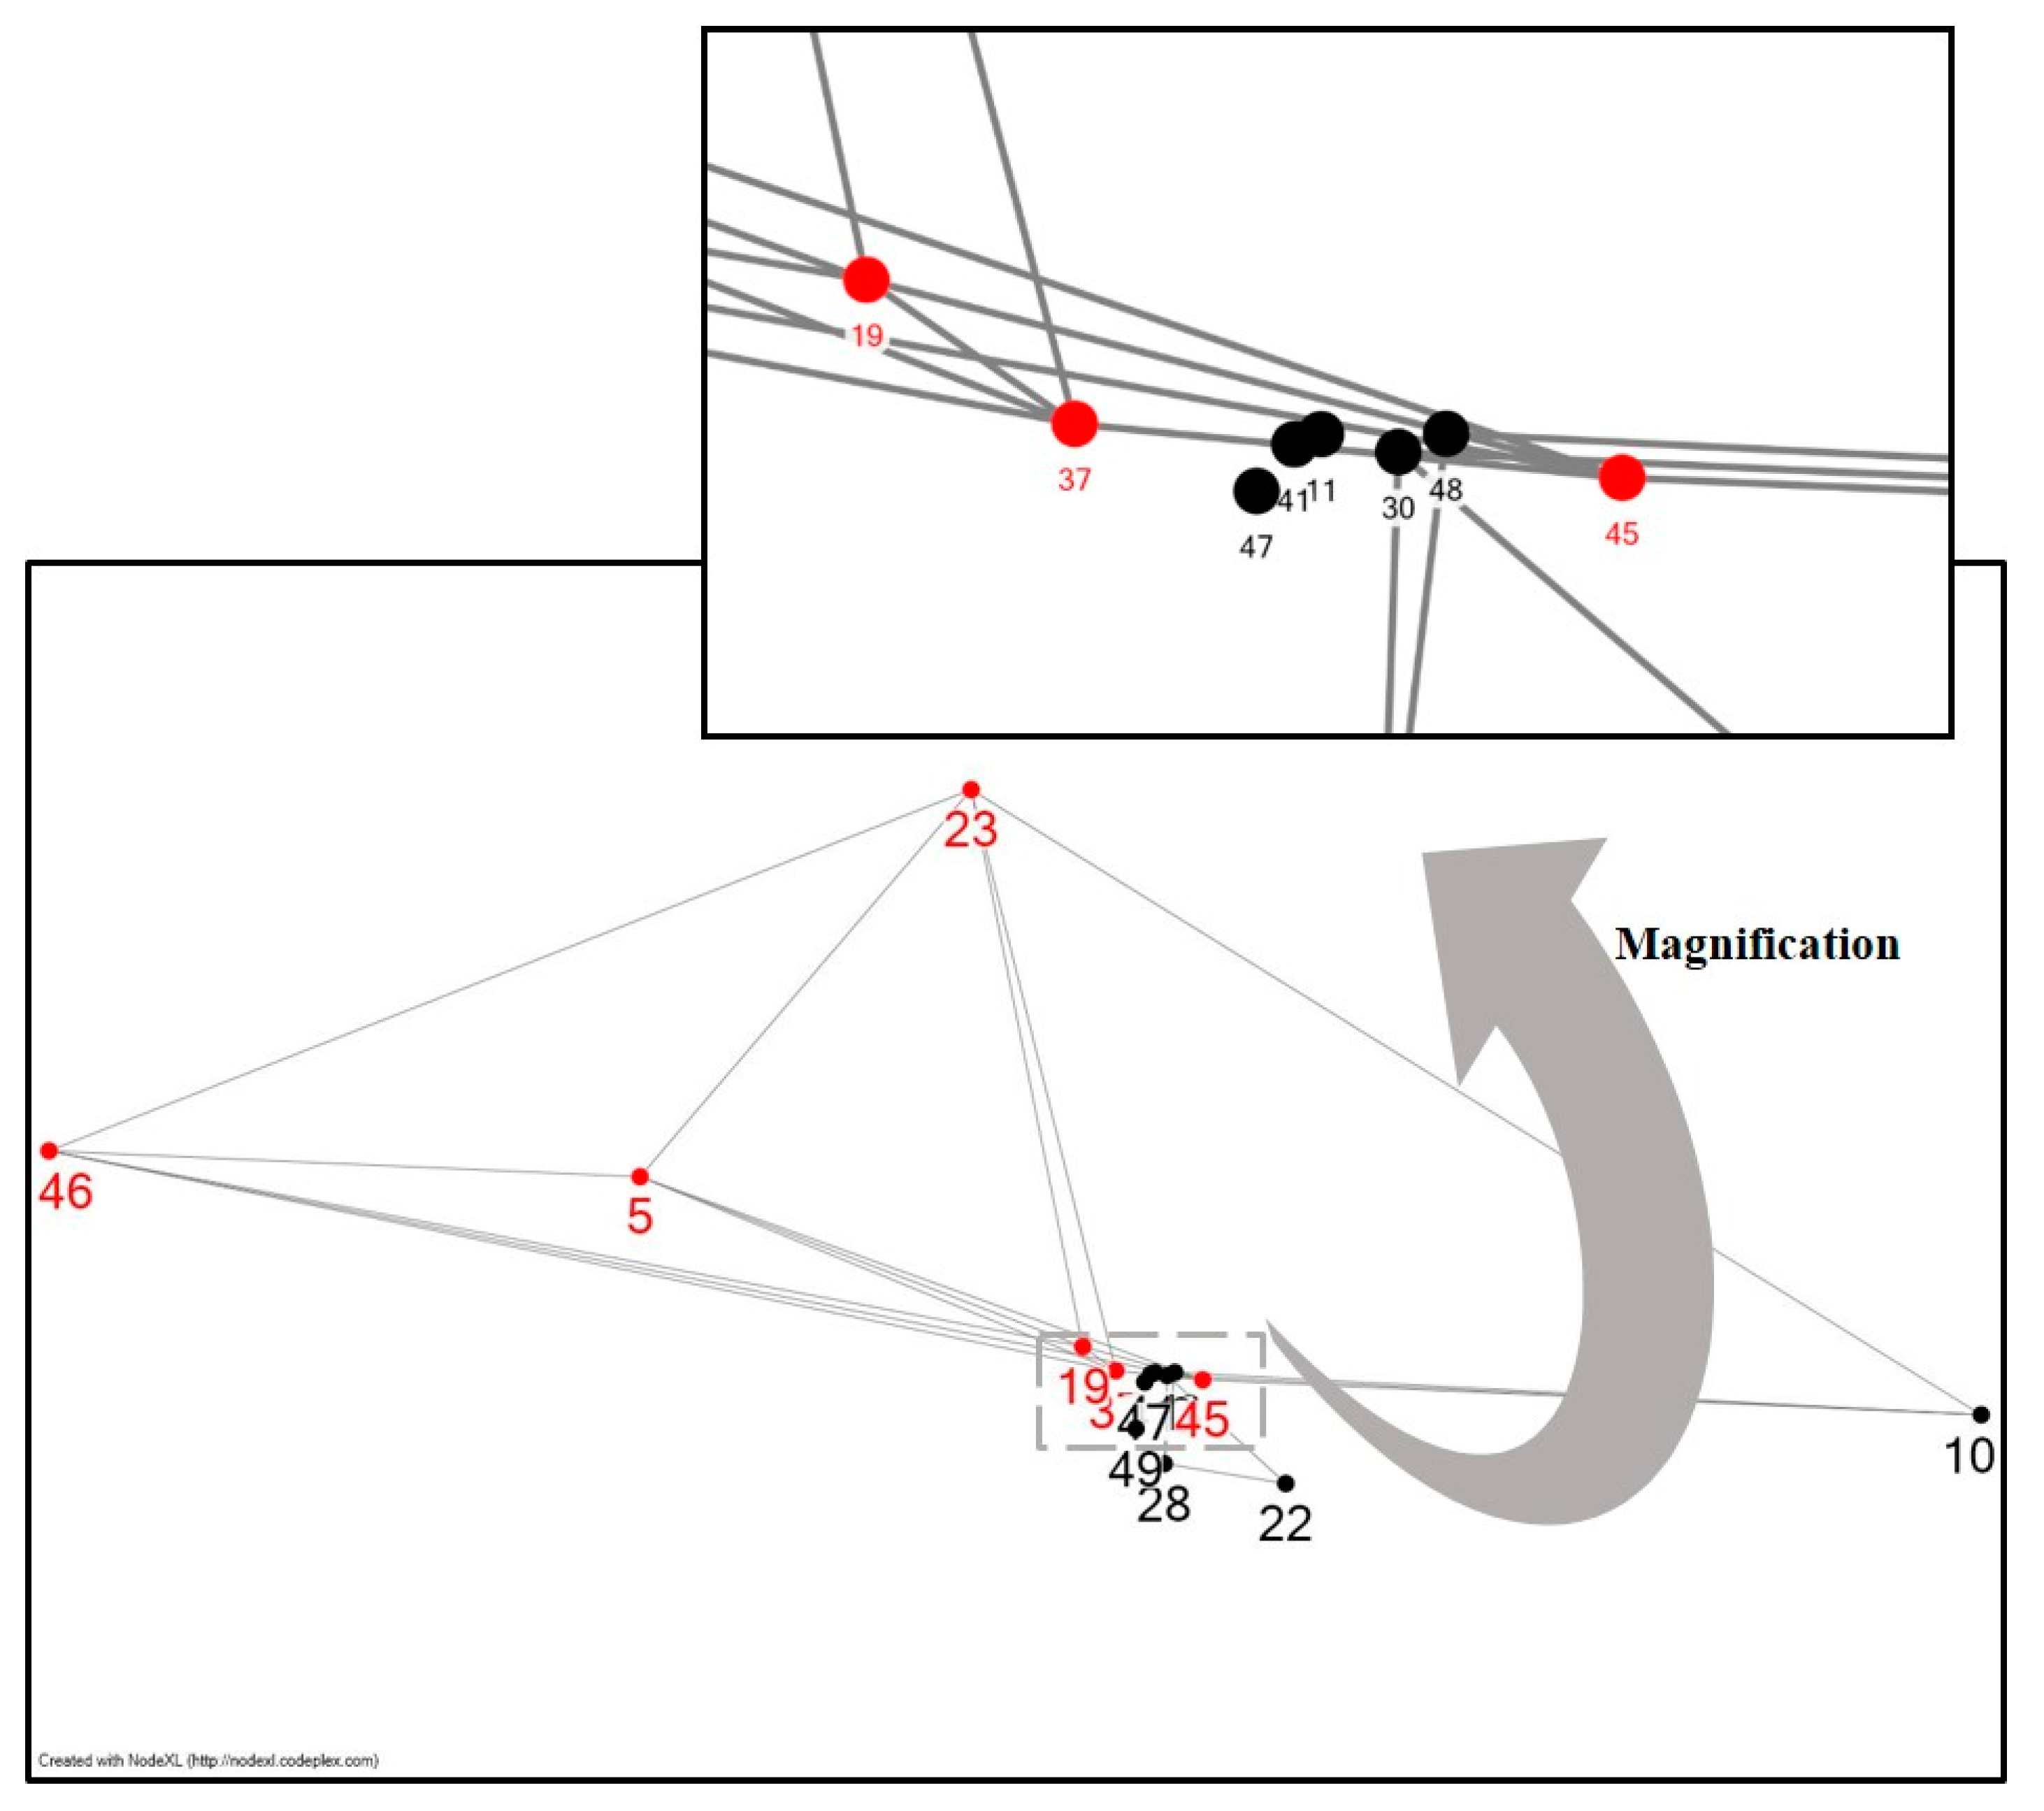
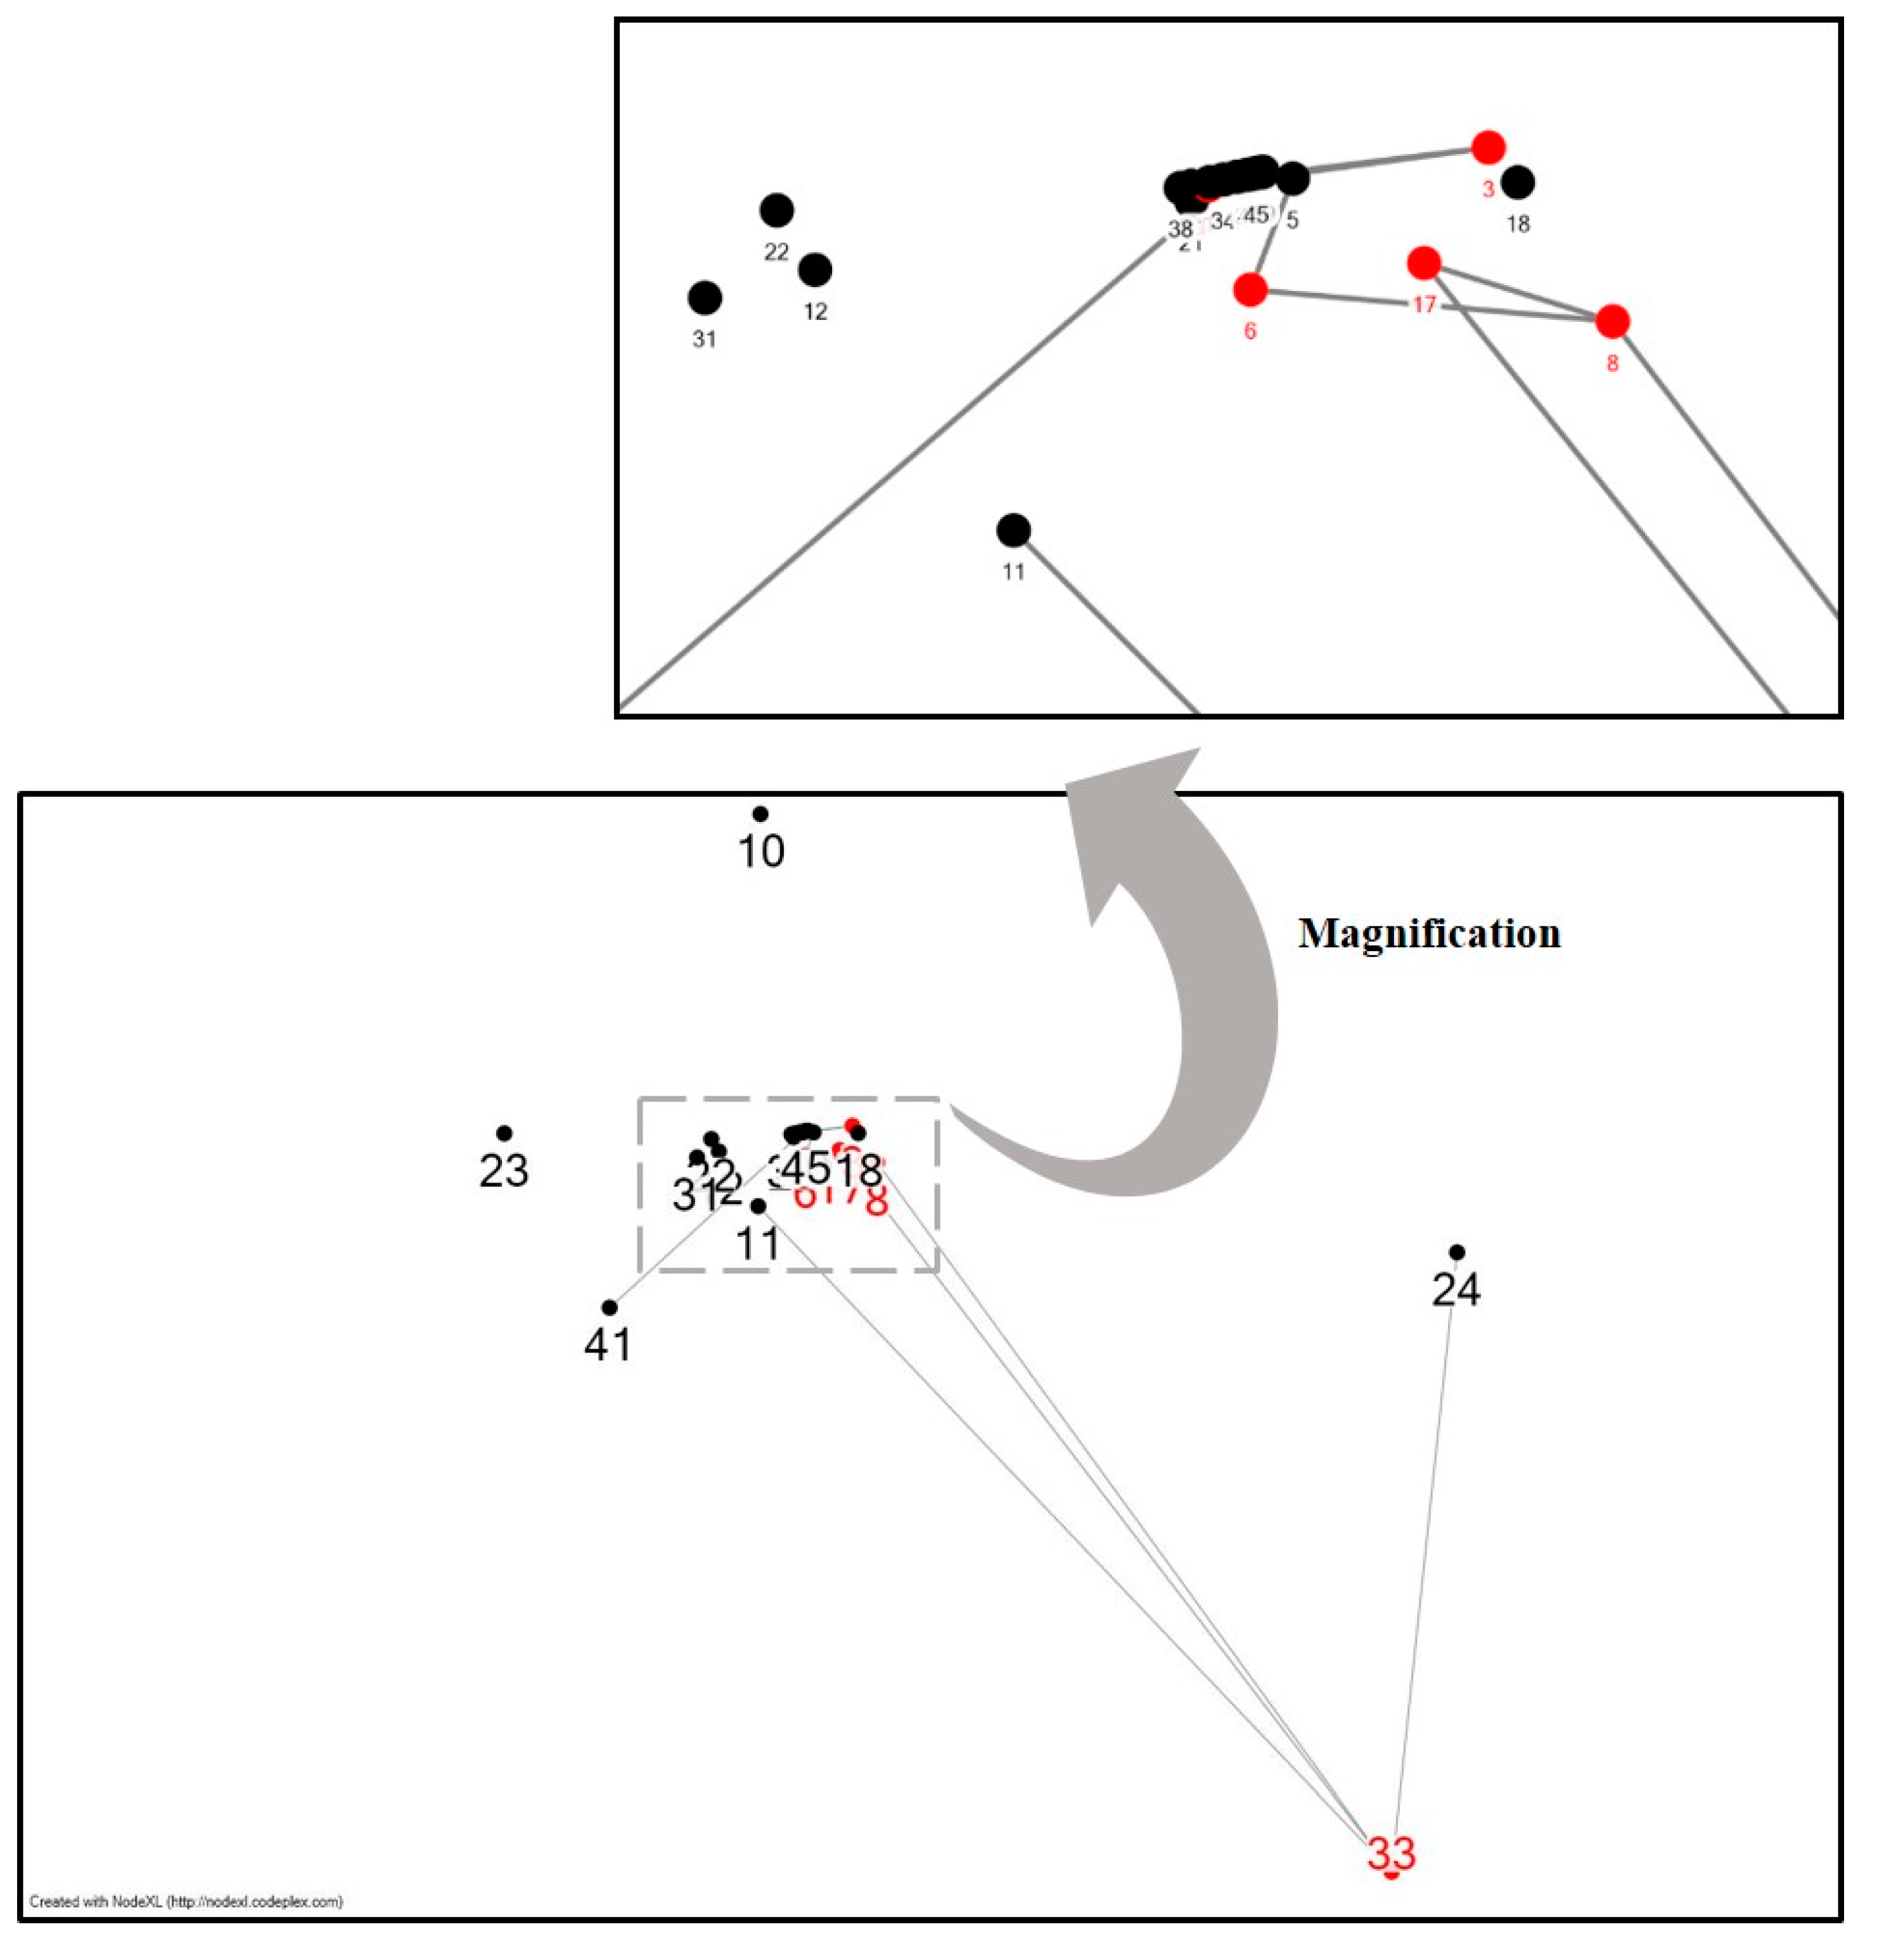
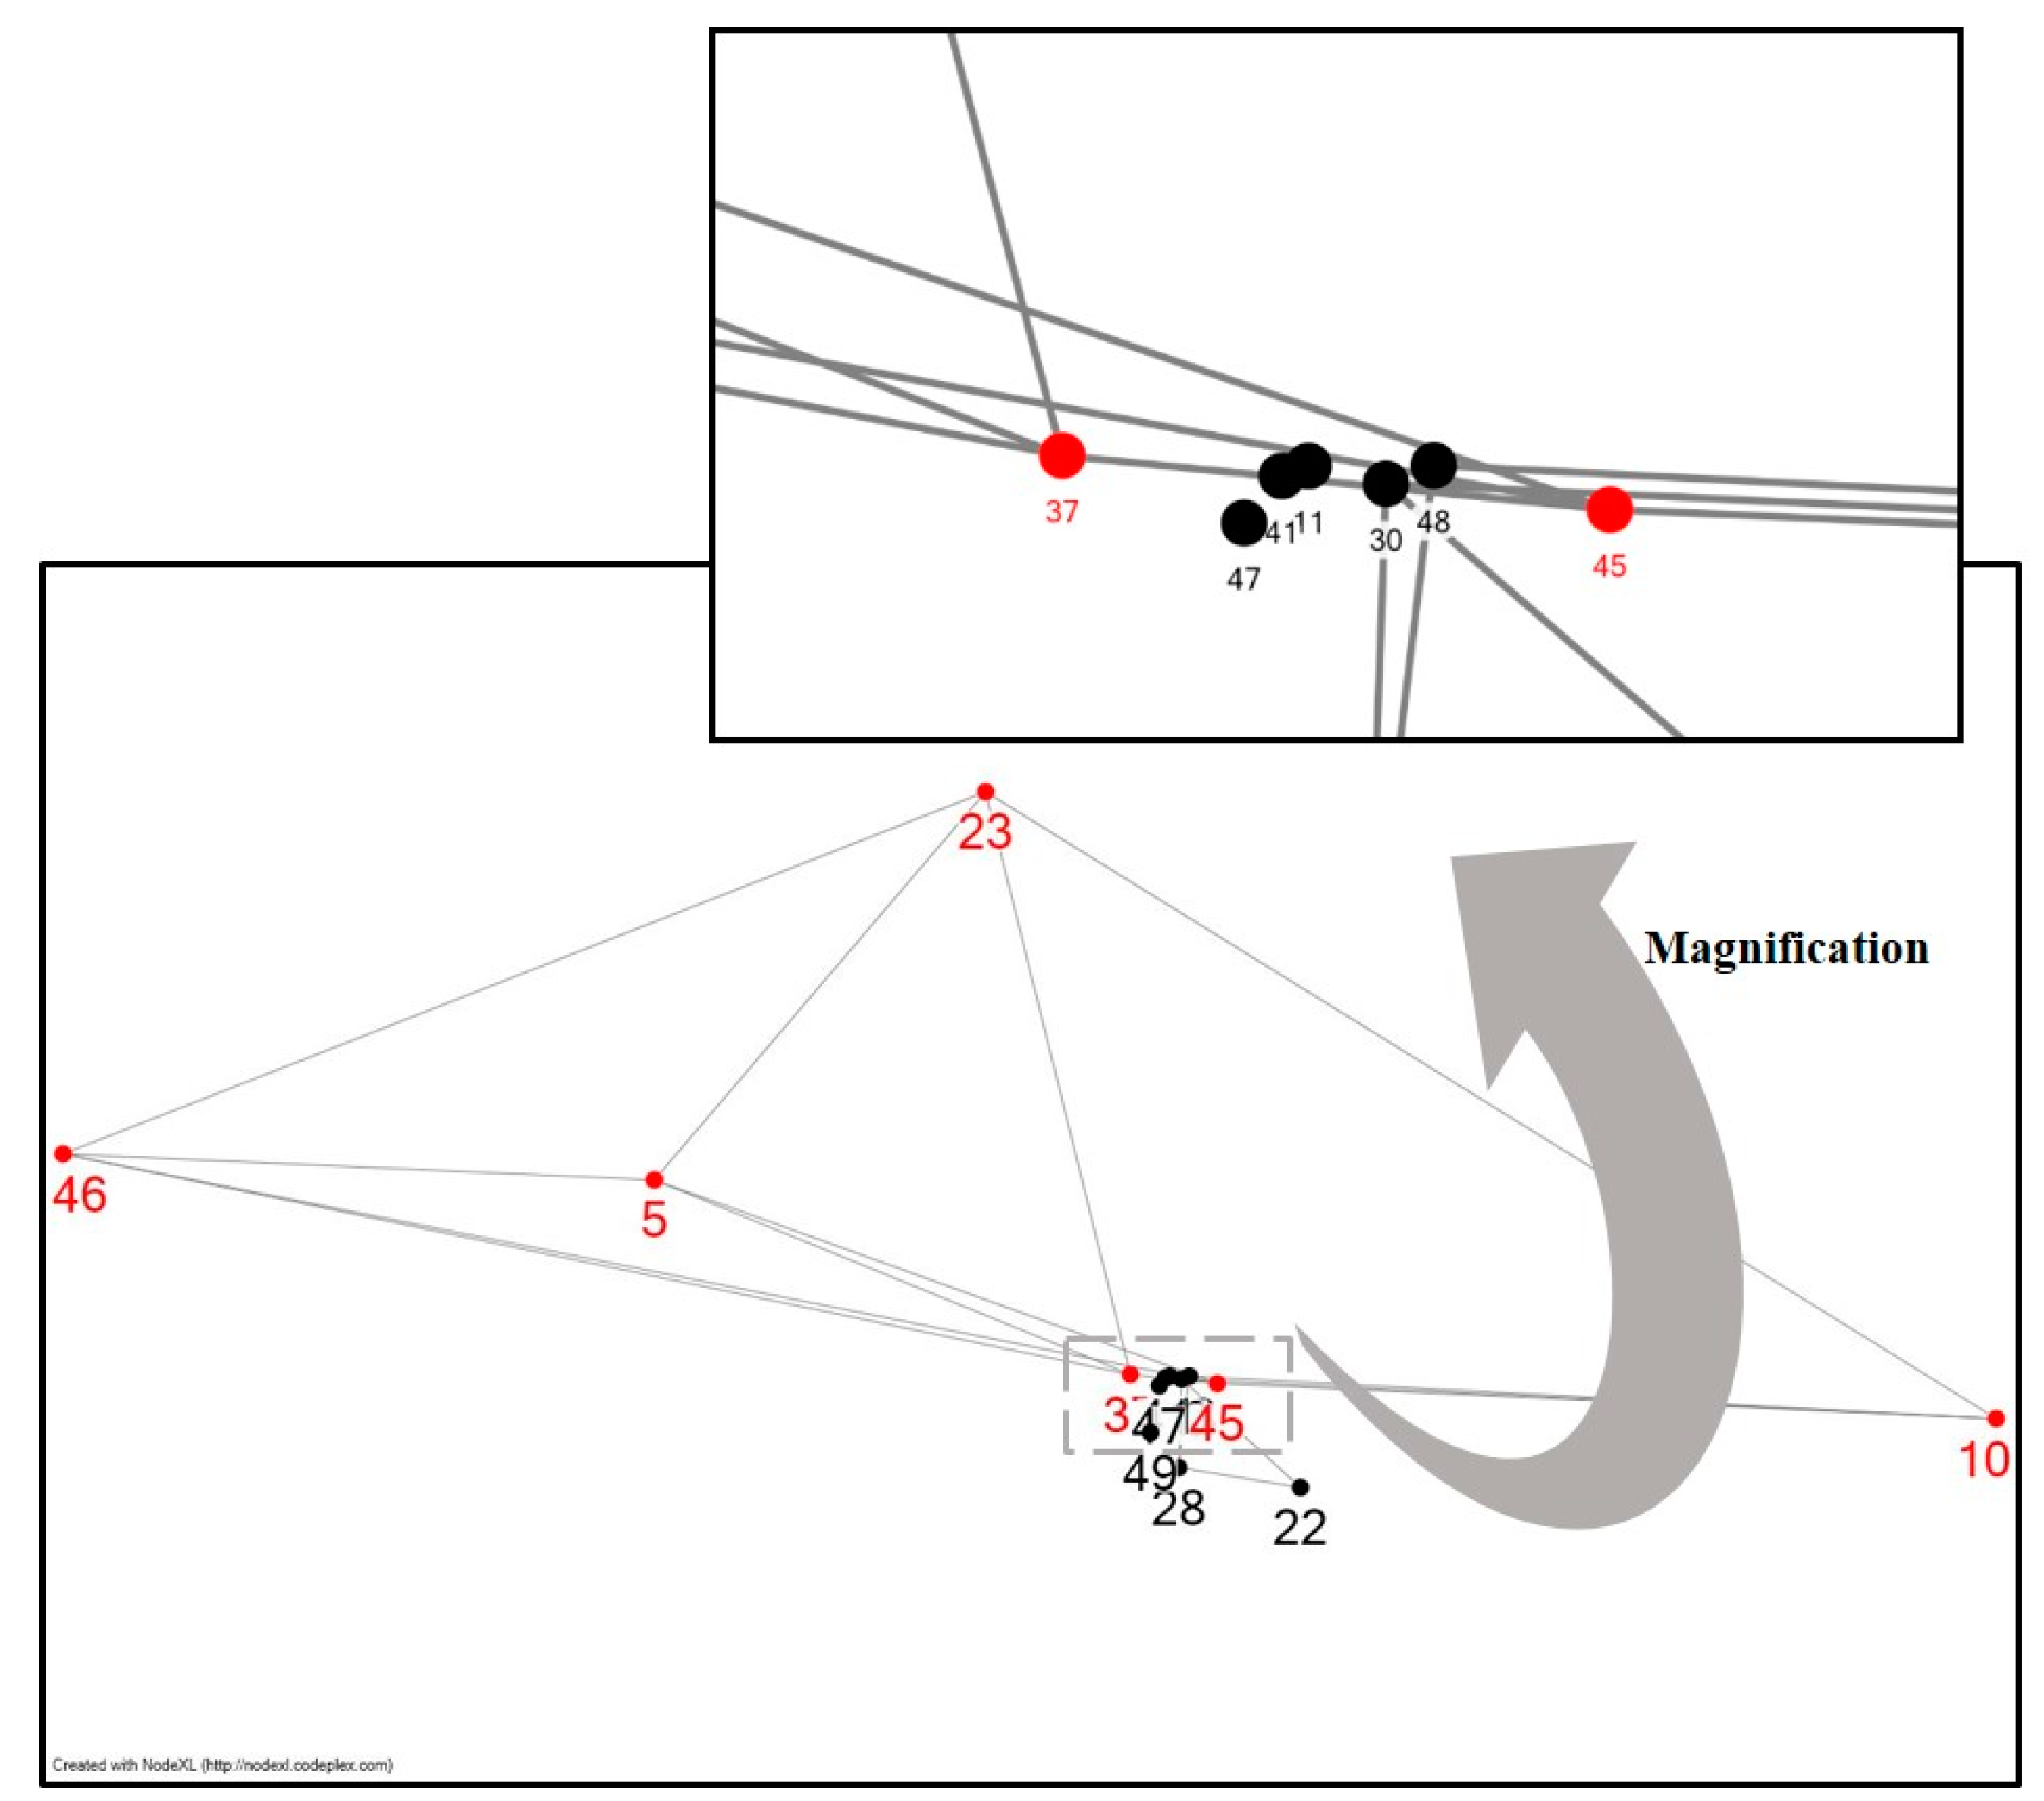
3.3. Knowledge Maps

| RF No. | Core Research Frontier | Degree Centrality | Types of Technology |
|---|---|---|---|
| RF33 | Substrate and collector grid structures | 0.1364 | Structure |
| RF3 | Back side contact solar cell | 0.0909 | Structure |
| RF6 | CIGS based thin film | 0.0909 | Material |
| RF8 | Contact layers for thin film solar cells | 0.0909 | Structure |
| RF14 | Hetero-junction crystalline silicon solar cell | 0.0909 | Structure |
| RF20 | Metal contact structure for solar cell | 0.0909 | Structure |
| RF30 | Single crystal silicon solar cell | 0.0909 | Structure |
| RF44 | Treatment of thin film photovoltaic cell | 0.0909 | Method |

| RF No. | Core Research Frontier | Degree Centrality | Types of Technology |
|---|---|---|---|
| RF5 | Bulkheterojunction thin film solar cell | 0.3333 | Structure |
| RF19 | Material for thin film photovoltaic cell fabrication | 0.3333 | Material |
| RF23 | Organic solar cell | 0.3333 | Attribute |
| RF37 | Tandem-type thin film solar cell | 0.3333 | Structure |
| RF45 | High-efficiency crystalline silicon solar cell | 0.3333 | Method |
| RF46 | Polymer solar cell | 0.3333 | Attribute |
3.4. Promising Research Frontiers


| Types of Promising RF | RF No. | Promising Research Frontiers | Types of Technology |
|---|---|---|---|
| Emerging Research Frontier | RF2 | Back contact-type solar cell | Structure |
| RF7 | Contact for a photovoltaic cell | Structure | |
| RF9 | Crystal silicon solar cell | Attribute | |
| RF13 | Forming crystalline layer | Method | |
| RF15 | Integrated thin-film solar cell | Structure | |
| RF19 | Material for thin film photovoltaic cell fabrication | Material | |
| RF27 | Process and system for semiconductor wafer | Method | |
| RF28 | Quantum dot solar cell | Attribute | |
| RF30 | Single crystal silicon solar cell | Structure | |
| RF43 | Three-dimensional thin-film solar cells | Structure | |
| RF44 | Treatment of thin film photovoltaic cell | Method | |
| Enhanced Research Frontier | RF6 | CIGS based thin film | Material |
| RF10 | Dye-sensitized solar cell | Method | |
| RF11 | Electrode for photovoltaic cells | Attribute | |
| RF18 | Manufacturing method for solar modules | Method | |
| RF22 | Nano- solar cells | Attribute | |
| RF23 | Organic solar cell | Attribute | |
| RF31 | solar arrays | Structure | |
| RF34 | Substrate and collector grid structures | Structure | |
| RF37 | Tandem-type thin film solar cell | Structure | |
| RF38 | Terminal box | Structure | |
| RF41 | Thin film solar cell manufacturing | Method | |
| RF42 | Thin film solar cell module | Structure |
| Types of Promising RF | RF No. | Promising Research Frontiers | Types of Technology |
|---|---|---|---|
| Emerging Research Frontier | RF19 | Material for thin film photovoltaic cell fabrication | Material |
| Enhanced Research Frontier | RF5 | Bulkheterojunction thin film solar cell | Structure |
| RF23 | Organic solar cell | Attribute | |
| RF28 | Quantum dot solar cell | Attribute | |
| RF37 | Tandem-type thin film solar cell | Structure | |
| RF41 | Thin film solar cell manufacturing | Method | |
| RF45 | High-efficiency crystalline silicon solar cell | Method | |
| RF46 | Polymer solar cell | Attribute |
3.5. Contents of Promising Research Frontiers
| RF No. | Promising Research Frontier | Keywords |
|---|---|---|
| RF2 | Back contact-type solar cell | quantum wells, silver particle, back contact-type, contact-type solar |
| RF7 | Contact for a photovoltaic cell | oxide, dielectric, coating, dopant, wafer, p-type, n-type, diode, making, polymer |
| RF9 | Crystal silicon solar cell | transistors, nanowire, ceramic, lamina, polymer, nanowhisker, stent, wafer, single-crystal, amorphous sillicon, transparent insulator |
| RF13 | Forming crystalline layer | electrode, insulating, polarizing, transistor, retardation, transmissive, capacitor, dielectric, spacer, sealant, photonic crystal |
| RF15 | Integrated thin-film solar cell | oxide, indium, polymer, n-type, p-type, dopant, epitaxial, nanocrystals, diode, sputtering, quantum dot |
| RF19 | Material for thin film photovoltaic cell | oxide, epitaxial, diodes, polymeric, optoelectronic, photoactive, selenide, solvent, electrochromic, liquid polysiloxane, microcrystalline sillicon |
| RF27 | Process and system for semiconductor wafer | wafer, semiconductor, chamber, laser, die, silicon, dielectric, annealing, plasma, epitaxial, pressure-sensitive, monocrystalline |
| RF28 | Quantum dot solar cell | nanocrystal, anchor, epitaxial, nanowhisker, nanowire, optoelectronic, ligand, heterostructure, quantum dot, fused nanocrystals, epitaxial layer |
| RF30 | Single crystal silicon solar cell | diodes, implanting, monocrystalline, etching, epitaxial, n-type single-crystal, photodiode, performed, resin, antifuse-configurable interconnect, nanowire photodiode |
| RF43 | Three-dimensional thin-film solar cells | etching, extrusion, bicontinuous heterostructure, solvent, crystallographic, ligand-exchanged, elastomeric, co-extrusion, transparent cnt, titanium dioxide |
| RF44 | Treatment of thin film photovoltaic cell | dopant, n-type, ligands, p-type, sputtering, ion, transistor, optoelectronic, copper-to-indium, etching, molybdenum, electromagnetic radiation |
| RF No. | Promising Research Frontier | Keywords |
|---|---|---|
| RF19 | Material for thin film photovoltaic cell fabrication | x-ray diffraction, energy dispersive, band gap, dispersive x-ray, amorphous silicon, microscopy, elsevier ltd, chalcopyrite, degradation |
| RF5 | Bulkheterojunction thin film solar cell | bulk-heterojunction, conversion, copolymers, elsevier, annealing, spectroscopy, photoactive, dissociation, nanoparticles, crystallinity, short-circuit, open-circuit |
| RF23 | Organic solar cell | p3ht, pcbm, phthalocyanine, thiophene, spin-coating, plasmon, heterojunction organic, thermal annealing, fullerene derivative, conjugated polymers, electrochemical impedance, planar heterojunction, organic semiconductors, organic-inorganic hybrid, organic photovoltaics, schottky junction |
| RF28 | Quantum dot solar cell | mesoporous, heterojunction, photoelectrochemical, quantum-dot-sensitized, photoluminescence, passivation, hydrothermal, superlattice, polysulfide electrolyte, quantum dot-sensitized, cds/cdse quantum, inas/gaas quantum |
| RF37 | Tandem-type thin film solar cell | a-si:h, c-si, i-layer, co-evaporation, silicon-germanium, microcrystalline silicon, tandem organic, hydrogenated microcrystalline, uv-vis spectroscopy |
| RF41 | Thin film solar cell manufacturing | cigs, quantum, azo, annealing, polycrystalline, heterojunction, microscopy, amorphous silicon, glass substrates, x-ray diffraction, tin oxide, circuit voltage |
| RF45 | High-efficiency crystalline silicon solar cell | c-si wafers, crystalline silicon, surface texturing, edge isolation, inspection system, qsc silicon, conversion efficiency, force microscopy, mc-si, bv, impurity |
| RF46 | Polymer solar cell | copolymers, heterojunction, donor-acceptor, pedot:pss, mdmo-ppv, photophysical, thermogravimetric, cyclic voltammetry, permeation chromatography, zno nanostructure |
4. Discussion
| Research Area | RF No. | 1st Period (2008-2010) | 2nd Period (2011-2012) | Total | ||
|---|---|---|---|---|---|---|
| Frequency | Rate (%) | Frequency | Rate (%) | |||
| Crystalline silicon solar cell | RF2 | 0 | 0.00% | 1 | 1.59% | 1 |
| RF3 | 1 | 0.90% | 0 | 0.00% | 1 | |
| RF7 | 0 | 0.00% | 1 | 1.59% | 1 | |
| RF9 | 0 | 0.00% | 1 | 1.59% | 1 | |
| RF14 | 2 | 1.80% | 0 | 0.00% | 2 | |
| RF20 | 1 | 0.90% | 0 | 0.00% | 1 | |
| RF25 | 0 | 0.00% | 1 | 1.59% | 1 | |
| RF27 | 0 | 0.00% | 1 | 1.59% | 1 | |
| RF30 | 5 | 4.50% | 0 | 0.00% | 5 | |
| RF32 | 0 | 0.00% | 1 | 1.59% | 1 | |
| RF39 | 1 | 0.90% | 0 | 0.00% | 1 | |
| RF45 | 2 | 1.80% | 0 | 0.00% | 2 | |
| Subtotal | 12 | 10.81% | 6 | 9.52% | 18 | |
| Thin film solar cell | RF4 | 1 | 0.90% | 0 | 0.00% | 1 |
| RF5 | 1 | 0.90% | 0 | 0.00% | 1 | |
| RF6 | 1 | 0.90% | 9 | 14.29% | 10 | |
| RF8 | 2 | 1.80% | 0 | 0.00% | 2 | |
| RF13 | 0 | 0.00% | 1 | 1.59% | 1 | |
| RF15 | 0 | 0.00% | 2 | 3.17% | 2 | |
| RF17 | 2 | 1.80% | 0 | 0.00% | 2 | |
| RF19 | 0 | 0.00% | 2 | 3.17% | 2 | |
| RF21 | 3 | 2.70% | 0 | 0.00% | 3 | |
| RF24 | 7 | 6.31% | 0 | 0.00% | 7 | |
| RF29 | 2 | 1.80% | 0 | 0.00% | 2 | |
| RF37 | 1 | 0.90% | 1 | 1.59% | 2 | |
| RF41 | 19 | 17.12% | 2 | 3.17% | 21 | |
| RF42 | 1 | 0.90% | 1 | 1.59% | 2 | |
| RF43 | 0 | 0.00% | 6 | 9.52% | 6 | |
| RF44 | 0 | 0.00% | 8 | 12.70% | 8 | |
| Subtotal | 40 | 36.04% | 32 | 50.79% | 72 | |
| Organic/quantum dot/nano convergent solar cell | RF1 | 1 | 0.90% | 0 | 0.00% | 1 |
| RF10 | 10 | 9.01% | 4 | 6.35% | 14 | |
| RF22 | 3 | 2.70% | 4 | 6.35% | 7 | |
| RF23 | 9 | 8.11% | 6 | 9.52% | 15 | |
| RF28 | 9 | 8.11% | 0 | 0.00% | 9 | |
| RF40 | 1 | 0.90% | 0 | 0.00% | 1 | |
| Subtotal | 33 | 29.73% | 14 | 22.22% | 47 | |
| The other solar cell | RF11 | 6 | 5.41% | 3 | 4.76% | 9 |
| RF12 | 1 | 0.90% | 0 | 0.00% | 1 | |
| RF16 | 0 | 0.00% | 1 | 1.59% | 1 | |
| RF18 | 9 | 8.11% | 2 | 3.17% | 11 | |
| RF26 | 1 | 0.90% | 0 | 0.00% | 1 | |
| RF31 | 1 | 0.90% | 2 | 3.17% | 3 | |
| RF33 | 3 | 2.70% | 2 | 3.17% | 5 | |
| RF34 | 1 | 0.90% | 0 | 0.00% | 1 | |
| RF35 | 1 | 0.90% | 0 | 0.00% | 1 | |
| RF36 | 1 | 0.90% | 0 | 0.00% | 1 | |
| RF38 | 2 | 1.80% | 1 | 1.59% | 3 | |
| Subtotal | 26 | 23.42% | 11 | 17.46% | 37 | |
| Total | 111 | 100.00% | 63 | 100.00% | 174 | |
| Research Area | RF No. | 1st Period (2008–2010) | 2nd Period (2011–2012) | Total | ||
|---|---|---|---|---|---|---|
| Frequency | Rate (%) | Frequency | Rate (%) | |||
| Crystalline silicon solar cell | RF30 | 1 | 0.89% | 0 | 0.00% | 1 |
| RF45 | 4 | 3.57% | 4 | 22.22% | 8 | |
| Subtotal | 5 | 4.46% | 4 | 22.22% | 9 | |
| Thin film solar cell | RF5 | 14 | 12.50% | 3 | 16.67% | 17 |
| RF19 | 0 | 0.00% | 1 | 5.56% | 1 | |
| RF37 | 1 | 0.89% | 1 | 5.56% | 2 | |
| RF41 | 2 | 1.79% | 1 | 5.56% | 3 | |
| Subtotal | 17 | 15.18% | 6 | 33.33% | 23 | |
| Organic/quantum dot/nano convergent solar cell | RF10 | 24 | 21.43% | 0 | 0.00% | 24 |
| RF22 | 15 | 13.39% | 0 | 0.00% | 15 | |
| RF23 | 12 | 10.71% | 1 | 5.56% | 13 | |
| RF28 | 4 | 3.57% | 1 | 5.56% | 5 | |
| Subtotal | 55 | 49.11% | 2 | 11.11% | 57 | |
| The other solar cell | RF11 | 1 | 0.89% | 0 | 0.00% | 1 |
| RF46 | 28 | 25.00% | 6 | 33.33% | 34 | |
| RF47 | 4 | 3.57% | 0 | 0.00% | 4 | |
| RF48 | 1 | 0.89% | 0 | 0.00% | 1 | |
| RF49 | 1 | 0.89% | 0 | 0.00% | 1 | |
| Subtotal | 35 | 31.25% | 6 | 33.33% | 41 | |
| Total | 112 | 100.00% | 18 | 100.00% | 130 | |
| RF No. | Core Research Frontier | Promising Type | RF No. | Related Promising Research Frontier |
|---|---|---|---|---|
| RF33 | Substrate and collector grid structures | Emerging | RF2 | Back contact-type solar cell |
| RF7 | Contact for a photovoltaic cell | |||
| Enhanced | RF11 | Electrode for photovoltaic cells | ||
| RF3 | Back side contact solar cell | Emerging | RF30 | Single crystal silicon solar cell |
| Enhanced | - | - | ||
| RF6 | CIGS based thin film | Emerging | RF19 | Material for thin film photovoltaic cell fabrication |
| RF44 | Treatment of thin film photovoltaic cell | |||
| Enhanced | - | - | ||
| RF8 | Contact layers for thin film solar cells | Emerging | RF44 | Treatment of thin film photovoltaic cell |
| Enhanced | RF6 | CIGS based thin film | ||
| RF14 | Hetero-junction crystalline silicon solar cell | Emerging | RF19 | Material for thin film photovoltaic cell fabrication |
| Enhanced | - | - | ||
| RF20 | Metal contact structure for solar cell | Emerging | RF30 | Single crystal silicon solar cell |
| Enhanced | - | - | ||
| RF30 | Single crystal silicon solar cell | Emerging | RF43 | Three-dimensional thin-film solar cells |
| Enhanced | - | - | ||
| RF44 | Treatment of thin film photovoltaic cell | Emerging | RF19 | Material for thin film photovoltaic cell fabrication |
| Enhanced | RF6 | CIGS based thin film |
| RF No. | Core Research Frontier | Promising Type | RF No. | Related Promising Research Frontier |
|---|---|---|---|---|
| RF5 | Bulkheterojunction thin film solar cell | Emerging | RF19 | Material for thin film photovoltaic cell fabrication |
| Enhanced | RF23 | Organic solar cell | ||
| RF37 | Tandem-type thin film solar cell | |||
| RF45 | High-efficiency crystalline silicon solar cell | |||
| RF46 | Polymer solar cell | |||
| RF19 | Material for thin film photovoltaic cell fabrication | Emerging | - | |
| Enhanced | RF5 | Bulkheterojunction thin film solar cell | ||
| RF23 | Organic solar cell | |||
| RF37 | Tandem-type thin film solar cell | |||
| RF45 | High-efficiency crystalline silicon solar cell | |||
| RF46 | Polymer solar cell | |||
| RF23 | Organic solar cell | Emerging | RF19 | Material for thin film photovoltaic cell fabrication |
| Enhanced | RF5 | Bulkheterojunction thin film solar cell | ||
| RF37 | Tandem-type thin film solar cell | |||
| RF46 | Polymer solar cell | |||
| RF37 | Tandem-type thin film solar cell | Emerging | RF19 | Material for thin film photovoltaic cell fabrication |
| Enhanced | RF5 | Bulkheterojunction thin film solar cell | ||
| RF23 | Organic solar cell | |||
| RF37 | Tandem-type thin film solar cell | |||
| RF46 | Polymer solar cell | |||
| RF45 | High-efficiency crystalline silicon solar cell | Emerging | RF19 | Material for thin film photovoltaic cell fabrication |
| Enhanced | RF5 | Bulkheterojunction thin film solar cell | ||
| RF37 | Tandem-type thin film solar cell | |||
| RF46 | Polymer solar cell | |||
| RF46 | Polymer solar cell | Emerging | RF19 | Material for thin film photovoltaic cell fabrication |
| Enhanced | RF5 | Bulkheterojunction thin film solar cell | ||
| RF23 | Organic solar cell | |||
| RF37 | Tandem-type thin film solar cell | |||
| RF46 | Polymer solar cell |
| Types of Technology | Patent Knowledge Map | Scientific Paper Knowledge Map | ||
|---|---|---|---|---|
| Core RFs | Promising RFs | Core RFs | Promising RFs | |
| Structure | 6 | 10 | 2 | 2 |
| Method | 1 | 6 | 1 | 2 |
| Attribute | 0 | 5 | 2 | 3 |
| Material | 1 | 2 | 1 | 1 |
| Total | 8 | 23 | 6 | 8 |
5. Conclusions and Policy Implications
Acknowledgments
Author Contributions
Conflicts of Interest
Appendix
| Research Area (RA) | Search Query |
|---|---|
| Crystalline silicon solar cell | ((((crystalline* or crystal* or polycrystalline* or porous*) adj (silicon*)) near (solar adj (cell* or batter*))).ti,ab,cl. and (@RD >= 20080101 <= 20121231)) |
| Thin film solar cell | ((((thin adj film*) or thin-film*) adj (solar or photovoltaic* or photo-voltaic*) adj (cell* or batter*)).ti,ab,cl. and (@RD >= 20080101 <= 20121231)) |
| Organic/quantum dot/nano convergent solar cell | (((organic* or organic-based* or OPV or (quantum adj dot*) or nano* or (carbon adj nano*)) near ((solar* or photovoltaic* or photo-voltaic*) adj (cell* or battery*))).ti,ab,cl. and (@RD >= 20080101 <= 20121231)) |
| The other solar cell | ((((solar* or photovoltaic* or photo-voltaic*) adj (cell* or batter*)) near (dye-sensitize* or (dye and sensitize*) or sensitize* or electrode* or simulat* or structure* or hybrid* or system) not ((thin adj film) or thin-film or organic* or organic-based* or OPV or (quantum adj dot*) or nano* or (carbon adj nano*) or crystalline* or crystal* or polycrystalline* or porous* or silicon*))).ti,ab,cl. and (@RD >= 20080101 <= 20121231)) |
| Research Frontier | PC1 | PC2 |
|---|---|---|
| RF1 | −36.2294 | −9.81264 |
| RF2 | −35.3673 | −10.4946 |
| RF3 | −24.0892 | −7.23406 |
| RF4 | −35.0267 | −9.41091 |
| RF5 | −32.5856 | −9.54674 |
| RF6 | −34.4334 | −17.887 |
| RF7 | −38.858 | −8.22966 |
| RF8 | −18.7503 | −20.2834 |
| RF9 | −35.4926 | −9.62587 |
| RF10 | −44.3567 | 1367.402 |
| RF11 | −44.846 | −36.2605 |
| RF12 | −53.6982 | −16.3904 |
| RF13 | −32.858 | −10.4107 |
| RF14 | −36.2743 | −10.0376 |
| RF15 | −36.9143 | −13.4135 |
| RF16 | −36.142 | −10.4386 |
| RF17 | −26.8796 | −15.8782 |
| RF18 | −22.8332 | −9.82456 |
| RF19 | −35.6151 | −27.4232 |
| RF20 | −35.6103 | −9.62142 |
| RF21 | −37.0245 | −11.2424 |
| RF22 | −55.4129 | −11.919 |
| RF23 | −103.927 | −9.92834 |
| RF24 | 1677.531 | −53.4246 |
| RF25 | −33.9014 | −9.04046 |
| RF26 | −33.9014 | −9.04046 |
| RF27 | −37.5177 | −10.2497 |
| RF28 | −45.6675 | −10.0362 |
| RF29 | −37.0278 | −10.0857 |
| RF30 | −43.9931 | −12.6042 |
| RF31 | −58.6487 | −18.5077 |
| RF32 | −52.5925 | −18.5794 |
| RF33 | 86.06667 | −408.477 |
| RF34 | −35.6179 | −9.60763 |
| RF35 | −34.038 | −9.08518 |
| RF36 | −34.3148 | −9.17595 |
| RF37 | −34.596 | −9.26853 |
| RF38 | −37.4884 | −10.2492 |
| RF39 | −33.9014 | −9.04046 |
| RF40 | −34.4548 | −9.22201 |
| RF41 | −78.8119 | −74.5196 |
| RF42 | −35.0267 | −9.41091 |
| RF43 | −66.286 | −22.5906 |
| RF44 | −68.4117 | −330.743 |
| RF45 | −34.1758 | −9.13034 |
| Research Frontier | PC1 | PC2 |
|---|---|---|
| RF5 | −691.262 | 142.8112 |
| RF10 | 3144.054 | −328.72 |
| RF11 | −57.4973 | −243.063 |
| RF19 | −143.136 | −190.857 |
| RF22 | 95.75207 | −470.292 |
| RF23 | −277.47 | 3181.938 |
| RF28 | −46.5078 | −429.089 |
| RF30 | −43.0097 | −249.118 |
| RF37 | −103.766 | −239.56 |
| RF41 | −62.5159 | −246.493 |
| RF45 | −1.22539 | −257.838 |
| RF46 | −1629.9 | 192.6807 |
| RF47 | −69.5766 | −262.38 |
| RF48 | −34.0751 | −242.862 |
| RF49 | −79.8689 | −357.157 |
References
- Lee, W.J.; Sohn, S.Y. Patent analysis to identify shale gas development in China and the United States. Energy Policy 2014, 74, 111–115. [Google Scholar] [CrossRef]
- Altwies, J.E.; Nemet, G.F. Innovation in the us building sector: An assessment of patent citations in building energy control technology. Energy Policy 2013, 52, 819–831. [Google Scholar] [CrossRef]
- Wong, C.-Y.; Fatimah Mohamad, Z.; Keng, Z.-X.; Ariff Azizan, S. Examining the patterns of innovation in low carbon energy science and technology: Publications and patents of Asian emerging economies. Energy Policy 2014, 73, 789–802. [Google Scholar] [CrossRef]
- Lee, K.; Lee, S. Patterns of technological innovation and evolution in the energy sector: A patent-based approach. Energy Policy 2013, 59, 415–432. [Google Scholar] [CrossRef]
- Yoon, B.U.; Yoon, C.B.; Park, Y.T. On the development and application of a self-organizing feature map-based patent map. R&D Manag. 2002, 32, 291–300. [Google Scholar]
- De Sollar Price, D.J. Networks of scientific papers. Science 1965, 149, 510–515. [Google Scholar] [CrossRef]
- Toivanen, H. The shift from theory to innovation: The evolution of Brazilian research frontiers 2005–2011. Technol. Anal. Strateg. Manag. 2014, 26, 105–119. [Google Scholar] [CrossRef]
- Moed, H.F. Citation Analysis in Research Evaluation; Springer: Berlin, Germany, 2005; Volume 9. [Google Scholar]
- Garfield, E.; Merton, R.K. Citation Indexing: Its Theory and Application in Science, Technology, and Humanities; Wiley: New York, NY, USA, 1979; Volume 8. [Google Scholar]
- Garfield, E.; Small, H. Identifying the changing frontiers of science. Evolution 1989, 1, 51–65. [Google Scholar]
- Small, H.; Griffith, B.C. The structure of scientific literatures i: Identifying and graphing specialties. Sci. Stud. 1974, 4, 17–40. [Google Scholar] [CrossRef]
- Braam, R.; Moed, H.; Vanraan, A. Mapping of science by combined cocitation and word analysis. 1. Structural aspects. J. Am. Soc. Inf. Sci. 1991, 42, 233–251. [Google Scholar] [CrossRef]
- Peters, H.; van Raan, A.F. Co-word-based science maps of chemical engineering. Part I: Representations by direct multidimensional scaling. Res. Policy 1993, 22, 23–45. [Google Scholar] [CrossRef]
- Peters, H.; van Raan, A.F. Co-word-based science maps of chemical engineering. Part II: Representations by combined clustering and multidimensional scaling. Res. Policy 1993, 22, 47–71. [Google Scholar] [CrossRef]
- Persson, O. The intellectual base and research fronts of jasis 1986–1990. J. Am. Soc. Inf. Sci. 1994, 45, 31–38. [Google Scholar] [CrossRef]
- Fujita, K.; Kajikawa, Y.; Mori, J.; Sakata, I. Detecting Research Fronts Using Different Types of Combinational Citation. Available online: http://2012.sticonference.org/Proceedings/vol1/Fujita_Detecting_273.pdf (accessed on 2 October 2015).
- Shibata, N.; Kajikawa, Y.; Takeda, Y.; Matsushima, K. Detecting emerging research fronts based on topological measures in citation networks of scientific publications. Technovation 2008, 28, 758–775. [Google Scholar] [CrossRef]
- Jarneving, B. Bibliographic coupling and its application to research-front and other core documents. J. Informetr. 2007, 1, 287–307. [Google Scholar] [CrossRef]
- Jarneving, B. A comparison of two bibliometric methods for mapping of the research front. Scientometrics 2005, 65, 245–263. [Google Scholar] [CrossRef]
- Boyack, K.W.; Klavans, R. Co-citation analysis, bibliographic coupling, and direct citation: Which citation approach represents the research front most accurately? J. Am. Soc. Inf. Sci. Technol. 2010, 61, 2389–2404. [Google Scholar] [CrossRef]
- Lucio-Arias, D.; Leydesdorff, L. An indicator of research front activity: Measuring intellectual organization as uncertainty reduction in document sets. J. Am. Soc. Inf. Sci. Technol. 2009, 60, 2488–2498. [Google Scholar] [CrossRef]
- Saka, A.; Igami, M.; Kuwahara, T. Science Map 2008. Study on Hot Research Areas (2003–2008) by Bibliometric Method. Available online: http://www.nistep.go.jp/achiev/ftx/eng/rep139e/pdf/NR139_ScienceMap2008.pdf (accessed on 6 October 2015).
- Li, W.; Zhao, Y. Bibliometric analysis of global environmental assessment research in a 20-year period. Environ. Impact Assess. Rev. 2015, 50, 158–166. [Google Scholar] [CrossRef]
- Cole, F.J.; Eales, N.B. The history of comparative anatomy. Part I: A statistical analysis of the literature. Sci. Prog. 1917, 11, 578–596. [Google Scholar]
- Hulme, E.W. Statistical Bibliography in Relation to the Growth of Modern Civilization; Butler and Tanner/Grafton & co.: London, UK, 1923. [Google Scholar]
- Lotka, A.J. The frequency distribution of scientific productivity. J. Wash. Acad. Sci. 1926, 16, 317–323. [Google Scholar]
- Gross, P.; Gross, E. College libraries and chemical education. Science 1927, 66, 385–389. [Google Scholar] [CrossRef] [PubMed]
- Zipf, G.K. Human Behavior and the Principle of Least Effort; Addison-Wesley: Menlo Park, CA, USA, 1949. [Google Scholar]
- Fairthorne, R.A. Empirical hyperbolic distributions (bradford-zipf-mandelbrot) for bibliometric description and prediction. J. Doc. 1969, 25, 319–343. [Google Scholar] [CrossRef]
- Lawani, S.M. Quality, Collaboration and Citations in Cancer Research: A Bibliometric Study; Florida State University: Tallahassee, FL, USA, 1980. [Google Scholar]
- Hertzel, D.H. Bibliometrics, history of the development of ideas in. Encycl. Libr. Inf. Sci. 1987, 42, 144–211. [Google Scholar]
- Brookes, B.C. Comments on the Scope of Bibliometrics. Available online: https://uhdspace.uhasselt.be/dspace/handle/1942/827 (accessed on 6 October 2015).
- White, H.D.; McCain, K.W. Visualizing a discipline: An author co-citation analysis of information science, 1972–1995. J. Am. Soc. Inf. Sci. 1998, 49, 327–355. [Google Scholar]
- Soper, M.E. The Librarian’s Thesaurus; American Library Association: Chicago, IL, USA, 1990. [Google Scholar]
- Khurshid, A.; Sahai, H. Bibliometric distributions and laws: Some comments and a selected bibliography. J. Educ. Media Libr. Sci. 1991, 28, 433–459. [Google Scholar]
- Pritchard, A. Statistical bibliography or bibliometrics? J. Doc. 1969, 25, 348–349. [Google Scholar]
- Nalimov, V.V.; Mul’chenko, Z. Naukometriya. Izuchenie Nauki Kak Informatsionnogo Protsessa; Nauka: Moscow, Russia, 1969. [Google Scholar]
- Nacke, O. Informetrie: Ein neuer name für eine neue disziplin. Nachrichten Dok. 1979, 30, 219–226. [Google Scholar]
- Hood, W.W.; Wilson, C.S. The literature of bibliometrics, scientometrics, and informetrics. Scientometrics 2001, 52, 291–314. [Google Scholar] [CrossRef]
- Davenport, T.H.; Prusak, L. Working Knowledge: How Organizations Manage What They Know; Harvard Business Press: Boston, MA, USA, 1998. [Google Scholar]
- Eppler, M.J. Making knowledge visible through intranet knowledge maps: Concepts, elements, cases. In Proceedings of the 34th Annual Hawaii International Conference on System Sciences, Maui, HI, USA, 3–6 January 2001.
- Wexler, M.N. The who, what and why of knowledge mapping. J. Knowl. Manag. 2001, 5, 249–264. [Google Scholar] [CrossRef]
- Gómez, A.; Moreno, A.; Pazos, J.; Sierra-Alonso, A. Knowledge maps: An essential technique for conceptualisation. Data Knowl. Eng. 2000, 33, 169–190. [Google Scholar] [CrossRef]
- Gordon, J.L. Creating knowledge maps by exploiting dependent relationships. Knowl.-Based Syst. 2000, 13, 71–79. [Google Scholar] [CrossRef]
- Le-Khac, N.-A.; Aouad, L.M.; Kechadi, M. Knowledge map: Toward a new approach supporting the knowledge management in distributed data mining. In Proceedings of the Third International Conference on on Autonomic and Autonomous Systems, Athens, Greece, 19–25 June 2007.
- Van Raan, A.F. The Use of Bibliometric Analysis in Research Performance Assessment and Monitoring of Interdisciplinary Scientific Developments. Available online: http://www.cwts.nl/TvR/documents/AvR-TFA2003.pdf (accessed on 2 October 2015).
- Boyack, K.W.; Klavans, R.; Börner, K. Mapping the backbone of science. Scientometrics 2005, 64, 351–374. [Google Scholar] [CrossRef]
- Medina, C.; Leeuwen, T. Seed journal citation network maps: A method based on network theory. J. Am. Soc. Inf. Sci. Technol. 2012, 63, 1226–1234. [Google Scholar] [CrossRef]
- Su, H.-N.; Lee, P.-C. Knowledge map of publications in research policy. In Proceedings of the Portland International Conference on Management of Engineering & Technology, Portland, OR, USA, 2–6 August 2009.
- Shin, J.; Park, Y. Generation and application of patent claim map: Text mining and network analysis. J. Intellec. Property Rights 2005, 10, 198–205. [Google Scholar]
- Segev, A.; Kantola, J. Identification of trends from patents using self-organizing maps. Expert Syst. Appl. 2012, 39, 13235–13242. [Google Scholar] [CrossRef]
- Lee, S.; Yoon, B.; Park, Y. An approach to discovering new technology opportunities: Keyword-based patent map approach. Technovation 2009, 29, 481–497. [Google Scholar] [CrossRef]
- Son, C.; Suh, Y.; Jeon, J.; Park, Y. Development of a gtm-based patent map for identifying patent vacuums. Expert Syst. Appl. 2012, 39, 2489–2500. [Google Scholar] [CrossRef]
- Yoon, B.; Lee, S.; Lee, G. Development and application of a keyword-based knowledge map for effective R&D planning. Scientometrics 2010, 85, 803–820. [Google Scholar]
- Chen, A.; Chen, R. Design patent map: An innovative measure for corporative design strategie. Eng. Manag. J. 2007, 19, 14–29. [Google Scholar] [CrossRef]
- Chen, R. Design patent map visualization display. Expert Syst. Appl. 2009, 36, 12362–12374. [Google Scholar] [CrossRef]
- Kim, J.; Park, Y. Identifying a new service opportunity from potential needs: User-centric service map. In Proceedigns of International Conference on Industrial Engineering and Engineering Management (IEEM), Macau, China, 7–10 December, 2010.
- Glänzel, W.; Czerwon, H.-J. A new methodological approach to bibliographic coupling and its application to research-front and other core documents. In Proceedings of International conference on International Society for Scientometrics and Informetrics, River Forest, IL, USA, 7–10 June 1995.
- Coh, B. Technology Analysis and Patent Information Analysis; Korean Intellectual Property Office: Seoul, Korea, 2012. [Google Scholar]
- Jeong, Y.; Yoon, B. Development of patent roadmap based on technology roadmap by analyzing patterns of patent development. Technovation 2014, 39–40, 37–52. [Google Scholar] [CrossRef]
© 2015 by the authors; licensee MDPI, Basel, Switzerland. This article is an open access article distributed under the terms and conditions of the Creative Commons Attribution license (http://creativecommons.org/licenses/by/4.0/).
Share and Cite
Park, I.; Lee, K.; Yoon, B. Exploring Promising Research Frontiers Based on Knowledge Maps in the Solar Cell Technology Field. Sustainability 2015, 7, 13660-13689. https://doi.org/10.3390/su71013660
Park I, Lee K, Yoon B. Exploring Promising Research Frontiers Based on Knowledge Maps in the Solar Cell Technology Field. Sustainability. 2015; 7(10):13660-13689. https://doi.org/10.3390/su71013660
Chicago/Turabian StylePark, Inchae, Keeeun Lee, and Byungun Yoon. 2015. "Exploring Promising Research Frontiers Based on Knowledge Maps in the Solar Cell Technology Field" Sustainability 7, no. 10: 13660-13689. https://doi.org/10.3390/su71013660