
An Evaluation of Holistic Sustainability Assessment Framework for Palm Oil Production in Malaysia


Abstract
1. Introduction
2. Theoretical Framework of Palm Oil Sustainability Assessment
2.1. Sustainability Assessment and Its Purpose
2.2. Various Frameworks of Sustainability Assessment
2.2.1. Weak vs. Strong Sustainability
2.2.2. Three Categories of Sustainability Assessments
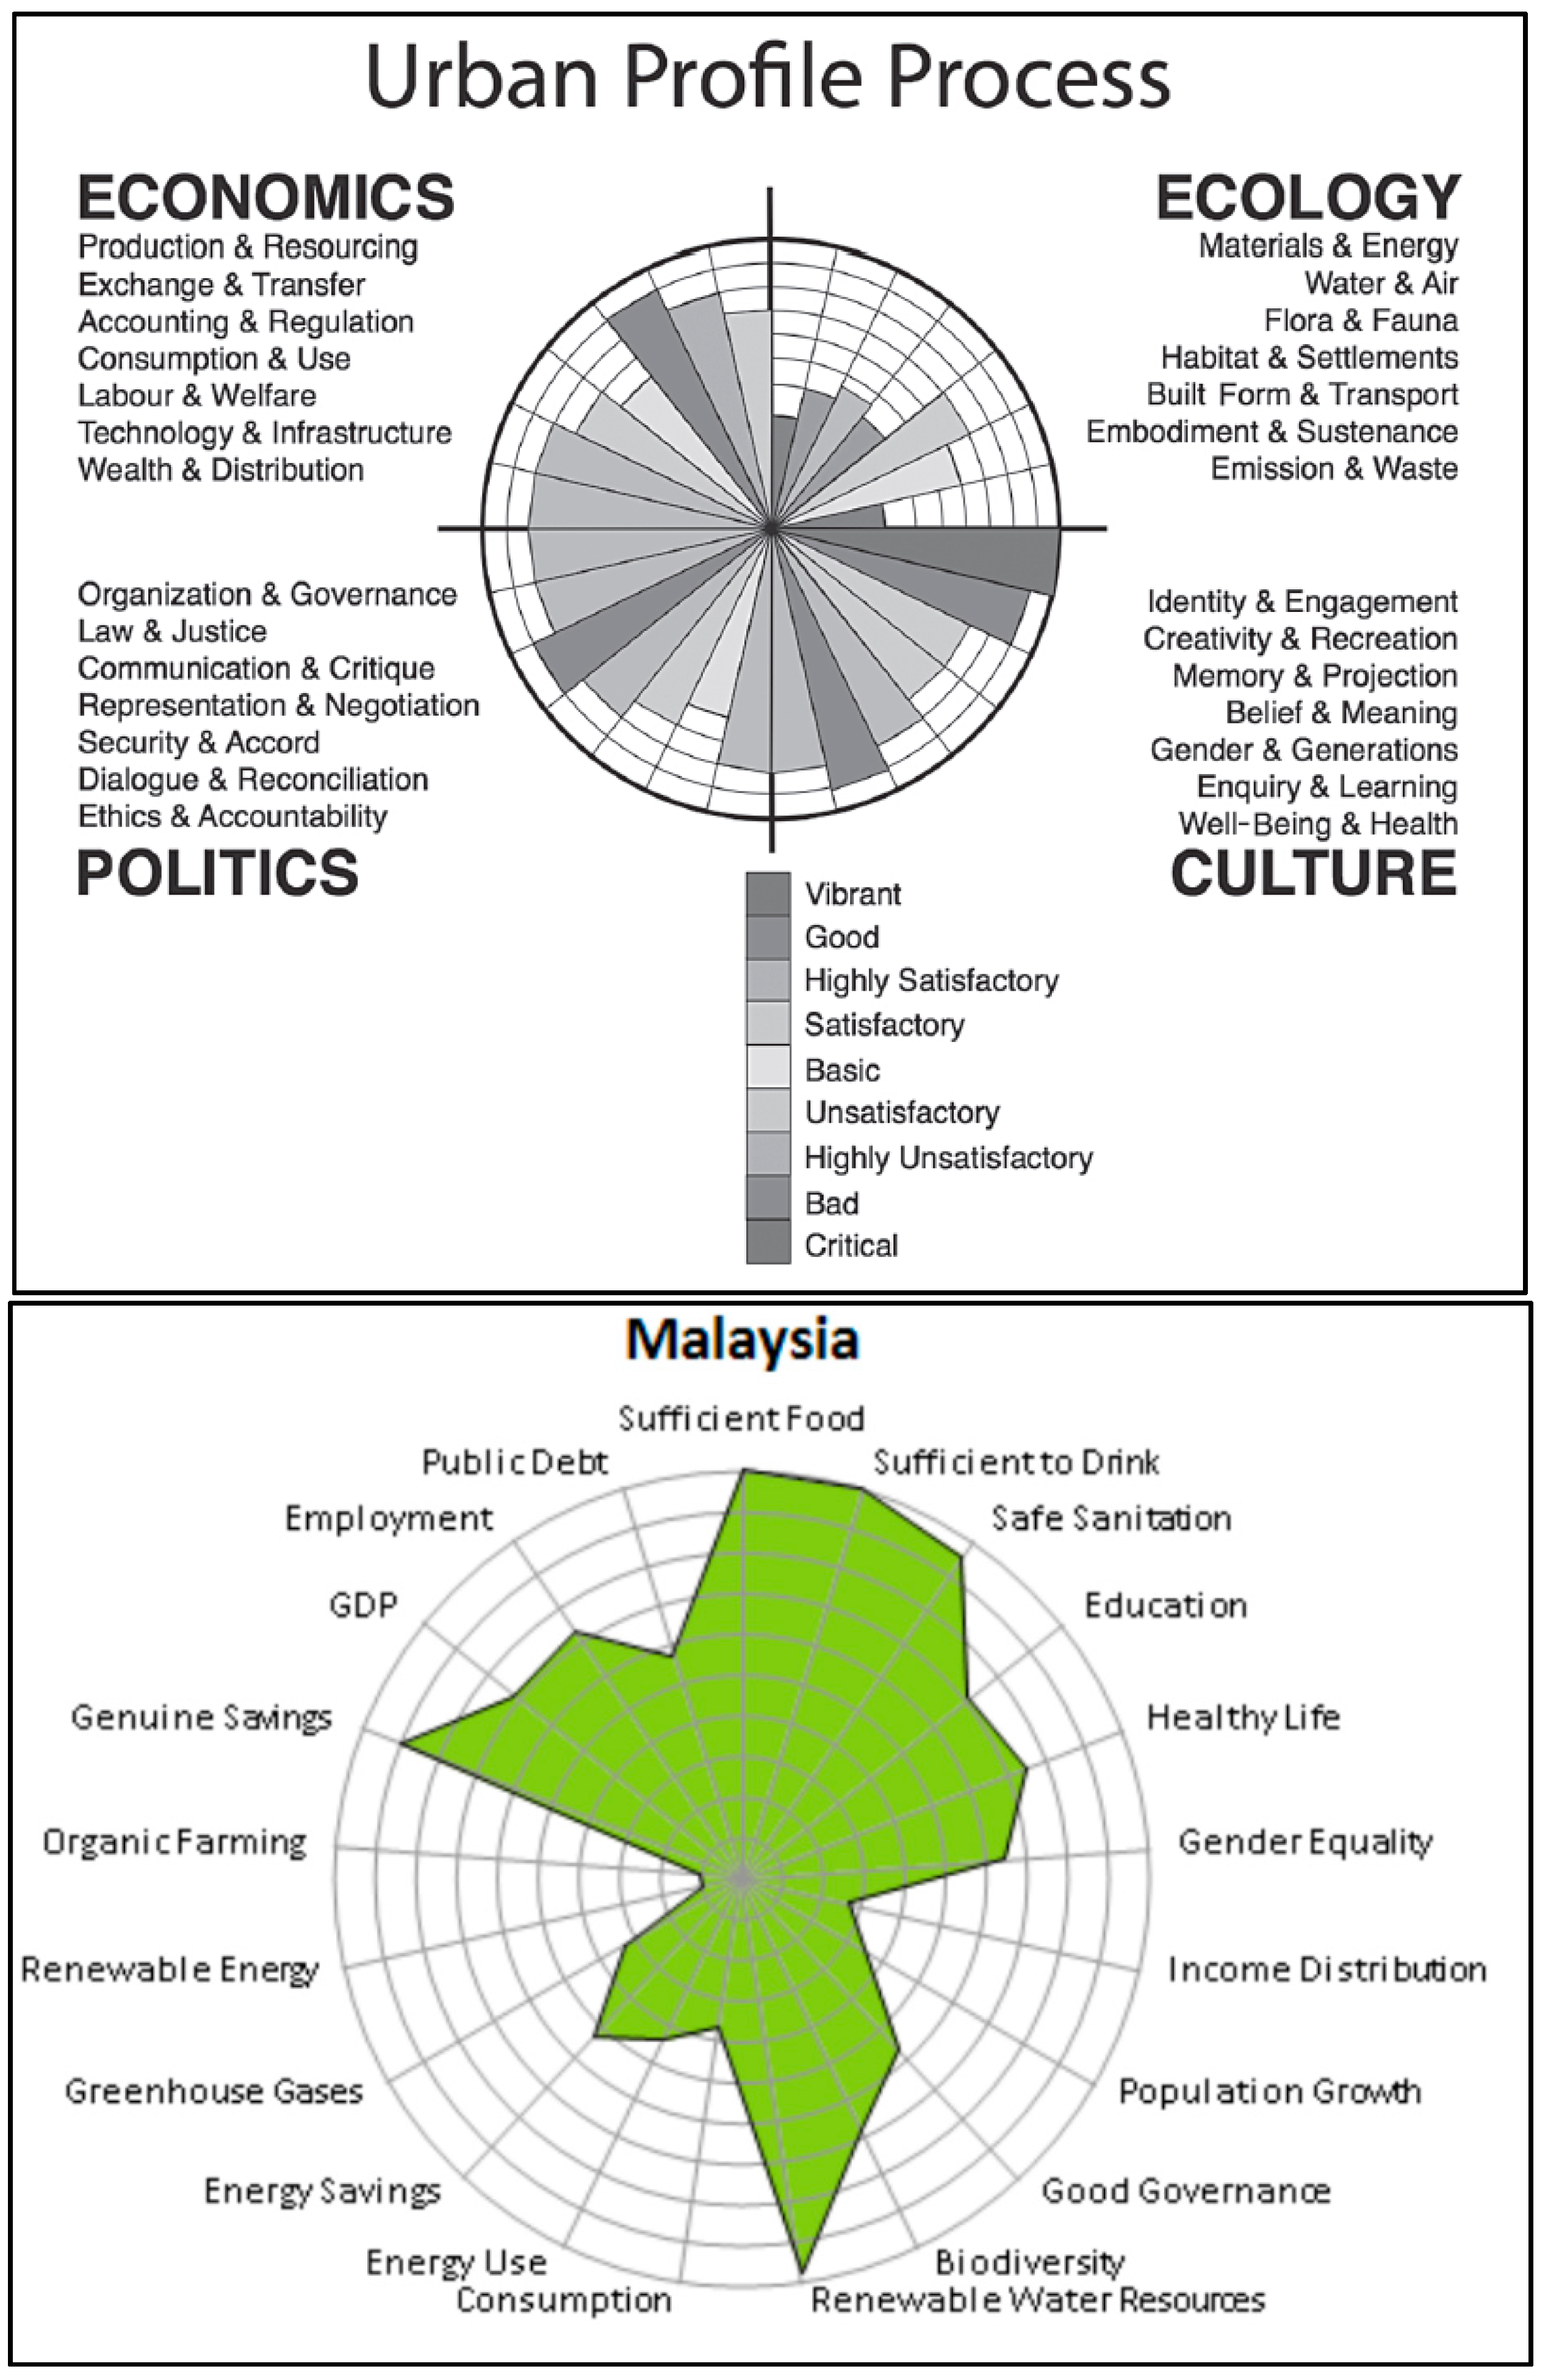
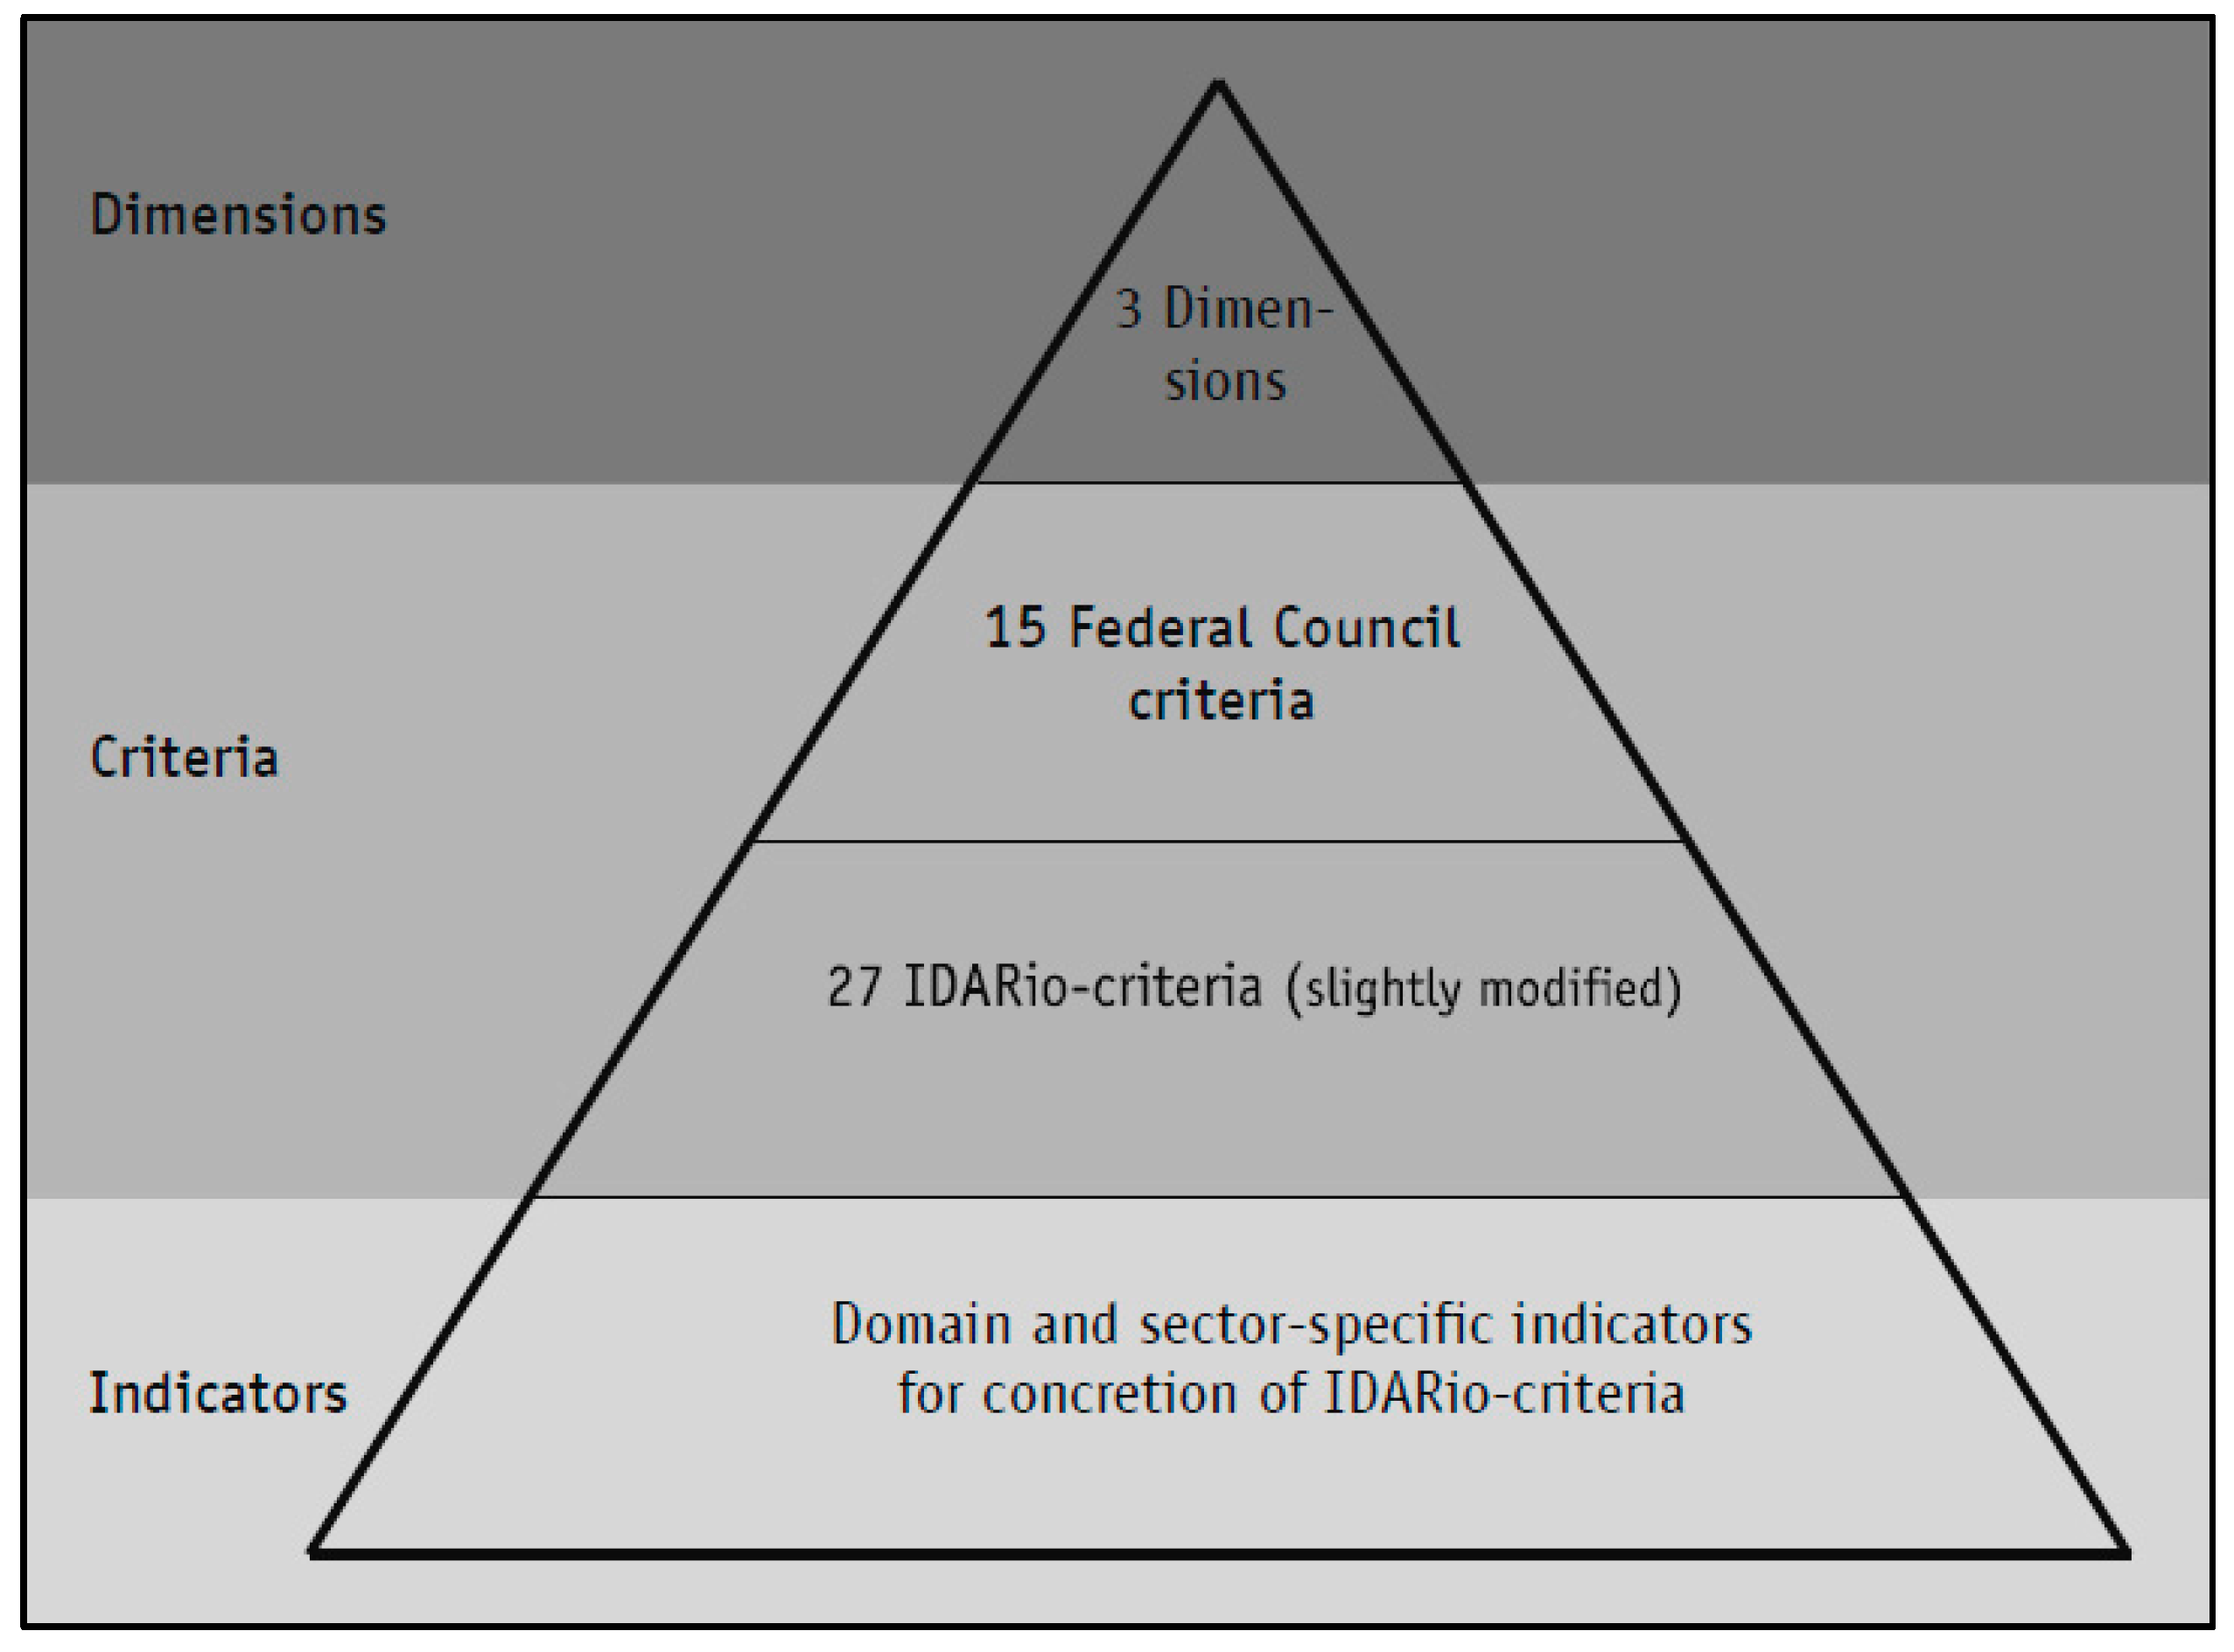
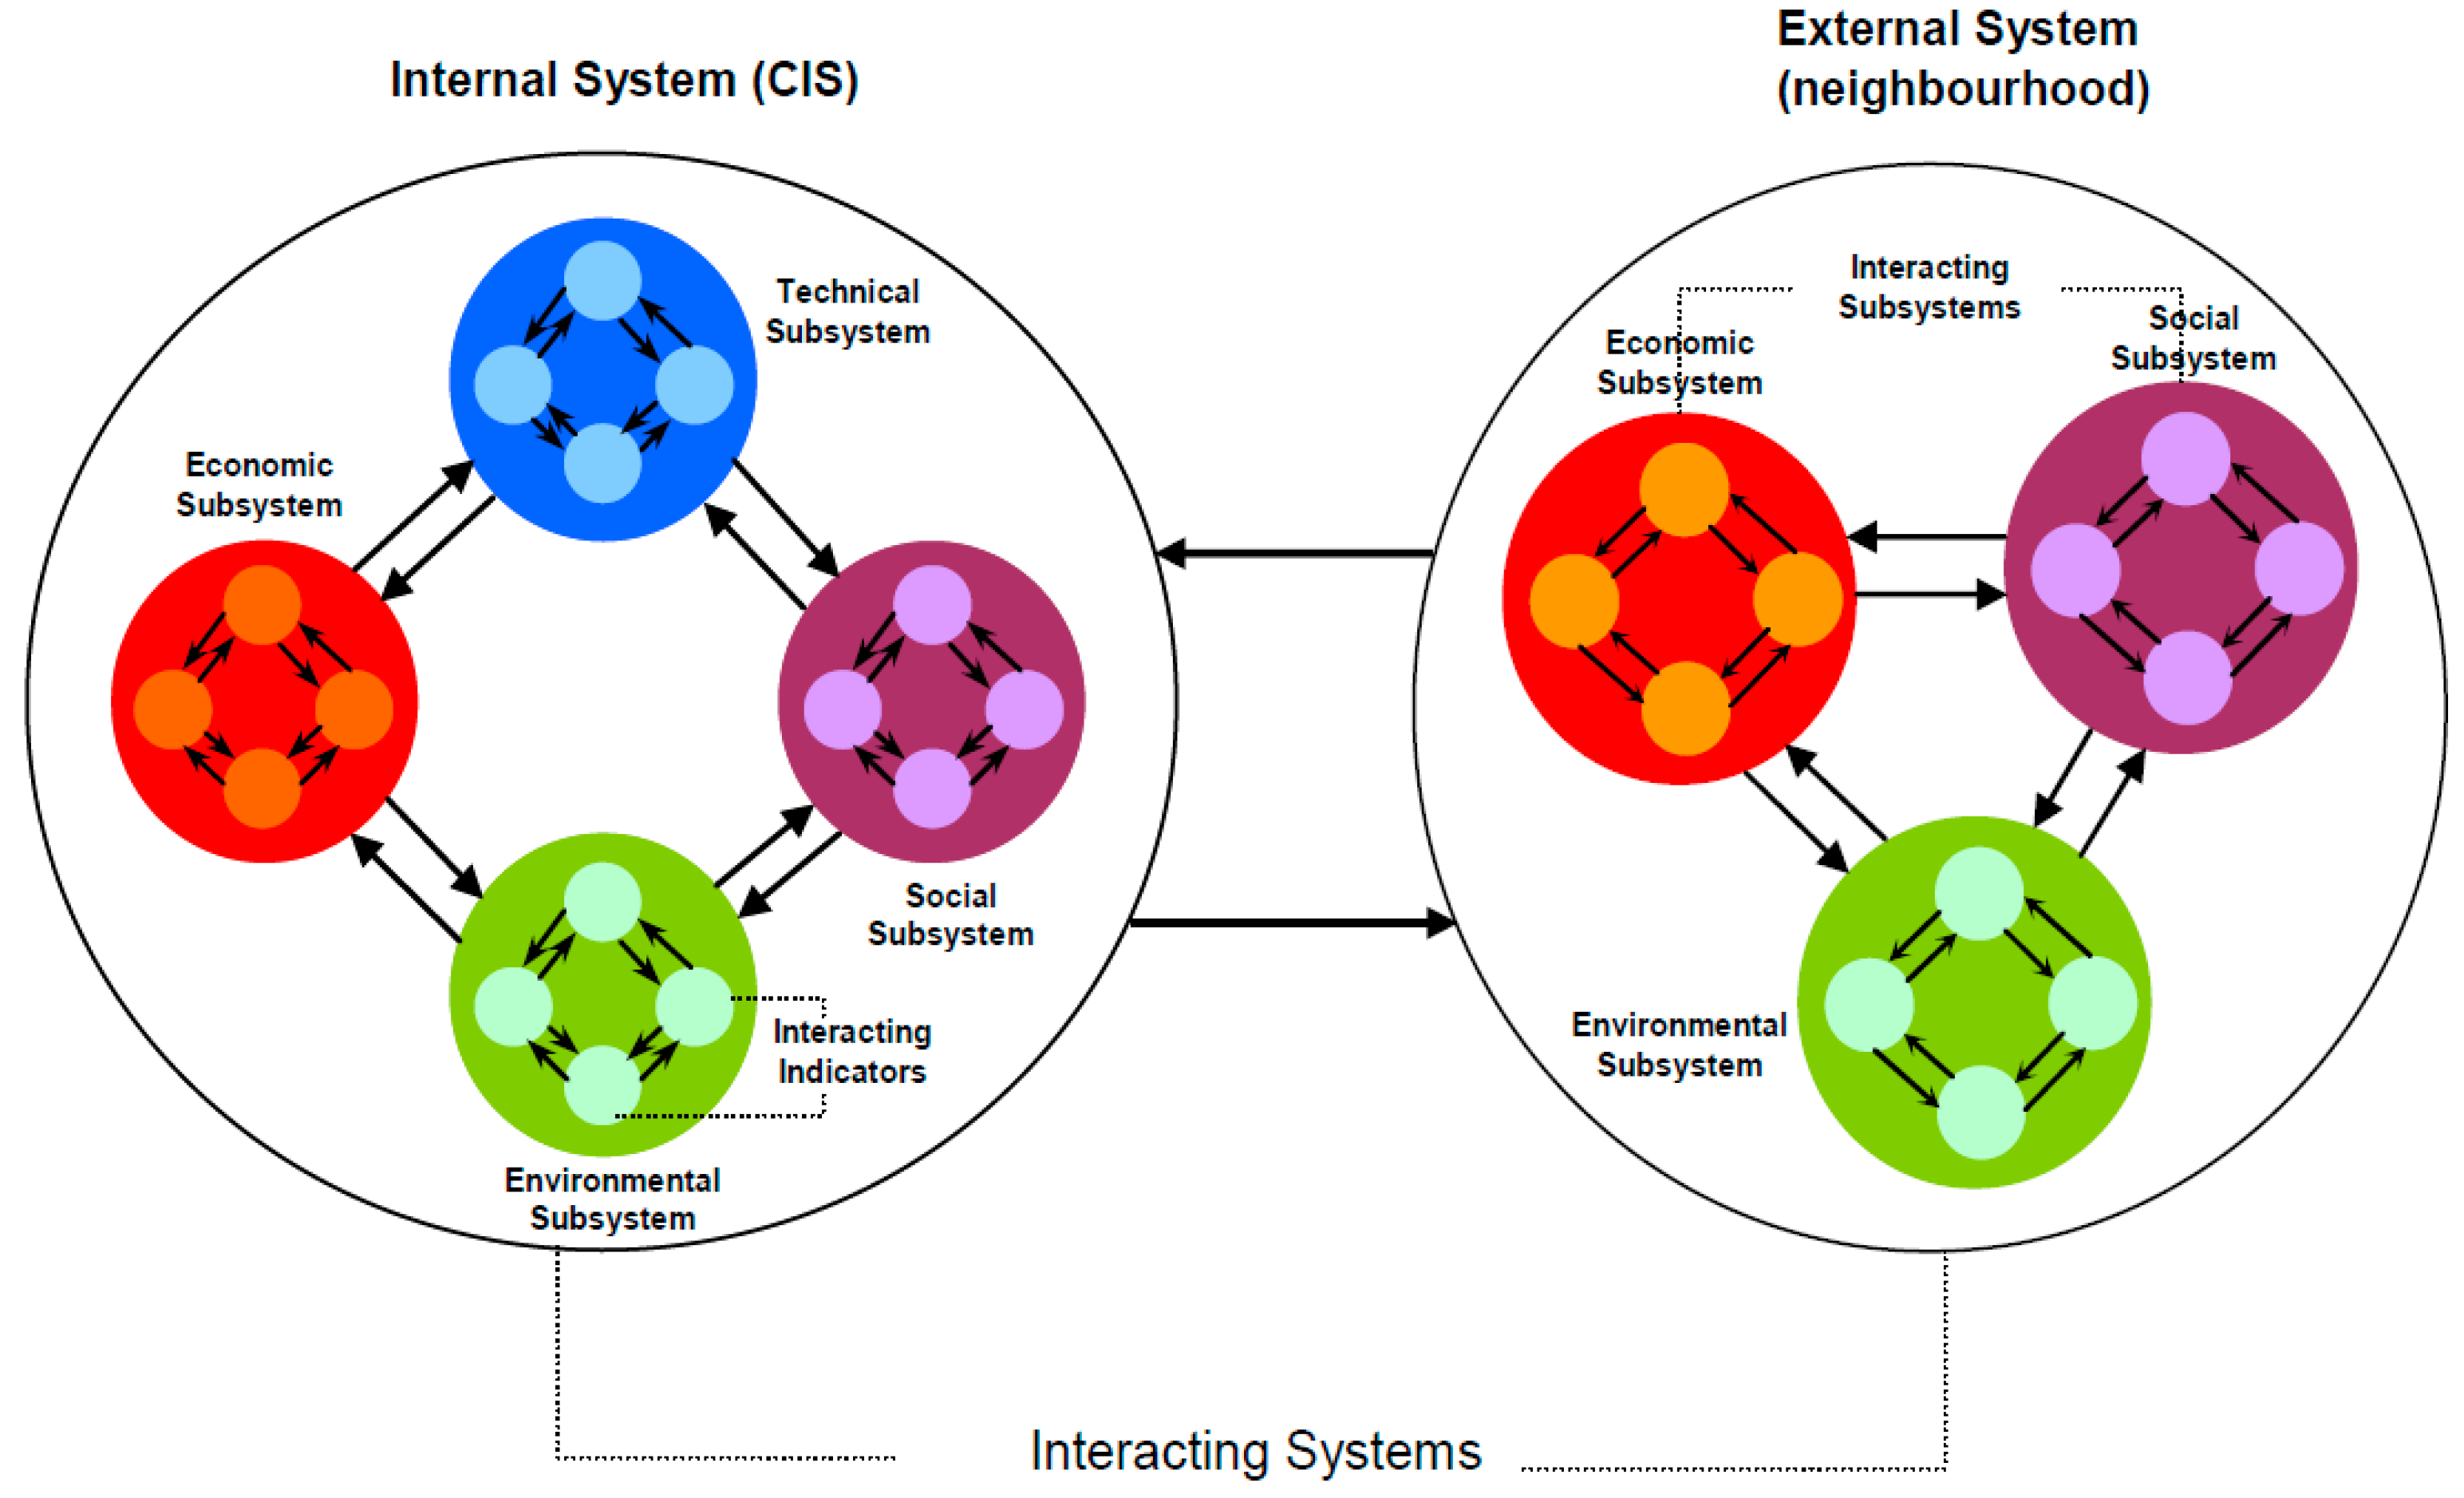
2.2.3. The Circular, Triangular and Network Structure


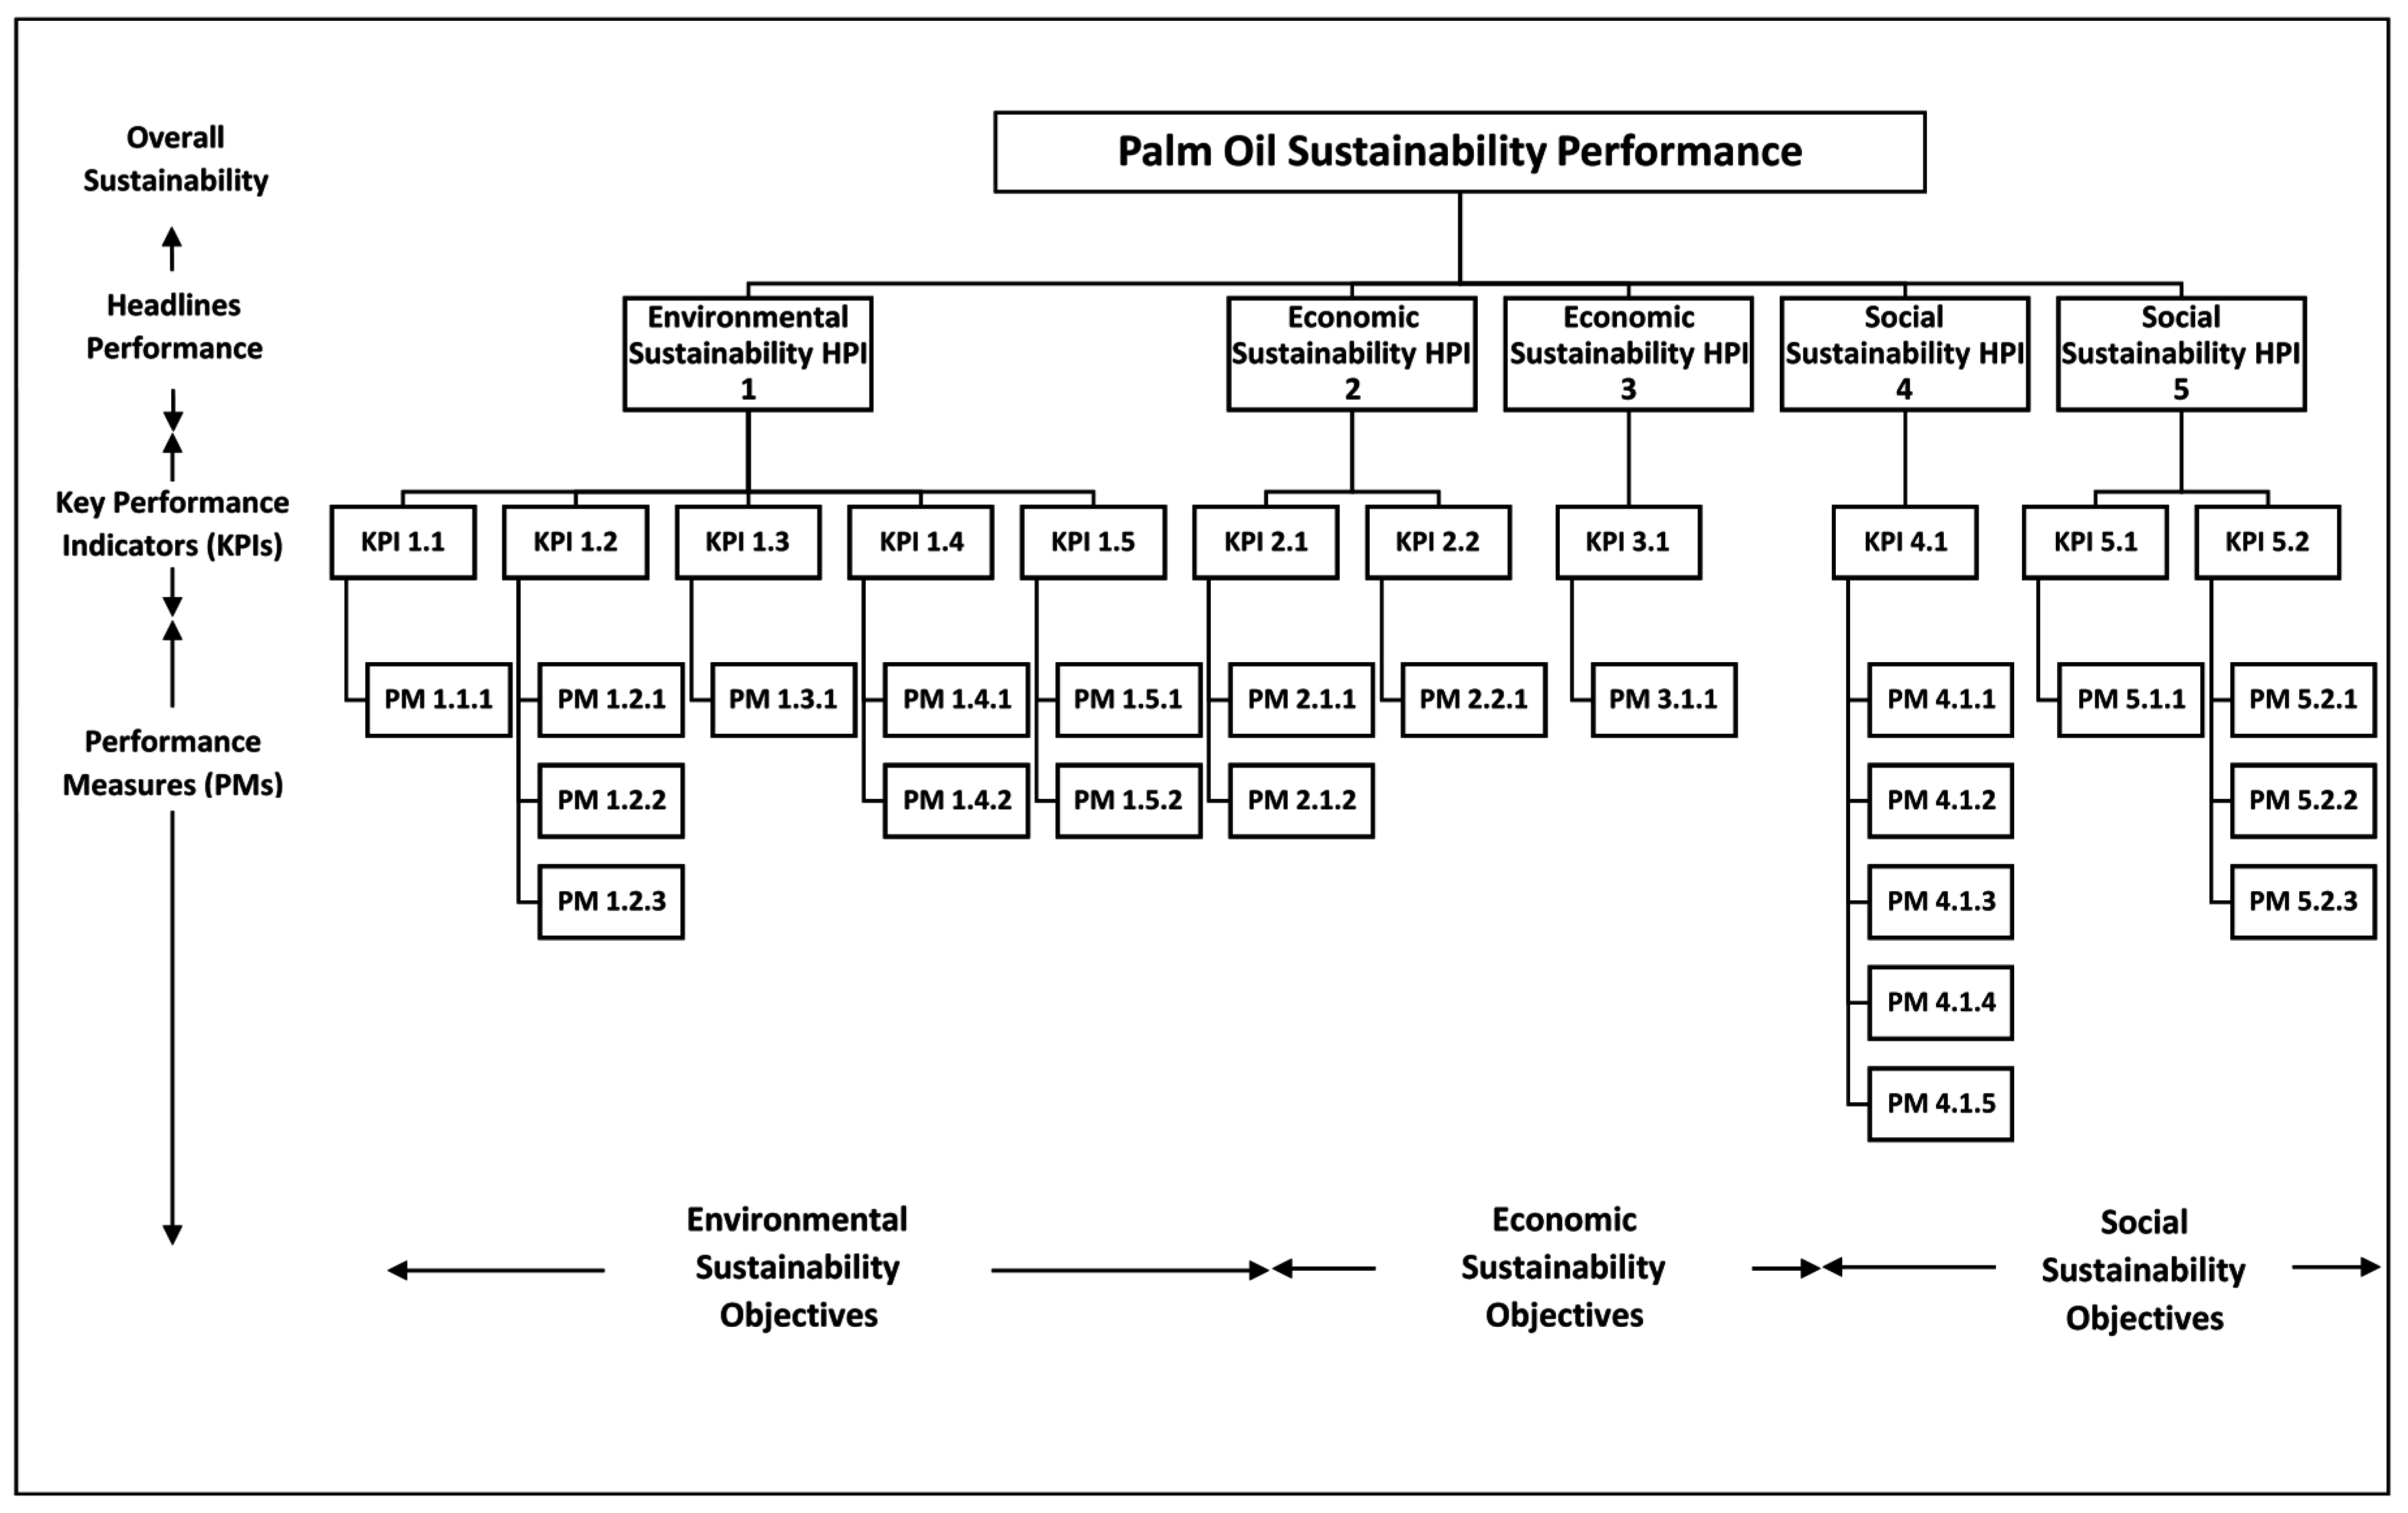
2.3. Description of the Selected Assessment Framework

2.4. Selection of Indicators: HPI, KPI and PM
2.4.1. HPI, KPI and PM for Environmental Sustainability Objectives
- Elements, i.e., climate, quality of air, water that contribute to the ecosystem’s overall integrity and functions of ecosystem services.
- Biodiversity, conservation of all species of plants, animals and other organisms.
- Renewable resources, e.g., soil, forest, cultivated land and fish stocks that replenish at natural rate.
- Non-renewable resources e.g., fossil fuel and minerals that deplete over time.

| Sustainability Objective: Environment | |||||
|---|---|---|---|---|---|
| Headline Performance Indicator 1: Natural Capital Conservation | |||||
| Key Performance Indicator | Performance Measures | Ranking Value | |||
| 1.1 | Climate Change | 1.1.1 | GHG Emission | 1 | > 1 tCO2eq/tonne CPO |
| 2 | > 0.8 tCO2eq/tonne CPO | ||||
| 3 | 0.5–0.8 tCO2eq/tonne CPO | ||||
| 4 | < 0.50 tCO2eq/tonne CPO | ||||
| 5 | < 0.15 tCO2eq/tonne CPO | ||||
| 1.2 | Air, Water and Soil Quality | 1.2.1 | NOx emission intensity from palm oil mill | 1 | >400 mg/m3 emission (continuous) |
| 2 | >350 mg/m3 emission (continuous) | ||||
| 3 | <350 mg/m3 emission (continuous) | ||||
| 4 | <200 mg/m3 emission (continuous) | ||||
| 5 | <100 mg/m3 emission (continuous) | ||||
| 1.2.2 | Biological Oxygen Demand of water discharged from POME pond | 1 | >150 mg/L (3 days, 30 degC) | ||
| 2 | >100 mg/L (3 days, 30 degC) | ||||
| 3 | <100 mg/L (3 days, 30 degC) | ||||
| 4 | <50 mg/L (3 days, 30 degC) | ||||
| 5 | <25 mg/L (3 days, 30 degC) | ||||
| 1.2.3 | Soil Nitrate Level measured through nitrogen in waterway | 1 | Total nitrogen >300 mg/L | ||
| 2 | Total nitrogen >200 mg/L | ||||
| 3 | Total nitrogen <200 mg/L | ||||
| 4 | Total nitrogen <100 mg/L | ||||
| 5 | Total nitrogen <50 mg/L | ||||
| 1.3 | Waste Generation | 1.3.2 | % biomass recovery/ recycling | 1 | <25% recovery |
| 2 | >25% recovery | ||||
| 3 | >50% recovery | ||||
| 4 | >75% recovery | ||||
| 5 | 100% recovery | ||||
| 1.4 | Biodiversity | 1.4.1 | Plantation Practice | 1 | Replacement of forest |
| 2 | Total/large area replanting | ||||
| 3 | Increase heterogeneity through patch planting | ||||
| 4 | Increase connectivity through successive strips/ connectivity | ||||
| 5 | Reduce severity of disturbance through variable rotation | ||||
| 1.4.2 | Land Use | 1 | Planted on Peat Land/HCVF | ||
| 2 | Planted on secondary forest/replaced other crops | ||||
| 3 | Replanting on agricultural land | ||||
| 4 | Replanting with Best Management Practice | ||||
| 5 | Replanting with agricultural intensification | ||||
| 1.5 | Resources Consumption | 1.5.1 | Fresh water consumption intensity—Water Footprint | 1 | > 85 m3/GJ |
| 2 | >75 m3/GJ | ||||
| 3 | 62 m3/GJ | ||||
| 4 | <62 m3/GJ | ||||
| 5 | <50 m3/GJ | ||||
| 1.5.2 | Fossil fuel consumption intensity (Output/Input energy ratio) | 1 | <7 | ||
| 2 | <9 | ||||
| 3 | 9 | ||||
| 4 | >10 | ||||
| 5 | >12 | ||||
2.4.2. HPI, KPI and PM for Economic Sustainability Objectives
| Sustainability Objective: Economy | |||||
|---|---|---|---|---|---|
| Headline Performance Indicator 2: Business Continuity and Resiliency | |||||
| Key Performance Indicator | Performance Measures | Ranking Value | |||
| 2.1 | Production efficiency | 2.1.1 | Plantation yield | 1 | <16 tonne per ha |
| 2 | < 17 tonne per ha per year | ||||
| 3 | 19 tonne per ha per year | ||||
| 4 | >19 tonne per ha per year | ||||
| 5 | >20 tonne per ha per year | ||||
| 2.1.2 | Mill production efficiency | 1 | <0.20 tonne CPO per tonne FFB | ||
| 2 | <0.21tonne CPO per tonne FFB | ||||
| 3 | 0.21 tonne CPO per tonne FFB | ||||
| 4 | >0.21 tonne CPO per tonne FFB | ||||
| 5 | >0.22 tonne CPO per tonne FFB | ||||
| 2.2 | Business continuity | 2.2.1 | Actual Growth Rate | 1 | >15% deviation from Sustainable Growth Rate |
| 2 | 15% deviation from Sustainable Growth Rate | ||||
| 3 | 10% deviation from Sustainable Growth Rate | ||||
| 4 | 5% deviation from Sustainable Growth Rate | ||||
| 5 | 0% deviation from Sustainable Growth Rate | ||||
| Headline Performance Indicator 3: Sharing of Economic Power | |||||
| Key Performance Indicator | Performance Measures | Ranking Value | |||
| 3.1 | Relative Poverty | 3.1.1 | Average annual income per worker | 1 | <25% of national median income |
| 2 | <50% of national median income | ||||
| 3 | ≥50% of national median income | ||||
| 4 | >75% of national median income | ||||
| 5 | ≥100% of national median income | ||||
2.4.3. HPI, KPI and PM for Social Sustainability Objectives
| Sustainability Objective: Social | |||||
|---|---|---|---|---|---|
| Headline Performance Indicator 4: Social Wellbeing | |||||
| Key Performance Indicator | Performance Measures | Ranking Value | |||
| 4.1 | Meeting Essential Human Needs | 4.1.1 | Employment opportunity for the local | 1 | <25% local employment |
| 2 | ≥25% local employment | ||||
| 3 | >50% local employment | ||||
| 4 | >75% local employment | ||||
| 5 | 100% local employment | ||||
| 4.1.2 | Workers’ accessibility to water supply | 1 | <25% accessible to portable water | ||
| 2 | >25% accessible to portable water | ||||
| 3 | >50% accessible to portable water | ||||
| 4 | >75% accessible to portable water | ||||
| 5 | 100% accessible to portable water | ||||
| 4.1.3 | Workers’ accessibility to healthcare | 1 | <25% accessible to healthcare facilities | ||
| 2 | >25% accessible to healthcare facilities | ||||
| 3 | >50% accessible to healthcare facilities | ||||
| 4 | >75% accessible to healthcare facilities | ||||
| 5 | 100% accessible to healthcare facilities | ||||
| 4.1.4 | Provision of sanitation facilities to workers | 1 | <25% accessible to sanitation facilities | ||
| 2 | >25% accessible to sanitation facilities | ||||
| 3 | >50% accessible to sanitation facilities | ||||
| 4 | >75% accessible to sanitation facilities | ||||
| 5 | 100% accessible to sanitation facilities | ||||
| 4.1.5 | Provision of housing facilities to workers | 1 | <25% provision to housing facilities | ||
| 2 | >25% provision to housing facilities | ||||
| 3 | >50% provision to housing facilities | ||||
| 4 | >75% provision to housing facilities | ||||
| 5 | 100% provision to housing facilities | ||||
| Headline Performance Indicator 5: Social Equality | |||||
| Key Performance Indicator | Performance Measures | Ranking Value | |||
| 5.1 | Equal opportunity to the poor | 5.1.1 | Smallholders’ equity | 1 | <25% of CPO sourced from smallholders |
| 2 | >25% of CPO sourced from smallholders | ||||
| 3 | >50% of CPO sourced from smallholders | ||||
| 4 | >75% of CPO sourced from smallholders | ||||
| 5 | 100% of CPO sourced from smallholders | ||||
| 5.2 | Local community empowerment and engagement | 5.2.1 | Access to information and knowledge | 1 | No information available |
| 2 | Information available but local community are not informed | ||||
| 3 | Local community informed prior to the plantation and mill development | ||||
| 4 | Local community informed periodically on the plantation and mill development | ||||
| 5 | Local community are timely updated | ||||
| 5.2.2 | Community involvement in decision making | 1 | No involvement at all | ||
| 2 | Indirect communication channels are available | ||||
| 3 | Local community could provide feedback to plantation owner/mill management through establish channel | ||||
| 4 | Local community has representation in plantation/mill HSE Committee | ||||
| 5 | Consensus from local community is mandatory for any decision that impact them | ||||
| 5.2.3 | Level of community acceptance to plantation and mill activities | 1 | <25% agreement from community | ||
| 2 | <50% agreement from community | ||||
| 3 | >50% agreement from community | ||||
| 4 | >75% agreement from community | ||||
| 5 | 100% agreement from community | ||||
3. Testing the Framework
3.1. Five-level Ranking System & Development of Benchmarking Criteria
- Values that are considered ecologically and socially sustainable from the Malaysian context, and are obtained from literature research, multidimensional analysis and system modelling.
- Values that meet the national target set by the International Treaties.
- Values that meet relevant Malaysian legislative requirements.
- Average oil crop performance value as that will provide a benchmark for oil palm production, compared with other competing oil crops in the world.
- Optimum palm oil plantation performance value in the context of Malaysian plantations considering the fact that yield could vary with soil types and farming practices in different agro-ecological and hydrological zones across the country.
- Best possible performance values of existing technology (i.e., palm oil mill) that is available in the Malaysian market.
3.2. Performance Measure Calculation Formula
- ■
- The performance of each KPI = the average ranking of PMs related to it.where, 1.1.1, 1.1.2, …, 1.1.n represents score for first PM, second PM and nth PM of KPI 1.1.
- ■
- Performance of each HPI = average performance of related KPIs.where, 1.1, 1.2, …, 1.n represents score for first KPI, Second KPI and nth KPI of HPI 1.
- ■
- Overall sustainability performance = the average ranking of HPIs related to all three triple bottom line objectives.where, 1, 2, …, n represents score for first HPI, Second HPI and nth HPI of respective sustainability objective.
4. Results
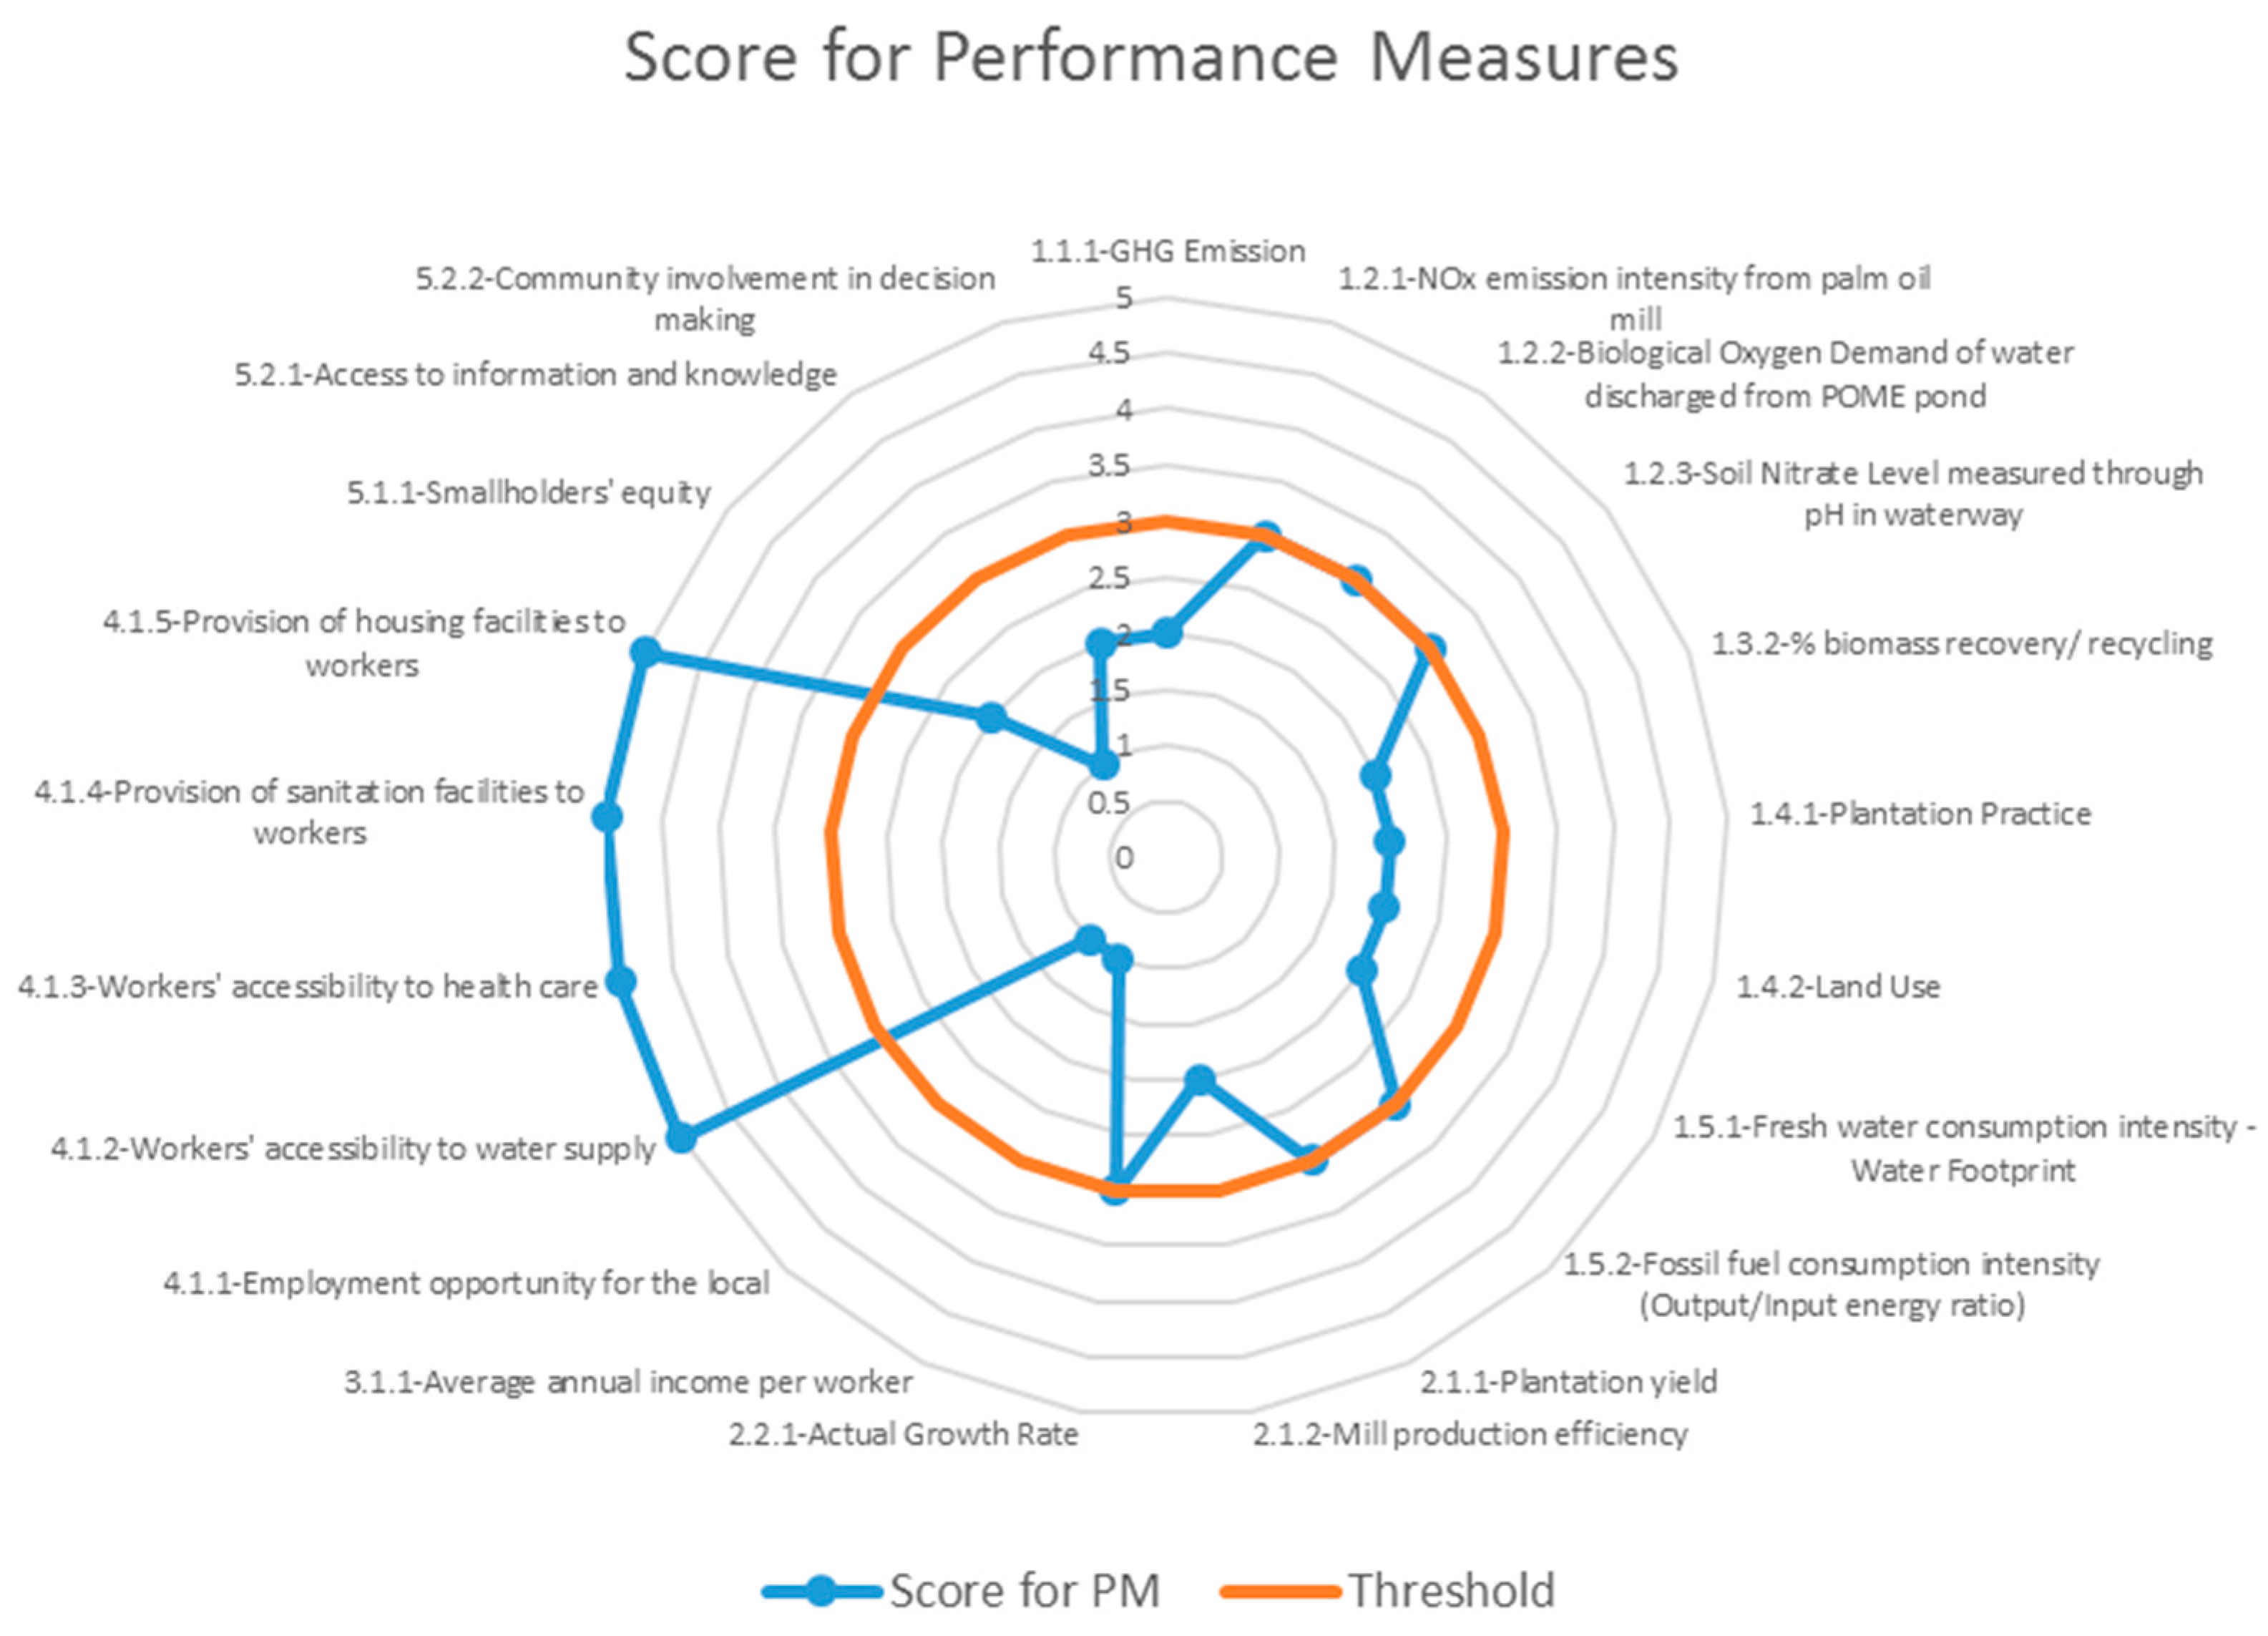
| Performance Measures | Score for PM | Justification and Reference | |
|---|---|---|---|
| Environmental Sustainability Objective | |||
| 1.1.1 | GHG Emission | 2 | 87% mill in Malaysia do not have biogas facilities. Thus most of the production system has GHG emission around 0.97 tCO2/tonne CPO [13] |
| 1.2.1 | NOx emission intensity from palm oil mill | 3 | It is assumed that meeting the regulation requirement is mandatory |
| 1.2.2 | Biological Oxygen Demand of water discharged from POME pond | 3 | It is assumed that meeting the regulation requirement is mandatory |
| 1.2.3 | Soil Nitrate Level measured through pH in waterway | 3 | It is assumed that meeting the regulation requirement is mandatory |
| 1.3.2 | % biomass recovery/recycling | 2 | Palm oil mill mass balance shows that >50% of biomass produced goes to Palm Oil Mill Effluent (POME). For mill without biogas capture, biomass recovery will be <50% and majority of mill in Malaysia do not have an anaerobic digester to generate biogas |
| 1.4.1 | Plantation Practice | 2 | Large plantations in Malaysia commonly practice large area replantation [75] |
| 1.4.2 | Land Use | 2 | Largest portion of land-use change for palm oil plantation happened during 1990–2006, and 42% are from rubber plantation conversion [64] |
| 1.5.1 | Fresh water consumption intensity—Water Footprint | 2 | Palm oil water footprint is recorded as 75 m3/GJ [91] |
| 1.5.2 | Fossil fuel consumption intensity (Output/Input energy ratio) | 3 | Fossil fuel consumption for palm oil production or fossil fuel intensity (Output energy of oil produced/Input energy of fossil fuel consumed) is recorded as 9 in 2014 [85] |
| Economic Sustainability Objective | |||
| 2.1.1 | Plantation yield | 3 | Refer to Malaysian average FFB yield per ha per year for 2014, i.e., 18.63 [88] |
| 2.1.2 | Mill production efficiency | 2 | Refer to MPOB statistic 2014, Oil extraction rate in average for palm oil mill is 20.62% [88] |
| 2.2.1 | Actual Growth Rate | 3 | Ideal condition with score of 5 would be zero deviation from sustainable growth rate. Growth rate is very much dependent on specific supply chain economic performance. Thus for overall evaluation it is assumed at 3 with 10% deviation |
| 3.1.1 | Average annual income per worker | 1 | Malaysia median income in 2014 is RM4585 [92]. Thus, relative poverty line refer to household income ≤50% of RM4585, i.e., ≤RM2292.50. Malaysia oil palm plantation workers is earning average of RM900 as reported by Reuters [93], way below the relative poverty line |
| Social Sustainability Objective | |||
| 4.1.1 | Employment opportunity for the local | 1 | Oil palm plantations’ foreign workers employment as of 2014 is as high as 75.9% in Malaysia [94] |
| 4.1.2 | Workers’ accessibility to water supply | 5 | Workers for plantation and mill in Malaysia are supplied with portable water [3] |
| 4.1.3 | Workers’ accessibility to healthcare | 5 | Workers for plantation and mill in Malaysia are supplied with healthcare access [3] |
| 4.1.4 | Provision of sanitation facilities to workers | 5 | Workers for plantation and mill in Malaysia are supplied with sanitation facilities [3] |
| 4.1.5 | Provision of housing facilities to workers | 5 | Workers for plantation and mill in Malaysia are supplied with housing facilities [3] |
| 5.1.1 | Smallholders’ equity | 2 | Smallholders contribute to 35%–45% of CPO production as in 2015 [95] |
| 5.2.1 | Access to information and knowledge | 1 | Plantation and mills are not required to provide information to the local community under existing legislation. The usual practice is that most industries do not necessarily feel obliged to engage the neighbouring community [96] |
| 5.2.2 | Community involvement in decision making | 2 | Local community has no power or access to decision making in any neighbouring plantation or mill. Indirect communication will be made through area community leaders |
| 5.2.3 | Level of community acceptance to plantation and mill activities | 1 | Local community agreement or opinion is not a requirement in Malaysia for plantation/mill construction and their daily production activities [97] |
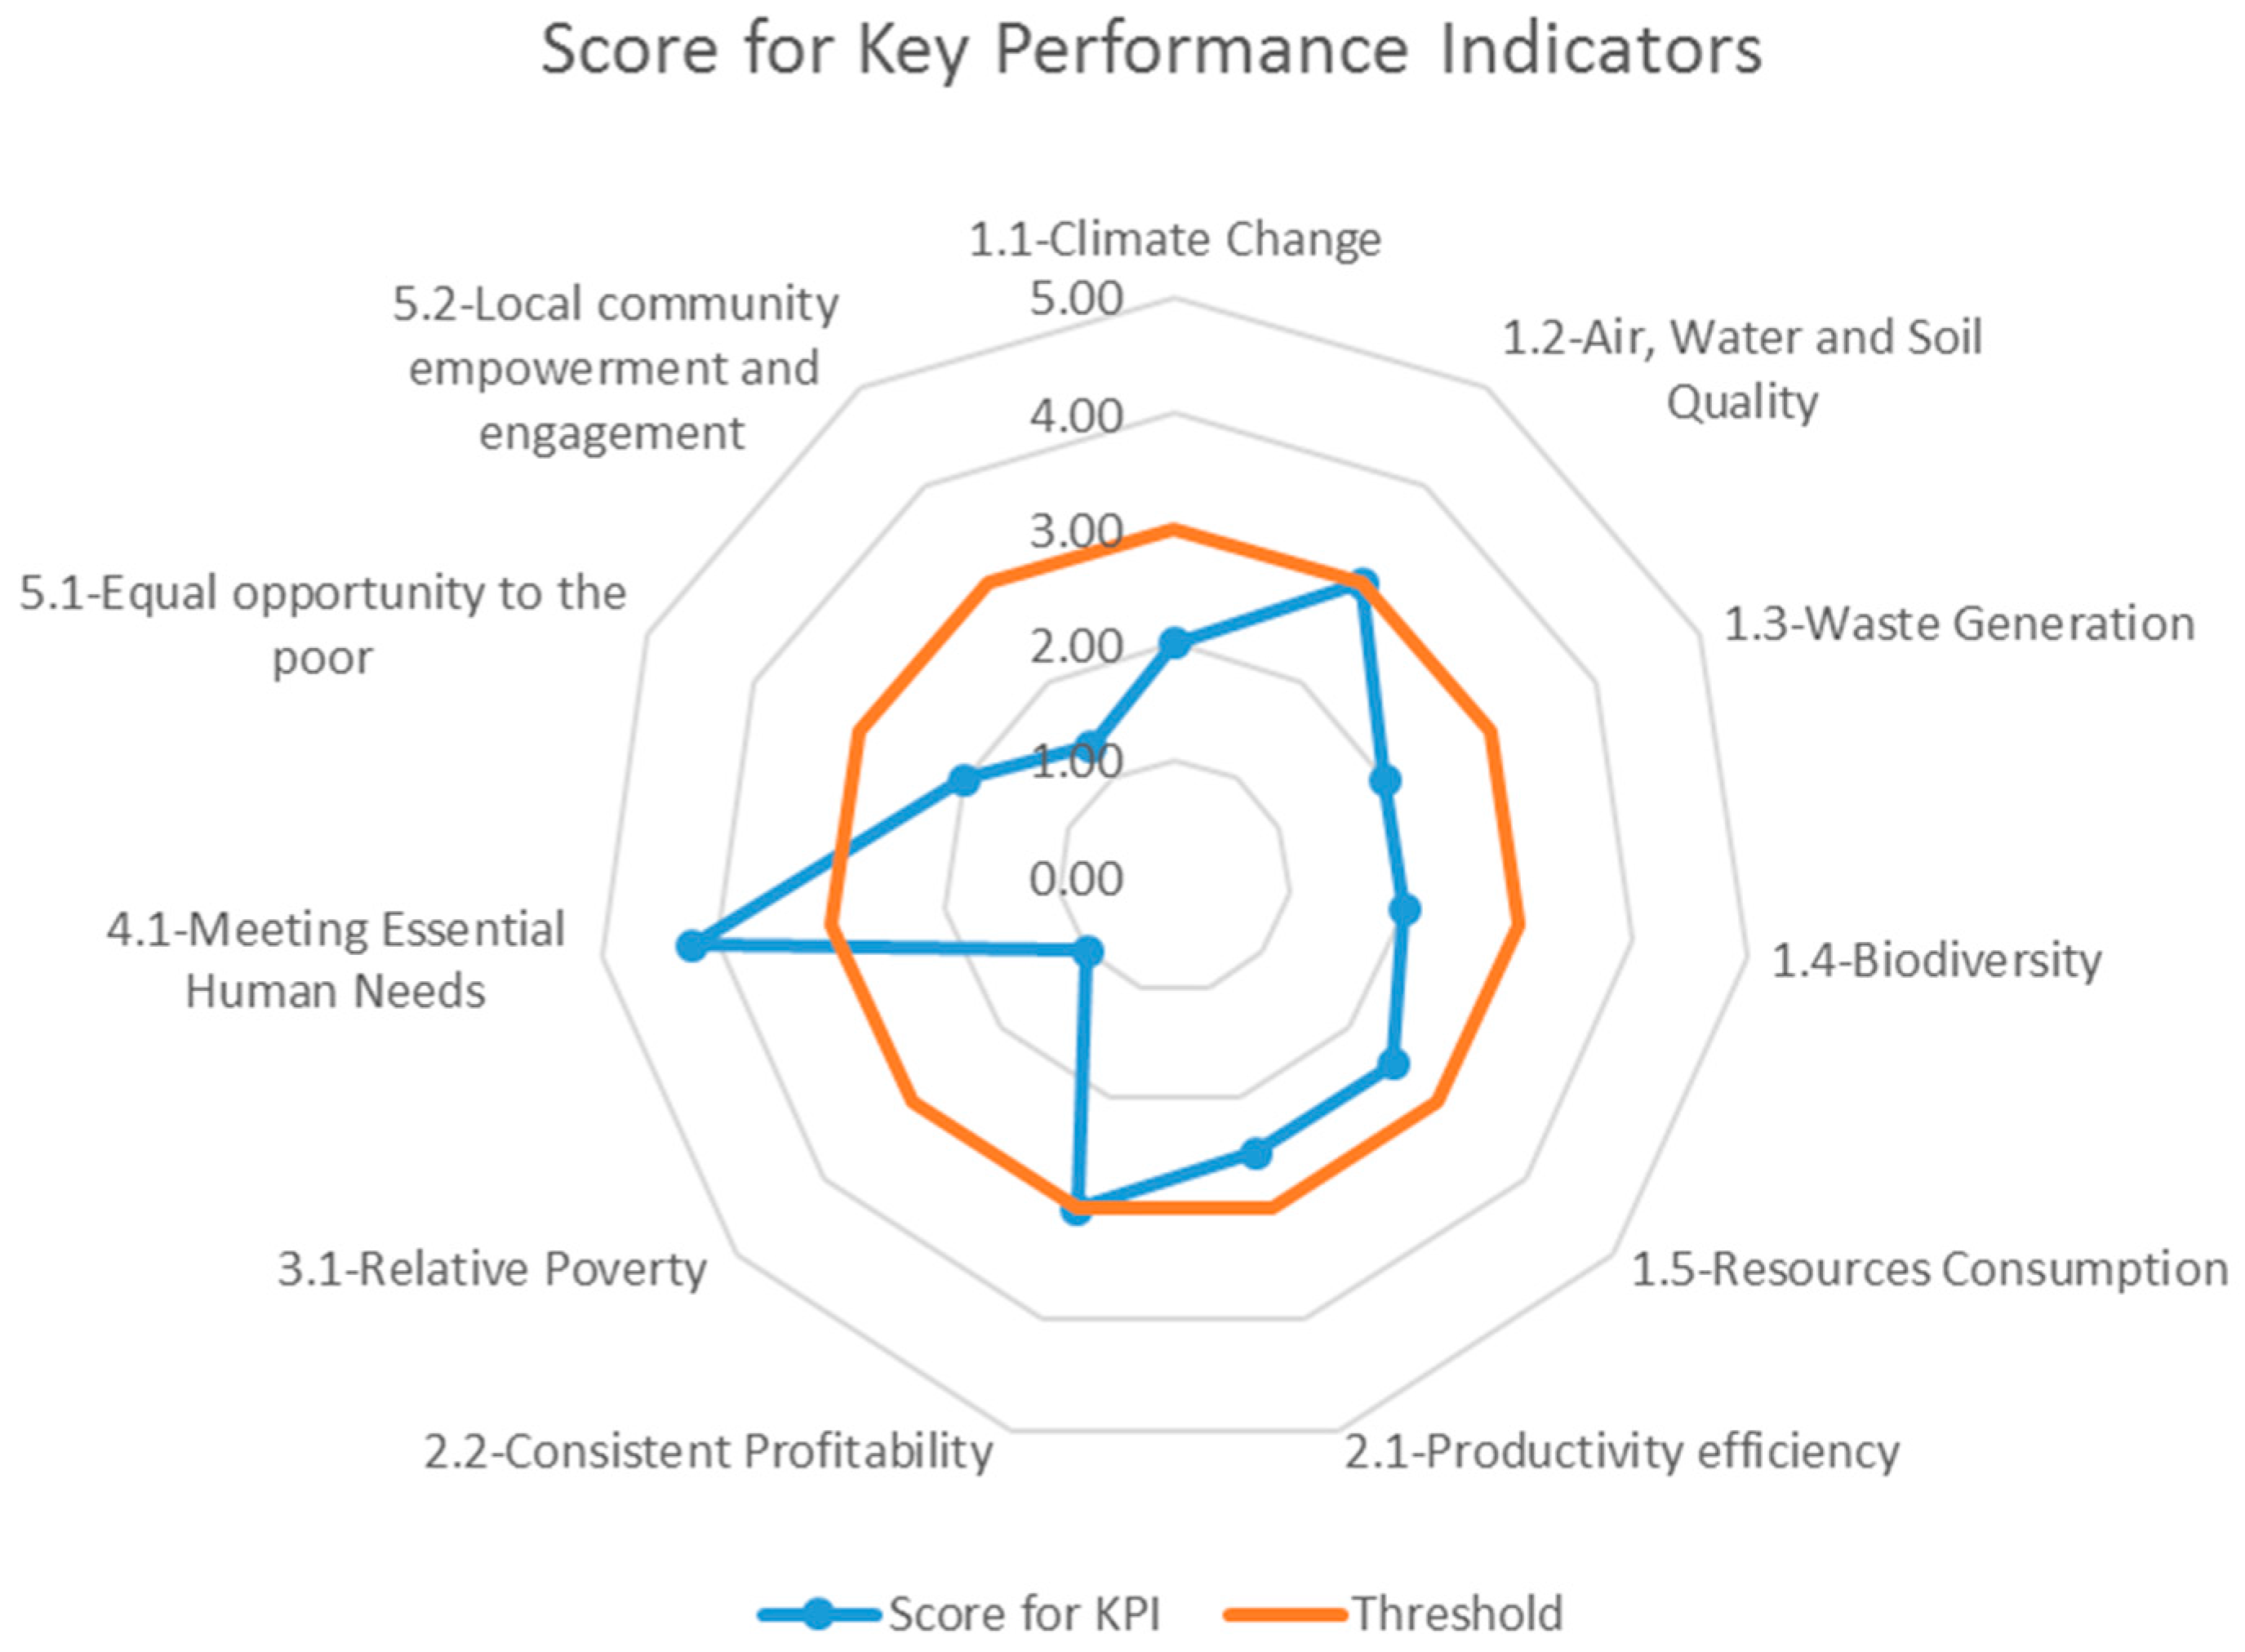
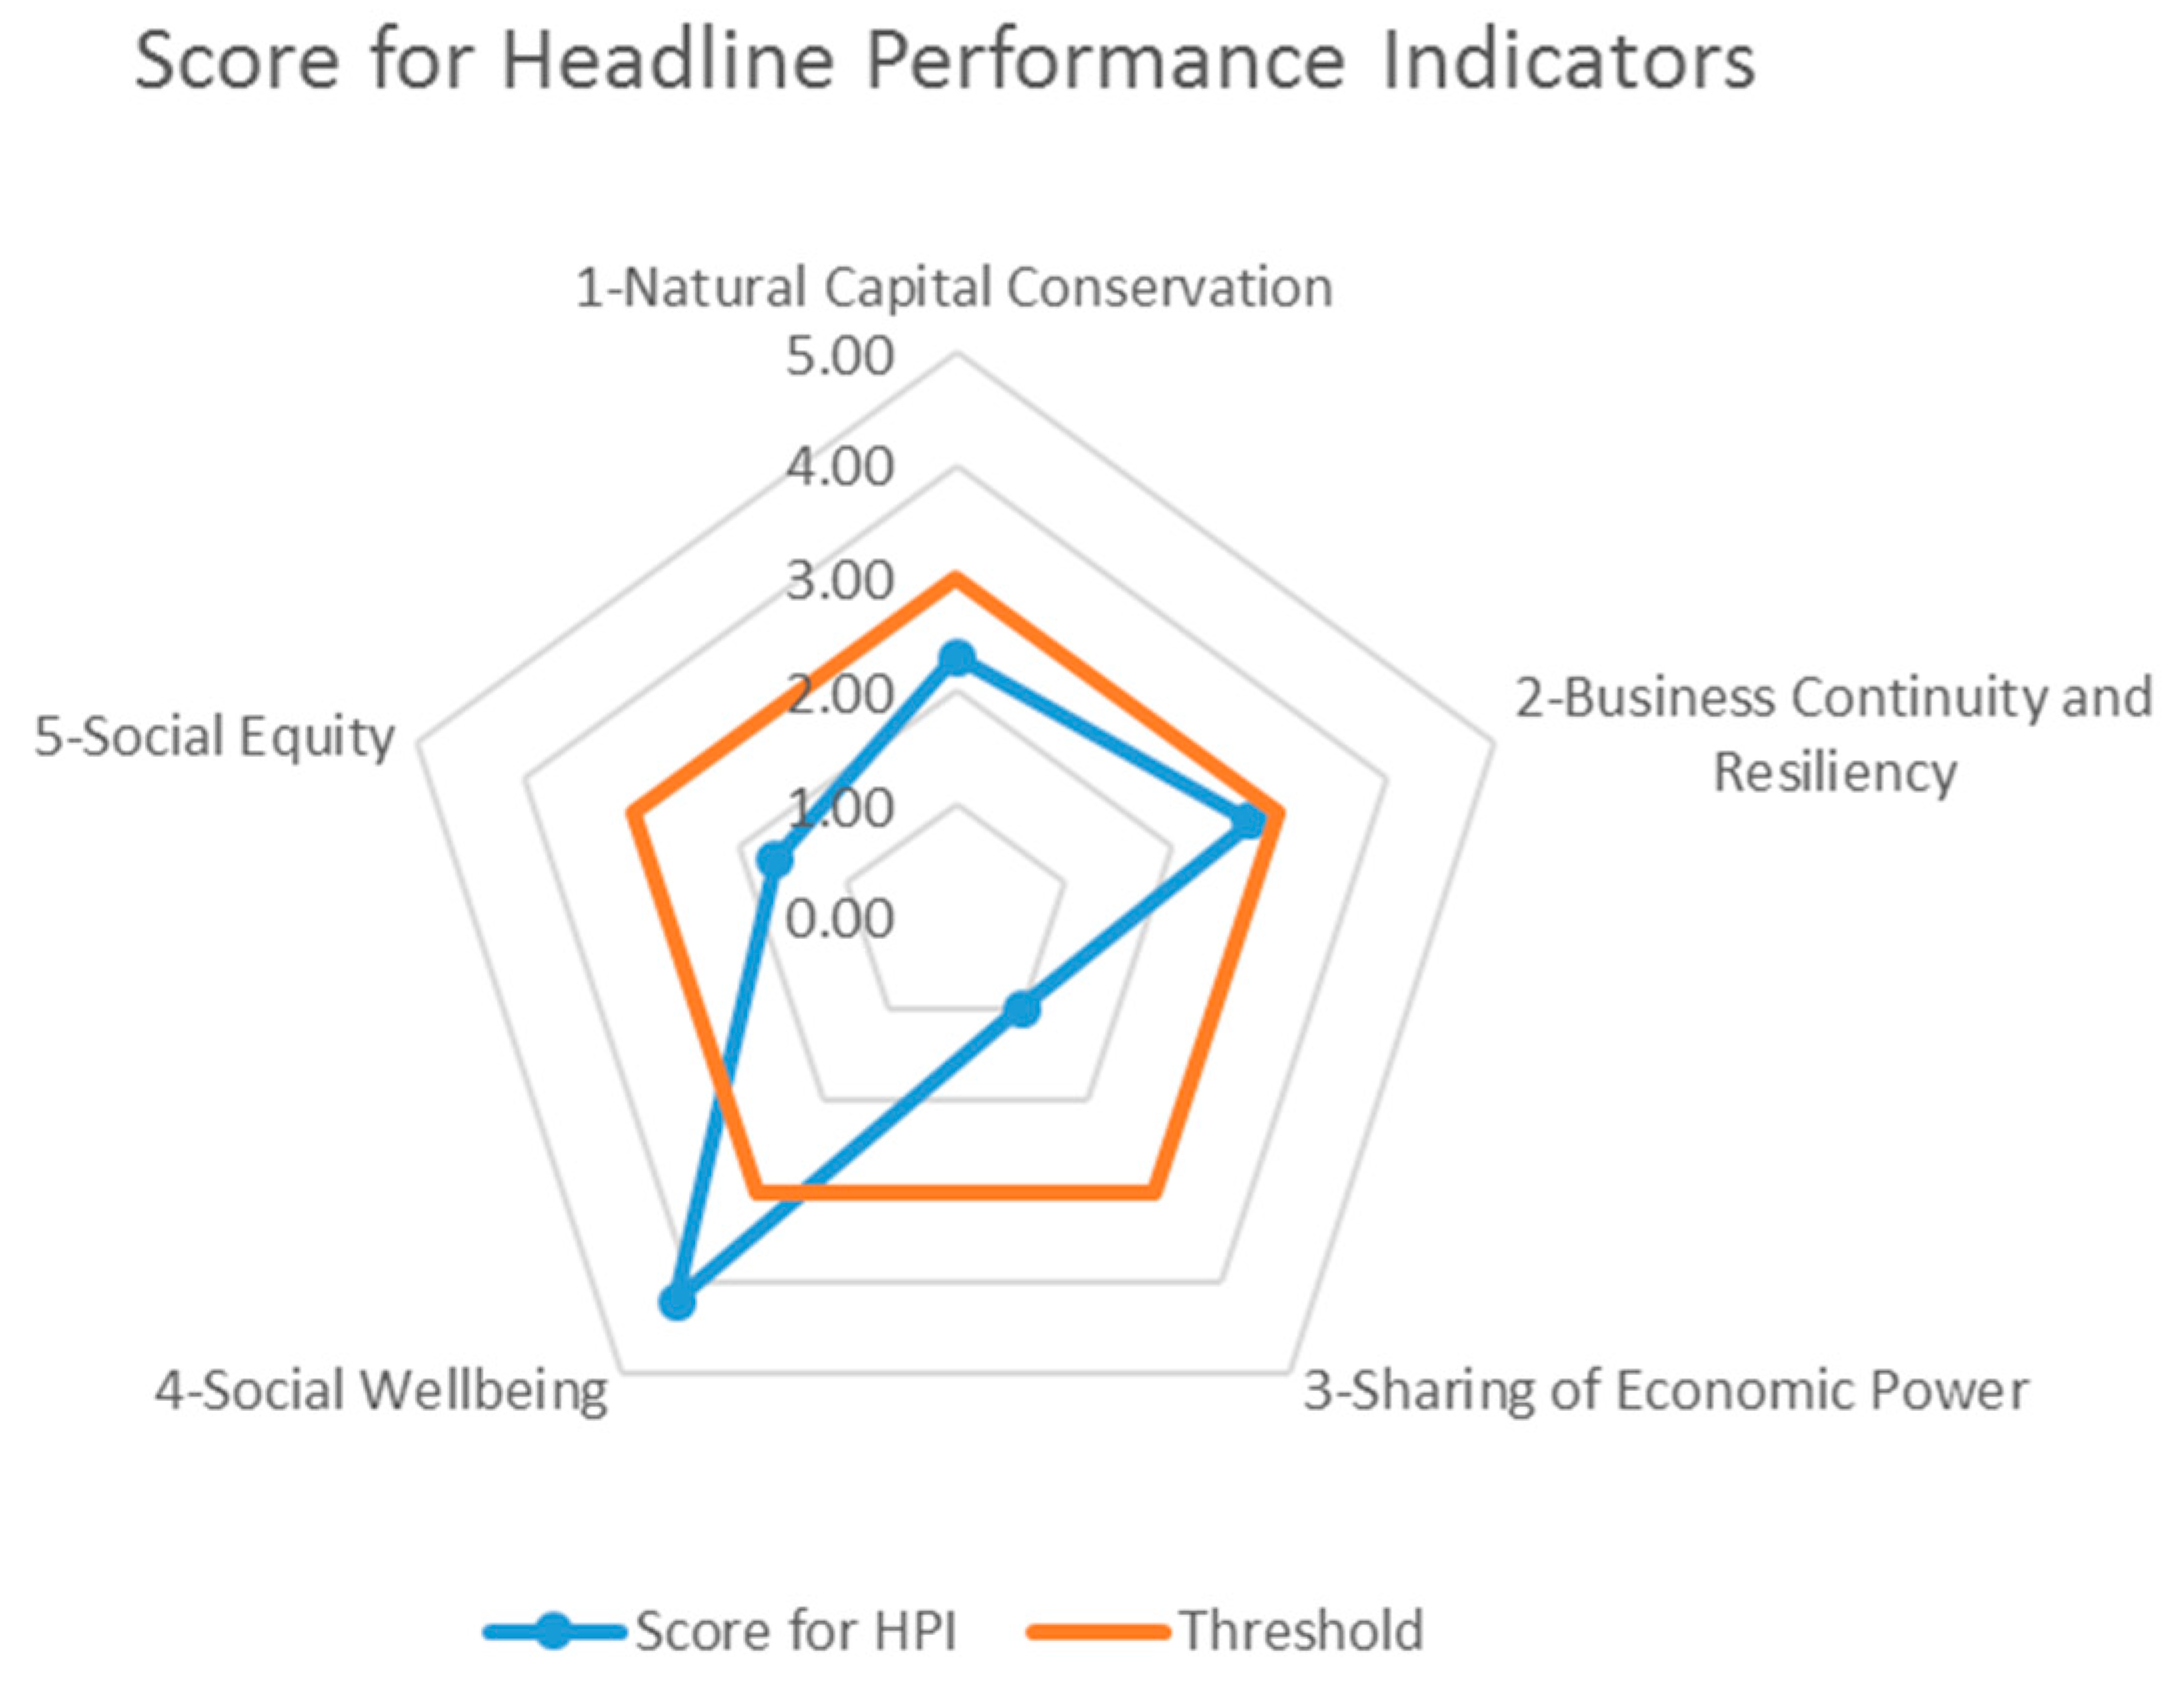
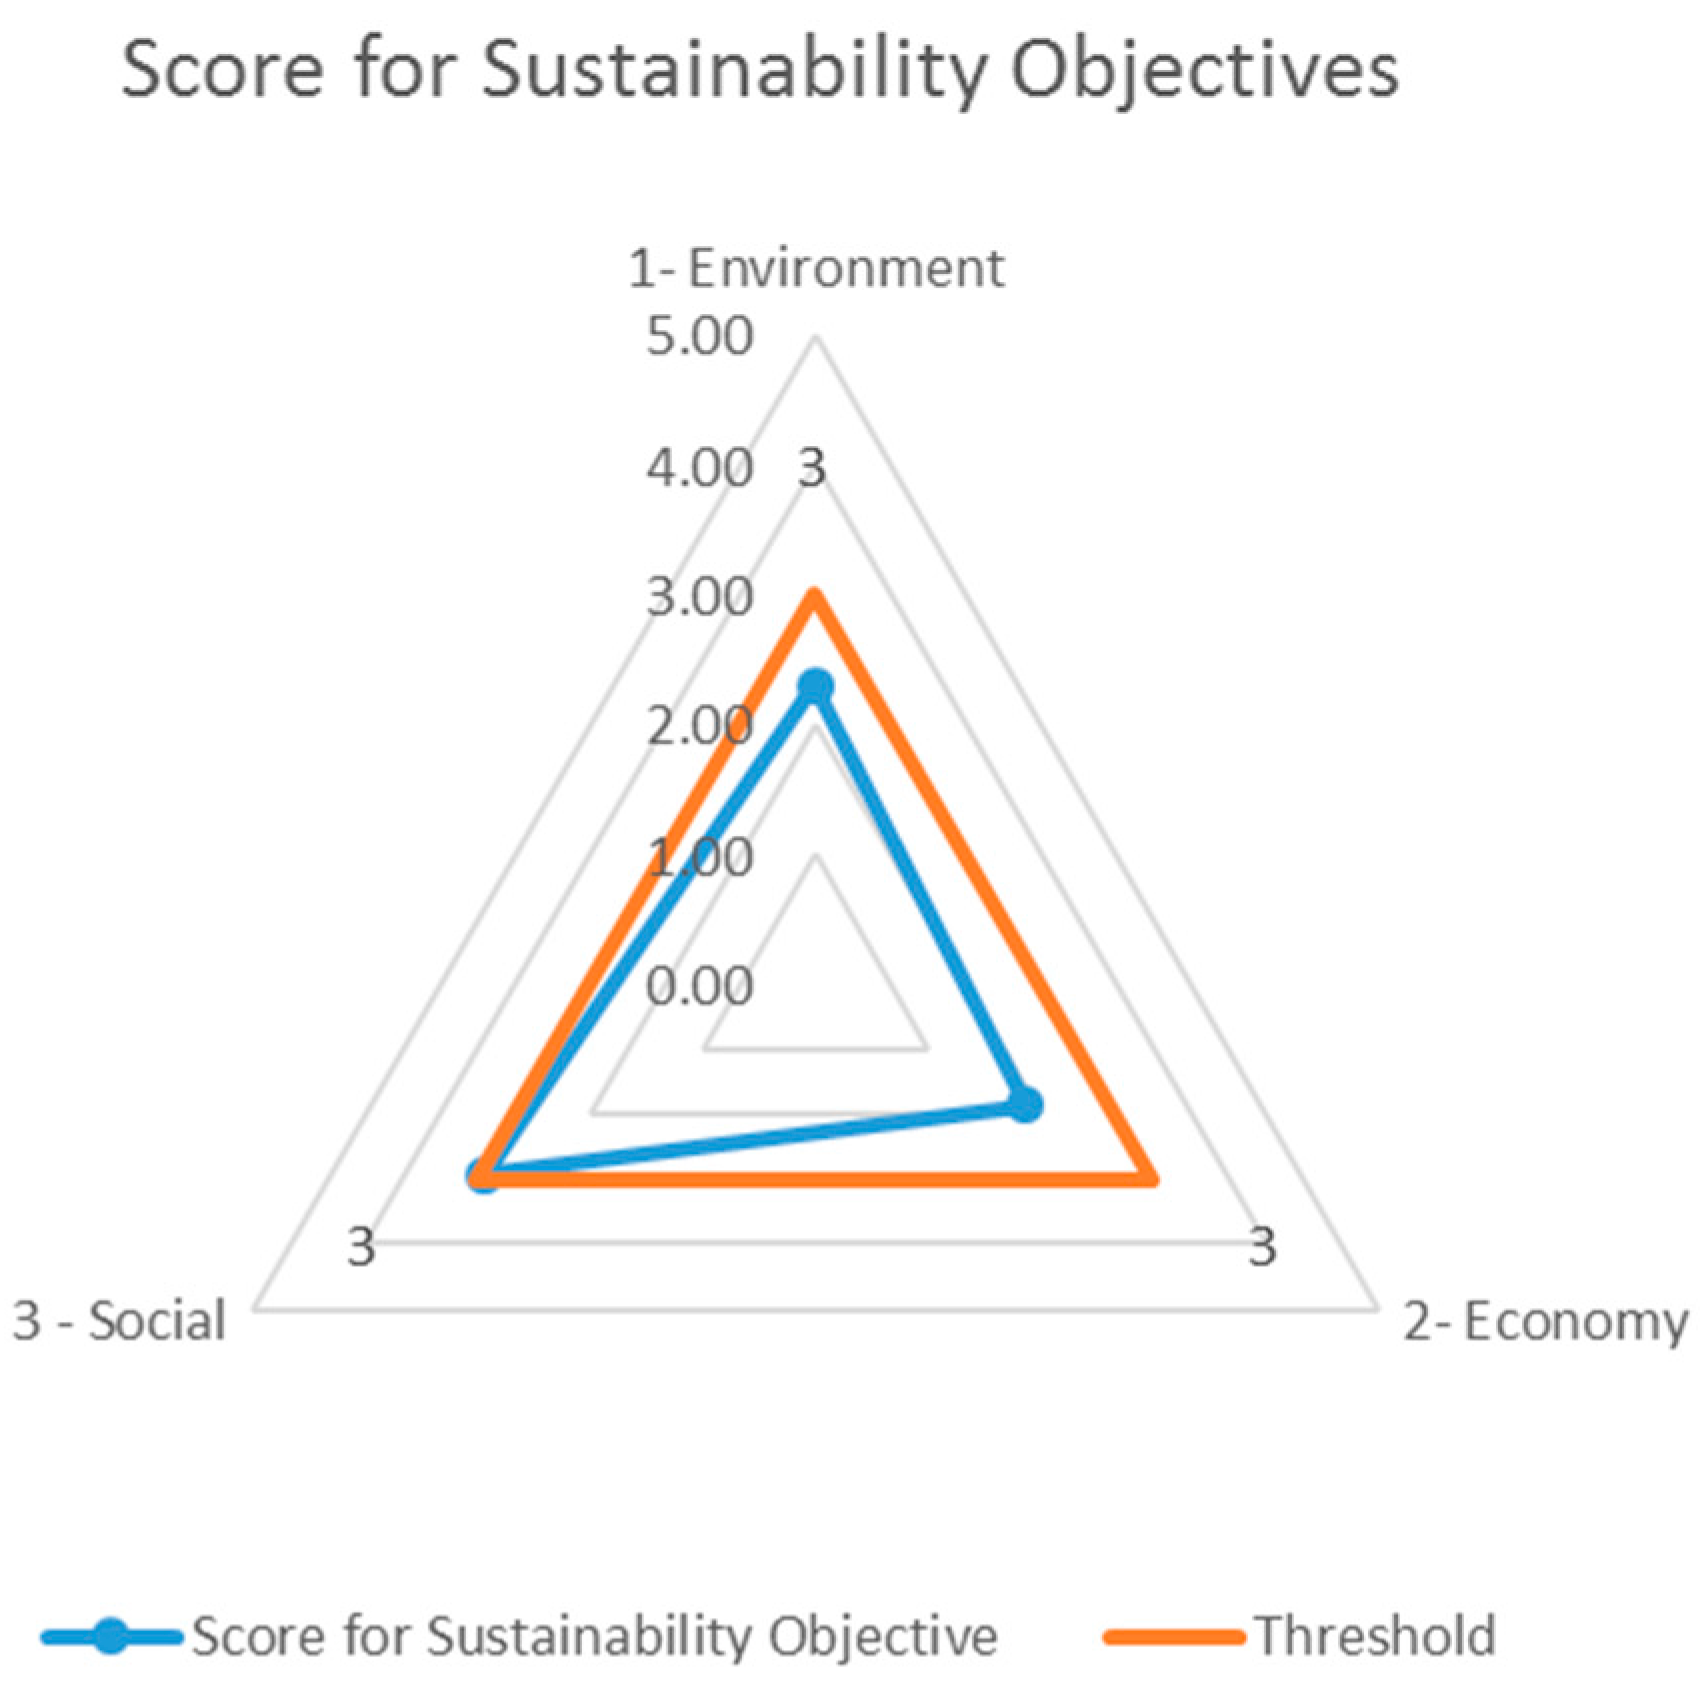
| Sustainability Objectives | Headline Performance Indicator | Key Performance Indicator | Performance Measures | Score for PM | Score for KPI | Score for HPI | Score for Sustainability Objective | Score for Overall Sustainability | |||
|---|---|---|---|---|---|---|---|---|---|---|---|
| Environment | 1 | Natural Capital Conservation | 1.1 | Climate Change | 1.1.1 | GHG Emission | 2 | 2.00 | 2.30 | 2.30 | 2.37 |
| 1.2 | Air, Water and Soil Quality | 1.2.1 | NOx emission intensity from palm oil mill | 3 | 3.00 | ||||||
| 1.2.2 | Biological Oxygen Demand of water discharged from POME pond | 3 | |||||||||
| 1.2.3 | Soil Nitrate Level measured through pH in waterway | 3 | |||||||||
| 1.3 | Waste Generation | 1.3.2 | % biomass recovery/recycling | 2 | 2.00 | ||||||
| 1.4 | Biodiversity | 1.4.1 | Plantation Practice | 2 | 2.00 | ||||||
| 1.4.2 | Land Use | 2 | |||||||||
| 1.5 | Resources Consumption | 1.5.1 | Fresh water consumption intensity—Water Footprint | 2 | 2.50 | ||||||
| 1.5.2 | Fossil fuel consumption intensity (Output/Input energy ratio) | 3 | |||||||||
| Economy | 2 | Business Continuity and Resiliency | 2.1 | Productivity efficiency | 2.1.1 | Plantation yield | 3 | 2.50 | 2.75 | 1.88 | |
| 2.1.2 | Mill production efficiency | 2 | |||||||||
| 2.2 | Business Continuity | 2.2.1 | Actual Growth Rate | 3 | 3.00 | ||||||
| 3 | Sharing of Economic Power | 3.1 | Relative Poverty | 3.1.1 | Average annual income per worker | 1 | 1.00 | 1.00 | |||
| Social | 4 | Social Well-being | 4.1 | Meeting Essential Human Needs | 4.1.1 | Employment opportunity for the local | 1 | 4.20 | 4.20 | 2.93 | |
| 4.1.2 | Workers’ accessibility to water supply | 5 | |||||||||
| 4.1.3 | Workers’ accessibility to health care | 5 | |||||||||
| 4.1.4 | Provision of sanitation facilities to workers | 5 | |||||||||
| 4.1.5 | Provision of housing facilities to workers | 5 | |||||||||
| 5 | Social Equality | 5.1 | Equal opportunity to the poor | 5.1.1 | Smallholders’ equity | 2 | 2.00 | 1.67 | |||
| 5.2 | Local community empowerment and engagement | 5.2.1 | Access to information and knowledge | 1 | 1.33 | ||||||
| 5.2.2 | Community involvement in decision making | 2 | |||||||||
| 5.2.3 | Level of community acceptance to plantation and mill activities | 1 | |||||||||
5. Discussion


- It allows integration of all three sustainability dimensions into one single score, thus providing an opportunity to compare the sustainability performance of similar products.
- It allows the application of a triangular structure approach of sustainability assessment by integrating Key Performance Indicators and Performance Measures into Higher Performance Indicators.
- It is flexible in adapting to both quantitative and qualitative measures by interpreting these measures into indices.
- The integrated, multi-criteria analysis approach allows sustainability objectives to be assessed in a balanced and integrated manner. A clearly defined, quantitative PM criteria and presentation of results at different levels of aggregation would also allow such assessment to be more transparent.
- The hotspots could be easily identified through this assessment process and the remediation or relevant improvement strategies can specifically be devised accordingly.
- It could be a decision making tool for policy makers, growers and producers to identify strategies for further improvement and achieving sustainability objectives. This is because the stakeholders would be able to identify areas of weakness from the assessment results, and would be able to make an effective determination as to how well they are performing from the threshold and best practice, and work towards all three sustainability objectives.
- The framework could offer flexibility as the ranking values could be reviewed from time to time as technology advances, policies changes, or regulations are revised.
- As the Likert scale is equally applied to all PMs, the relative advantages and disadvantages between PMs are not clearly differentiated. For example, the employment opportunity for the local people is an important hotspot, but it does not have much influence on the KPI and HPI as the remaining PMs of the KPI and HPI perform well.
- Another aspect is, due to a variable number of performance measures for each sustainability objective, i.e., nine for environment, four for economy and nine for social objectives, it can be observed that each PM under economic sustainability carries a heavier weighting. Non-performance of a single performance measure under the economic sustainability objective would be highly sensitive to the KPI, HPI and overall sustainability, compared to performance measures under environment and social sustainability.
- Threshold values for some PMs (e.g., “1.5.1 Fresh water consumption intensity—Water Footprint” and “1.5.2 Fossil fuel consumption intensity (Output/Input energy ratio)”) refer to average/ best industrial practices, which might be still too high for the natural system, e.g., groundwater replenishment, fossil fuel resources, to accommodate. The use of such PMs causes deviation from the concept of strong sustainability, where the performance shall be judged objectively, solely by its impact on society and the environment.
| Hotspots | Reason | Opportunities for Improvement |
|---|---|---|
|
|
|
|
|
|
|
|
|
|
|
|
6. Recommendations
7. Conclusions
Acknowledgments
Author Contributions
Conflicts of Interest
References
- Ong, S.H.A. The Global Palm Oil Phenomenon. The Star Online. 14 May 2012. Available online: http://www.thestar.com.my/business/business-news/2012/05/14/the-global-palm-oil-phenomenon/?style=biz (accessed on 15 August 2012).
- Performance Management and Delivery Unit (PEMANDU). Economic Transformantion Programme Annual Report 2011; Prime Minister’s Department, Malaysian Government: Putrajaya, Malaysia, 2012.
- Norwana, A.; Kunjappan, R.; Chin, M.; Schoneveld, G.; Potter, L.; Andriani, R. The Local Impacts of Oil Palm Expansion in Malaysia—An Assessment Based on A Case Study in Sabah State; Center for International Forestry Research (CIFOR): Bogor, Indonesia, 2011. [Google Scholar]
- Datamonitor. Palm Oil Case Study: How Consumer Activism Led the Push for Sustainable Sourcing; Datamonitor: London, UK, 2010. [Google Scholar]
- Palm Oil Consumer Action. Sustainable Palm Oil Our Definition. Available online: http://www.palmoilconsumers.com/sustainable-palm-oil.html (accessed on 1 September 2015).
- Bateman, I.J.; Fisher, B.; Fitzherbert, E.; Glew, D.; Naidoo, R. Tigers, markets and palm oil: Market potential for conservation. Oryx 2010, 44, 230–234. [Google Scholar] [CrossRef]
- Lim, C.I.; Biswas, W.; Samyudia, Y. Review of existing sustainability assessment methods for malaysian palm oil production. Procedia CIRP 2015, 26, 13–18. [Google Scholar] [CrossRef]
- Brundtland, G.H. Our Common Future; World Commission on Environment and Development (WCED): Oxford, UK, 1987. [Google Scholar]
- Diesendorf, M. Sustainability and sustainable development. In Sustainability: The Corporate Challenge of the 21st Century; Dunphy, D., Benveniste, J., Griffiths, A., Sutton, P., Eds.; Allen & Unwin: Sydney, Australia, 2000; pp. 19–37. [Google Scholar]
- Tan, Y.; Muhammad, H.; Hashim, Z.; Subramaniam, V.; Puah, C.; Chong, C.; Ma, A.; Choo, Y. Life cycle assessment of refined palm oil production and fractionation (part 4). J. Oil Palm Res. 2010, 22, 913–926. [Google Scholar]
- Subramaniam, V.; Choo, Y.; Muhammad, H.; Hashim, Z.; Tan, Y.; Puah, C.W. Life cycle assessment of the production of crude palm kernel oil (part 3a). J. Oil Palm Res. 2010, 22, 904–912. [Google Scholar]
- Subramaniam, V.; Ma, A.N.; Choo, Y.M.; Sulaiman, N.M.N. Environmental performance of the milling process of malaysian palm oil using the life cycle assessment approach. Am. J. Environ. Sci. 2008, 4, 310–315. [Google Scholar]
- Subramaniam, V.; Choo, Y.M.; Muhammad, H.; Hashim, Z.; Tan, Y.A.; Puah, C.W. Life cycle assessment of the production of crude palm oil (part 3). J. Oil Palm Res. 2010, 22, 895–903. [Google Scholar]
- Muhammad, H.; Hashim, S.; Subramaniam, V.; Tan, Y.; Puah, C.; Chong, C.; Choo, Y.M. Life cycle assessment of oil palm seedling production (part 1). J. Oil Palm Res. 2010, 22, 878–886. [Google Scholar]
- Bessou, C.; Chase, L.D.C.; Henson, I.E.; Abdul-Manan, A.F.N.; Milà I Canals, L.; Agus, F.; Sharma, M.; Chin, M. Pilot application of palmghg, the rspo greenhouse gas calculator for oil palm products. J. Clean. Prod. 2014, 73, 136–145. [Google Scholar] [CrossRef]
- Hansen, S. Feasibility study of performing an life cycle assessment on crude palm oil production in malaysia (9 pp). Int. J. Life Cycle Assess. 2007, 12, 50–58. [Google Scholar] [CrossRef]
- Zulkifli, H.; Halimah, M.; Chan, K.W.; Choo, Y.M.; Mohd Basri, W. Life cycle assessment for oil palm fresh fruit bunch production from continued land use for oil palm planted on mineral soil (part 2). J. Oil Palm Res. 2010, 22, 887–894. [Google Scholar]
- Yee, K.F.; Tan, K.T.; Abdullah, A.Z.; Lee, K.T. Life cycle assessment of palm biodiesel: Revealing facts and benefits for sustainability. Appl. Energy 2009, 86, S189–S196. [Google Scholar] [CrossRef]
- Roundtable on Sustainable Palm Oil (RSPO). RSPO Principles and Criteria for Sustainable Palm Oil Production; RSPO: Kuala Lumpur, Malaysia, 2007. [Google Scholar]
- International Sustainability & Carbon Certification (ISCC). ISCC 202-01 Checklist for the Control of Requirements for the Production of Biomass; ISCC: Köln, Germany, 2011. [Google Scholar]
- Johnson, A. Ecuador’s national interpretation of the roundtable on sustainable palm oil (RSPO): Green-grabbing through green certification? J. Latin Am. Geogr. 2014, 13, 183–204. [Google Scholar] [CrossRef]
- Anonymous. Greens Slam EU Certification of Palm-Oil Biodiesel as ‘Hypocrisy’; Hart Energy: Houston, TX, USA, 2013; Volume 17, p. 8. [Google Scholar]
- Greenpeace. Certifying Destruction—Why Consumer Companies Need to go Beyond Rspo and Stop Forest Destruction; Greenpeace International: Amsterdam, NY, USA, 2013. [Google Scholar]
- GreenPalm. Committing to Sustainable Palm Oil Does Not Have to be Complex for Cosmetics Brands. Available online: http://greenpalm.org/ (accessed on 5 April 2015).
- Stinchcombe, K.; Gibson, R.B. Strategic environmental assessment as a means of pursuing sustainability: Ten advantages and ten challenges. J. Environ. Assess. Policy Manag. 2001. [Google Scholar] [CrossRef]
- Rosen, K.; Lindner, M.; Nabuurs, G.; Paschalis-Jakubowicz, P. Challenges in implementing sustainability impact assessment of forest wood chains. Eur. J. For. Res. 2012, 131, 1–5. [Google Scholar] [CrossRef]
- Reap, J.; Roman, F.; Duncan, S.; Bras, B. A survey of unresolved problems in life cycle assessment. Int. J. Life Cycle Assess. 2008, 13, 374–388. [Google Scholar] [CrossRef]
- Otto, H.; Mueller, K.; Kimura, F. Efficient information visualization in lca: Application and practice. Int. J. Life Cycle Assess. 2004, 9, 2–12. [Google Scholar] [CrossRef]
- Morrison-Saunders, A.; Pope, J.; Bond, A. Handbook of Sustainability Assessment; Edward Elgar Publishing: Cheltenham, UK, 2015. [Google Scholar]
- Federal Office for Spatial Development (ARE). Sustainability Assessment: Conceptual Framework and Basic Methodology; Department of Environment, Transport, Energy and Communications (DETEC): Bern, Switzerland, 2004. [Google Scholar]
- Devuyst, D. Sustainability assessment: The application of a methodological framework. J. Environ. Assess. Policy Manag. 1999. [Google Scholar] [CrossRef]
- Kucukvar, M.; Tatari, O. Towards a triple bottom-line sustainability assessment of the U.S. Construction industry. Int. J. Life Cycle Assess. 2013, 18, 958–972. [Google Scholar] [CrossRef]
- Pope, J.; Annandale, D.; Morrison-Saunders, A. Conceptualising sustainability assessment. Environ. Impact Assess. Rev. 2004, 24, 595–616. [Google Scholar] [CrossRef]
- Ekins, P.; Simon, S.; Deutsch, L.; Folke, C.; de Groot, R. A framework for the practical application of the concepts of critical natural capital and strong sustainability. Ecol. Econ. 2003, 44, 165–185. [Google Scholar] [CrossRef]
- Ness, B.; Urbel-Piirsalu, E.; Anderberg, S.; Olsson, L. Categorising tools for sustainability assessment. Ecol. Econ. 2007, 60, 498–508. [Google Scholar] [CrossRef]
- Jeswani, H.K.; Azapagic, A.; Schepelmann, P.; Ritthoff, M. Options for broadening and deepening the LCA approaches. J. Clean. Prod. 2010, 18, 120–127. [Google Scholar] [CrossRef]
- Srdić, A.; Šelih, J. Integrated quality and sustainability assessment in construction: A conceptual model. Technol. Econ. Dev. Econ. 2011, 17, 611–626. [Google Scholar] [CrossRef]
- Buytaert, V.; Muys, B.; Devriendt, N.; Pelkmans, L.; Kretzschmar, J.G.; Samson, R. Towards integrated sustainability assessment for energetic use of biomass: A state of the art evaluation of assessment tools. Renew. Sustain. Energy Rev. 2011, 15, 3918–3933. [Google Scholar] [CrossRef]
- Wood, R.; Hertwich, E. Economic modelling and indicators in life cycle sustainability assessment. Int. J. Life Cycle Assess. 2013, 18, 1710–1721. [Google Scholar] [CrossRef]
- James, P. Urban Sustainability in Theory and Practice; Routledge: London, UK, 2015. [Google Scholar]
- Sustainable Society Foundation. Available online: http://www.ssfindex.com/ (accessed on 15 December 2015).
- Biswas, W.K.; Cooling, D. Sustainability assessment of red sand as a substitute for virgin sand and crushed limestone. J. Ind. Ecol. 2013, 17, 756–762. [Google Scholar] [CrossRef]
- Alsulami, B.; Mohamed, S. Incorporating system complexity in sustainability assessment for civil infrastructure systems: An innovative approach. In Proceedings of the 6th International Conference on Innovation in Architecture, Engineering and Construction (AEC), Pennsylvania State University, University Park, PA, USA, 9–11 June 2010.
- Berkel, R.V.; Power, G.; Cooling, D. Quantitative methodology for strategic assessment of the sustainability of bauxite residue management. Clean Techn. Environ. Policy 2008, 10, 359–370. [Google Scholar] [CrossRef]
- International Institution for Sustainable Development (IISD). Seven Questions to Sustainability: How to Assess the Contribution of Mining and Minerals Activities; International Institution for Sustainable Development: Winnipeg, MB, Canada, 2002; p. 54. [Google Scholar]
- Rosenström, U.; Kyllönen, S. Impacts of a participatory approach to developing national level sustainable development indicators in finland. J. Environ. Manag. 2007, 84, 282–298. [Google Scholar] [CrossRef] [PubMed]
- Hák, T.; Moldan, B.; Dahl, A. Sustainability Indicators: A Scientific Assessment; Island Press: Washington, DC, USA, 2007. [Google Scholar]
- Blanchet, K.; Girois, S. Selection of sustainability indicators for health services in challenging environments: Balancing scientific approach with political engagement. Eval. Program Plan. 2013, 38, 28–32. [Google Scholar] [CrossRef] [PubMed]
- Gallego Carrera, D.; Mack, A. Sustainability assessment of energy technologies via social indicators: Results of a survey among european energy experts. Energy Policy 2010, 38, 1030–1039. [Google Scholar] [CrossRef]
- Ekins, P. Environmental sustainability. Prog. Phys. Geogr. 2011, 35, 629–651. [Google Scholar] [CrossRef]
- European Commission Environment Website. Available online: http://ec.europa.eu/environment/basics/natural-capital/index_en.htm (accessed on 6 April 2015).
- Greene, G. Caring for the earth: The world conservation union, the united nations environment programme, and the world wide fund for nature. Environ. Sci. Policy Sustain. Dev. 1994, 36, 25–28. [Google Scholar] [CrossRef]
- Daly, H.E. Sustainable Economic Development: Definitions, Principles, Policies; World Bank: Washington, DC, USA, 2003; pp. 62–79. [Google Scholar]
- Roosa, S.A. Sustainable Development Handbook; Fairmont Press: Lilburn, GA, USA, 2008. [Google Scholar]
- Lawn, P. Sustainable Development Indicators in Ecological Economics; Edward Elgar Publishing Limited: Cheltenham, UK, 2006. [Google Scholar]
- Guidance, Air Pollution from Farming: Preventing and Minimising. Available online: https://www.gov.uk/reducing-air-pollution-on-farms (accessed on 20 May 2015).
- Environmental Protection Agency. 2014 standards for the renewable fuel standard program, proposed rule. In Federal Register; No. 230; Environmental Protection Agency: Washington, DC, USA, 2013; Volume 78. [Google Scholar]
- European Union (EU). Directive 2009/28/EC of the European Parliment and of the Council of 23 April 2009 on the Promotion of the Use of Energy from Renewable Sources and Amending and Subsequently Repealing Directives 2001/77/EC and 2003/30/EC; European Union: Brussels, Belgium, 2009. [Google Scholar]
- Organisation for Economic Co-operation and Development (OECD). Environment at a Glance—OECD Environmental Indicators; OECD: Pairs, France, 2005. [Google Scholar]
- Sizer, N.S.N.; Anderson, J.; Stolle, F.; Minnemeyer, S.; Higgins, M.; Leach, A.; Alisjahbana, A. Fires in Indonesia at Highest Levels Since 2013 Haze Emergency; The Guardian: London, UK, 2014. [Google Scholar]
- Yacob, S.; Hassan, M.A.; Shirai, Y.; Wakisaka, M.; Subash, S. Baseline study of methane emission from open digesting tanks of palm oil mill effluent treatment. Chemosphere 2005, 59, 1575–1581. [Google Scholar] [CrossRef] [PubMed]
- Chase, L.D.C.; Henson, I. A detailed greenhouse gas budget for palm oil production. Int. J. Agric. Sustain. 2010, 8, 199–214. [Google Scholar] [CrossRef]
- World Health Organization (WHO). WHO Air Quality Guidelines for Particulate Matter, Ozone, Nitrogen Dioxide and Sulfur Dioxide, Global Update 2005; WHO: Geneva, Switzerland, 2005. [Google Scholar]
- MPOB. Oil Palm & the Environment (updated March 2014). Available online: http://www.mpob.gov.my/palm-info/environment/520-achievements (accessed on 6 May 2015).
- Environmental Protection Agency. Water: Monitoring & Assessment. Available online: http://www.epa.gov (accessed on 10 May 2015).
- Hailu, A.; Chambers, R. A luenberger soil-quality indicator. J. Product. Anal. 2012, 38, 145–154. [Google Scholar] [CrossRef]
- United States Department of Agriculture (USDA). Soil Quality Test Kit Guide; USDA: Washington, DC, USA, 2001.
- Reijnders, L.; Huijbregts, M.A.J. Palm oil and the emission of carbon-based greenhouse gases. J. Clean. Prod. 2008, 16, 477–482. [Google Scholar] [CrossRef]
- Roundtable on Sustainable Palm Oil (RSPO). Principles and Criteria for the Production of Sustainable Palm Oil 2013; RSPO: Kuala Lumpur, Malaysia, 2013. [Google Scholar]
- National Wildlife Federation. What is Biodiversity? Available online: http://www.nwf.org/Wildlife/Wildlife-Conservation/Biodiversity.aspx (accessed on 9 May 2016).
- International Union for Conservation of Nature and Natural Resources. The IUCN Red List of Threatened Species. Available online: http://www.iucnredlist.org (accessed on Day Month Year).
- The Environmental Literacy Council. Measuring Biodiversity. Available online: http://enviroliteracy.org/ (accessed on Day Month Year).
- Gotelli, N.J.; Colwell, R.K. Quantifying biodiversity: Procedures and pitfalls in the measurement and comparison of species richness. Ecol. Lett. 2001, 4, 379–391. [Google Scholar] [CrossRef]
- World Wildlife Foundation (WWF). Oil Plam and Soy: The Expanding Threats to Forests; WWF: Washington, DC, USA, 2003. [Google Scholar]
- Luskin, M.S.; Potts, M.D. Microclimate and habitat heterogeneity through the oil palm lifecycle. Basic Appl. Ecol. 2011, 12, 540–551. [Google Scholar] [CrossRef]
- Doane, D.; MacGillivra, A. Economic Sustainability—The Business of Staying in Business; New Economics Foundation: London, UK, 2001. [Google Scholar]
- International Organization for Standardization (ISO). ISO 22301:2012—Business Continuity Management Systems—Requirements; ISO: Geneva, Switzerland, 2012. [Google Scholar]
- Business Continuity Institute (BCI). What Is Business Continuity? Available online: http://www.thebci.org (accessed on 10 August 2015).
- Higgins, R.C. How much growth can a firm afford? Financ. Manag. 1977, 6, 7–16. [Google Scholar] [CrossRef]
- Ministry of Natural Resources and Environment Malaysia. Malaysia Second National Communication to the UNFCCC; Ministry of Natural Resources and Environment: Putrajaya, Malaysia, 2005. [Google Scholar]
- United Nations Development Programme, Malaysia. Malaysia Human Development Report 2013—Redesigning an Inclusive Future; United Nations Development Programme, Malaysia: Kuala Lumpur, Malaysia, 2014. [Google Scholar]
- Economic Planning Unit. Household Income and Poverty; Economic Planning Unit, Prime Minister’s Department: Putrajaya, Malaysia, 2015. [Google Scholar]
- Central Data Exchange (CDX). What is Community Empowerment? National Empowerment Network; CDX: Sudbury, MA, USA, 2008. [Google Scholar]
- Department of Environment. Environment Quality (Prescribed Premises) (Crude Palm Oil) Regulation 1977; Attorney General Chamber: Putrajaya, Malaysia, 1977. [Google Scholar]
- Timms, R. Palm oil—The oil for the 21st century? Eur. J. Lipid Sci. Technol. 2007, 109, 287–288. [Google Scholar] [CrossRef]
- United Nations Framework Convention on Climate Change (UNFCCC). Copenhagen Accord; United Nations: New York, NY, USA, 2009. [Google Scholar]
- Choi, T.W. Malaysia Aims for 40pc Cut in Carbon Intensity per GDP. The Star Online. 17 December 2009. Available online: http://www.thestar.com.my/news/nation/2009/12/17/malaysia-aims-for-40pc-cut-in-carbon-intensity-per-gdp/ (accessed on 1 July 2015).
- MPOB. Malaysia Palm Oil Statistic 2015. Available online: http://bepi.mpob.gov.my (accessed on 20 July 2015).
- Consultancy, B. Greenhouse Gas Emissions from Palm Oil Production: Literature Review and Proposals from the RSPO Working Group on Greenhouse Gases; RSPO: Kuala Lumpur, Malaysia, 2009. [Google Scholar]
- Performance Management and Delivery Unit (PEMANDU). Deepening Malaysia’s palm oil advantage. In Economic Transformation Programm: A Roadmap for Malaysia; PEMANDU: Putrajaya, Malaysia, 2010. [Google Scholar]
- Gerbens-Leenes, P.; Hoekstra, A.; van der Meer, T. The water footprint of energy from biomass: A quantitative assessment and consequences of an increasing share of bio-energy in energy supply. Ecol. Econ. 2009, 68, 1052–1060. [Google Scholar] [CrossRef]
- Bernama. Monthly Household Income of Malaysians Increase. The Star Online. 22 June 2015. Available online: http://www.thestar.com.my/business/business-news/2015/06/22/monthly-household-income-of-malaysians-increases/?style=biz (accessed on 1 July 2015).
- Raghu, A. Labour Crunch Hurts Malaysian Palm Oil Growers as Indonesians Stay Home; Reuters: New York, NY, USA, 2014. [Google Scholar]
- Ludin, N.A.; Bakri, M.A.M.; Kamaruddin, N.; Sopian, K.; Deraman, M.S.; Hamid, N.H.; Asim, N.; Othman, M.Y. Malaysian oil palm plantation sector: Exploiting renewable energy toward sustainability production. J. Clean. Prod. 2014, 65, 9–15. [Google Scholar] [CrossRef]
- Sustainable Palm Oil Platform. Smallholders. Available online: http://www.sustainablepalmoil.org (accessed on 23 Jun 2015).
- Friends of the Earth, Life Mosaic and Sawit Watch. Losing Ground—The Human Rights Impacts of Oil Palm Plantation Expansion in Indonesia; Friends of the Earth, Life Mosaic and Sawit Watch: London, UK, 2008. [Google Scholar]
- Colchester, M.; Chao, S.; Dallinger, J.; Sokhannaro, H.E.P.; Dan, V.T.; Villanueva, J. Oil Palm Expansion in South East Asia—Trends and Implications for Local Communities and Indigenous Peoples; Forest Peoples Programme and Perkumpulan Sawit Watch: Bogor, Indonesia, 2011. [Google Scholar]
- Colchester, M. Palm Oil and Indigenous pEople in South East Asia; The International Land Coalition: Rome, Italy, 2011. [Google Scholar]
© 2015 by the authors; licensee MDPI, Basel, Switzerland. This article is an open access article distributed under the terms and conditions of the Creative Commons by Attribution (CC-BY) license (http://creativecommons.org/licenses/by/4.0/).
Share and Cite
Lim, C.I.; Biswas, W. An Evaluation of Holistic Sustainability Assessment Framework for Palm Oil Production in Malaysia. Sustainability 2015, 7, 16561-16587. https://doi.org/10.3390/su71215833
Lim CI, Biswas W. An Evaluation of Holistic Sustainability Assessment Framework for Palm Oil Production in Malaysia. Sustainability. 2015; 7(12):16561-16587. https://doi.org/10.3390/su71215833
Chicago/Turabian StyleLim, Chye Ing, and Wahidul Biswas. 2015. "An Evaluation of Holistic Sustainability Assessment Framework for Palm Oil Production in Malaysia" Sustainability 7, no. 12: 16561-16587. https://doi.org/10.3390/su71215833
APA StyleLim, C. I., & Biswas, W. (2015). An Evaluation of Holistic Sustainability Assessment Framework for Palm Oil Production in Malaysia. Sustainability, 7(12), 16561-16587. https://doi.org/10.3390/su71215833