
Livelihood Strategies in Shaxi, Southwest China: Conceptualizing Mountain–Valley Interactions as a Human–Environment System

Abstract
:1. Introduction
2. Methods
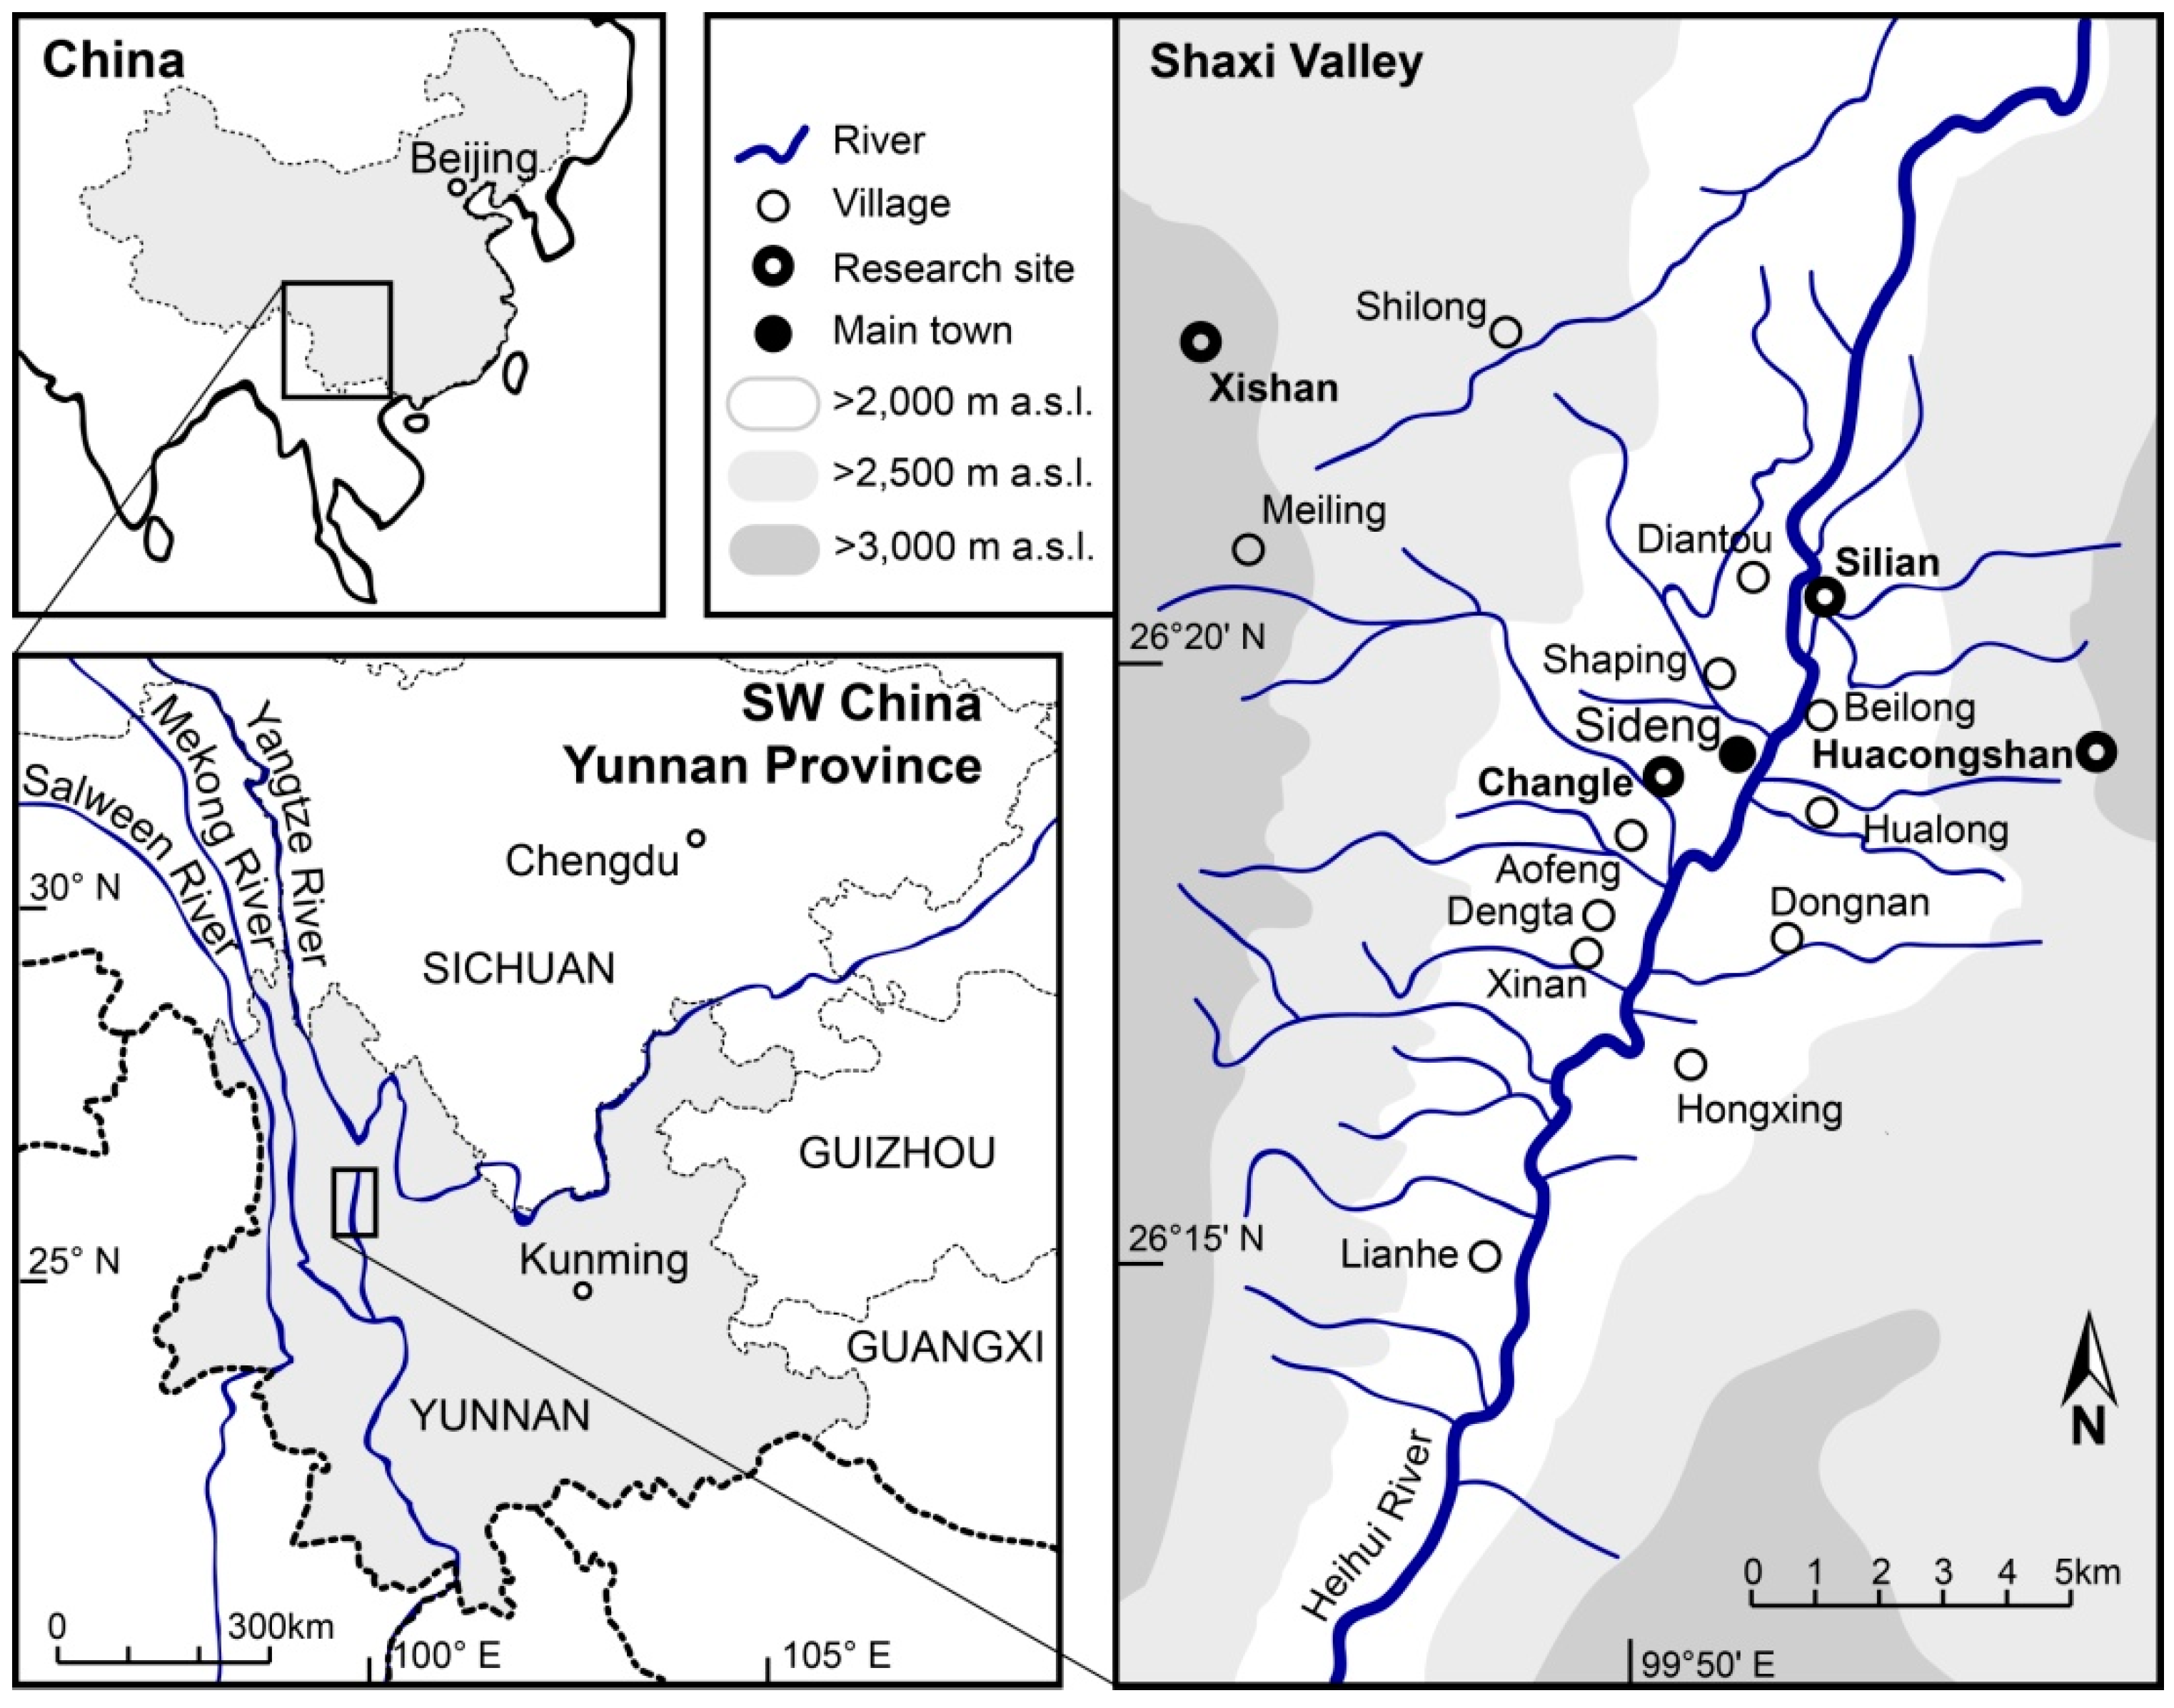
2.1. Study Area

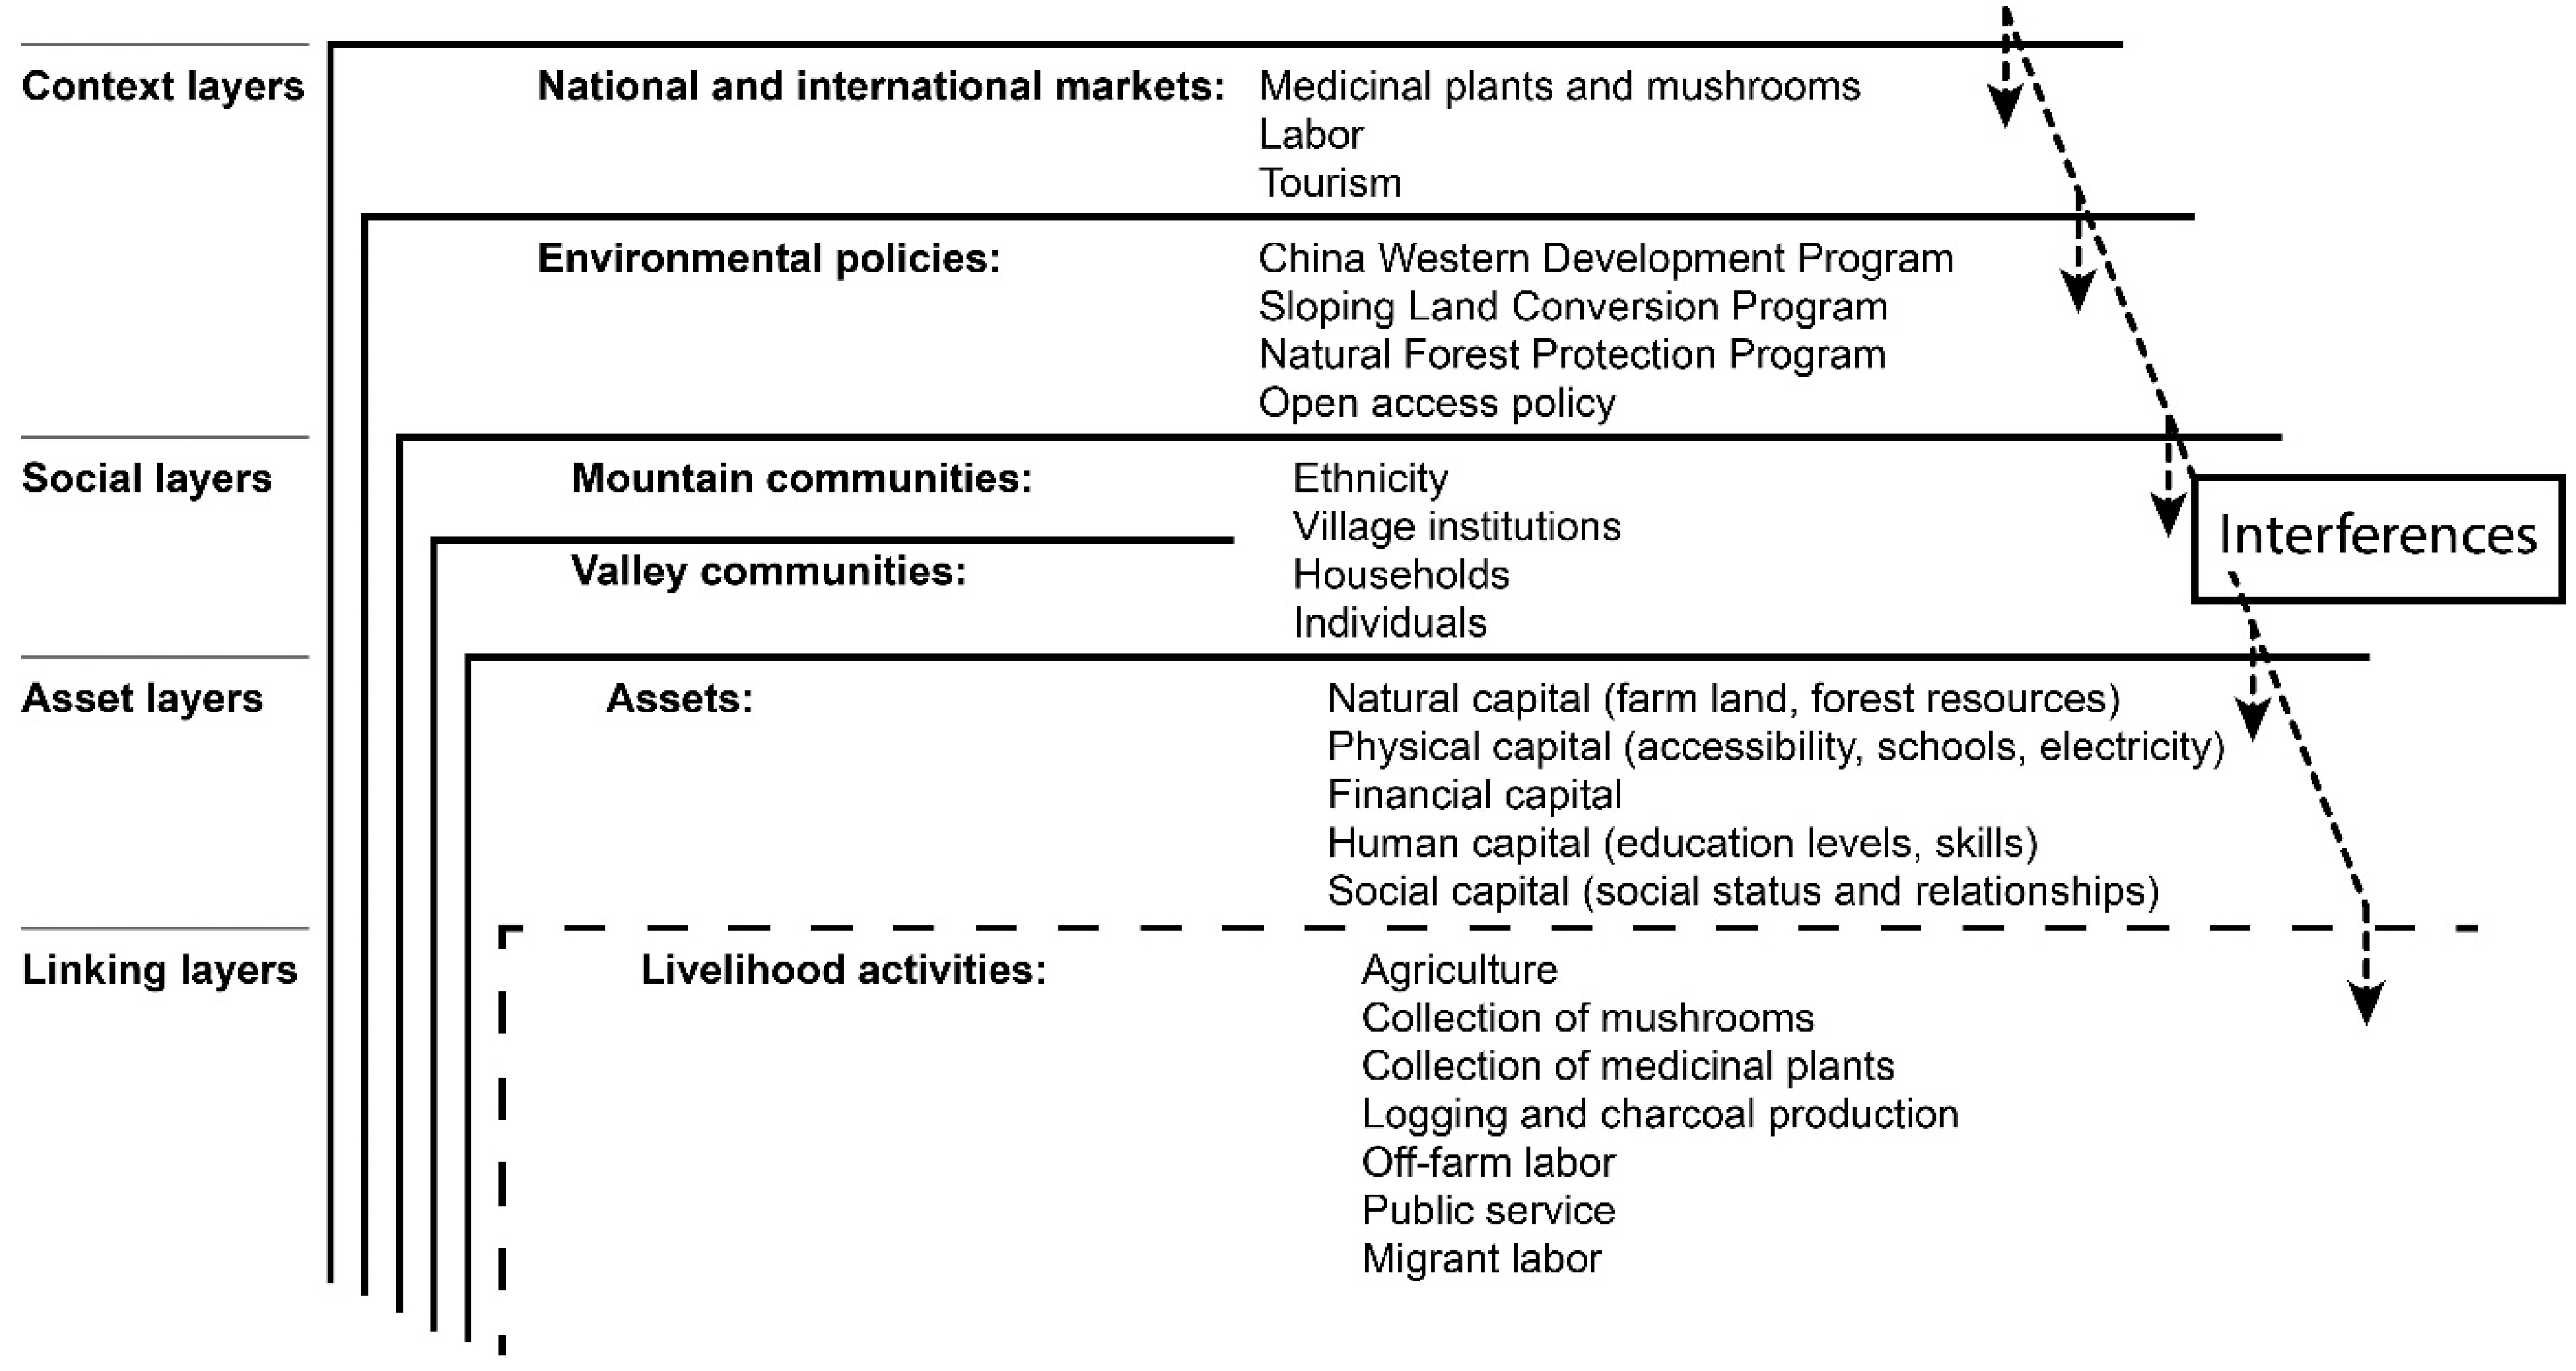
2.2. Analytical Framework
2.3. Data Collection
2.4. Statistical Tools and Tests
3. Results
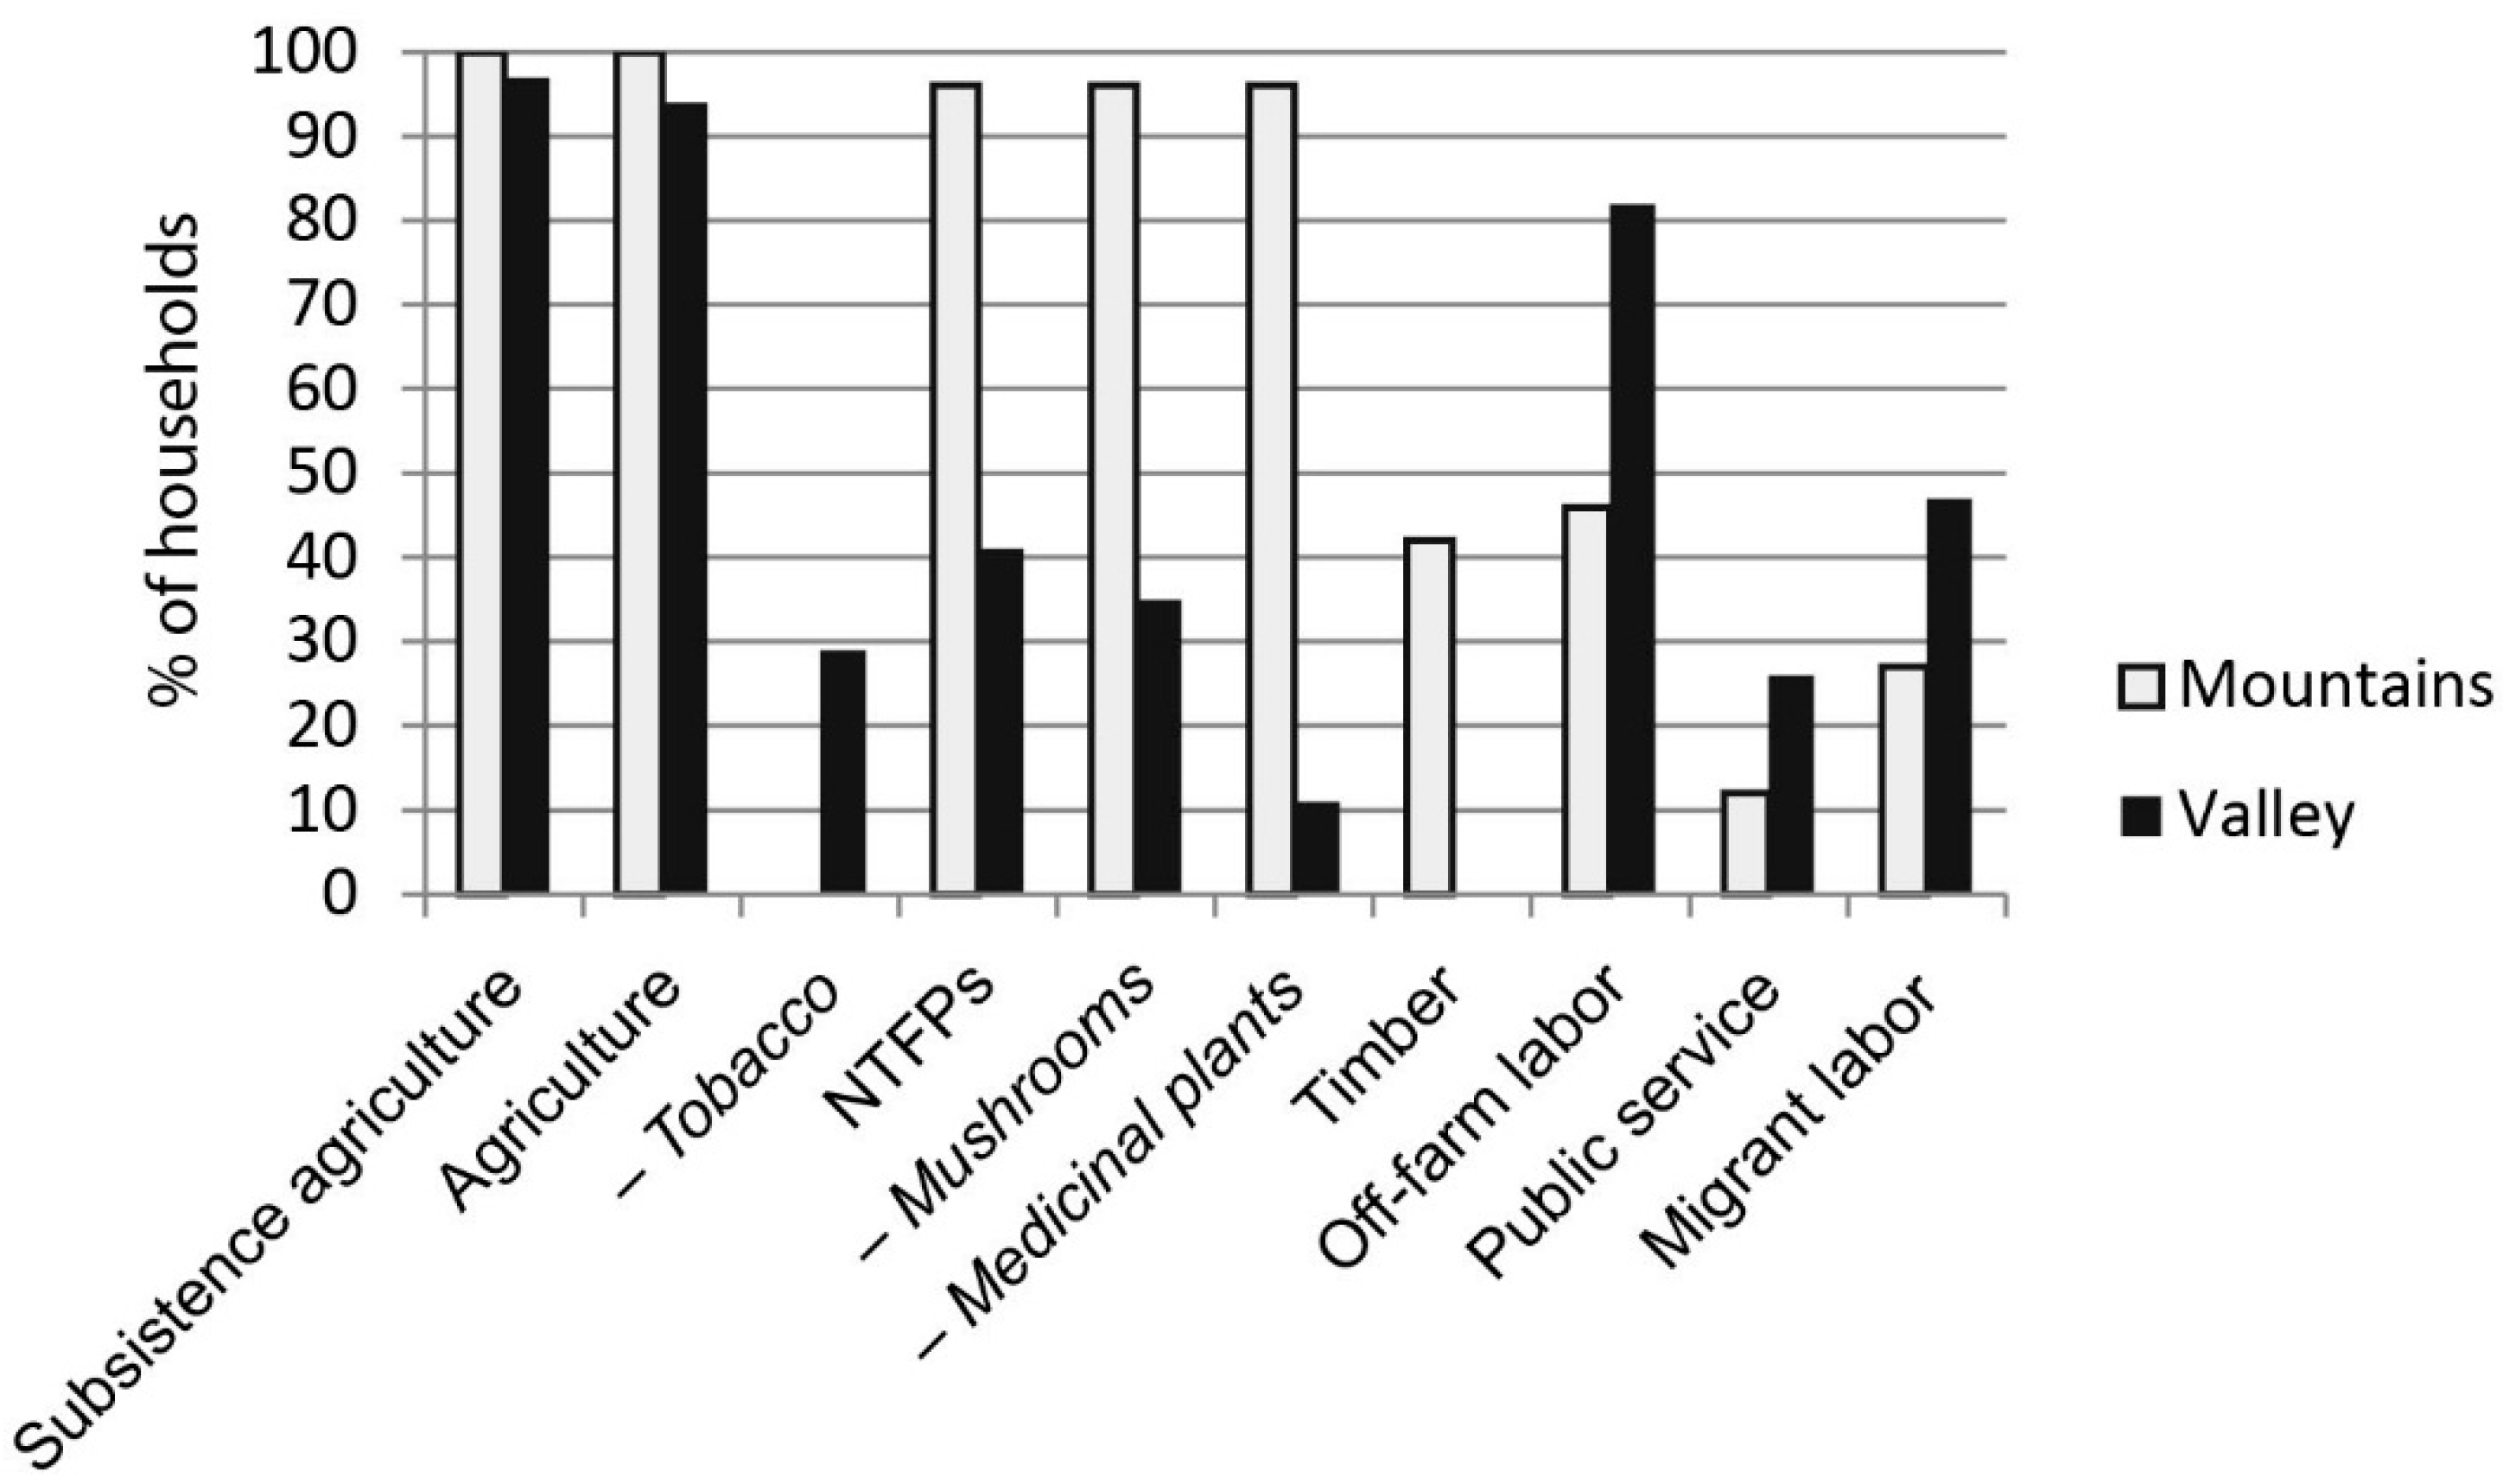
3.1. Livelihood Strategies
3.1.1. At the Village Level

| Variables | Mountains | Valley | ANOVA/Kruskal–Wallis | ||
|---|---|---|---|---|---|
| Xishan | Huacongshan | Changle | Silian | ||
| Accessibility 1 | very low | low | very high | very high | n/a |
| Elevation 2 (m.a.s.l.) | 2987 ± 85 | 2908 ± 82 | 2125 ± 6 | 2124 ± 7 | n/a |
| Total No. of households | 33 | 92 | 199 | 311 | n/a |
| Average household size (# of people) | 3.9 ± 1.0 a | 3.7 ± 1.1 a | 5.4 ± 1.2 b | 5.5 ± 1.2 b | F = 10.293, p < 0.001 |
| Landholding per capita (mu) | 2.21 ± 0.87 a | 10.35 ± 6.67 b | 1.25 ± 0.37 c | 1.32 ± 0.69 c | F = 26.963, p < 0.001 |
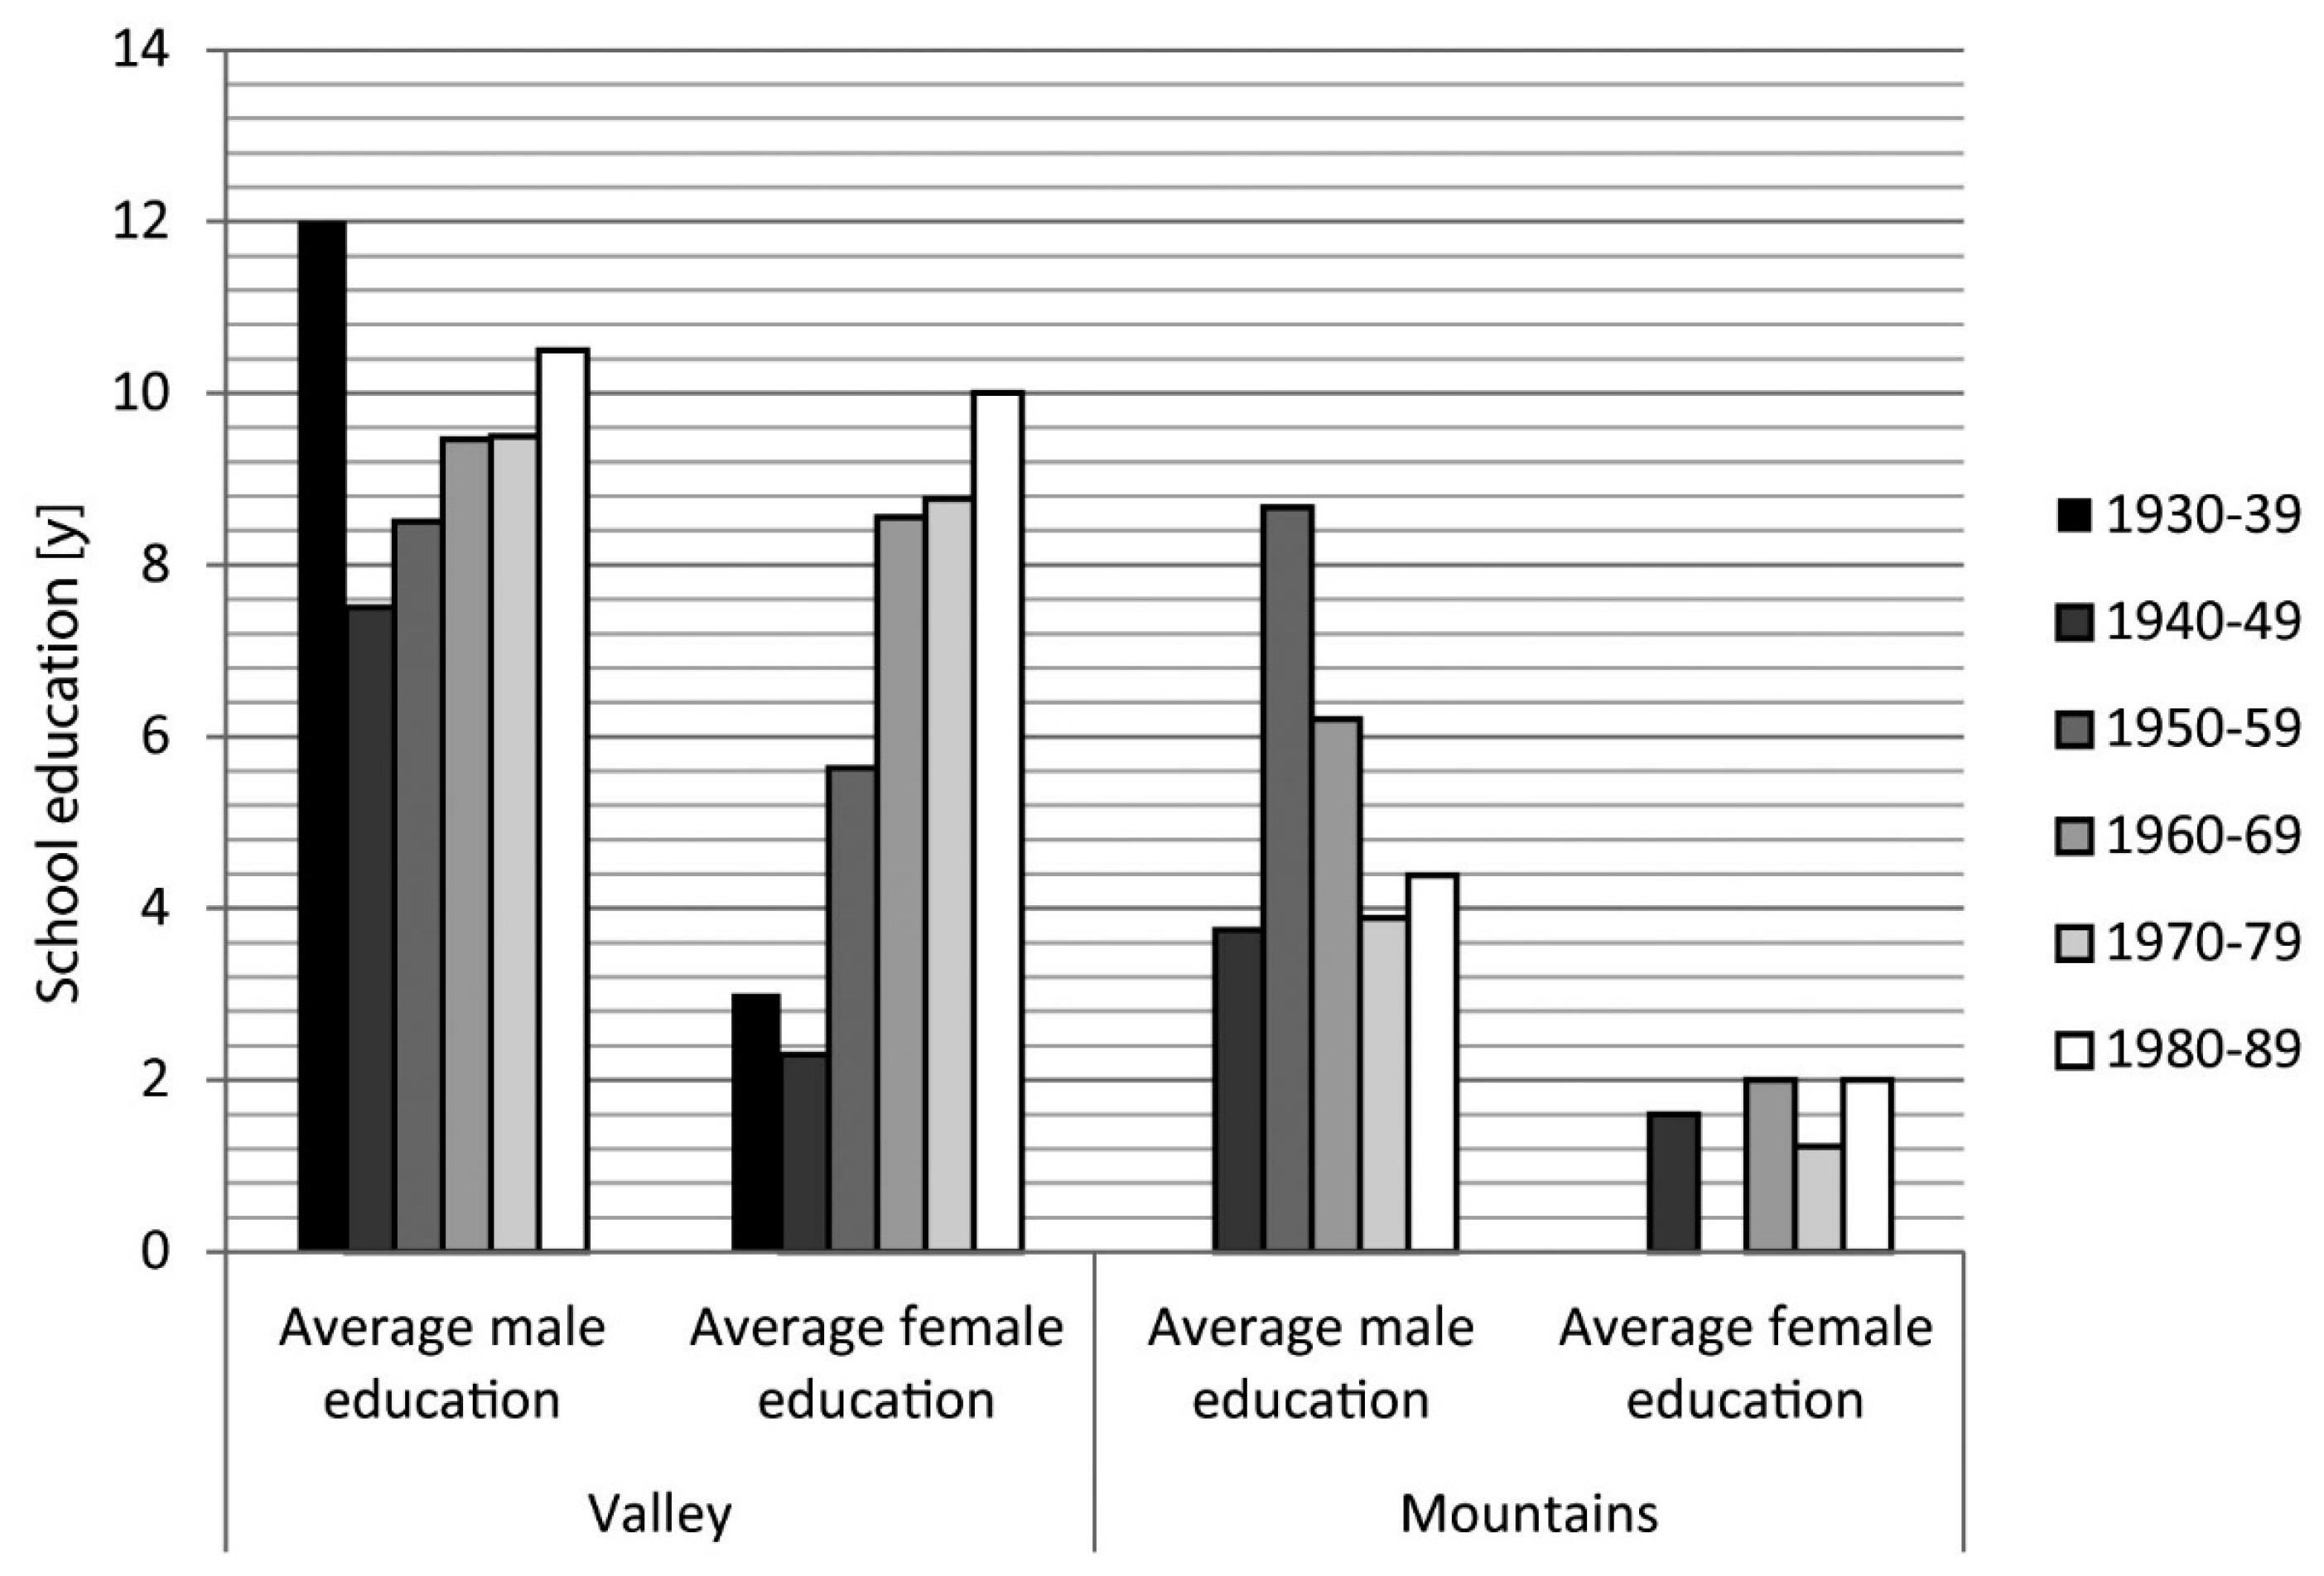
| Education 3,4 (y) | 2.97 ± 2.98 a | 3.76 ± 3.99 a | 8.77 ± 5.00 b | 8.69 ± 3.50 b | F = 23.863, p < 0.001 |
| Education men 3 (y) | 4.50 ± 2.94 a | 5.61 ± 4.34 a | 10.18 ± 3.67 b | 9.24 ± 2.73 b | F = 13.676, p < 0.001 |
| Education women 3 (y) | 1.33 ± 2.06 a | 1.69 ± 2.24 a | 7.11 ± 5.86 b | 8.21 ± 4.04 b | F = 14.345, p < 0.001 |
| Variables | Mountains | Valley | ANOVA/Kruskal–Wallis | ||
|---|---|---|---|---|---|
| Xishan | Huacongshan | Changle | Silian | ||
| Subsistence income 1 per capita (CNY) | 417 ± 352 a | 1530 ± 2023 b | 805 ± 556 a,b | 854 ± 499 a,b | F = 2.588, p = 0.062 |
| Total cash income per capita (CNY) | 2977 ± 1057 a | 4349 ± 2820 a | 4317 ± 3803 a | 3925 ± 1552 a | F = 0.929, p = 0.433 |
| % of subsistence income in total income per capita 2 | 12.2 ± 7.6 | 23.3 ± 22.4 | 23.2 ± 21.1 | 20.2 ± 15.9 | χ2 = 1.844, df = 3, p = 0.605 |
| Overall agricultural income per capita (CNY) | 1121 ± 681 a | 2332 ± 1296 a | 1462 ± 878 a | 2089 ± 1797 a | F = 2.711, p = 0.054 |
| % of total cash income 3 | 38.5 ± 19.5 | 57.2 ± 15.8 | 46.1 ± 23.1 | 55.9 ± 38.0 | χ2 = 4.555, df = 3, p = 0.21 |
| —Tobacco income per capita (CNY) | 0 a | 0 a | 157 ± 447 b | 911 ± 1117 c | F = 7.239, p < 0.001 |
| % of total cash income | 0 | 0 | 4.7 ± 15.2 | 23.2 ± 27.9 | χ2 = 14.671, df = 3, p = 0.002 |
| Overall forest resources income per capita (CNY) | 1549 ± 887 a | 1116 ± 1467 a | 165 ± 232 b | 73 ± 221 b | F = 11.272, p < 0.001 |
| % of total cash income | 52.1 ± 25.1 | 23.6 ± 13.9 | 8.3 ± 15.1 | 1.4 ± 3.9 | χ2 = 37.539, df = 3, p < 0.001 |
| —NTFP income per capita (CNY) | 734 ± 475 a,b | 1116 ± 1467 a | 165 ± 232 b | 73 ± 221 b | F = 6.349, p = 0.001 |
| % of total cash income | 24.0 ± 14.2 | 23.6 ± 13.9 | 8.3 ± 15.1 | 1.4 ± 3.9 | χ2 = 30.971, df = 3, p < 0.001 |
| —Logging income per capita (CNY) | 815 ± 500 a | 0 b | 0 b | 0 b | F = 41.120, p < 0.001 |
| % of total cash income | 28.1 ± 15.5 | 0 | 0 | 0 | χ2 = 51.514, df = 3, p < 0.001 |
| Overall off-farm income per capita (CNY) | 307 ± 676 a | 901 ± 1186 a,b | 2690 ± 3927 b | 1764 ± 1651 a,b | F = 2.843, p = 0.046 |
| % of total cash income | 9.4 ± 23.2 | 19.2 ± 20.4 | 45.6 ± 29.8 | 42.6 ± 37.5 | χ2 = 15.061, df = 3, p = 0.002 |
| —Local off-farm income per capita | 0 a | 58 ± 208 a | 1123 ± 2675 a | 343 ± 680 a | F = 1.877, p = 0.144 |
| % of total cash income | 0 | 1.7 ± 6.2 | 15.1 ± 24.0 | 7.6 ± 16.3 | χ2 = 7.806, df = 3, p = 0.05 |
| —Public service income per capita (CNY) | 122 ± 441 a | 282 ± 921 a | 820 ± 1710 a | 555 ± 1508 a | F = 0.830, p = 0.483 |
| % of total cash income | 5.4 ± 19.5 | 7.1 ± 20.5 | 12.2 ± 23.0 | 11.1 ± 30.1 | χ2 = 3.100, df = 3, p = 0.376 |
| —Migrant working income per capita (CNY) | 185 ± 666 a | 562 ± 982 a | 747 ± 1220 a | 866 ± 1090 a | F = 1.173, p = 0.328 |
| % of total cash income | 4.0 ± 14.3 | 10.4 ± 13.5 | 18.3 ± 22.5 | 23.9 ± 30.8 | χ2 = 6.293, df = 3, p = 0.098 |
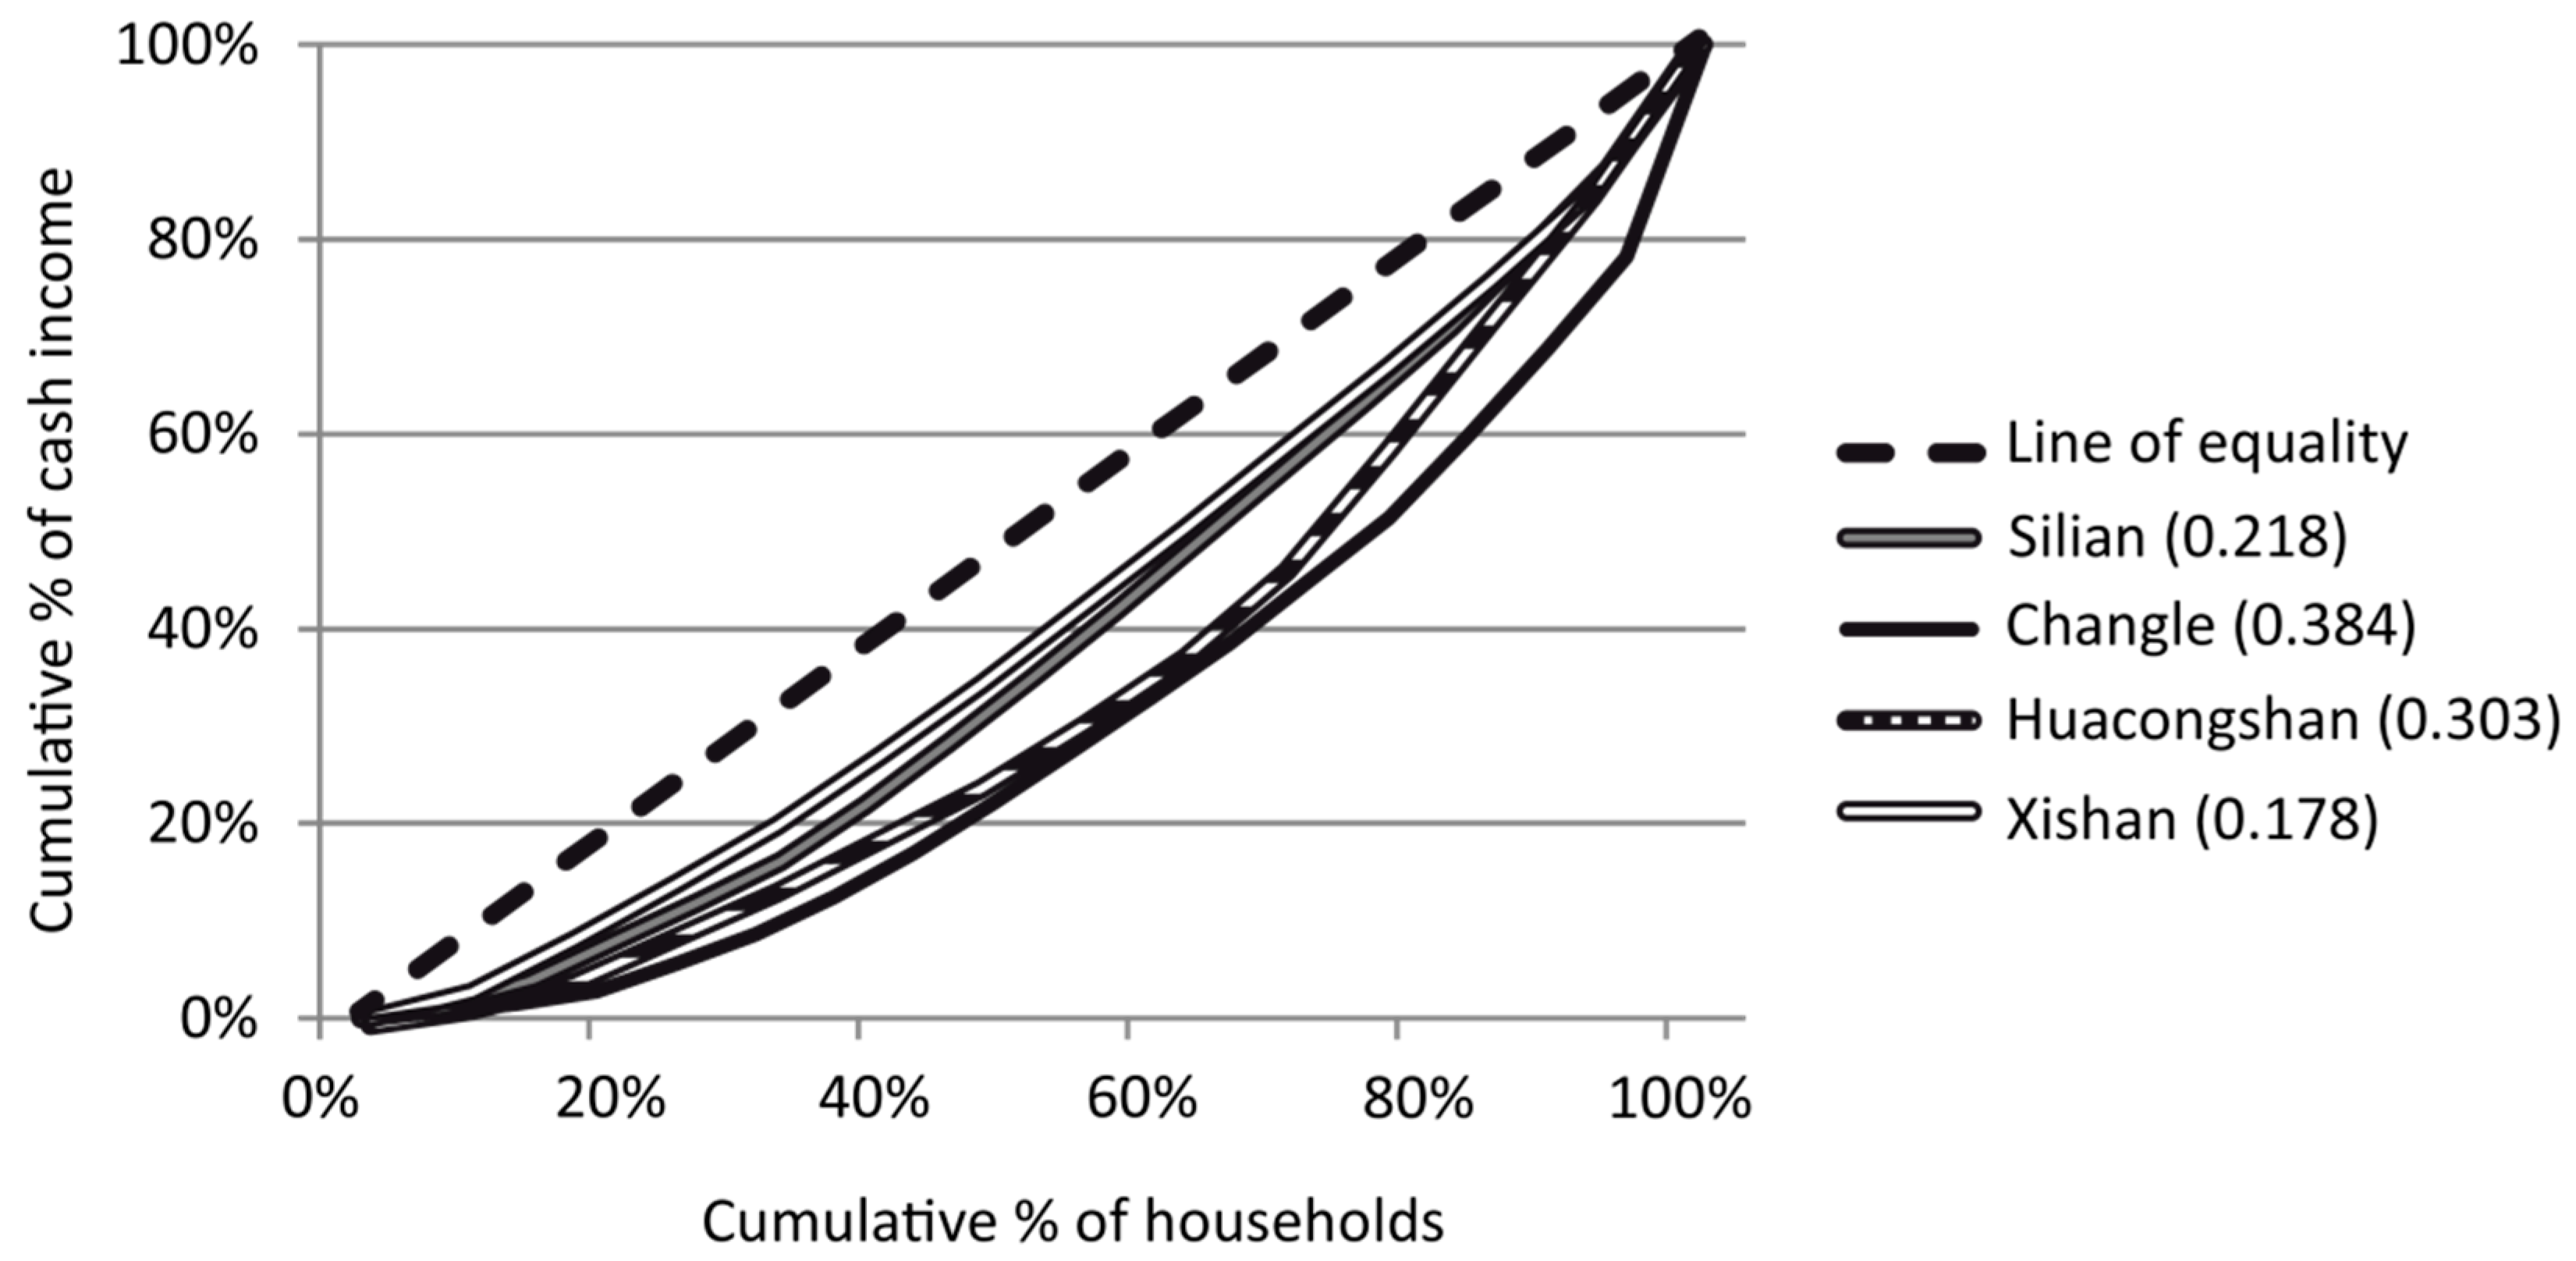
| Gini coefficient | 0.178 | 0.303 | 0.384 | 0.218 | n/a |
| Average Herfindahl diversity index | 0.42 | 0.55 | 0.52 | 0.33 | n/a |

3.1.2. At the Household Level

3.1.3. At the Individual Level
| Variables | Mountains | Valley | |||||
|---|---|---|---|---|---|---|---|
| Low-Income Group | Medium-Income Group | High-Income Group | Low-Income Group | Medium-Income Group | High-Income Group | ANOVA/Kruskal–Wallis | |
| Average household size (# people) | 3.7 ± 1.0 a | 4.0 ± 0.8 a | 3.7 ± 1.3 a | 5.6 ± 1.6 b | 5.4 ± 0.7 b | 5.0 ± 0.8 a,b | F = 6.457, p < 0.001 |
| Landholding per capita (mu) | 2.8 ± 1.7 a | 5.8 ± 4.5 a,b | 10.2 ± 8.3 b | 1.2 ± 0.5 a | 1.2 ± 0.5 a | 1.6 ± 0.5 a | F = 8.869, p < 0.001 |
| Average household education (y) | 2.6 ± 1.7 a | 4.6 ± 1.9 a,b | 3.0 ± 1.9 a | 7.6 ± 2.3 b,c | 8.1 ± 3.1 c | 10.1 ± 2.4 c | F = 16.856, p < 0.001 |
| Highest education in household (y) | 5.2 ± 3.4 a | 6.7 ± 2.3 a | 5.6 ± 5.1 a | 10.6 ± 4.1 a,b | 10.8 ± 4.3 a,b | 13.1 ± 3.6 b | F = 6.666, p < 0.001 |
| Average Herfindahl diversity index | 0.46 ± 0.15 a | 0.51 ± 0.15 a | 0.49 ± 0.21 a | 0.35 ± 0.22 a | 0.43 ± 0.17 a | 0.50 ± 0.17 a | F = 1.112, p = 0.365 |
| Variables | Mountains | Valley | |||||
|---|---|---|---|---|---|---|---|
| Low-Income group | Medium-Income group | High-Income Group | Low-Income Group | Medium-Income Group | High-Income Group | ANOVA/Kruskal–Wallis | |
| Subsistence income 1 per capita (CNY) | 331 ± 189 a | 638 ± 654 a,b | 1914 ± 2313 a,b | 972 ± 517 a,b | 796 ± 450 a,b | 719 ± 603 a,b | F = 2.584, p = 0.036 |
| Total cash income per capita (CNY) | 2367 ± 633 a | 3041 ± 934 a,b | 5512 ± 2765 b,c | 1904 ± 949 a | 3734 ± 689 a,b,c | 6742 ± 3518 c | F = 9.551, p < 0.001 |
| Total income2 per capita (CNY) | 2698 ± 283 a | 3679 ± 499 a | 7427 ± 3723 b | 2876 ± 743 a | 4530 ± 573 a,c | 7461 ± 3203 b,c | F = 10.909, p < 0.001 |
| % of subsistence income in total income | 12.7 ± 8.2 | 18.1 ± 18.3 | 22.4 ± 22.9 | 36.0 ± 22.8 | 17.7 ± 10.6 | 11.5 ± 10.4 | χ2 = 10.136, df = 5, p = 0.071 |
| Overall agricultural income per capita (CNY) | 1124 ± 441 a | 1332 ± 607 a | 2680 ± 1518 a | 1286 ± 980 a | 1614 ± 1093 a | 2396 ± 1879 a | F = 2.650, p = 0.033 |
| % of total cash income | 47.4 ± 15.9 | 46.0 ± 21.6 | 50.0 ± 23.5 | 66.9 ± 29.4 | 44.6 ± 29.6 | 41.0 ± 30.6 | χ2 = 4.940, df = 5, p = 0.423 |
| —Tobacco income per capita (CNY) | 0 a | 0 a | 0 a | 307 ± 728 b | 700 ± 993 b | 561 ± 1,029 b | F = 1.995, p = 0.094 |
| % of total cash income3 | 0 | 0 | 0 | 10.8 ± 23.9 | 20.6 ± 29.0 | 9.7 ± 17.9 | χ2 = 9.790, df = 5, p = 0.081 |
| Overall forest resources income per capita (CNY) | 1001 ± 601 a,b,c | 1263 ± 598 b,c | 1725 ± 1893 c | 101 ± 164 a | 73 ±164 a | 187 ± 323 a,b | F = 7.093, p < 0.001 |
| % of total cash income | 41.5 ± 21.1 | 42.8 ± 22.9 | 29.8 ± 29.7 | 9.1 ± 17.9 | 2.6 ± 6.5 | 3.2 ± 5.8 | χ2 = 34.421, df = 5, p < 0.001 |
| —NTFP income per capita (CNY) | 465 ± 302 a,b | 938 ± 349 a,b | 1373 ± 1738 b | 101 ± 164 a | 73 ±164 a | 187 ± 323 a | F = 5.119, p = 0.001 |
| % of total cash income | 19.3 ± 11.1 | 31.5 ± 11.0 | 21.4 ± 16.7 | 9.1 ± 17.9 | 2.6 ± 6.5 | 3.2 ± 5.8 | χ2 = 31.707, df = 5, p < 0.001 |
| —Logging income per capita (CNY) | 536 ± 430 a | 325 ± 440 a | 352 ± 729 a | 0 b | 0 b | 0 b | F = 3.957, p = 0.004 |
| % of total cash income | 22.2 ± 18.6 | 11.3 ± 15.8 | 8.4 ± 18.0 | 0 | 0 | 0 | χ2 = 23.875, df = 5, p < 0.001 |
| Overall off-farm income per capita (CNY) | 242 ± 522 a | 446 ± 834 a | 1107 ±1394 a | 517 ± 671 a | 2047 ± 1390 a,b | 4159 ± 4442 b | F = 5.053, p = 0.001 |
| % of total cash income | 11.2 ± 23.2 | 11.2 ± 18.5 | 20.2 ± 24.7 | 24.0 ± 28.9 | 52.8 ± 32.0 | 55.8 ± 31.7 | χ2 = 18.828, df = 5, p = 0.002 |
| — Local off-farm income per capita | 0 a | 0 a | 83 ± 250 a | 0 a | 538 ± 839 a | 1695 ± 3207 a | F = 2.305, p = 0.057 |
| % of total cash income | 0 | 0 | 2.5 ± 7.4 | 0 | 13.8 ± 21.2 | 20.6 ± 25.9 | χ2 = 18.117, df = 5, p = 0.003 |
| —Public service income per capita (CNY) | 214 ± 528 a | 0 a | 370 ± 1,111 a | 172 ± 513 a | 445 ± 1,445 a | 1457 ± 2189 a | F = 1.796, p = 0.130 |
| % of total cash income | 10.0 ± 23.5 | 0 | 8.1 ± 24.2 | 7.0 ± 20.9 | 9.0 ± 28.9 | 19.1 ± 29.2 | χ2 = 4.376, df = 5, p = 0.497 |
| —Migrant working income per capita (CNY) | 28 ± 83 a | 446 ± 834 a | 654 ± 1,167 a | 344 ± 548 a | 1063 ± 1084 a | 1006 ± 1533 a | F = 1.572, p = 0.184 |
| % of total cash income | 1.1 ± 3.3 | 11.2 ± 18.5 | 9.6 ± 15.5 | 17.0 ± 24.8 | 30.0 ± 31.1 | 16.1 ± 23.4 | χ2 = 7.799, df = 5, p = 0.168 |
| Income Source | Explanatory Variable | B (T) | Summary of Model |
|---|---|---|---|
| Total income 1 per capita (CNY) | Intercept | (2.392) * | R = 0.515; Adjusted R2 = 0.238 |
| Total agricultural land/capita | 0.490 (3.962) *** | ||
| Household mean education level | 0.388 (3.136) ** | ||
| Total cash income per capita (CNY) | Intercept | (3.742) *** | R = 0.288; Adjusted R2 = 0.066 |
| Household mean education level | 0.288 (2.233) * | ||
| Subsistence income 2 per capita (CNY) | Intercept | (4.184) *** | R = 0.685; Adjusted R2 = 0.450 |
| Total agricultural land/capita | 0.790 (6.876) *** | ||
| Mountain (dummy) | −0.332 (−2.891) ** | ||
| % of subsistence income in total income | No statistically significant explanatory variable | n/a | |
| Overall agricultural income per capita (CNY) | Intercept | (4.996) *** | R = 0.394; Adjusted R2 = 0.126 |
| Total agricultural land/capita | 0.377 (2.969) ** | ||
| Silian (dummy) | 0.263 (2.071) * | ||
| % of total cash income | Intercept | (9.308) *** | R = 0.430; Adjusted R2 = 0.156 |
| Household maximum education level | −0.419 (−3.172) ** | ||
| Xishan (dummy) | −0.380 (−2.875) ** | ||
| —Tobacco income per capita (CNY) | Intercept | (0.686) | R = 0.488; Adjusted R2 = 0.224 |
| Silian (dummy) | 0.488 (4.145) *** | ||
| % of total cash income3 | Intercept | (0.784) | R = 0.465; Adjusted R2 = 0.202 |
| Silian (dummy) | 0.465 (3.900) *** | ||
| Overall forest resources income per capita (CNY) | Intercept | (2.893) ** | R = 0.660; Adjusted R2 = 0.415 |
| Mountains (dummy) | 0.391 (3.085) ** | ||
| Household size | −0.349 (−2.756) ** | ||
| % of total cash income | Intercept | (5.116) *** | R = 0.800; Adjusted R2 = 0.620 |
| Xishan (dummy) | 0.524 (5.499) *** | ||
| Household size | −0.238 (−2.566) * | ||
| Household mean education level | −0.237 (−2.363) * | ||
| —NTFP income per capita (CNY) | Intercept | (3.967) *** | R = 0.552; Adjusted R2 = 0.279 |
| Household size | −0.409 (−3.331) ** | ||
| Huacongshan (dummy) | 0.247 (2.014) * | ||
| % of total cash income | Intercept | (6.729) *** | R = 0.636; Adjusted R2 = 0.382 |
| Household mean education level | −0.486 (−4.141) *** | ||
| Household size | −0.248 (−2.111) * | ||
| —Logging income per capita (CNY) | Intercept | (0.000) | R = 0.830; Adjusted R2 = 0.684 |
| Xishan (dummy) | 0.830 (11.051) *** | ||
| % of total cash income | Intercept | (0.000) | R = 0.856; Adjusted R2 = 0.728 |
| Xishan (dummy) | 0.856 (12.282) *** | ||
| Overall off-farm income per capita (CNY) | Intercept | (−1.457) | R = 0.609; Adjusted R2 = 0.348 |
| Household mean education level | 0.426 (3.585) *** | ||
| Old persons in household | 0.292 (2.459) * | ||
| % of total cash income | Intercept | (−0.857) | R = 0.669; Adjusted R2 = 0.427 |
| Household maximum education level | 0.534 (4.934) *** | ||
| Old persons in household | 0.254 (2.349) * | ||
| —Local off-farm income per capita | Intercept | (−1.733) | R = 0.493; Adjusted R2 = 0.215 |
| Old persons in household | 0.295 (2.266) * | ||
| Household mean education level | 0.290 (2.222) * | ||
| % of total cash income | Intercept | (−1.307) | R = 0.423; Adjusted R2 = 0.164 |
| Household mean education level | 0.423 (3.465) *** | ||
| —Public service income per capita (CNY) | Intercept | (−3.791) *** | R = 0.684; Adjusted R2 = 0.438 |
| Household maximum education level | 0.567 (4.486) *** | ||
| Old persons in households | 0.445 (4.015) *** | ||
| Dummy mountains | 0.326 (2.530) * | ||
| % of total cash income | Intercept | (−3.163) ** | R = 0.613; Adjusted R2 = 0.341 |
| Old persons in household | 0.412 (3.437) *** | ||
| Household maximum education level | 0.515 (3.756) *** | ||
| Dummy mountain | 0.357 (2.556) * | ||
| —Migrant working income per capita (CNY) | No statistically significant explanatory variable | n/a | |
| % of total cash income | Intercept | (−5.672) *** | R = 0.408; Adjusted R2 = 0.136 |
| Dummy mountain | −0.432 (−3.187) ** | ||
| Old persons in household | −0.274 (−2.022) * |
| Location | Sex of Collectors | Mushrooms | Medicinal Plants | Off-Farm |
|---|---|---|---|---|
| Valley | Male | 45% | 50% | 89% |
| Female | 55% | 50% | 11% | |
| Mountains | Male | 44% | 44% | 100% |
| Female | 56% | 56% | 0% |
3.2. Education

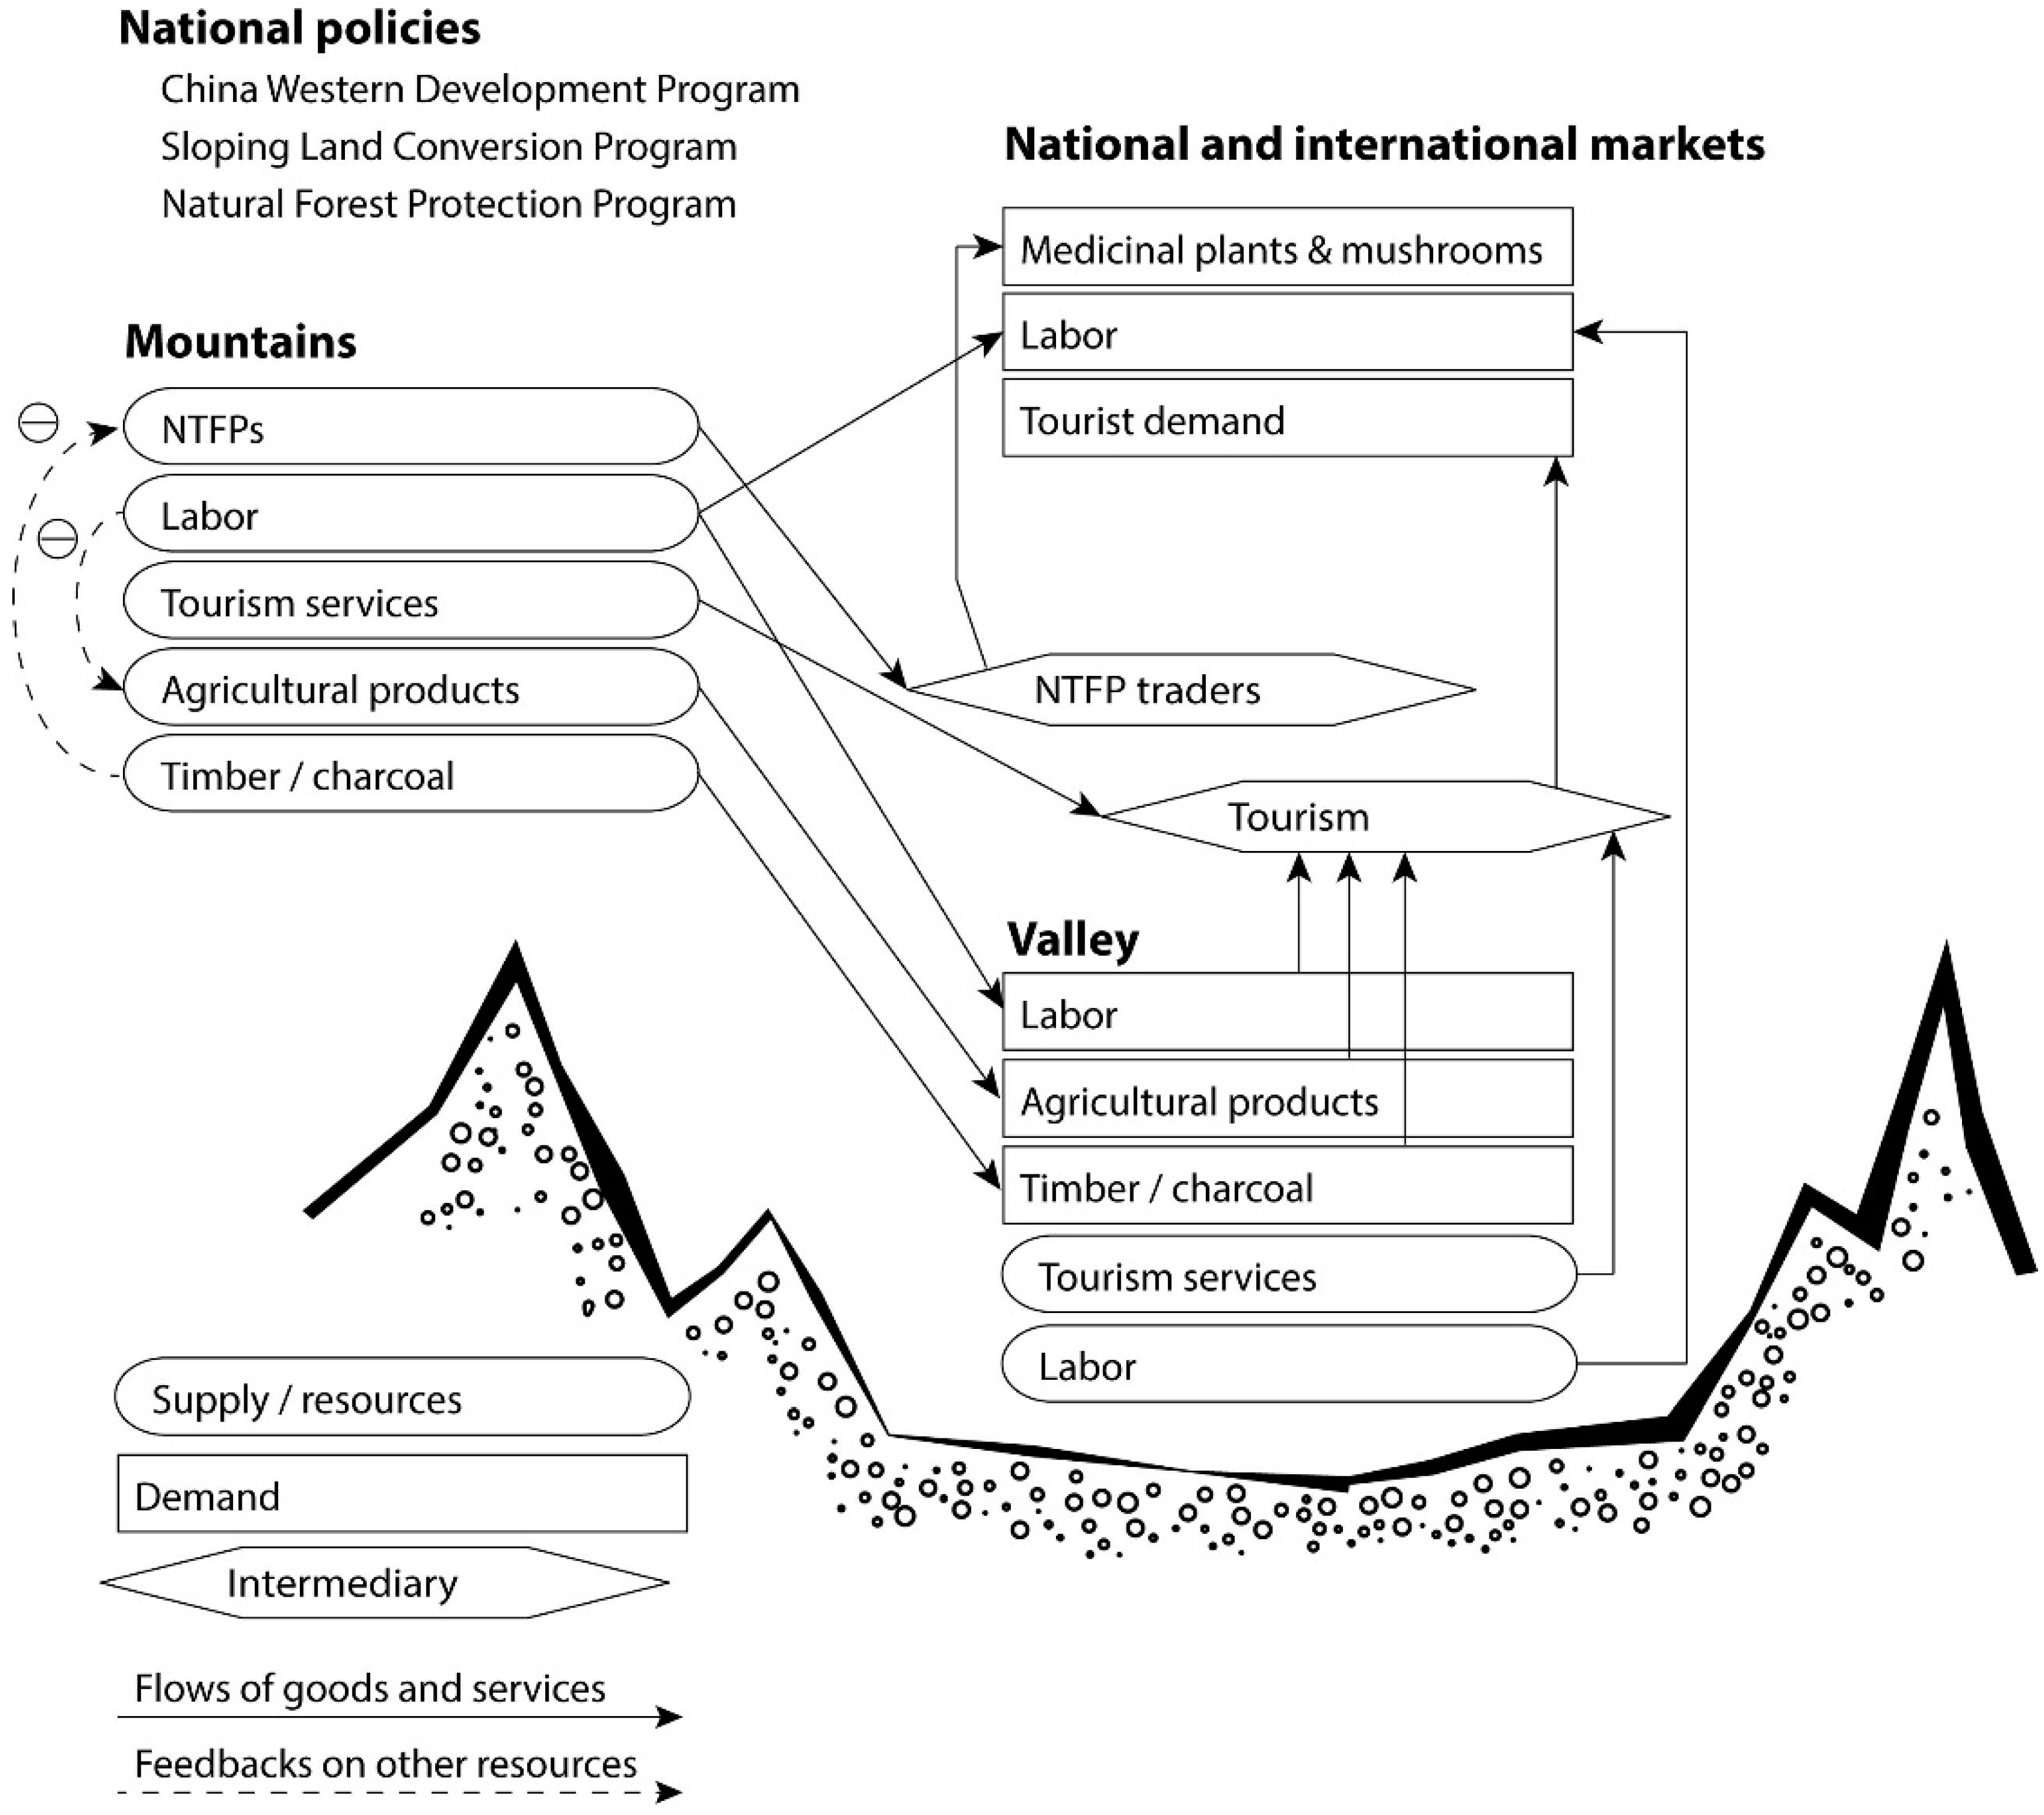
3.3. Depiction of the Main Mountain–Valley Interactions in a Simplified Model

4. Discussion
4.1. Structuring the Data with the HES Framework

4.2. Socioeconomic and Political Status of Mountain and Valley Communities
4.3. Education and Livelihood Strategies
4.4. Diversity of Livelihood Strategies in Mountain and Valley Communities
4.5. The Role of NTFP Collection in Mountain and Valley Communities
5. Conclusions
Acknowledgments
Author Contributions
Conflicts of Interest
References
- Ives, J.D. Himalayan Perceptions: Environmental Change and the Well-Being of Mountain Peoples; Routledge: Oxon, UK, 2004. [Google Scholar]
- Lenzen, M.; Peters, G.M. How City Dwellers Affect Their Resource Hinterland. A Spatial Impact Study of Australian Households. J. Ind. Ecol. 2009, 14, 73–90. [Google Scholar]
- Seeborg, M.C.; Jin, Z.H.; Zhu, Y.P. The new rural-urban labor mobility in China: Causes and implications. J. Socio-Econ. 2000, 29, 39–56. [Google Scholar] [CrossRef]
- Ives, J.D.; Messerli, B. The Himalayan Dilemma: Reconciling Development and Conservation; Routledge: London, UK; New York, NY, USA, 1989. [Google Scholar]
- Mahdi; Shivakoti, G.P.; Schmidt-Vogt, D. Livelihood Change and Livelihood Sustainability in the Uplands of Lembang Subwatershed, West Sumatra, Indonesia, in a Changing Natural Resource Management Context. Environ. Manag. 2009, 43, 84–99. [Google Scholar]
- Goodman, D.S.G. The campaign to “Open up the West”: National, provincial-level and local perspectives. China Q. 2004, 178, 317–334. [Google Scholar] [CrossRef]
- Lai, H.H. China’s Western Development Program: Its rationale, implementation, and prospects. Mod. China 2002, 28, 432–466. [Google Scholar] [CrossRef]
- McNally, C.A. Sichuan: Driving capitalist development westward. China Q. 2004, 178, 426–447. [Google Scholar] [CrossRef]
- Urgenson, L.S.; Hagmann, R.K.; Henck, A.C.; Harrell, S.; Hinckley, T.M.; Shepler, S.J.; Grub, B.L.; Chi, P.M. Social-ecological Resilience of a Nuosu Community-linked Watershed, Southwest Sichuan, China. Ecol. Soc. 2010, 15. Article 2. Available online: http://www.ecologyandsociety.org/vol15/iss4/art2/ (accessed on 11 March 2015). [Google Scholar]
- Scholz, R.W. Environmental Literacy in Science and Society: From Knowledge to Decisions; Cambridge University Press: Cambridge, UK, 2011. [Google Scholar]
- Le, Q.B.; Seidl, R.; Scholz, R.W. Feedback loops and types of adaptation in the modelling of land-use decisions in an agent-based simulation. Environ. Modell. Softw. 2012, 27–28, 83–96. [Google Scholar]
- Myers, N.; Mittermeier, R.A.; Mittermeier, C.G.; da Fonseca, G.A.B.; Kent, J. Biodiversity hotspots for conservation priorities. Nature 2000, 403, 853–858. [Google Scholar] [CrossRef] [PubMed]
- Huber, F.K.; Ineichen, R.; Yang, Y.P.; Weckerle, C.S. Livelihood and conservation aspects of non-wood forest product collection in the Shaxi valley, Southwest China. Econ. Bot. 2010, 64, 189–204. [Google Scholar] [CrossRef]
- Weckerle, C.S.; Ineichen, R.; Huber, F.K.; Yang, Y.P. Mao’s Heritage: Medicinal Plant Knowledge among the Bai in Shaxi, China, at a Crossroads between Distinct Local and Common Widespread Practice. J. Ethnopharmacol. 2009, 123, 213–228. [Google Scholar] [CrossRef] [PubMed] [Green Version]
- Morel, A.; Forster, D. Sideng Mission Report. Environmental Sanitation Survey July–August 2002; SANDEC/EAWAG: Duebendorf, Switzerland, 2002. [Google Scholar]
- Yang, F.Q. The “Ancient Tea and Horse Caravan Road”, the “Silk Road” of Southwest China. Silk Road 2004, 2, 29–33. [Google Scholar]
- Katzen, J. Shaxi valley: Using history to address the future. In Tourism and Development in Yunnan; Mitchell, S., Ed.; Yunnan Fine Arts Publishing House: Kunming, Yunnan, China, 2003; pp. 174–215. [Google Scholar]
- Feiner, J.P.; Mi, S.W.; Schmid, W.A. Sustainable Rural Development Based on Cultural Heritage: The Case of the Shaxi Valley Rehabilitation Project. DISP 2002, 151, 79–86. [Google Scholar]
- Scholz, R.W.; Binder, C. Principles of Human-Environment Systems (HES) research. Manno, Switzerland, 14–17 June 2004; Pahl, C., Schmidt, S., Rizzoli, A.E., Jakeman, T., Eds.; International Environmental Modelling and Software Society: Manno, Switzerland, 2004; pp. 791–796. [Google Scholar]
- Pahl-Wostl, C. A conceptual framework for analysing adaptive capacity and multi-level learning processes in resource governance regimes. Glob. Environ. Chang. 2009, 19, 354–365. [Google Scholar] [CrossRef]
- DFID. Sustainable Livelihoods Guidance Sheets, Sections 1–7. Department for International Development: London, UK, 1999–2001. Available online: http://www.ennonline.net/resources/667 (accessed on 22 December 2014).
- The World Bank. Data—Inflation, Consumer Prices. Available online: http://data.worldbank.org/indicator/FP.CPI.TOTL.ZG (accessed on 22 December 2014).
- Démurger, S.; Fournier, M.; Yang, W.Y. Rural households’ decisions towards income diversification: Evidence from a township in northern China. China Econ. Rev. 2010, 21, S23–S44. [Google Scholar] [CrossRef]
- Block, S.; Webb, P. The dynamics of livelihood diversification in post-famine Ethiopia. Food Policy 2001, 26, 333–350. [Google Scholar] [CrossRef]
- Ersado, L. Income Diversification in Zimbabwe: Welfare Implications from Urban and Rural Areas. Available online: http://hdl.handle.net/10986/8389 (accessed on 11 March 2015).
- Zhou, Y.Y.; Han, H.; Harrell, S. From Labour to Capital: Intra-Village Inequality in Rural China, 1988–2006. China Q. 2008, 195, 515–534. [Google Scholar] [CrossRef]
- Tilt, B. Smallholders and the “Household Responsibility System”: Adapting to Institutional Change in Chinese Agriculture. Hum. Ecol. 2008, 36, 189–199. [Google Scholar] [CrossRef]
- Christiansen, F. Food Security, Urbanization and Social Stability in China. J. Agrar. Chang. 2009, 9, 548–575. [Google Scholar] [CrossRef]
- Binder, C.R.; Hinkel, J.; Bots, P.W.G.; Pahl-Wostl, C. Comparison of Frameworks for Analyzing Social-ecological Systems. Available online: http://dlc.dlib.indiana.edu/dlc/handle/10535/9198 (accessed on 11 March 2015).
- Walker, B.; Holling, C.S.; Carpenter, S.R.; Kinzig, A. Resilience, Adaptability and Transformability on Social-ecological Systems. Available online: http://www.ecologyandsociety.org/vol9/iss2/art5/ (accessed on 11 March 2015).
- De Brauw, A.; Rozelle, S. Reconciling the returns to education in off-farm wage employment in rural China. Rev. Dev. Econ. 2008, 12, 57–71. [Google Scholar]
- Wong, L. Chinese Migrant Workers: Rights Attainment Deficits, Rights Consciousness and Personal Strategies. China Q. 2011, 208, 870–892. [Google Scholar] [CrossRef]
- Huber, F.K.; Yang, Y.P.; Weckerle, C.S.; Seeland, K. Diversification of livelihoods in a society in transition: A case study of Tibetan communities in Southwest China. Soc. Nat. Resour. 2014, 27, 706–723. [Google Scholar] [CrossRef]
- Harrell, S.; Aga, R. Education or Migrant Labor: A New Dilemma in China’s Borderlands. Available online: http://www.japanfocus.org/-Stevan-Harrell/3939 (accessed on 11 March 2015).
- Gurung, D.B.; Seeland, K. Ecotourism Benefits and Livelihood Improvement for Sustainable Development in the Nature Conservation Areas of Bhutan. Sustain. Dev. 2011, 19, 348–358. [Google Scholar] [CrossRef]
- Müller-Böker, U.; Kollmair, M. Livelihood Strategies and Local Perceptions of a New Nature Conservation Project in Nepal. Mt. Res. Dev. 2000, 20, 324–331. [Google Scholar] [CrossRef]
- Zhang, L.P.; Zhang, Y.L.; Yan, J.Z.; Wu, Y.Y. Livelihood diversification and cropland use pattern in agro-pastoral mountainous region of eastern Tibetan Plateau. J. Geogr. Sci. 2008, 18, 499–509. [Google Scholar] [CrossRef]
- Hedge, R.; Enters, T. Forest products and household economy: A case study from Mudumalai Wildlife Sanctuary, Southern India. Environ. Conserv. 2000, 27, 250–259. [Google Scholar] [CrossRef]
- Kar, S.P.; Jacobson, M.G. NTFP income contribution to household economy and related socio-economic factors: Lessons from Bangladesh. For. Policy Econ. 2012, 14, 136–142. [Google Scholar] [CrossRef]
- He, J.; Dong, M.; Stark, M. Small Mushrooms for Big Business? Gaps in the Sustainable Management of Non-Timber Forest Products in Southwest China. Sustainability 2014, 6, 6847–6861. [Google Scholar]
© 2015 by the authors; licensee MDPI, Basel, Switzerland. This article is an open access article distributed under the terms and conditions of the Creative Commons Attribution license (http://creativecommons.org/licenses/by/4.0/).
Share and Cite
Huber, F.K.; Morlok, M.; Weckerle, C.S.; Seeland, K. Livelihood Strategies in Shaxi, Southwest China: Conceptualizing Mountain–Valley Interactions as a Human–Environment System. Sustainability 2015, 7, 3204-3229. https://doi.org/10.3390/su7033204
Huber FK, Morlok M, Weckerle CS, Seeland K. Livelihood Strategies in Shaxi, Southwest China: Conceptualizing Mountain–Valley Interactions as a Human–Environment System. Sustainability. 2015; 7(3):3204-3229. https://doi.org/10.3390/su7033204
Chicago/Turabian StyleHuber, Franz K., Michael Morlok, Caroline S. Weckerle, and Klaus Seeland. 2015. "Livelihood Strategies in Shaxi, Southwest China: Conceptualizing Mountain–Valley Interactions as a Human–Environment System" Sustainability 7, no. 3: 3204-3229. https://doi.org/10.3390/su7033204
APA StyleHuber, F. K., Morlok, M., Weckerle, C. S., & Seeland, K. (2015). Livelihood Strategies in Shaxi, Southwest China: Conceptualizing Mountain–Valley Interactions as a Human–Environment System. Sustainability, 7(3), 3204-3229. https://doi.org/10.3390/su7033204