Review

Soil Degradation in India: Challenges and Potential Solutions

1
Centre for Environment Science & Climate Resilient Agriculture, NRL Building, Indian Agricultural Research Institute, New Delhi 110 012, India
2
Central Soil & water Conservation Research & Training Institute, Dehradun 248 195, India
3
Bidhan Chandra Krishi Viswa-Vidayala, Kalyani, West Bengal 741 235, India
4
Central Research Institute on Dryland Agriculture, Hyderabad, Telangana 500 059, India
5
ICAR Research Complex for North Eastern Hill Region, Imphal, Manipur 795 004, India
6
National Bureau of Soil Survey & Land Use Planning, Kolkata Regional Center, Kolkata 700 091, India
7
National Bureau of Soil Survey & Land Use Planning, Bangalore Regional Center, Bangalore 560 024, India
8
Division of Soil Physics, Indian Institute of Soil Science, Bhopal 462 038, India
9
USDA-ARS, Plant Science Research Unit, Raleigh, NC 27695, USA
*
Author to whom correspondence should be addressed.
Sustainability 2015, 7(4), 3528-3570; https://doi.org/10.3390/su7043528
Submission received: 16 November 2014 / Revised: 9 February 2015 / Accepted: 27 February 2015 / Published: 25 March 2015
(This article belongs to the Special Issue Enhancing Soil Health to Mitigate Soil Degradation)

Abstract

:
Soil degradation in India is estimated to be occurring on 147 million hectares (Mha) of land, including 94 Mha from water erosion, 16 Mha from acidification, 14 Mha from flooding, 9 Mha from wind erosion, 6 Mha from salinity, and 7 Mha from a combination of factors. This is extremely serious because India supports 18% of the world’s human population and 15% of the world’s livestock population, but has only 2.4% of the world’s land area. Despite its low proportional land area, India ranks second worldwide in farm output. Agriculture, forestry, and fisheries account for 17% of the gross domestic product and employs about 50% of the total workforce of the country. Causes of soil degradation are both natural and human-induced. Natural causes include earthquakes, tsunamis, droughts, avalanches, landslides, volcanic eruptions, floods, tornadoes, and wildfires. Human-induced soil degradation results from land clearing and deforestation, inappropriate agricultural practices, improper management of industrial effluents and wastes, over-grazing, careless management of forests, surface mining, urban sprawl, and commercial/industrial development. Inappropriate agricultural practices include excessive tillage and use of heavy machinery, excessive and unbalanced use of inorganic fertilizers, poor irrigation and water management techniques, pesticide overuse, inadequate crop residue and/or organic carbon inputs, and poor crop cycle planning. Some underlying social causes of soil degradation in India are land shortage, decline in per capita land availability, economic pressure on land, land tenancy, poverty, and population increase. In this review of land degradation in India, we summarize (1) the main causes of soil degradation in different agro-climatic regions; (2) research results documenting both soil degradation and soil health improvement in various agricultural systems; and (3) potential solutions to improve soil health in different regions using a variety of conservation agricultural approaches.

1. Sources of Land Degradation

Land degradation is not being adequately addressed, but is of vital importance to raise awareness so that future land management decisions can lead to more sustainable and resilient agricultural systems. Of India’s total geographical area (328.7 Mha), 304.9 Mha comprise the reporting area with 264.5 Mha being used for agriculture, forestry, pasture and other biomass production. The severity and extent of soil degradation in the country has been previously assessed by many agencies (Table 1). According to the National Bureau of Soil Survey and Land Use Planning [1] ~146.8 Mha is degraded. Water erosion is the most serious degradation problem in India, resulting in loss of topsoil and terrain deformation. Based on first approximation analysis of existing soil loss data, the average soil erosion rate was ~16.4 ton ha−1year−1, resulting in an annual total soil loss of 5.3 billion tons throughout the country [2]. Nearly 29% of total eroded soil is permanently lost to the sea, while 61% is simply transferred from one place to another and the remaining 10% is deposited in reservoirs.
Table 1. Extent of land degradation in India, as assessed by different organizations.
OrganizationsAssessment YearReferenceDegraded Area (Mha)
National Commission on Agriculture1976[3]148.1
Ministry of Agriculture-Soil and Water Conservation Division1978[4]175.0
Department of Environment1980[5]95.0
National Wasteland Development Board1985[6]123.0
Society for Promotion of Wastelands Development1984[7]129.6
National Remote Sensing Agency1985[8]53.3
Ministry of Agriculture1985[9]173.6
Ministry of Agriculture1994[10]107.4
NBSS&LUP1994[11]187.7
NBSS&LUP (revised)2004[12]146.8
Soil degradation has become a serious problem in both rainfed and irrigated areas of India. India is losing a huge amount of money from degraded lands (Table 2). This cost is documented by declining crop productivity, land use intensity, changing cropping patterns, high input use and declining profit [13,14,15,16]. Reddy [17] valued the loss of production in India at Rupees (Rs) 68 billion in 1988–1989 using the National Remote Sensing Agency (NRSA) dataset. Additional losses resulting from salinization, alkalinization and waterlogging were estimated as Rs 8 billion. Of late, in a comprehensive study made on the impact of water erosion on crop productivity, it was revealed that soil erosion due to water resulted in an annual crop production loss of 13.4 Mt in cereal, oil seeds and pulse crops equivalent to ~US$162 billion [18].
Table 2. Estimates on the annual direct cost of land degradation in India.
ParametersNRSA [19]ARPU [20]Sehgal and Abrol [21]
Area affected by soil erosion (Mha)31.5 58.0 166.1
Area affected by salinization, alkalinization and waterlogging (Mha)3.2 -21.7
Total area affected by land degradation (Mha)34.7 58.0 187.7
Cost of soil erosion in lost nutrients (Rs billion)18.0 33.3 98.3
Cost of soil erosion in lost production (Rs billion)67.6 124.0 361.0
Cost of salinization, alkalinization and waterloggingin lost production (Rs billion)7.6 -87.6
Total direct cost of land degradation (Rs billion)75.2 -448.6
Apart from faulty agricultural activities that led to soil degradation (discussed in the next Section), other human-induced land degradation activities include: land clearing and careless management of forests, deforestation, over-grazing, improper management of industrial effluents and wastes, surface mining, and industrial development. Each of these factors are discussed briefly, but offering greater detail is beyond the scope of this review.

1.1. Overgrazing, Deforestation and Careless Forest Management

Overgrazing and deforestation have caused degradation in eight Indian states which now have >20% wasteland (Source: Wasteland atlas of India by national remote sensing agency; NRSA). Loss of vegetation occurs due to cutting beyond the silviculturally permissible limit, unsustainable fuelwood and fodder extraction, encroachment by agriculture into forest lands, forest fires and overgrazing, all of which subject the land to degradation forces. A cattle population of 467 million grazes on 11 Mha of pastures, implying an average of 42 head per hectare of land compared to a sustainable threshold level of 5 animals per hectare [22]. High livestock density in arid regions causes overgrazing, resulting in decreased infiltration and accelerated runoff and soil erosion. Due to overgrazing, soil loss is 5 to 41 times greater than normal at the mesoscale and 3 to 18 times greater at the macroscale [23]. Tendency of cultivation on slopes in the 1990s led to deforestation and land degradation [24]. Impoverishment of the natural woody cover of trees and shrubs is a major factor responsible for wind and water erosion. This occurs because the per capita forest land in the country is only 0.08 ha compared to a requirement of 0.47 ha to meet basic needs, thus creating excessive pressure on forest lands.

1.2. Urban Growth, Industrialization and Mining

An increase in industrialization, urbanization and infrastructure development is progressively taking away considerable areas of land from agriculture, forestry, grassland and pasture, and unused lands with wild vegetation. Opencast mining is of particular focus because it disturbs the physical, chemical, and biological features of the soil and alters the socioeconomic features of a region. Negative effects of mining are water scarcity due to lowering of water table, soil contamination, part or total loss of flora and fauna, air and water pollution and acid mine drainage. Overburden removal from mine area results in significant loss of vegetation and rich topsoil [25]. Overburden removal is normally done by blasting or using excavators, resulting in generation of large volume of waste (soil, debris and other material). Open-pit mines produce 8 to 10 times as much waste as underground mines [26]. The magnitude and significance of impact on the environment due to mining varies from mineral to mineral and also on the potential of the surrounding environment to absorb the negative effects associated with geographical disposition of mineral deposits and size of the mining operations. Mineral production generates enormous quantities of waste/overburden and tailings/slimes and a huge land area is degraded (Table 3).
Table 3. Mineral Production, waste generation and land affected in 2005-06 (Data source: Sahu [25]).
MineralProduction (Mt)Overburden/Waste (Mt)Estimated Land Affected (ha)
Coal407149310,175
Limestone1701781704
Bauxite128123
Iron ore1541441544
Others919-

1.3. Natural and Social Sources of land Degradation

Natural causes of land degradation include earthquakes, tsunamis, droughts, avalanches, landslides, volcanic eruptions, floods, tornadoes, and wildfires (discussed in more detail in Section 3). Some underlying social causes of soil degradation are land shortage, decline in per capita land availability, economic pressure on land, land tenancy, poverty, and population increase.

1.4. Land Shortage, Land Fragmentation and Poor Economy

In India, small land holdings are a prominent feature, particularly in rainfed regions. Some 80% of farmers’ holdings are ≤2 ha, accounting for >50% of agricultural output. Average size of land holding declined from 2.3 ha to 1.3 ha during 1970–2000 with per capita land of 0.32 hectare in 2001 [27]. Small land holdings lead to severe economic pressures on farmers. Because of such pressure, labor, land and capital resources limit the use of green manuring or soil conservation structures. Therefore, land shortage and poverty, taken together, lead to non-sustainable land management practices as a direct source of degradation. This is also the underlying reason for two other direct causes of land degradation, improper crop rotations and unbalanced fertilizer use [28].
Despite several interventions by the Indian Government, land degradation is still a serious problem. Some programs have included Integrated Watershed Management in the catchment of flood prone areas-1980–1981; National Land Use and Development Council-1985; National Wasteland Development Board–1985; National Watershed Development Projects for Rainfed Areas-1985–1986; Reclamation and Development of Alkali and Acid soil-1985–1986; National Land Use Policy-1988; Integrated Wasteland Development Project-1989–1990; Constitution (74th amendment) Act-1992 (Regulation of Land Use) and National Rainfed Area Authority-2006. The United Nations Environmental Programme (UNEP) indicated that over the preceding 20 years the problem of land degradation had continued to worsen due to human activities and climate change causing prolonged or frequent droughts that aggravated land degradation. Other underlying causes included increasing population:land ratio (Agriculture share in GDP fell from 35% in 1981 to 13% in 2012); market and institutional failures; externality and tenurial system–insecure property rights.

1.5. Population Increase

India’s land area is about 2.5% of the global land area, where as it supports more than 16% of the global human population and ~20% of the world’s livestock population. Steady increases in human population, as well as livestock population, and the widespread incidence of poverty, are exerting heavy pressures on India’s limited land resources. Urban sprawl is a consequence of increasing urban population. As urban population increases, infrastructure requirements including transportation, water and sewage facilities, housing, schools, commerce, health, and recreation all contribute to urban sprawl [29].

2. Agricultural Activities Leading to Land Degradation in India

“Most of the area under cultivation in India has been under cultivation for hundreds of years, and had reached its state of maximum impoverishment many years ago … In this connection it must be remembered that deficiency of combined nitrogen is the limiting factor throughout the greater part of India” (The Royal Commission on Agriculture in India Report, [30] (p. 76)). The Green Revolution brought about a technological breakthrough, leading to the use of short duration high yielding varieties that helped intensify land use within a year by increasing the area under irrigation and greatly increasing the use of chemicals such as fertilizers and pesticides. Agricultural production of India increased from 50 Mt to over 250 Mt, over the last five decades. This, however, had further consequences, including loss of plant biodiversity and environmental pollution. Widespread land degradation caused by inappropriate agricultural practices has a direct and adverse impact on the food and livelihood security of farmers. Basically, degradation is caused by erosion, which results in the loss of topsoil through the action of water and wind, or waterlogging, which results in soil salinization. Maheswarappa et al. [31] observed that (i) the C-sustainability index was high in 1960, and was indicative of the minimum usage of inputs prior to the onset of the Green Revolution and (ii) thereafter, the C-sustainability index decreased because of greater C-based inputs, in which a linear relationship exists between C inputs and C outputs.
Agricultural activities and practices can cause land degradation in a number of ways depending on land use, crops grown and management practices adopted. Some of the common causes of land degradation by agriculture include cultivation in fragile deserts and marginal sloping lands without any conservation measures, land clearing through clear cutting and deforestation, agricultural depletion of soil nutrients through poor farming practices, overgrazing, excessive irrigation, overdrafting (the process of extracting groundwater beyond the safe yield of the aquifer), urban sprawl and commercial development, and land pollution including industrial waste disposal to arable lands.

2.1. Low and Imbalanced Fertilization

Intensive farming practices, particularly with wheat (Triticum aestivum L.) and rice (Oryza sativa L.) in India, have virtually mined nutrients from the soil. The already imbalanced consumption ratio of 6.2:4:1 (N:P:K) in 1990–1991 has widened to 7:2.7:1 in 2000–2001 and 5:2:1 in 2009–2010 compared with a target ratio of 4:2:1. As food grain production increased with time, the number of elements deficient in Indian soils increased from one (N) in 1950 to nine (N, P, K, S, B, Cu, Fe, Mn, and Zn) in 2005–2006. Although the use of fertilizers has increased several fold, the overall consumption continues to be low in most parts of the country. Wide spread Zn deficiency, followed by S, Fe, Cu, Mn and B in are common throughout the country. Every year, ~20 Mt of the three major nutrients are removed by growing crops [32], but the corresponding addition through inorganic fertilizers and organic manures falls short of this harvest. Another estimate suggests that for the past 50 years, the gap between removals and additions of nutrients has been 8 to 10 Mt N + P2O5 + K2O per year [33]. In addition nutrient loss through soil erosion is another reason for soil fertility depletion, accounting for an annual loss of 8 Mt of plant nutrients through 5.3 billion tons of soil loss [34].

2.2. Excessive Tillage and Use of Heavy Machinery

Excessive tillage coupled with use of heavy machinery for harvesting and lack of adequate soil conservation measures causes a multitude of soil and environmental problems. Decline in soil organic matter (SOM) leads to limited soil life and the poor soil structure. Puddling of soil for paddy rice degrades soil physical properties and has negative impacts on soil biology [35]. Poor physical condition of soil leads to poor crop establishment and waterlogging after irrigation. Intensive agriculture has also led to doubling of irrigated cropland over the past four decades, from 19% to 38% of the cropped area. Much of this water has been extracted from limited ground water resources. Improper use and maintenance of canal irrigation has contributed significantly to soil degradation problems like waterlogging and salinization. Excess nitrate has leached into groundwater due to heavy N fertilizer use. Unnecessary tillage for land preparation and planting, indiscriminate irrigation, and excessive fertilizer applications are the main sources of greenhouse gas (GHG) emission from agricultural systems.

2.3. Crop Residue Burning and Inadequate Organic Matter Inputs

The NBSS&LUP data [21] show that nearly 3.7 Mha suffer from nutrient loss and/or depletion of SOM. Burning of crop residues for cooking, heating or simply disposal is a pervasive problem in India and contributes to SOM loss. According to the Ministry of New and Renewable Energy [36], ~500 Mt of crop residues are generated every year and ~125 Mt are burned. Crop residue generation is greatest in Uttar Pradesh (60 Mt) followed by Punjab (51 Mt) and Maharashtra (46 Mt). Among different crops, cereals generate 352 Mt of residues followed by fibre crops (66 Mt), oilseeds (29 Mt), pulses (13 Mt) and sugarcane (Saccharum officinarum) (12 Mt). Rice (34%) and wheat (22%) are the dominant cereals contributing to crop residue generation [37].

2.4. Poor Irrigation and Water Management

Improper planning and management of irrigation systems and extraction of ground water in excess of the recharge capacity have resulted in a rise of the water table in most canal command areas. Specific issues of concern are inefficient use of irrigation water, poor land development, seepage from unlined water courses, non-conjunctive use of surface and ground water resources and poor drainage. Expansion of canal irrigation (like the Indira Gandhi Nahar Project, for instance) has been associated with widespread waterlogging and salinity problems in areas, such as in the Indo-Gangetic Plains (IGP). In arid, semi-arid and sub-humid regions, large areas have been rendered barren due to the development of saline-sodic soils because of poor irrigation and drainage management. Cracking of soil from poor irrigation management leads to bypass flow of water and subsequent nitrate leaching [29]. Cracks not closing properly leave a U-shaped trace, and upon drying these cracks can expand and cause soil shrinkage.

2.5. Poor Crop Rotations

Improper crop rotation coupled with lack of proper soil and water conservation measures are important reasons contributing to soil erosion in lands under cultivation. In addition, cultivation of marginal lands on steep slopes, in shallow or sandy soils, with laterite crusts, and in arid or semi-arid regions bordering deserts has resulted in land degradation. Agricultural production in marginal areas with low SOM due to unsuitable cropping patterns has been the major cause of accelerated wind and water erosion. Wind erosion is a serious problem in arid and semi-arid regions, in coastal areas with sandy soils, and in the cold desert regions of Leh in the extreme north of India.

2.6. Pesticide Overuse and Soil Pollution

Indiscriminate use of pesticides together with sewage sludge and composted municipal wastes leads to contamination of soil and water with toxic substances and heavy metals. Heavy metal pollution is due to improper disposal of industrial effluents and use of domestic and municipal wastes and pesticides. Some commercial fertilizers also contain appreciable quantities of heavy metals, which have undesirable effects on the environment. Indiscriminate use of agro-chemicals, such as fertilizers and pesticides, is often responsible for land degradation.

3. Extent and Causes of Soil Degradation by Region

The extent of land degradation in India, as estimated by NBSS&LUP and Indian Council of Agricultural Research (ICAR) is given in Table 4.
Table 4. State-wise extent of various kinds of land degradation in India (Mha). Data source: NBSS&LUP-ICAR [12] on 1:250,000 scale. TGA is total ground area.
StateWater ErosionWind Erosion Water Logging Salinity/
Alkalinity
Soil Acidity Complex ProblemTotal Degraded Area % of Degraded Area to TGA
Andhra Pradesh + Telengana11.501.90.50.90.215.054.5
Goa0.100.10000.243.9
Karnataka5.800.90.10.10.77.639.8
Kerala0.102.100.10.32.667.1
Tamil Nadu4.900.10.10.10.15.341.0
Manipur0.1 0 0 0 1.1 0.7 1.942.6
Mizorum0.10001.10.71.989.2
Meghalaya0.10001.001.253.9
Assam0.70000.60.92.228.2
Arunachal Pradesh2.400.202.00053.8
Nagaland0.40000.10.51,060.0
Sikkim0.20000.100.233.0
Tripura0.100.200.20.10.659.9
Himachal Pradesh2.801.300.204.275.0
Jammu and Kashmir5.50.10.20007.031.6
Uttar Pradesh + Uttarakhand11.40.22.41.40015.352.0
Delhi0.100000.00.155.4
Haryana0.30.50.10.300.21.533.2
Punjab0.40.30.30.3001.325.4
Bihar + Jharkhand3.002.00.21.006.336.1
West Bengal1.200.70.20.60.12.831.0
Union Territories0.200000.00.224.8
Gujarat5.20.40.50.301.78.141.5
Rajasthan3.26.701.400.111.433.2
Madhya Pradesh + Chhattisgarh17.900.407.01.126.259.1
Maharashtra11.2001.10.60.313.142.4
Orissa5.000.700.30.16.139.3
Grand Total (Mha)93.79.514.35.916.07.4146.8-
The Planning Commission of India has delineated 15 agro-climatic regions to form the basis for agricultural planning in the Eighth Plan. These are: 1. Western Himalayan Region, 2. Eastern Himalayan Region, 3. Lower Gangetic Plains Region, 4. Middle Gangetic Plains Region, 5. Upper Gangetic Plains Region, 6. Trans-Gangetic Plains Region, 7. Eastern Plateau & Hills Region, 8. Central Plateau & Hills Region, 9. Western Plateau & Hills Region, 10. Southern Plateau & Hills Region, 11. East Coast Plains & Hills Region, 12. West Coast Plains & Ghats Region, 13. Gujrat Plains and Hills Region, 14. Western Dry Region, 15. The Island Region. Similar agro-climatic regions have been combined to form six major regions. Region-specific causes and extent of degradation are described in the online Supplementary Information.

4. Strategies to Mitigate Land Degradation

The salient mitigation techniques for reversing land degradation in India and their applicability in major agro-climates are given in Table 5.
Table 5. Major land degradation mitigation techniques in the agro-climatic zones of India.
Mitigation TechnologiesHilly AreasIndo-Gangetic PlainsDryland and Desert AreasSouthern Peninsular IndiaCentral IndiaCoastal Areas
Applicability
Soil Erosion Control
Water Harvesting, Terracing and Other Engineering Structures
Landslide and Minespoil Rehabilitation and River Bank Erosion Control
Intercropping and Contour Farming
Subsoiling
Watershed Approach
Participatory Resource Conservation and Management
Integrated Nutrient Management and Organic Manuring
Reclamation of Acid and Salt Affected Soils and Drainage (Desalinization)
Remediation of As contamination
Water Management and Pollution Control
Irrigation Management for Improving Input Use Efficiency
Judicious Use of Distillery Effluent
Reforestation, Grassland and Horticulture Development
Vegetative Barriers and Using Natural Geotextiles, Mulching and Diversified Cropping
Agroforestry
Conservation Agriculture (CA)
Intensive Cropping and Integrated Farming Systems (IFS)
Disaster (Tsunami) Management

4.1. Soil Erosion Control

Tolerance to soil loss (T) is defined as the upper threshold limit of soil erosion that can be allowed without degrading long term productivity of a particular soil. If soil erosion rates are greater than T, mitigation measures are needed to achieve sustainable productivity. T-values of the hilly regions of India, as estimated by Mandal et al. [38], are given in Table 6 and Table 7. It is projected that ~59% of land within the hilly region requires some form of erosion management to achieve T [38].
Table 6. Area under different erosion rates and soil loss tolerance limits in the northwestern Hills.
Erosion Categories Based on Soil Erosion (ton ha−1year−1)Very Low (<5)Low
(5 to 10)
Moderate
(10 to 20)
Severe (20–40)Very Severe (>40)Others
Area (Mha) under each category 1.72.53.31.94.519.2
(5.2) *(7.5)(9.8)(5.8)(13.7)(58.0)
T-value (ton ha−1year−1)2.55.07.510.012.5Rocks/
unreported
Area (Mha) under each T value0.40.33.59.01.318.7
(1.2)(0.8)(10.6)(27.2)(3.9)(56.3)
* Values in the parentheses are percentages of total area. Data source: Mandal et al. [38].
Table 7. Area under different potential erosion rates and soil loss tolerance limits in the northeastern Hills (Source: Mandal et al. 38). * Values in the parentheses are percentages of area.
Erosion Categories Based on Soil Erosion (ton ha−1year−1)Very Low (<5)Low
(5 to 10)
Moderate (10 to 20)Severe (20-40)Very Severe (>40)Others
Area (Mha) under each category 1.25.84.63.68.24.1
(4.5) *(21.2)(16.8)(13.0)(29.8)(14.8)
T-value (ton ha−1year−1)2.55.07.510.012.5Rocks
/unreported
Area (Mha) under each T value-0.14.713.15.83.8
(0.3)(17.1)(47.7)(21.0)(13.9)
* Values in the parentheses are percentages of total area.
Soil conservation measures, such as contour ploughing, bunding, use of strips and terraces, can decrease erosion and slow runoff water. Mechanical measures, e.g., physical barriers such as embankments and wind breaks, or vegetation cover (and use of vegetative buffer strips and geotextiles) and soil husbandry are important measures to control soil erosion [39]. In addition, conservation agriculture (CA), agro-forestry, integrated nutrient management (INM) and diversified cropping also conserve soil and water. These are discussed sequentially as physical, chemical and biological means of soil conservation and land degradation mitigation in the following sections.

4.2. Water Harvesting, Terracing and Other Engineering Structures

Mechanical soil and water conservation measures are required for controlling soil erosion, retaining maximum rainfall within the slope and safe disposal of excess runoff from the top to the foot hills of India. These structures are often used in case of extreme soil degradation. The measures are: Bunding-small earthen barriers built on agricultural lands with slopes ranging from 1%–6% slope. Bunds are used in agriculture to collect surface run-off, increase water infiltration and prevent soil erosion. Graded bunds-constructed in medium to high rainfall areas of ~600 mm year−1. Contour bunds- either mechanical or vegetative barrier created across the slope. A study conducted at Doon valleys in the northwestern hills region indicted that contour bunds decreased runoff 25%–30% compared to field bunds [40]. Bench terrace and half moon terrace-adopted where soil depth is >1.0 m. Half-moon terraces are level circular beds having 1 to 1.5 m diameter cut into half-moon shape on the hill slopes. Beds are used for planting and maintaining saplings of fruit and fodder trees in horticulture/agro-forestry land uses. Grassed waterways-channels laid out preferably on natural drainage lines in the watershed. Water harvesting ponds-dug-out embankment type of water harvesting structure used for creating seasonal and perennial ponds at the foot of a micro-watershed for irrigation and fish farming purposes.
In vertisols (of central India), graded broad bed and furrow system of land configuration improves surface drainage and allows better water infiltration. It also facilitates drainage of excess water through grassed waterways. However, the broad bed and furrow system is not as effective for shallower Vertic soils, as it encourages runoff. Runoff and soil loss were lower from broad bed and furrow land surface management practices than from a flat on grade system (Table 8). The broad bed and furrow system decreased soil loss to a greater extent (31% to 55%) than its effect on runoff volume (24% to 32%) compared with that of flat on grade system.
Table 8. Seasonal rainfall, runoff and soil loss from different land configuration, broad-bed and furrow (BBF) and flat on grade (FOG) (Data source: Mandal et al. [41]).
YearRainfall (mm)Runoff (mm)Soil Loss (ton ha−1)
BBFFOGBBFFOG
20031058.0163.0 (15.4%)214.9 (20.3%)2.02.9
2004798.2124.0 (15.5%)183.3 (23.0%)0.71.5
2005946.0177 (18.7%)246 (26.1%)1.43.1
20061513.0502 (33.2%)873 (57.7%)3.56.4
Values within parentheses indicate the percent of total rainfall.

4.3. Landslide and Minespoil Rehabilitation and River Bank Erosion Control

High soil erosion rates were checked and brought within permissible limits (Table 9) by using bioengineering treatments on landslide affected (Nalotanala watershed; area ~60 ha) and minespoil affected (Sahastradhara watershed; area ~64 ha) areas. Restoration of limestone minespoil areas resulted in improved water quality through a reduction in Ca content (Table 10). For river bank erosion control, bio-engineering technologies such as spurs, retaining walls and earthen embankments may be used in conjunction with suitable vegetation such as giant cane (Arundo donax), five-leaf chaste trees (Vitex negundo), morning glory (Ipomoea sp.), Bamboo (Bambusa vulgaris), napiergrass (Pennisetum purpureum) or munja (Saccharum munja) [40].
Table 9. Effect of bioengineering measures on landslide (1964–1994) and minespoil rehabilitation (1984–1996) project [40].
ParticularsLandslide ProjectMinespoil Project
Before TreatmentAfter TreatmentBefore TreatmentAfter Treatment
Sediment load (ton ha−1 year−1)32065508
Vegetative cover (%)<5>951080
Table 10. Water quality parameters (mg L−1) for treated and untreated minespoils (Data source: CSWCR&TI Vision [40]).
CaMgSO4
Treated mine7434138
Untreated mine18839240

4.4. Intercropping and Contour Farming

Agronomical practices like use of cover crops, mixed/inter/strip cropping, crop rotation, green manuring and mulch farming are vital practices associated with integrated nutrient management. Growing soybean (Glycine max)/groundnut (Arachis hypogoea)/cowpea (Vigna radiata) with maize (Zea mays)/jowar (Sorghum bicolor)/bajra (Pennisetum glaucum) is a common example of intercropping in the drylands [39]. Strip cropping is a combination of contouring and crop rotation in which alternate strips of row crops and soil conserving crops are grown on the same slope, perpendicular to the wind or water flow in drylands and hilly regions, respectively. Intercropping cowpea with maize (2 rows of cowpea with 1 row of maize) decreased runoff by 10% and soil loss by 28% compared to pure maize. Minimum runoff (36% of rainfall) was recorded under barnyard millet (Echinochloa frumentacea L.) followed by black soybean (Glycine max L.) and maize which was 37% and 42%, respectively. Black soybean and maize alone had maximum soil loss of 7.1 and 6.7 ton ha−1, respectively, followed by barnyard millet (4.8 ton ha−1). The practice of line sowing of wheat and mustard (Brassica juncea L.) crops and maintaining row ratio of 8:1 ensured optimum use of space and soil moisture, increased wheat equivalent yield by 14% and net returns by 30% compared to mixed sowing (Table 11) [42,43].
Table 11. Water use efficiency, yield and net return as affected by different technologies and crop rotation in farmers’ fields of Uttarakhnad, Jammu and Kashmir and Himachal Pradesh.
IntercroppingCropsWater Use Efficiency
(kg ha−1mm−1)
Yield
(t ha−1)
Net Return
(INR ha−1)
CT% IncreaseCT% IncreaseCT% Increase
Maize + cowpea
(1:2) − wheat
Maize3.195.60762.21 *3.67 *66444811,690163
Wheat5.308.31571.131.64463176614988
Maize − wheat + mustard (9:1)Maize3.004.34451.942.754232488658163
Wheat6.339.66501.31 *1.93**4744559041105
Maize – potato − onion (irrigated)Maize3.094.52461.952.864633619135172
Potato53.7076.504217.1023.5033977519,25097
Onion18.8725.453512.0515.102538,70051,05032
Source: Ghosh [44], C-Conventional, T-Intercropping/crop rotation *—Maize equivalent yield; ** wheat equivalent yield. 60 INR (Indian Rupees) ~ 1USD (2014).
When crops like maize, sorghum and castor (Ricinus communis L.) are cultivated along with legumes such as groundnut, green gram (Vigna radiata L.), black gram (Vigna mungo L.), soybean and cowpea in inter-row spaces, sufficient cover on the ground is ensured and erosion hazards decreased [45]. Pathak et al. [46] reported several soil conservation measures based on rainfall in a particular area (Table 12).
Table 12. Soil and water conservation measures to be taken up based on seasonal rainfall in the Peninsular India (Source: Pathak et al. [46]).
Seasonal Rainfall (mm)Soil and Water Conservation Measures
<500Contour cultivation with conservation furrows, ridging, Sowing across slope, Mulching, Scoops, Off season tillage, Inter row water harvesting system, Small basins, Field bunds, KhadinTied ridges, contour bunds
500–750Zingg terrace, modified contour bunds and broad bed furrow
750–1000Broad bed furrow (vertisols), field bunds, vegetative bunds and graded bundsConservation furrows, sowing across slope, conservation tillage, Lock and spill drains, small basins, nadizingg terrace
>1000Level terrace and zingg terrace (conservation bench terrace)

4.5. Subsoiling

Low infiltration rate is one of the major problems of black soils (Vertisols) in central India. In Vertisols, improved tillage practices, particularly deep tillage (subsoiling with chisel plough), can improve soil water storage by greater infiltration and minimizing water stress. A study with three tillage treatments consisting of conventional tillage (CT), CT + subsoiling in alternate years, and CT + subsoiling in every year showed that the basic infiltration rate and soil water storage in the 90 cm profile were greater in CT + subsoiling every year than in CT [47].

4.6. Watershed Approach

Integrated watershed management, which involves soil and water conservation coupled with suitable crop management, is another excellent strategy for mitigating soil erosion. Development and management of watershed resources to achieve optimum production without causing deterioration in the resources base is integrated watershed management. It involves construction of check dams along gullies, bench terracing, contour bunding, land leveling and planting of grasses. These strategies will increase percolation of water, decrease runoff and improve water availability. Several reviews are available on the performance of watershed development projects [48,49], as well as their limitations. An operational research project on watershed management at Fakot by the CSWCR&TI during 1975–1986 is a successful example of participatory integrated watershed management approach [50]. Conservation agriculture along with above-said practices has great potential to reverse soil loss.

4.7. Participatory Resource Conservation and Management

A case study in Netranahalli Watershed (Karnataka) in the Southern Peninsular India stressed the importance of involvement of communities for conservation of natural resources (mainly soil and water) and their management. Improvement in ground water levels, soil and moisture conservation, development of irrigation facilities, water regeneration capacity, forestry and horticulture development, change in land use pattern and cropping pattern, improvement in animal health, employment and income generation were noticed by Adhikari et al. [51]. In a joint programme by Bangalore Regional Centre of NBSS&LUP, Nagpur and Tamil Nadu State Department of Agriculture at Shivagangai district, Tamil Nadu, water harvesting (in better maintained existing tanks), recharging (in aquifers) and providing drainage facilities (in lowlands) prevented water erosion and decreased incidence of salinity and sodicity [52].

4.8. Integrated Nutrient Management and Organic Manuring

Integrated nutrient management, i.e., the application of NPK mineral fertilizers along with organic manure, increases crop productivity, improves SOC content, and decreases soil loss. In the northwestern hill region, integrated nutrient management improved soil health and SOC storage in all cropping systems. Kundu et al. [53] and Bhattacharyya et al. [54] observed that about 19% and 25% of gross C input contributed to greater SOC content after 30 years of rainfed or after nine years of irrigated soybean-wheat production, respectively. Annual farmyard manure addition improved labile (movable; short-lived) and long-lived C pools [
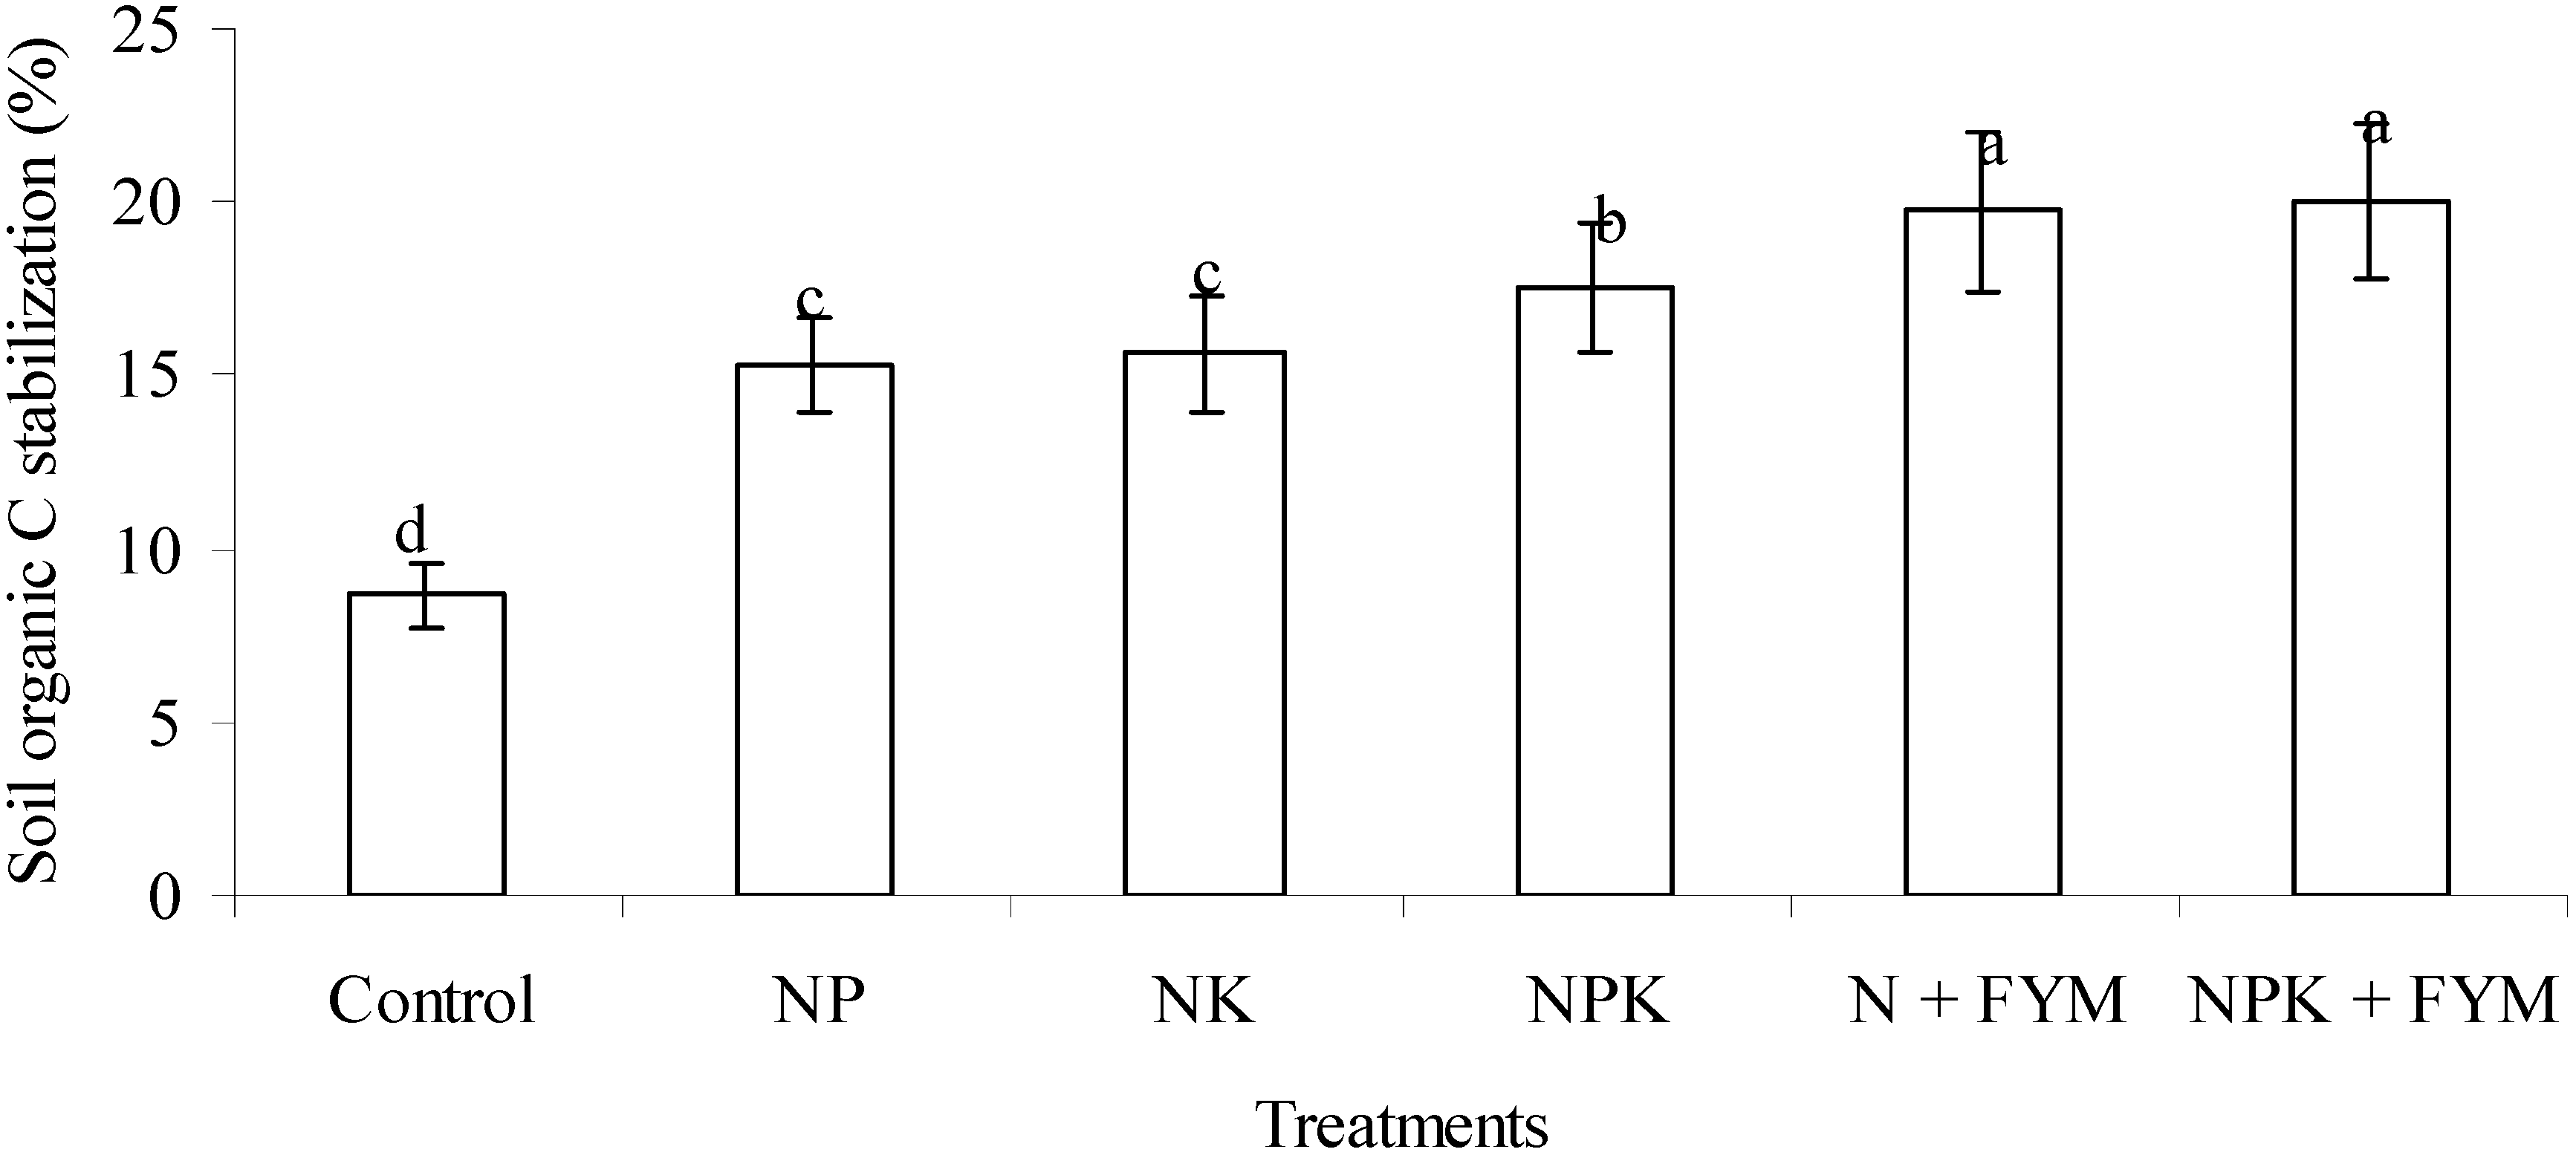
55]. Nearly 16% (mean of all treatments) of the estimated added C was stabilized into SOC both in the labile and recalcitrant pools, preferentially in the 0–30 cm soil layer (
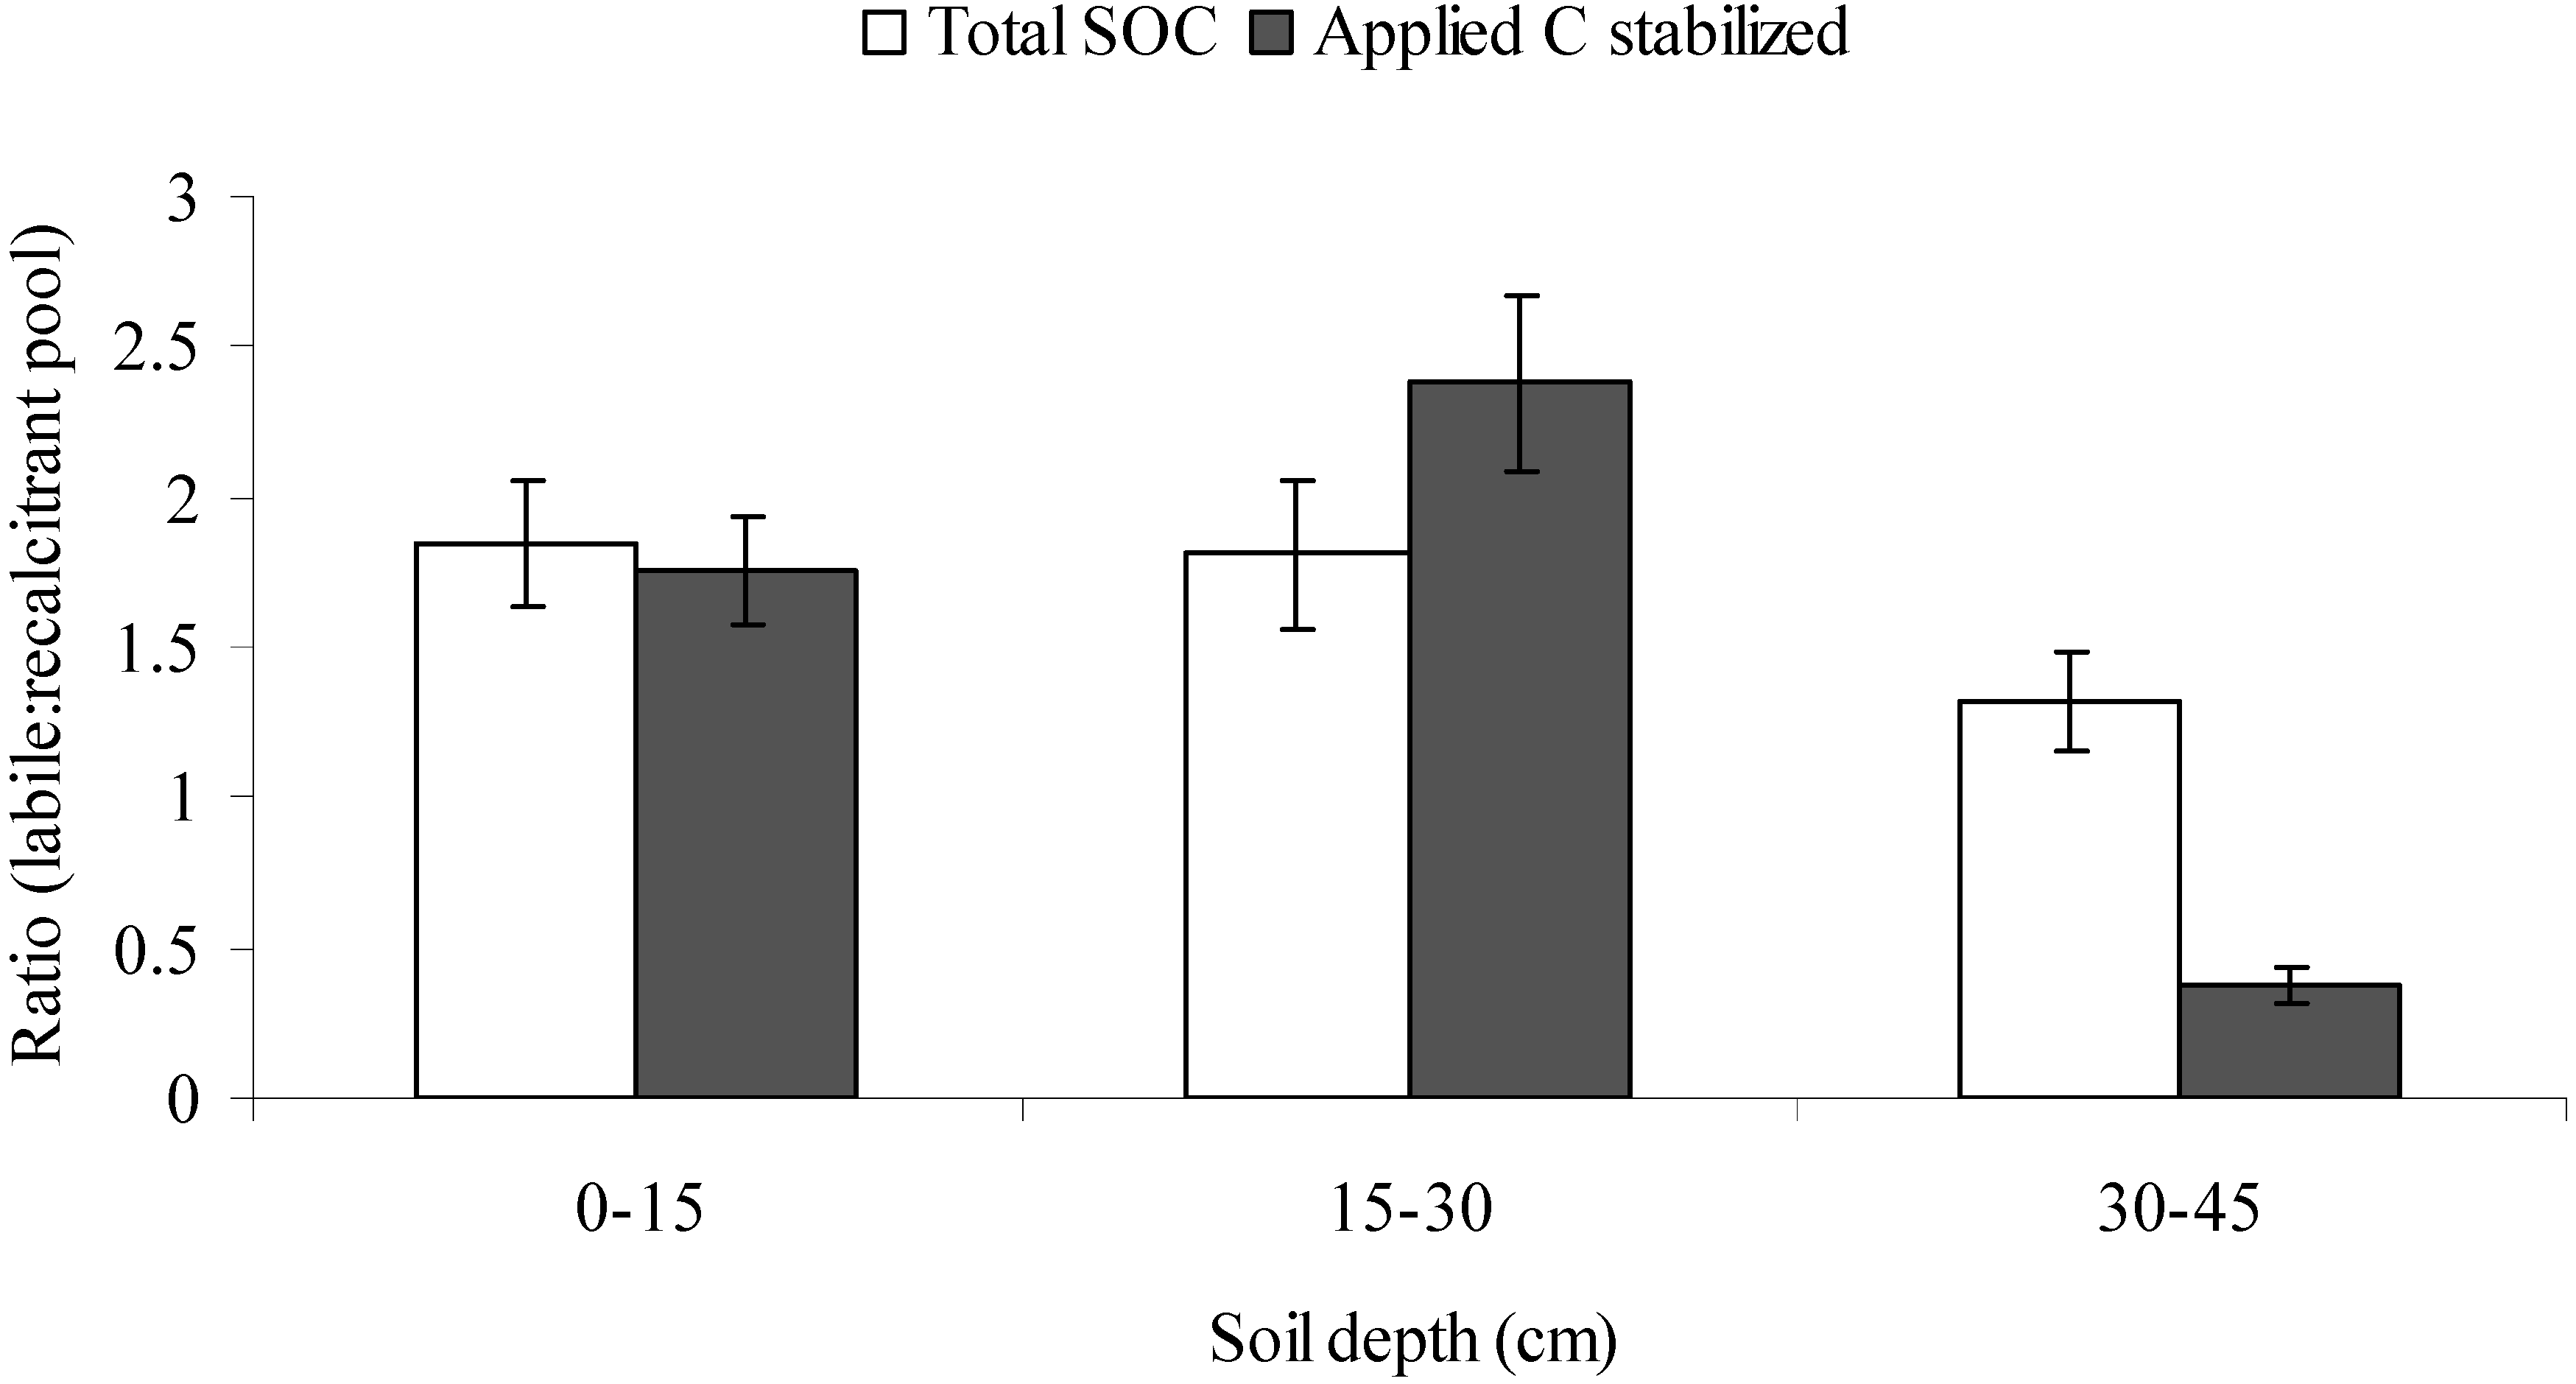
Figure 1). However, the labile:recalcitrant SOC ratios of applied C stabilized was largest in the 15–30 cm soil layer (
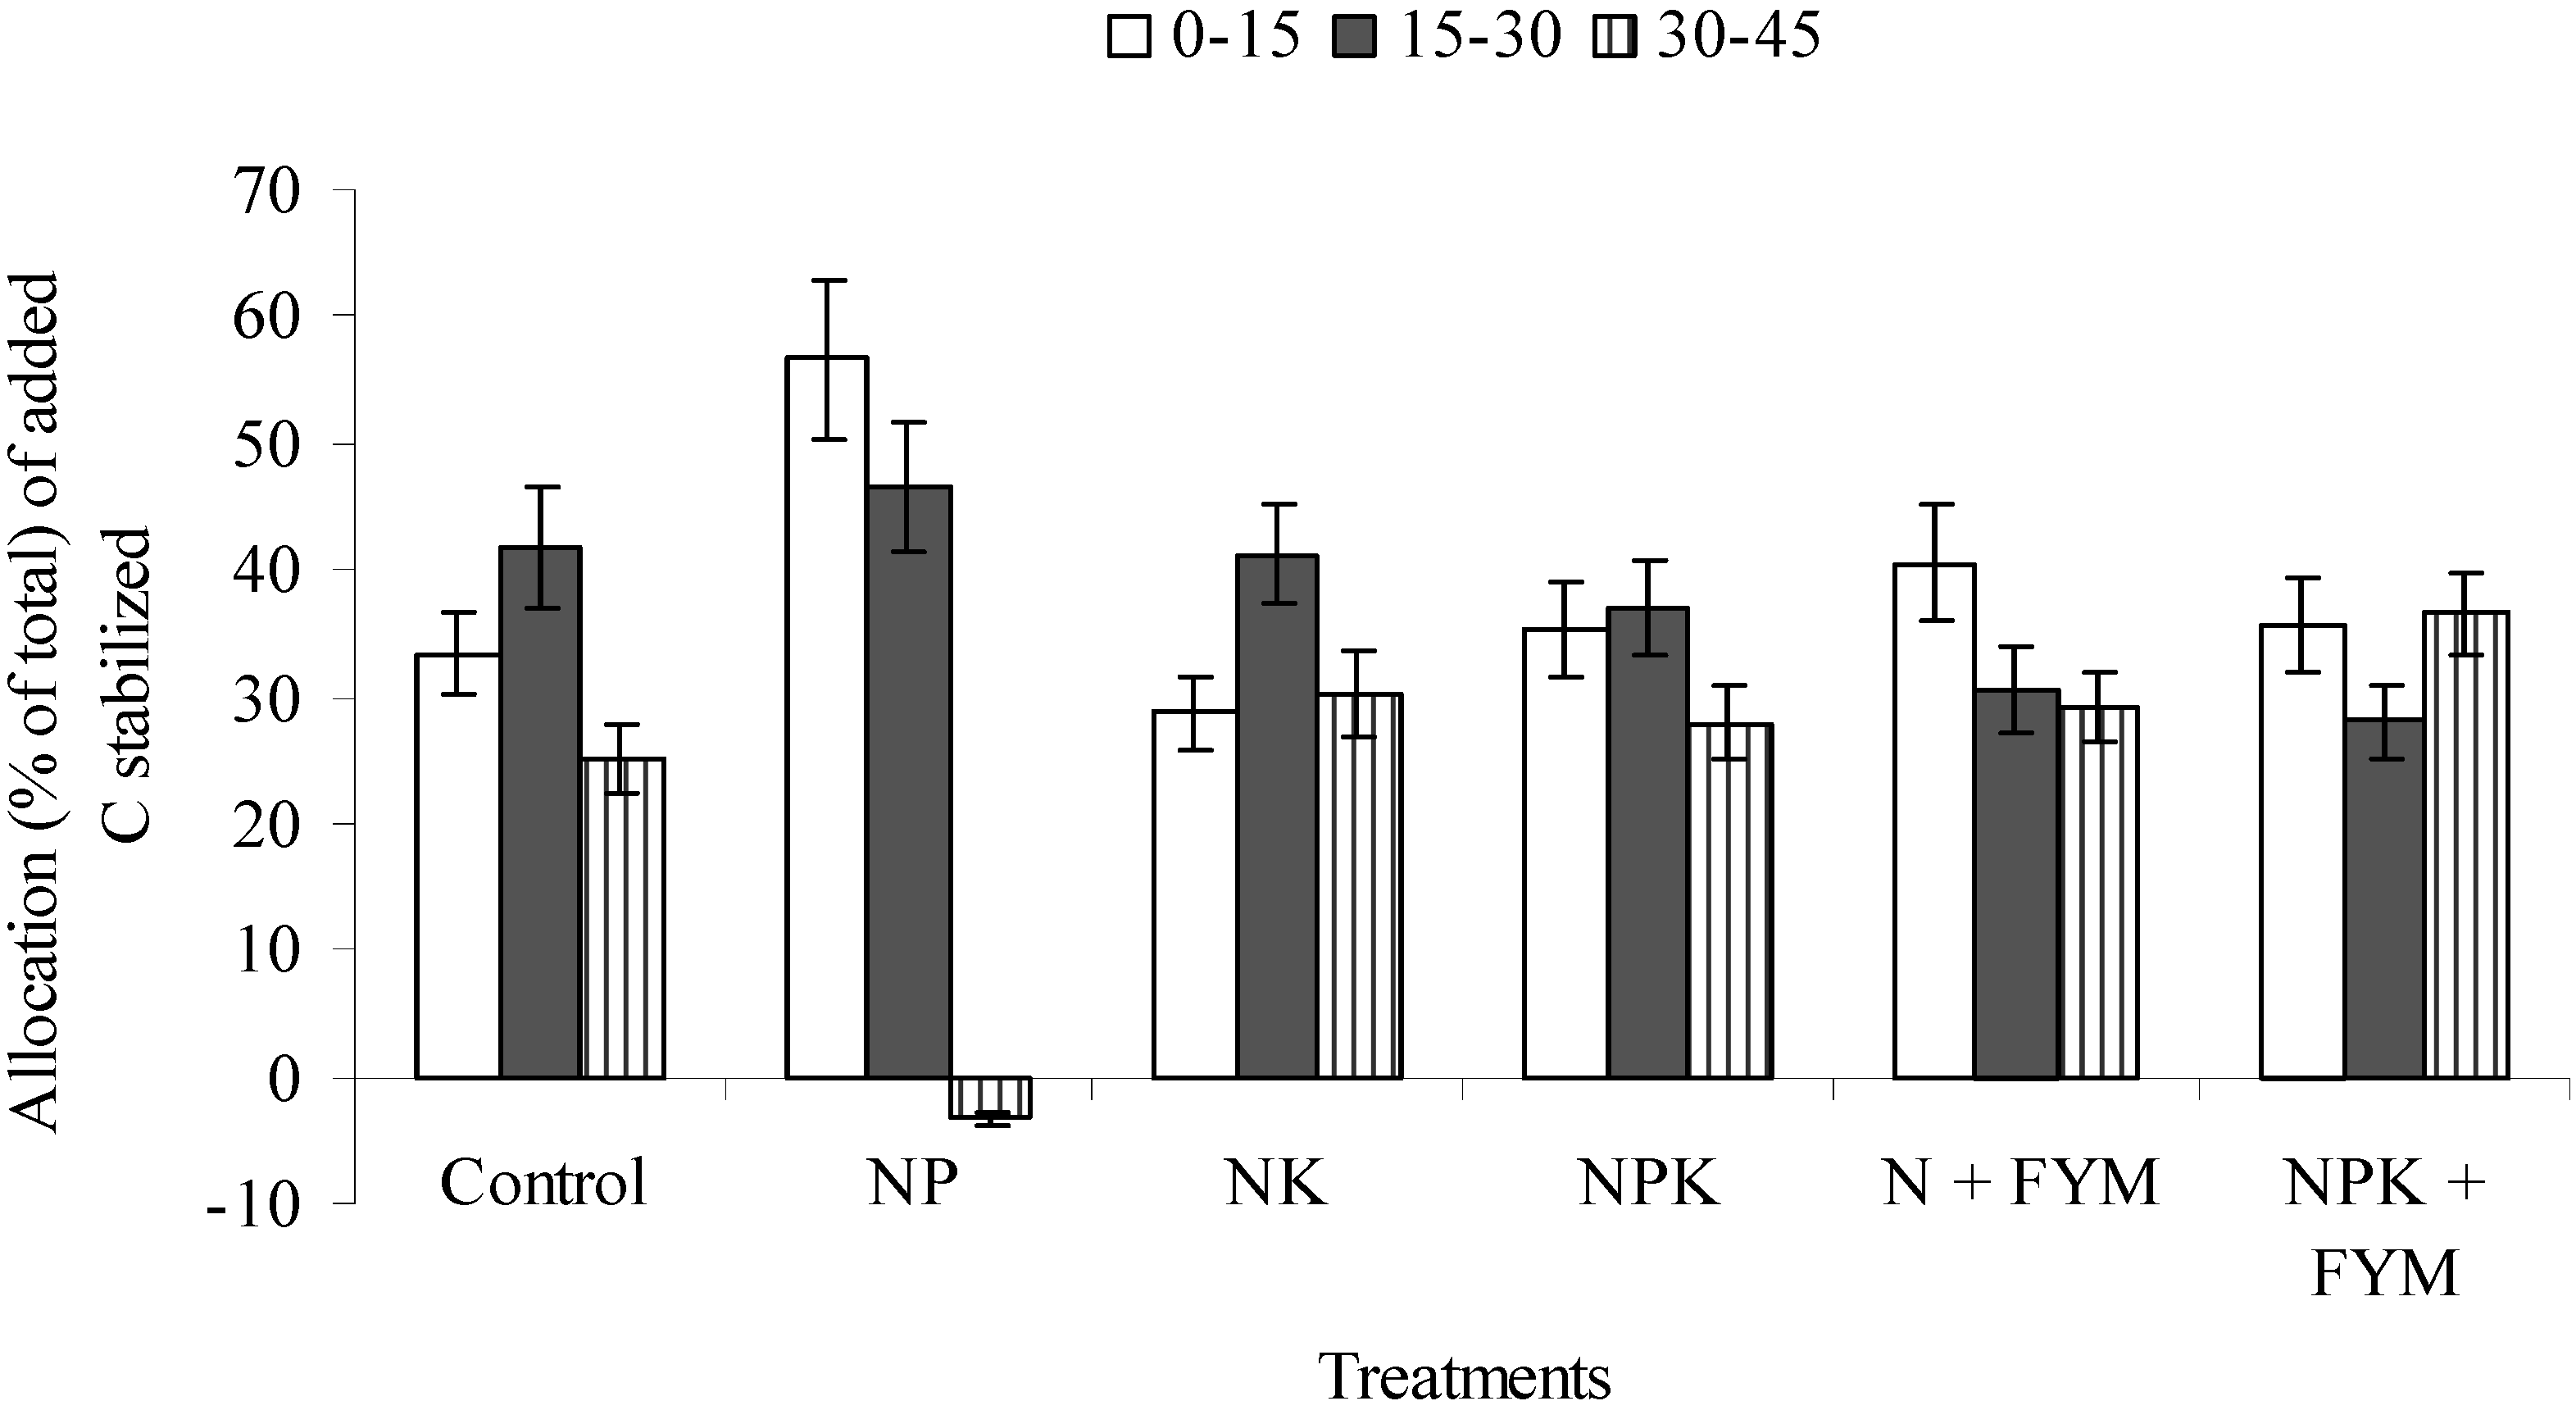
Figure 2). The labile pool constituted about 62% of the total SOC in the 0–45 cm soil layer and about 50% of the applied C stabilized in the labile pool (Figure 3). The integrated nutrient management approach of 5 ton ha−1 of farmyard manure +50% recommended fertilizer led to an additional grain yield of 2.65 ton ha−1 in paddy-maize cropping system (reference). Under rainfed conditions, C retention rate varied from 0.61 to 1.8 ton ha−1 year−1 in different crop rotations, which also enhanced crop yield (Table 13). However, with green manuring, wheat had greater water use (289 mm) than wheat in a wheat-fallow system (273 mm) or wheat (270 mm) rotated with maize [56].
Figure 1. Soil organic C (SOC) stabilization in the 0 to 45 cm soil layer as affected by 32 years of continuous annual fertilization under soybean-wheat cropping in a sandy clay loam soil of the Indian Himalayas. Bars with the same lowercase latter indicate that the values are not significantly different (at P < 0.05 according to Tukey’s HSD tests). Error bars indicate standard errors. (Source: Bhattacharyya et al. [55]).
Sustainability 07 03528 g001
Figure 2. Ratios of labile and recalcitrant pools of total SOC and applied C stabilized in soils by depth after 32 years of cropping with different fertilization (error bars indicate standard error of mean).
Sustainability 07 03528 g002
Figure 3. Depth (cm) distribution of total estimated added C stabilized after 32 years of fertilization (error bars indicate the standard error of mean; Source: Bhattacharyya et al. [55]).
Sustainability 07 03528 g003
Table 13. Fertilization impacts on carbon retention in the 0–15 cm layer and crop yield change in the Indian Himalayas (Data Source: Bhattacharyya et al. [54,57,58,59]).
Rainfed Management PracticesDuration of Adoption (year)Carbon Retention Over Control (Mg ha−1year−1)Yield Change OverYield Change over Unfertilized Control/Two Irrigations (Mg ha−1year−1)
NPK + FYM application-rainfed320.87Unfertilized control2.31 (S) & 1.17 (W)
NPK + FYM application-irrigated91.28Unfertilized control0.80 (S) & 1.74 (W)
FYM at 15 Mg ha−131.63Unfertilized control6.2 (GP) & 7.1 (FB) & 0.55 (BC)
FYM at 10 Mg ha−131.80Unfertilized control3.5 (GP) & 1.3 (R)
Four irrigations in wheat40.35Two irrigations0.17 * (R) & 0.44 (W)
S—soybean, W—wheat, SEY—soybean equivalent yield, FB—French bean, GP—Garden pea, BC—baby corn. * indicates not significant.
In the lower Indo-Gangetic Plains, Mandal et al. [60] observed 25%–38% greater accumulation of total SOC with NPK + FYM/compost than the control (no fertilizer). The order of such accumulation under different cropping systems was rice-mustard-sesame > rice-fallow-rice > rice-wheat-fallow > rice-wheat-jute (Corchorus sp.) > rice-fallow-barseem (Trifolium alexandrinum), over the control (Table 14). Mandal et al. [60] further observed that the amount of residue C inputs in the rice-wheat-fallow system (3.33 Mg ha−1 year−1) was similar to that in the rice-fallow-berseem (3.17 Mg ha−1 year−1), but the rate of annual C accumulation in the former was more than double (0.27 Mg C ha−1 year−1) than that in the latter (0.13 Mg C ha−1 year−1). Higher N content in crop residues of berseem (2.6%) and jute (1.8%) but lower lipids and lignin in rice-fallow-berseem and rice-wheat-jute systems may have accelerated decomposition and thus hastened loss of C. Crop residues from rice and wheat, which have low N content, are likely to be more efficient in C sequestration than the residue of crops like berseem and jute, which have higher N content. Likewise, in the drylands, Srinivasarao et al. [61] found that integrated nutrient management could improve C accumulation rates up to 0.45 ton ha−1year−1 in a groundnut based cropping system (Table 15).
Table 14. Effects of balanced fertilization (NPK and NPK + FYM or compost) on C build up in soils under different cropping systems (Data source: Mandal et al. [60]).
Cropping SystemC Build-Up (%) in Treatments over the Control PlotsC Build-Up Rate (Mg C ha−1year−1) over the Control Plots
NPKNPK + FYMNPKNPK+FYM
R-M-S51.8 a55.7 a1.91 a2.05 a
R-W-F16.8 c23.4 c0.27 b0.37 c
R-F-B9.3 d24.7 c0.13 c0.36 c
R-W-J14.9 c32.3 b0.11 c0.25 d
R-F-R33.5 b54.8 a0.28 b0.45 b
Build-up = [(NPK//NPK + FYM – Control)/Control] × 100; Build-up rate = [(NPK//NPK + FYM – Control)/year]; R-M-S, rice-mustard-sesame; R-W-F, rice-wheat-fallow; R-F-B, rice-fallow-berseem; R-W-J, rice-wheat-jute; R-F-R, rice-fallow-rice, FYM, farmyard manure.
Table 15. Carbon accumulation rate in soil (0–20 cm) and potential carbon emission reduction (CER) under different INM practices (Data source: Srinivasarao et al. [61]).
Production SystemsSuggested INM PracticeC Accumulation (ton ha−1year−1)Potential CER from the Suggested Practice
Farmers’ PracticeSuggested Practiceton ha−1Value (US $)
Groundnut-based (in Alfisols)50% RDF + 4 ton groundnut shell ha−10.080.450.3701.85
Groundnut–finger millet (in Alfisols)FYM 10 ton + 100% RDF (NPK)−0.1380.2410.3791.90
Finger millet–finger millet (in Alfisols)FYM 10 ton + 100% RDF (NPK)0.0460.3780.3321.66
Sorghum-based (in Vertisols)25 kg N ha−1 (through FYM) + 25 kg N ha−1 (through urea)0.1010.2880.1870.94
Soybean-based (in Vertisols)6 ton FYM ha–1 + 20 kg N + 13 kg P−0.2190.3380.5572.79
Rice-based (in Inceptisols)100% organic (FYM)−0.0140.1280.1420.71
Pearl millet-based (in Aridisols)50% N (inorganic fertilizer) + 50% N (FYM)−0.252−0.1100.1420.71
CER at US$ 5 ton−1 C (prevailing market price of CER for agroforestry and other related practices); RDF, Recommended dose of fertilizer; FYM, Farmyard manure.
Integrated nutrient management also decreases soil loss. Runoff and soil loss increased with increase in slope from 0.5% to 2.0% at Bellary (Table 16). However, in the treatments with application of recommended rate of fertilizer along with farm-yard manure, it was comparatively low. Plots under coir pith compost and integrated nutrient management improved maize yield and rainwater use efficiency from 4.95 to 5.79 kg ha−1 mm at Ayalur watershed, Tamil Nadu (Table 17).
Table 16. Runoff and soil loss under different crops on varying slopes at research farm, Bellary (Source: CSWCR&TI Annual Report [62]).
TreatmentsRunoff (mm)Soil Loss (ton ha−1)
SorghumChickpeaSorghumChickpea
0.51.02.00.51.02.00.51.02.00.51.02.0
Slope (%)
With fertilizer52.366.7894.848.7164.4584.562.454.045.672.012.724.79
Without fertilizer63.1666.85101.7949.0665.6492.992.724.796.082.193.315.35
Table 17. Effect of coir pith compost and integrated nutrient management (INM) on maize —a Case study in Ayalur watershed, Tamil Nadu (Source: Kannan et al. [63]).
ParticularsFarmers’ PracticeINMControlCoir Pith
Yield (ton ha−1)4.55.54.24.9
Additional yield (ton ha−1) -1.0-0.7
Additional cost (Rs) -2747--
Additional benefits(Rs) -8000--
Rain WUE (kg ha−1mm−1) 1012.24.955.79

4.9. Reclamation of Acid and Salt Affected Soils and Drainage (Desalinization)

Liming is the most desirable practice for amelioration of acid soils. Lime raises soil pH, thereby increasing the availability of plant nutrients and reducing toxicity of Fe and Al [64,65,66]. Sharma and Sarkar [64] and Bhat et al. [66] recommended low dose of lime (i.e., one-tenth to one-fifth of lime requirement) applied along with fertilizers in furrows at the time of sowing. Bhat et al. [67] also tested low-cost locally available basic slag, a by-product of a steel factory as an ameliorant for acidic red and lateritic soils of West Bengal under mustard-rice.
Management of saline soils involves tillage, irrigation and leaching. Inversion tillage can decrease potential soluble salt accumulation in the root zone compared to zero tillage [68]. However, deep tillage may bring more salts to the soil surface and root zone. The most efficient method is through application of high quality irrigation water (low electrical conductivity) and growing of salinity tolerant crops. Tolerant crops also support formation of stable soil aggregates, which help to improve soil tilth. Rice is the potential crop for reclamation of sodic soils. Salt affected soils are reclaimed by leaching followed by application of green manures. Gypsum is the major chemical used for reclamation of alkali soils. Other amendments used are: phosphogypsum or acid formers like pyrites, sulphuric acid, aluminium sulphate and sulphur. The treated field should be kept submerged with good quality water to facilitate reaction and subsequent leaching. In addition, proper drainage through deep and open drains can be adopted wherever problems persist. Restoration of salt-affected soils can also lead to a significant increase in SOC pool. Garg [69] observed a dramatic increase in SOC of a sodic soil planted with perennials (e.g., mesquite) after 8 years. Bhojvaid and Timmer [70] also reported an increase in SOC pool by restoration of salt-affected soils and a similar potential exists [71].
To reclaim non-saline sodic soil, incorporation of relatively soluble Ca salt like gypsum, phosphogypsum, iron salt like pyrite, CaCl2, sulfuric acid (H2SO4), or other acid formers like sulphur (S), lime-sulphur (9% Ca + 25% S), ferric sulfate and aluminium sulfate to replace exchangeable Na from the clay complex, along with recommended water and crop management practices, have been researched by many [72,73,74]. Reclaiming acid sulfate soils may follow approaches like: (i) pyrite and soil acidity can be removed by leaching after drying and aeration; (ii) pyrite oxidation can be limited or stopped and existing acidity inactivated by maintaining a high water table, with or without (iii) additional liming and fertilization with phosphorus, though liming may often be uneconomical in practical use. For coastal acid sulfate soils of Sundarbans, application of lime, superphosphate and rock phosphate have been found useful [75].
Since 1970 in India, there has been significant commercial development using various desalination technologies, including distillation, reverse osmosis and electrolysis [76]. Desalination mostly uses fossil fuels. Many facilities in coastal region are using reverse osmosis for desalinization. For example, at Kalpakkam reactor, Tamil Nadu, 1.8 million liters of water is being produced per day. Installation of one-way sluice gates on the river banks or any other suitable location to drain out excess water from the land during low tides in river, use of subsurface tile drains combined with moling perpendicular to the former [77], and open surface drains along with moling perpendicular to it [78] are some of the practices.

4.10. Remediation of As Contamination

Mitigation of As contamination could be achieved by replacing boro rice requiring more ground water with summer legumes and pulses, decreased irrigation coupled with addition of zinc sulfate, greater use of organic/green manures that moderate As toxicity in soils and plants [79,80], and phytoremediation employing hyper-accumulating plants like brake fern (Pteris vittata) and water hyacinth (Eichornia crassipes). Blue-green algae also have ability to decontaminate as of paddy soils through accumulation in its biomass and subsequent removal.

4.11. Water Management and Pollution Control

Promoting water conservation and efficient water management along with expansion of irrigation facilities, drip irrigation and sub-surface irrigation in some areas holds promise. Domestic and municipal wastes, sludges, pesticides, industrial wastes, etc. need to be used with utmost caution to avoid the possibility of pollution of soil. Mined land can be better reclaimed by proper back filling and spreading topsoil over the surface [81]. Reclaimed land after mining can be used for planting trees. The use of geo-textiles, permeable fabrics which separate, filter, reinforce, protect or drain the soil, will help the re-vegetation process [57,82].
Sen and Oosterbaan [83] presented a practical working method on integrated water management for Sundarbans through surface gravity induced drainage during the rainy season (through land shaping)-cum-excess rainwater storage for irrigation during dry season. Ambast and Sen [84] developed a user-friendly software ‘RAINSIM’ primarily for small holdings in the Sundarbans region based on hydrological processes, as well as in different agro-climatic regions. The software may be used for (i) computation of soil water balance; (ii) optimal design of water storage in the “on-farm reservoir” concept for converting up to 20% of the watershed; (iii) design of surface drainage in deep waterlogged areas to decrease water congestion in 75% of the area; and (iv) design of a simple linear program to propose optimal land allocation.

4.12. Irrigation Management for Improving Input Use Efficiency

Scheduling of irrigation based on critical stages of crops, or atmospheric demand stimulates optimum plant growth and increases the transpiration component of evapo-transpiration loss of water, thereby improves crop productivity and decreases soil degradation. Compared to flooding, sound surface irrigation methods like sprinkler or drip give better input efficiency. It not only improves the yield levels and input use efficiencies but also saves considerable volume of water. Besides this, in Vertisols, a considerable volume of irrigation water is lost beyond the root zones through bypass flow when irrigation water is applied through flooding. Loss of water through bypass flow in Vertisols could also be decreased by adopting irrigation application based on the atmospheric demand of water, i.e., by adopting (irrigation water/cumulative pan evaporation) based scheduling. Bandyopadhyay et al. [85] reported that irrigation scheduling at 0.8 irrigation water/cumulative pan evaporation significantly improved the soil water extraction, root length density and grain yield of wheat over irrigation at 0.6 IW/CPE. Besides, integrated use of 75% of the recommended doses of NPK to wheat with farm-yard manure at 5 Mg ha−1 or poultry manure at 1.5 Mg ha−1 or phosphocompost at 5 Mg ha−1 to the rainy season crops (like soybean or sorghum) significantly improved the root length density, yield and water use efficiency of wheat over application of 100% NPK to both crops, leading to a saving of 25% fertilizer NPK in both the seasons and improvement of the use efficiency of the fertilizer nutrients.

4.13. Judicious Use of Distillery Effluent

In the vicinity of distillery industries, irrigation water as distillery effluent can be applied judiciously as a waste by-product and this technique has a considerable impact on mitigating land degradation. Both spent wash and post-methanated effluent were tested in a field experiment on soybean-wheat system for five years in a Vertisol. The SOC of the surface (0–15 cm) layer and aggregate stability were greater with application of both techniques. Proportion of macroaggregates was greater with spent wash than with post-methanated effluent, as well as compared with no distillery effluents and NPK+farm-yard manure treatments. Macroaggregate-associated C was also greater in spent water treated plots. Plots receiving waste by-produts had greater SOC, mean-weight diameter of aggregates, and percent macro- and macroaggregate-associated C than farmers’ typical practice [86].

4.14. Reforestation, Grassland and Horticulture Development

In the hills, the majority of the upper slope is covered with horticultural crops using half-moon terraces and contour bunds and the remaining one-third of the lower section is used for cultivation of cereals, or oil crops with bench terraces. The following crops may be grown: (1) Fruit trees in half-moon terraces (triangular system of planting) on contour; (2) Pineapple (Ananas comosus L.) in two rows planted closer together in contour bunds; (3) Vegetables like bean (Phaseolus vulgaris L.), cowpea (Vigna sinensis L.), guar or clusterbean (Cyamopsis tetragonoloba L.), pea (Pisum sativum L.) and good cover crops like sweet potato in the interspaces of the contour and (4) Ginger (Zinziber officinale L.) and turmeric (Curcuma longa L.) grown in the inter-space area of contours. Grewal [87] found that under Eucalyptus-Bhabar grass (Eulaliopsis binata) system, soil loss was negligible (0.07 ton ha−1) (Table 18). Likewise, reforestation and grassland development in wastelands have great potential to decrease land degradation.
Table 18. Soil loss under different land use systems in Shivaliks (Source: Grewal [87]).
Land Use SystemsNo. of Years of ObservationsSoil Loss (ton ha−1)Runoff (% of Total Rainfall)N Loss (kg ha−1)K Loss (kg ha−1)
Eucalyptus-Bhabar grass60.10.10.50.9
Acacia catechu–forage grass30.22.07.00.5
Leucaena-Napier grass (Pennisetum purpureum L.)30.34.46.61.2
Teak (Tectona grandis L.)-Leucaena-Bhabar30.43.32.10.6
Eucalyptus-Leucaena-Turmeric50.62.62.50.7
Poplar (Liriodendron tulipifera)-Leucaena-Bhabar51.54.85.91.1
Sesamum (Sesamum indicum)-Rapeseed (Brassica napus)32.720.542.53.0
Cultivated fallow35.623.051.35.0

4.15. Vegetative Barriers and Using Natural Geotextiles, Mulching and Diversified Cropping

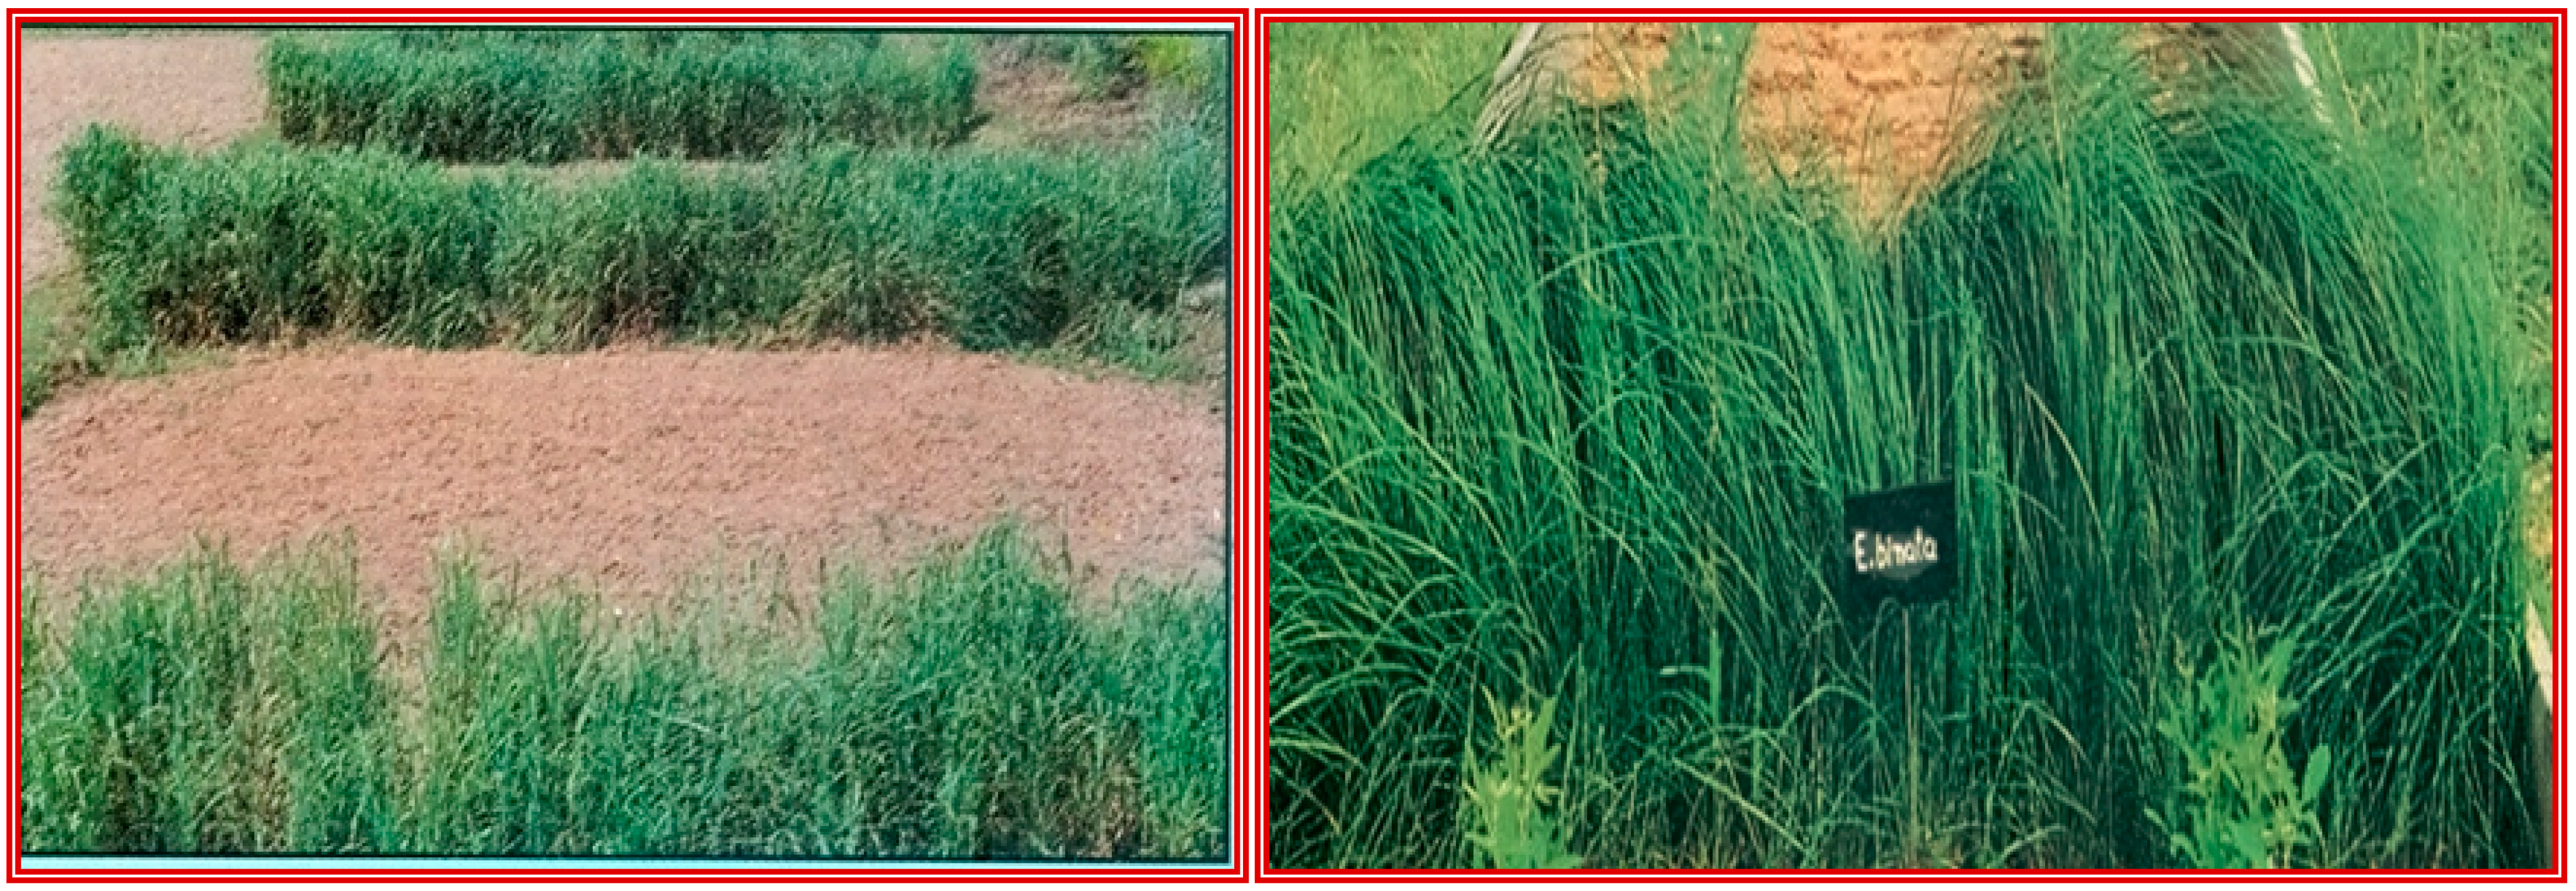
In general, results from the Himalaya region indicate that vegetative barriers can decrease runoff by 18%–21% and soil loss by 23%–68% on slopes varying from 2%–8% (Table 19). Vegetative barriers of Guinea grass (Plate 1), Khuskhus and Bhabar were effective (after 3–4 years) in reducing soil loss by 6–8 ton ha−1year−1 and runoff by 33%–38% [40]. Maize and wheat yield increased ~32 and 10%, respectively, due to conserved moisture in the hilly region [88]. Pigeonpea (Cajanas cajan), because of its very good canopy cover (95%–98%) as a vegetative barrier, was effective in reducing runoff (28%–29%) and soil loss (2.1 to 2.6 ton ha−1) in a finger millet (Eleusine coracana L.)/kodo millet (Paspalum scrobiculatum L.)-lentil (Lens esculentus L.) cropping sequence. Pigeonpea improved SOC along with addition of 22 to 41 kg of N ha−1 in the soil. The practice increased maize yield 5%–10% and wheat yield 10%–15% in the hills.
Table 19. Effect of grass barriers on yield, runoff and soil loss in different slopes of the northwestern hill region (Data Source: CSWCR&TI Vision [40]).
ParticularsSlope (%)
248
Guinea GrassGuinea GrassKhus
khus
BhabarGuinea GrassKhus khus
Runoff (% of total rainfall)25.833.335.137.938.9040.52
Soil loss (ton ha−1year−1)3.276.126.728.349.459.87
Maize yield (kg ha−1)253024602444229622852180
Wheat yield after maize (kg ha−1)285226932555236224152385
Dry grass yield (kg ha−1year−1 )1675154054210901375485
Plate 1. Vegetative barrier of Guinea grass and Bhabar grass (Source: CSWCR&TI Vision [40]).
Sustainability 07 03528 g007
Research results in neighbouring countries, like China, Thailand and Vietnam indicated that even short-term use of biological geotextiles (maize stalk mats, bamboo mats, borassus and buriti mats and wheat straw mats) in highlands significantly improved biomass and decreased runoff and soil loss [89,90,91,92]. Borassus mats (geotextile mats manufactured from Borassus aethiopum L.) and buriti mats (geotextiles manufactured from Mauritia flexuosa L.) were also tested for soil conservation in a loamy sand soils of the UK. The results are very novel and worth mentioning here. Results reveal that: (i) borassus mats significantly decreased soil splash erosion; (ii) complete cover by borassus mats is unnecessary and only 10% mat cover as buffer strips had similar erosion control to completely covered plots; and (iii) borassus mat-covered plots maintained SOM and other selected soil properties [93,94,95,96]. Vegetative barriers are also used to mitigate soil degradation in non-arable areas. Vegetative barriers of tree species are effective in controlling runoff and soil loss on 4% slope [97]. Total sediment deposited along hedgerows (3-year period) and tree rows (9-year period) ranged from 184 to 256 ton ha−1, equivalent to 15 to 20 mm soil depth (Table 20).
Table 20. Sediment deposition along vegetative barriers at Dehradun (Source: Narain et al. [97]).
Vegetative BarrierNo. of YearsSediment Deposited
(ton ha−1year−1)
Average Deposition (ton ha−1year−1)Soil Loss
s(ton ha−1year−1)
Leucaena hedge in turmeric field347.315.87.6
Leucaena hedge in maize field3184.061.312.1
Leucaena trees in maize field9256.528.58.8
Eucalyptus trees in maize field9185.620.65.8
Leucaena trees in turmeric field990.110.16.8
Eucalyptus trees in turmeric field9103.711.57.1
In a novel attempt in Bangladesh, implementation of jute geotextiles aided by native vegetation cover was investigated in 2009. Combined presence of jute geotextiles and vegetation cover decreased erosion rates by ~95% and runoff by ~70% with respect to bare plots (that had ~18 ton ha−1 year−1 soil loss) on a 20% land slope [98].

4.16. Agroforestry

Agroforestry systems are an appropriate management tool for both acid and salt-affected soils, because perennial woody vegetation recycles nutrients, maintains soil organic matter, and protects soil from surface erosion and runoff [99]. Four multipurpose tree species were compared with a control plot (without tree plantation) for soil fertility status in an acid soil of India. The presence of trees improved the physico-chemical and microbial biomass parameters by storing greater SOC [100]. Tree vegetation in an agroforestry system serves two major purposes: (i) the fine root system holds soil in place, reducing susceptibility to erosion; and (ii) plant stems decrease the flow velocity of runoff, enhancing sedimentation.
Nair [101] stated three environmental benefits of agroforestry systems: water-quality enhancement, C sequestration, and soil improvement. These benefits are based on the perceived ability of (i) vegetative buffer strips to decrease surface transport of agrochemical pollutants; (ii) large volumes of aboveground and belowground biomass of trees to store C deeper in the soil profile; and (iii) trees enhance soil productivity through biological N2 fixation, efficient nutrient cycling, and deep capture of nutrients. Legume-based agroforestry has the capacity to support biological N fixation to enhance subsequent soil N availability and therefore improve soil fertility and crop yields [102].
Biosaline (agro) forestry is the cultivation of trees and/or crops on salt-affected soils. Some tree species are less susceptible to soil salinity and sodicity than agricultural crops and hence the cultivation of these trees can help regenerate these soils. In alkaline waste lands, mechanical impedance is a major cause of poor root proliferation. This problem could be overcome by planting Prosopis juliflora, which has roots to vertically penetrate a hard pan [103]. Mishra et al. [104] opined that soil erosion can be decreased in alkaline soils with Prosopis juliflora and Casuarina equisetifolia due to the formation of stable soil aggregates in the surface layers. Kaur et al. [105] analyzed the role of agroforestry systems (Acacia, Eucalyptus and Populus along with rice–berseem (Trifolium alexandrinum L.)) to improve soil organic matter, microbial activity and N availability and observed that: (i) microbial biomass C and N were greater by 42% and 13%, respectively, in tree-based systems than mono-cropping; (ii) soil organic C increased by 11%–52% due to integration of trees along with crops after 6–7 years.
In India, many tolerant species for saline soils have been tried since long (Table 21), like: Prosopis juliflora, Salvadorapersica, S. oleoides, Tamarixericoides, T. troupii, Salsolabaryosma etc., successful on sites with ECe > 35 dS m−1, Tamarixarticulata, Acacia farnesiana, Parkinsonia aculeate on sites with moderate salinity (ECe 25–35 dS m−1), Casuarina (glauca, obesa, equiselifolia), Acacia tortilis, A. nilotica, Callistemon lanceolata, Pongamia pinnata, Eucalyptus camaldulensis, Albizia lebbeck on sites with moderate salinity (ECe 15–25 dS m−1), trees like Casuarina cunninghamiana, Eucalyptus tereticornis, Acacia catcechu, A. ampliceps, A. eburnea, A. leucocephala, Dalbergia sissoo, etc. on sites with lower salinity (ECe 10–15 dS m−1).
Table 21. Ameliorative effects of tree plantation on salt affected soils of India.
RegionTree SpeciesSoil Depth (cm)OriginalAfterReferences
pHEC
(dS m−1)
pHEC
(dS m−1)
KarnatakaAcacia nilotica (age 10 years)0–159.23.737.92.05Basavaraja et al. [106]
KarnalEucalyptus tereticornis (age 9 years)0–1010.061.908.020.63Mishra et al. [107]
Lucknow and
Bahraich in north India.
Terminaliaarjuna0–159.60 ± 0.421.47 ± 0.458.40 ± 0.270.31 ± 0.07Singh and Kaur [108]
Prosopisjuliflora8.70 ± 0.330.42 ± 0.06
Tectonagrandis6.15 ± 0.230.06 ± 0.006

4.17. Conservation Agriculture (CA)

Conservation agriculture refers to a set of principles, grounded in sound science that is gradually being adopted globally. The concept includes: (1) causing minimum disturbance to the soil surface by using no- or minimum-tillage; (2) keeping the soil surface covered all the time through practices such as retention of crop residue, mulching, or growing cover crops; (3) adopting crop sequences or rotations that include agroforestry in spatial and temporal scales; and (4) controlled traffic [109]. Collectively these practices lead to an increase in water stable aggregates, greater SOC concentrations, and protection from wind and water erosion. Conservation agriculture-based crop management technologies include zero tillage (ZT) with residue recycling; laser assisted precision land levelling, direct drilling into the residues and direct seeding.
In the Himalayan region, year-round ZT under irrigated rice-wheat system with two irrigations at critical growth stages [110], year-round ZT with integrated nutrient management under an irrigated rice-wheat system [58], and 10-cm stubble retention (under CA) of rice and wheat crops for maximum yield and fodder production [111] are novel technologies (
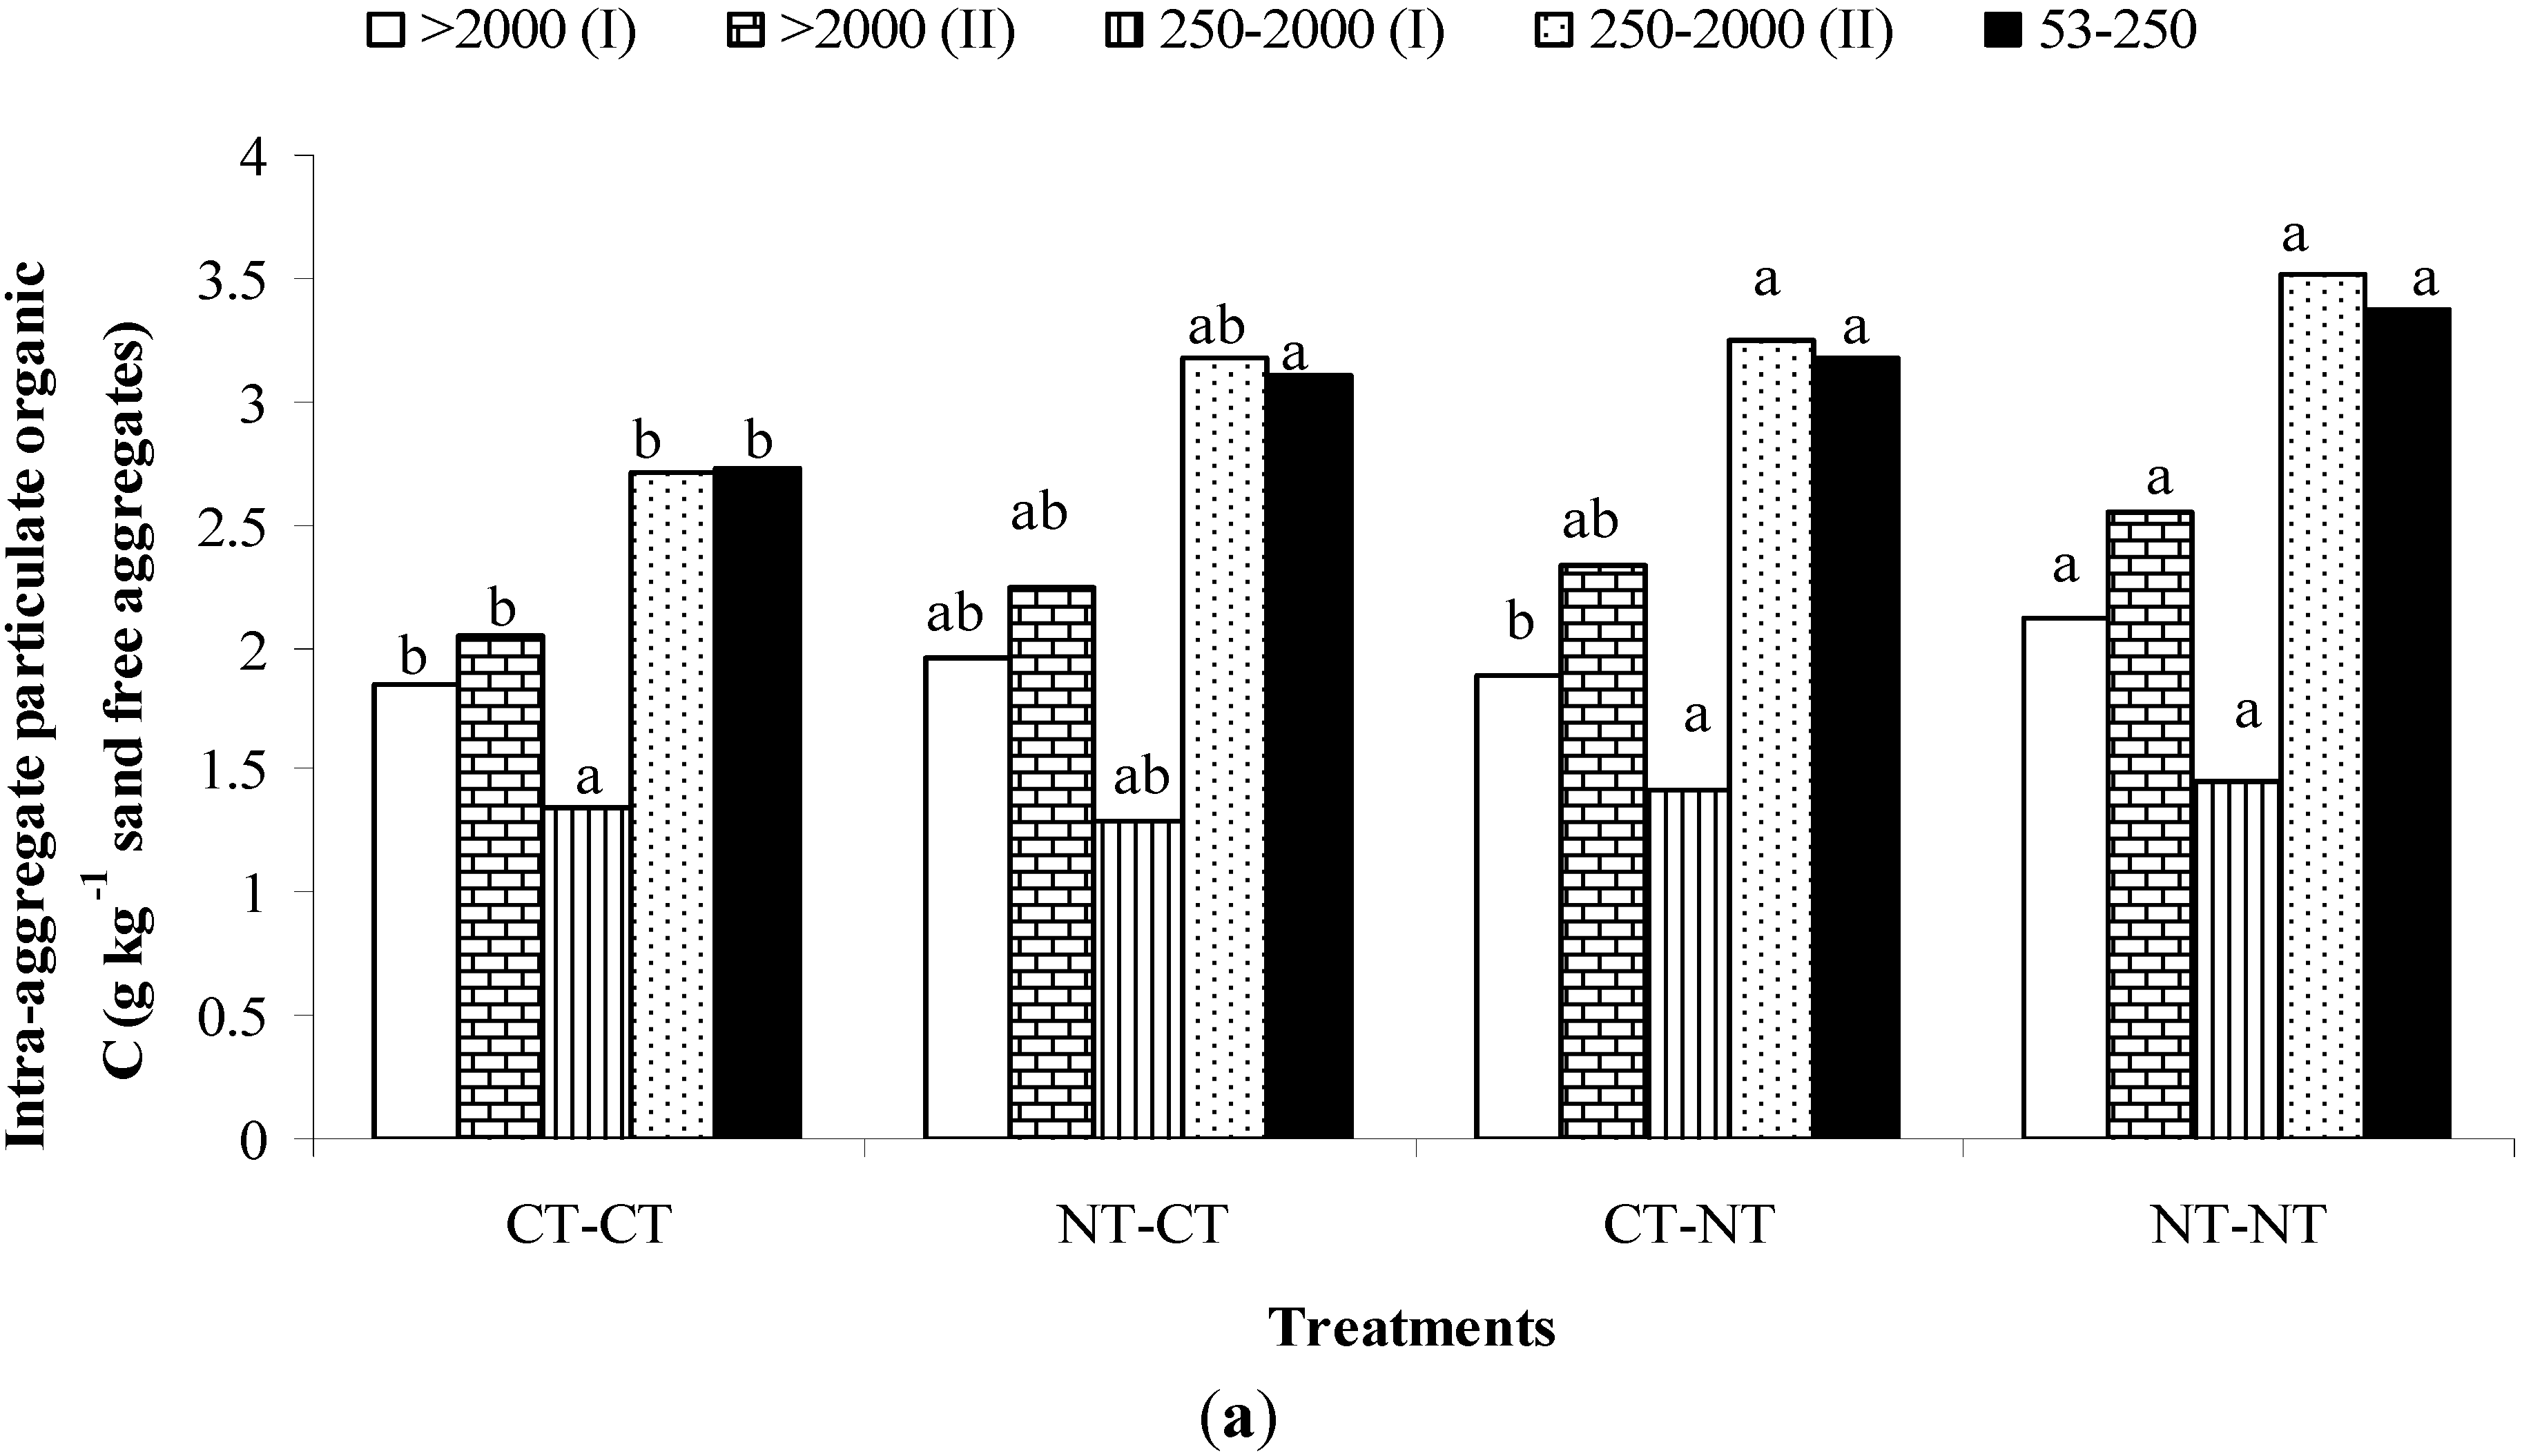
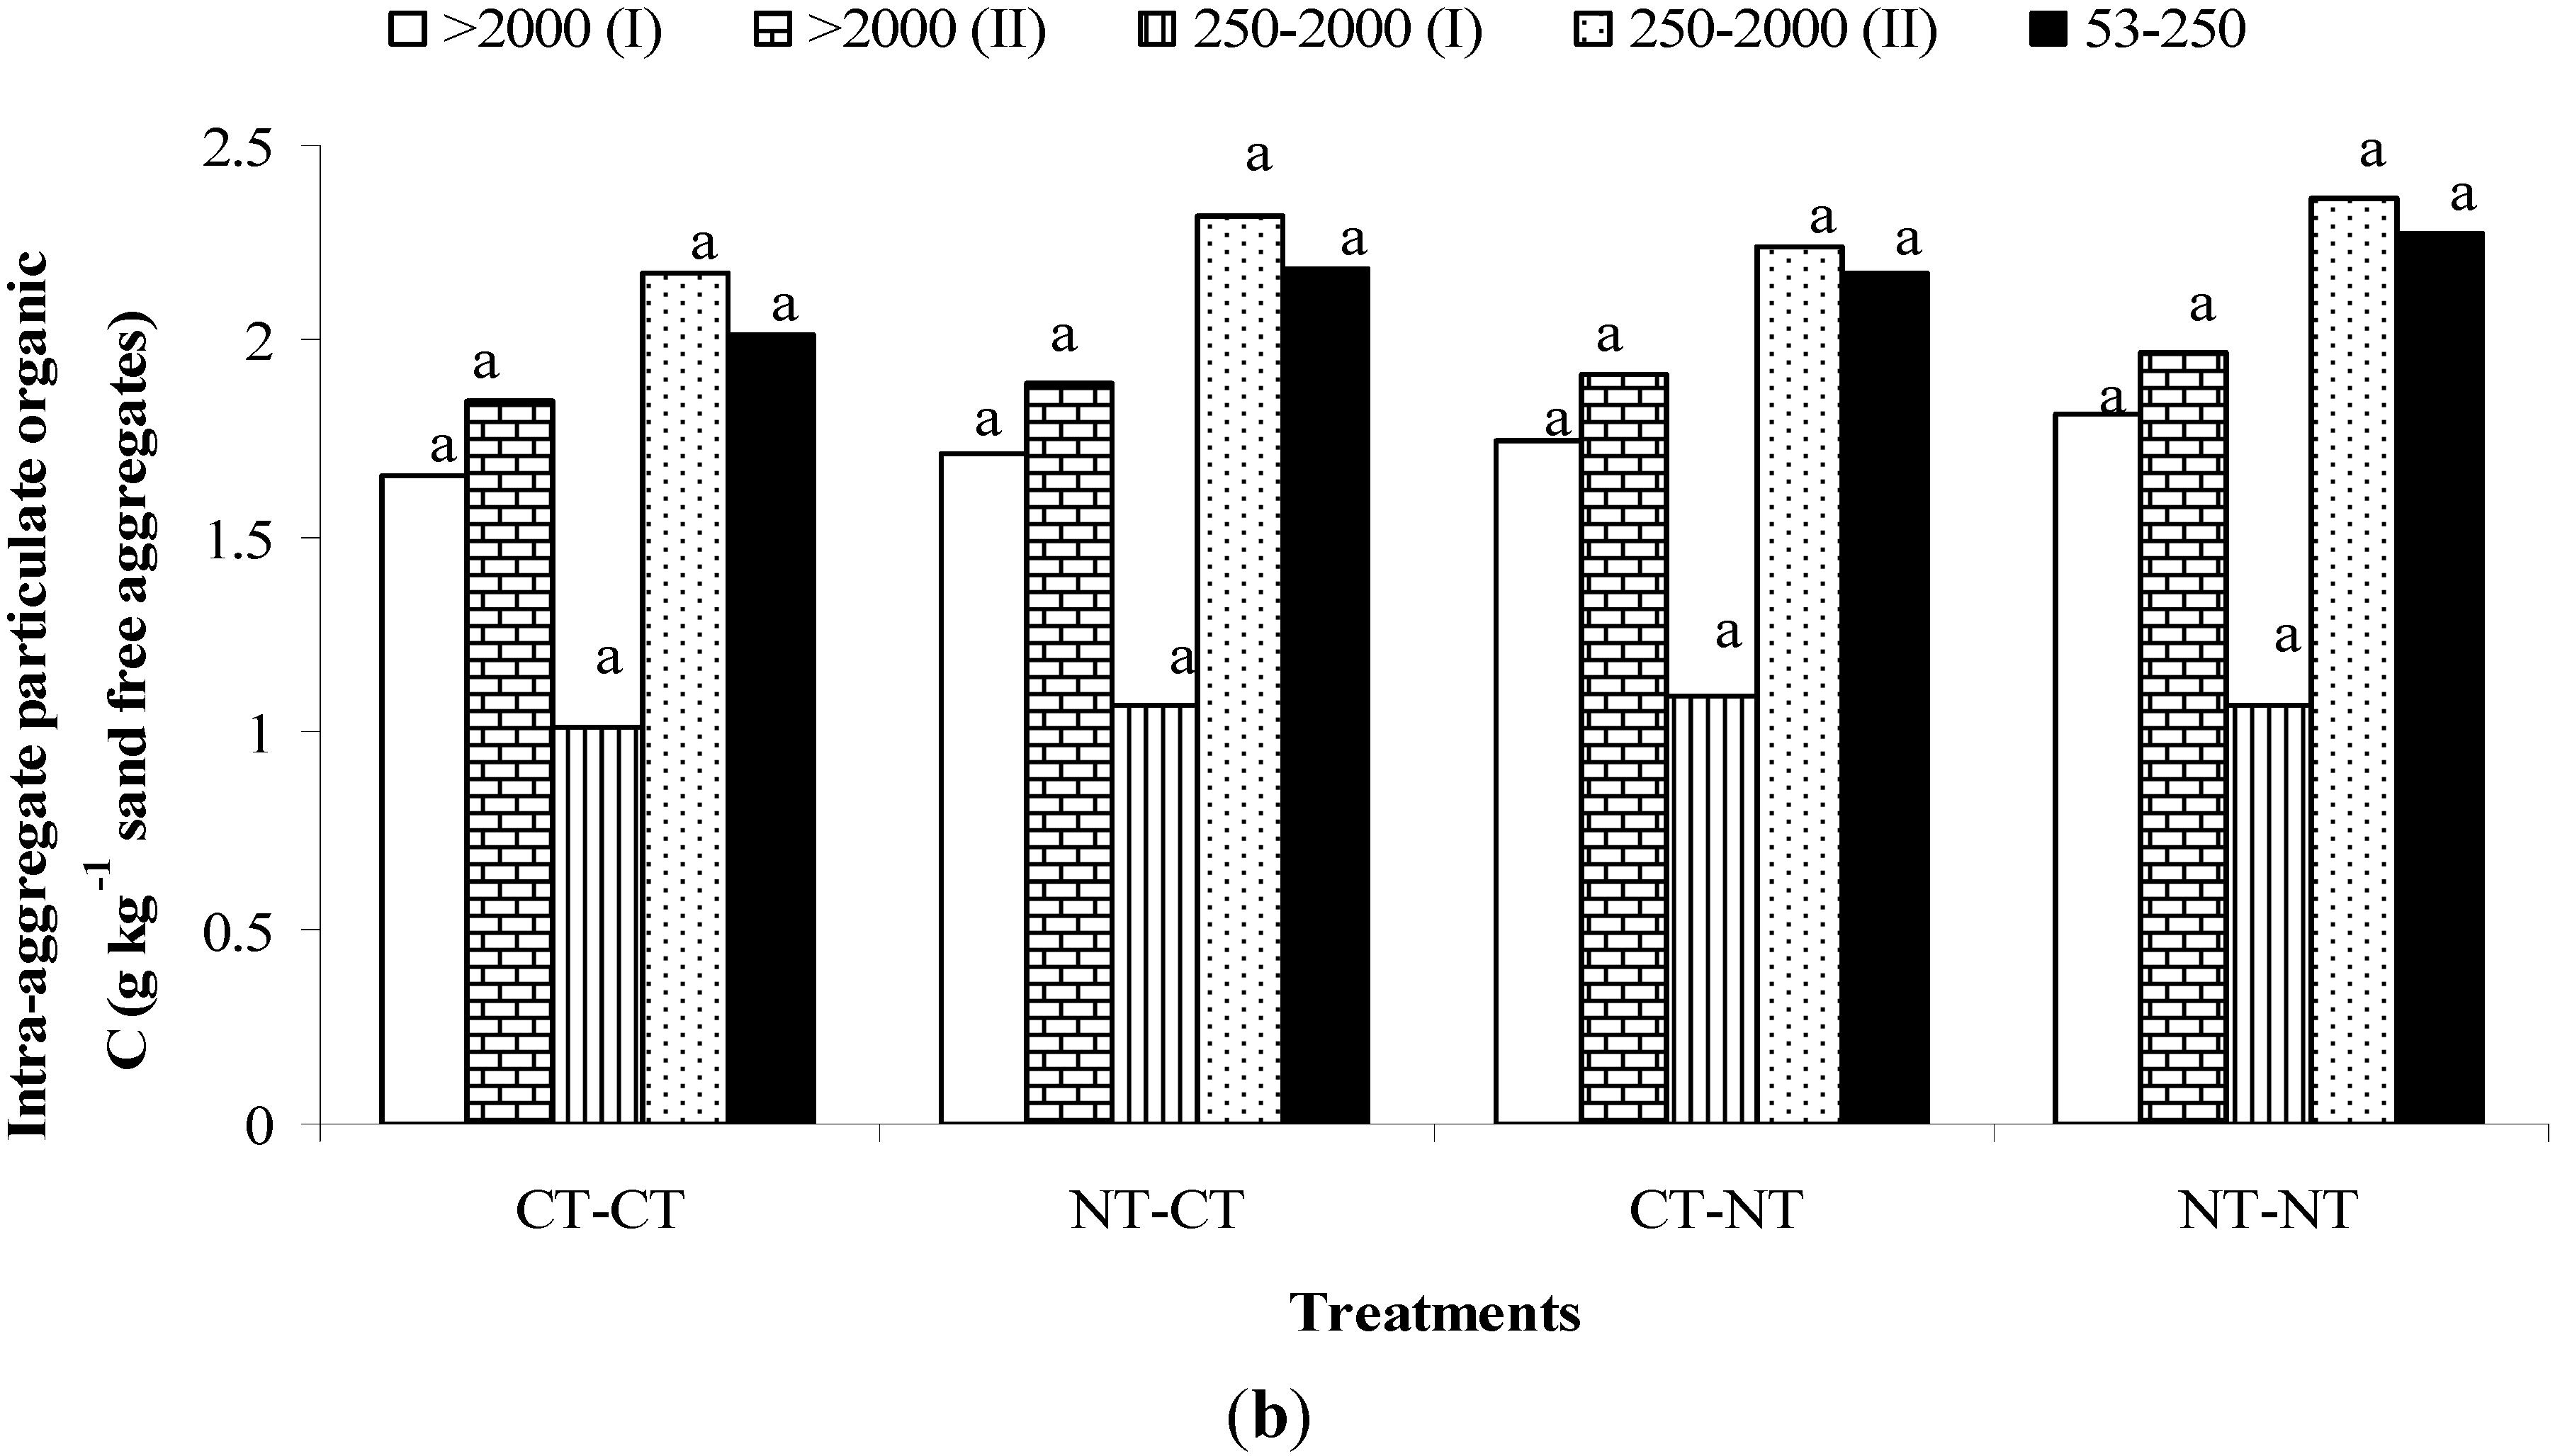
Table 22). Zero tillage enhanced macroaggregate-associated SOC and intra-aggregate particulate organic C under a rainfed finger millet-lentil system (Figure 4), but only in the topsoil [57,58,59]. Plots with minimum tillage (MT; a 50% tillage reduction) improved SOC stock in the 0–15 cm layer, as well as soybean yield. Under direct-seeded rice-wheat systems, adoption of ZT with two irrigations in each crop improved topsoil physical properties and SOC content after four years with similar mean crop yields as with CT using four irrigations [112]. Conservation tillage improved soil aggregate stability and labile C pools in the surface layer, across different cropping systems both under rainfed and irrigated conditions in the Himalayas [57]. Introduction of a legume crop improved C retention in surface soils under conservation tillage even with only short-term adoption.
Table 22. Impacts of conservation tillage practices on carbon retention in the 0–15 cm layer and crop yield change in the Indian Himalayas.
Rainfed Management PracticesDuration of Adoption (year)Carbon Retention over Control/CT(Mg ha−1year−1)Yield Change overYield Change
(Mg ha−1year−1)
Zero tillage-irrigated40.20CT−0.09 * (R) & −0.23 * (W)
Zero tillage-rainfed40.61CT−0.44 (SEY)
SEY = Soybean equivalent yield, R = Rice and W = Wheat. * indicates not significant.
As mentioned earlier, CA has emerged as a new paradigm to achieve goals of sustainable agricultural production in South Asia [113]. Another technology is controlled traffic farming using permanent tram lines. For this system, all equipment on the farm needs a standardized track width. Soil between tram lines has better structure and is free of compaction, while the heavily compacted tramlines provide better trafficability and traction [114]. As a result, tillage cost is decreased and yield increase in the cropping area exceeds the loss of land due to tramlines. In the Indo-Gangetic Plain region, bed planting under CT and ZT generally saves irrigation water [115] and labor requirements without sacrificing crop productivity [116,117].
Figure 4. Intra-aggregate particulate organic matter-carbon (iPOM-C; g kg−1 of sand-free aggregates) in aggregate-size fractions at the (a) 0- to 5-cm and (b) 5- to 15-cm soil layers as affected by tillage practices after six years of rainfed cropping. Bars followed by a similar letter between treatments within an aggregate size class are not significantly different at P < 0.05 level of significance according to Tukey’s HSD mean separation test. “(I)” and “(II)” in legend refer to coarse (250–2000 μm) and fine (53–250 μm) iPOM in the respective aggregate sizes (Source: Bhattacharyya et al. [57]).
Sustainability 07 03528 g004aSustainability 07 03528 g004b
In another study in the region, Das et al. [118] observed that plots under permanent broad bed with 20% cotton residue and 40% wheat residue retention had significantly higher economic profitability and crop productivity than farmers’ practice under a CT cotton-wheat cropping system. In this study, Das et al. [118] concluded that 2-year mean seed cotton yield under ZT permanent broad-bed sowing with residue retention was about 24% and 51% greater compared with ZT narrow-bed sowing without residue retention (2.91 Mg ha−1) and CT (2.59 Mg ha−1), respectively (Table 23). Mean water productivity of the system in the permanent broad bed with residue retention (12.58 kg wheat grain ha−1mm−1) was 12%–48% greater compared with CT, narrow bed with and without residues, broad bed, and ZT plots (Table 24). Net return of the permanent broad bed plots with residue retention was 36% and 13% greater compared with CT and narrow bed plots, but was similar to other treatments. Some of the challenges that follow from continuous ZT practice are management of perennial weeds and strategies to combat yield reduction. Yields of ZT crops are often decreased by 5% to 10% on sandy loam soils of India compared with under CT in the initial years [119].
Table 23. Productivity (Mg ha−1) of cotton, wheat and system productivity (Mg ha−1) in terms of wheat equivalent yield (WEY) as affected by tillage, bed planting and residue management practices in the western Indo-Gangetic Plains (Data source: Das et al. [118]).
Treatments *2010–20112011–20122012–2013
Seed Cotton YieldWheat Grain YieldSystem Productivity (WEY)Seed Cotton YieldWheat Grain YieldSystem Productivity
(WEY)
Seed Cotton YieldWheat Grain YieldSystem Productivity
(WEY)
CT2.44 c4.85 a10.30 b2.73 c4.29 b11.16 c2.70 c4.46 b12.25 b
PNB2.71 bc4.55 a10.60 b3.10 bc4.37 b12.17 bc3.08 ab4.83 ab13.72 ab
PNB + R2.96 b4.61 a11.23 ab3.33 b4.60 ab12.97 b3.38 a4.98 a14.74 a
PBB3.13 ab4.82 a11.81 ab3.42 ab4.19 bc12.80 b3.11 ab4.75 ab13.72 ab
PBB + R3.28 a4.85 a12.16 a3.93 a4.77 a14.67 a3.46 a4.89 a14.88 a
ZT + R---4.00 a4.44 ab14.50 a3.21 ab4.73 ab13.99 ab
ZT---3.95 a4.00 c13.93 ab3.02 bc4.63 ab13.35 ab
* Means followed by a similar lowercase letter within a column are not significantly different (at P < 0.05) according to Tukey’s HSD Test. ZT = Zero tillage; CT = Conventional tillage; ZT + R = Zero tillage + residue retention; PNB = Permanent narrow bed; PBB = Permanent broad bed; PNB+R = Permanent narrow bed + residue retention; PBB + R = Permanent broad bed + residue retention.
Table 24. Impacts of tillage, bed planting and residue management practices on water productivity (kg wheat grain/ha.mm) under the cotton-wheat system (Source: Das et al. [118]).
Treatments *2011–20122012–2013
Total Water Applied in the System (mm)System Water ProductivityTotal Water Applied in the System (mm)System Water Productivity
CT14178.65 d13318.38 d
PNB129710.58 b120810.07 c
PNB + R128210.50 bc118110.98 bc
PBB126010.89 b116011.03 bc
PBB + R122212.18 a113012.98 a
ZT + R131210.66 b124711.62 b
ZT13879.62 c131010.63 bc
Means followed by a similar lowercase letter within a column are not significantly different (at P < 0.05) according to Tukey’s HSD Test. ZT = Zero tillage; CT = Conventional tillage; ZT + R = Zero tillage + residue retention; PNB = Permanent narrow bed; PBB = Permanent broad bed; PNB+R = Permanent narrow bed + residue retention; PBB + R = Permanent broad bed + residue retention.
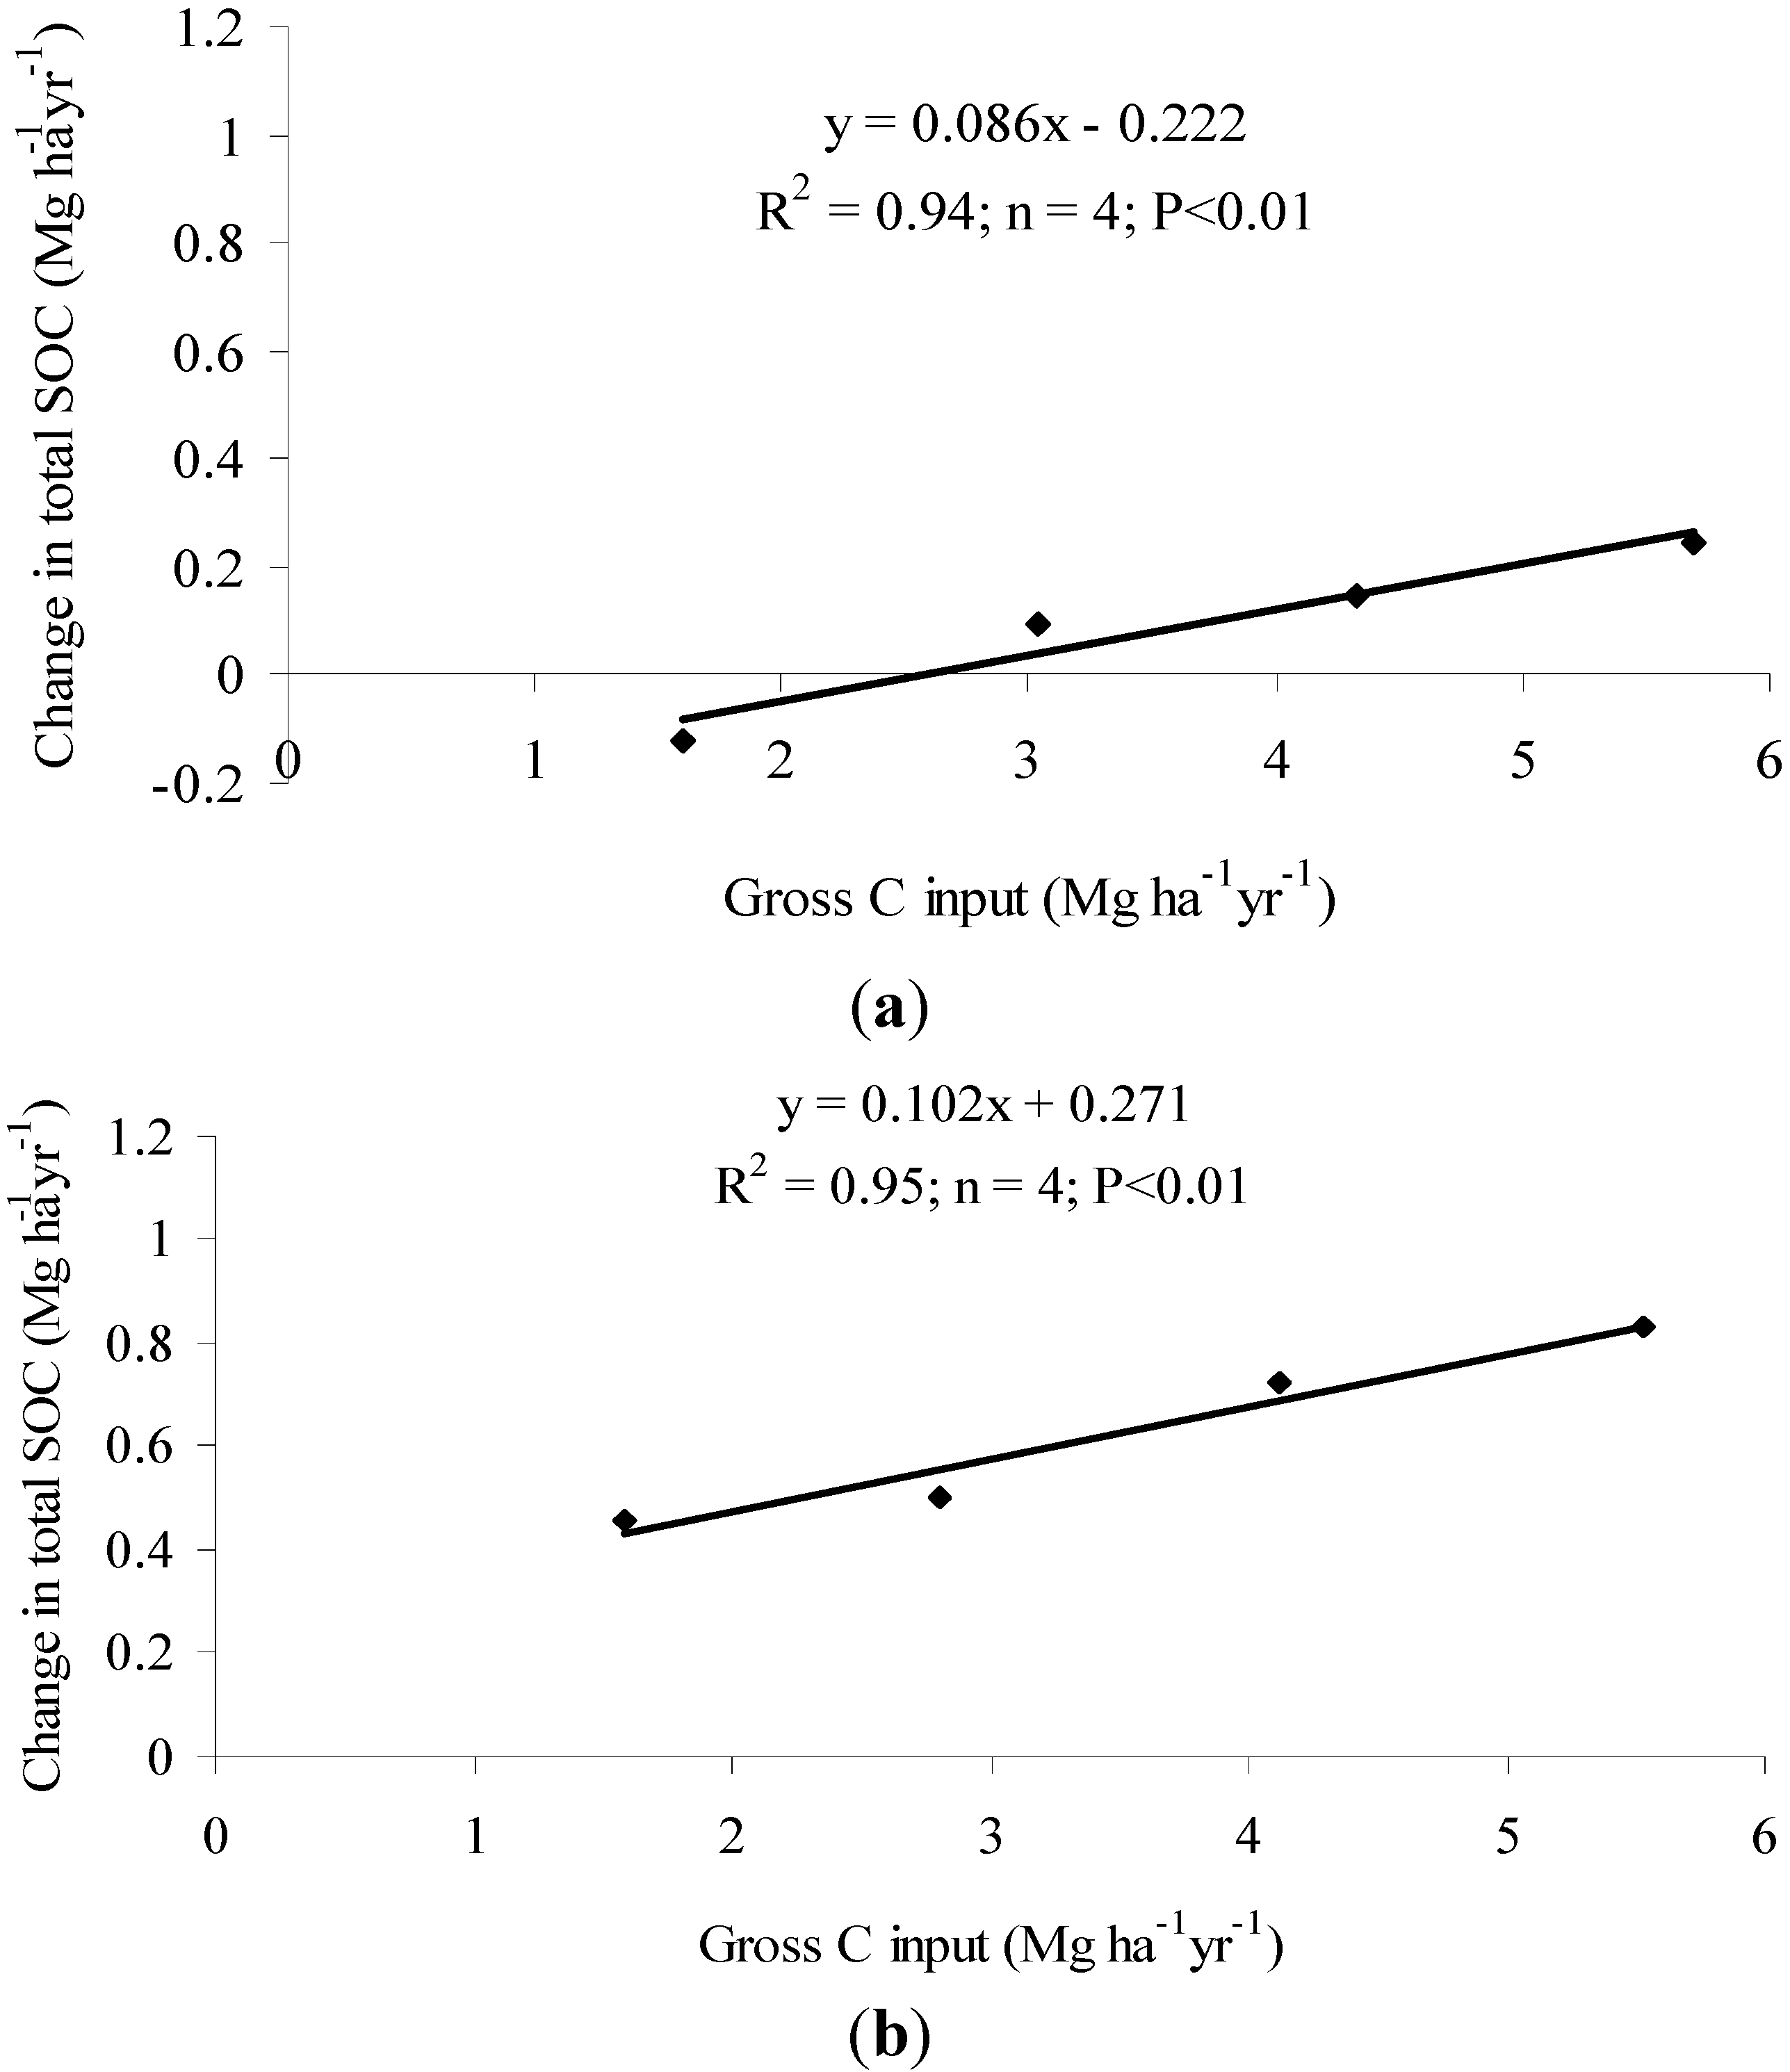
Unlike conventional farming methods, CA minimizes soil disturbance and recycles crop residues. Soil bulk density may be decreased, soil aggregation may be improved, and SOC may increase to reverse land degradation with CA. Specific results from four years of wheat-based cropping system in the western Indo-Gangetic Plains indicate that ZT had higher C retention potential than CT in the 0–30 cm soil layer with 8.6% and 10.2% of the gross C input retained under CT and ZT, respectively (Figure 5; Das et al. [120]).
Figure 5. Total soil organic C (SOC) retention potential of residue management practices under (a) conventional tillage and (b) zero tillage under a wheat based cropping system in the Indo-Gangetic Plains (Source: Das et al. [120]).
Sustainability 07 03528 g005
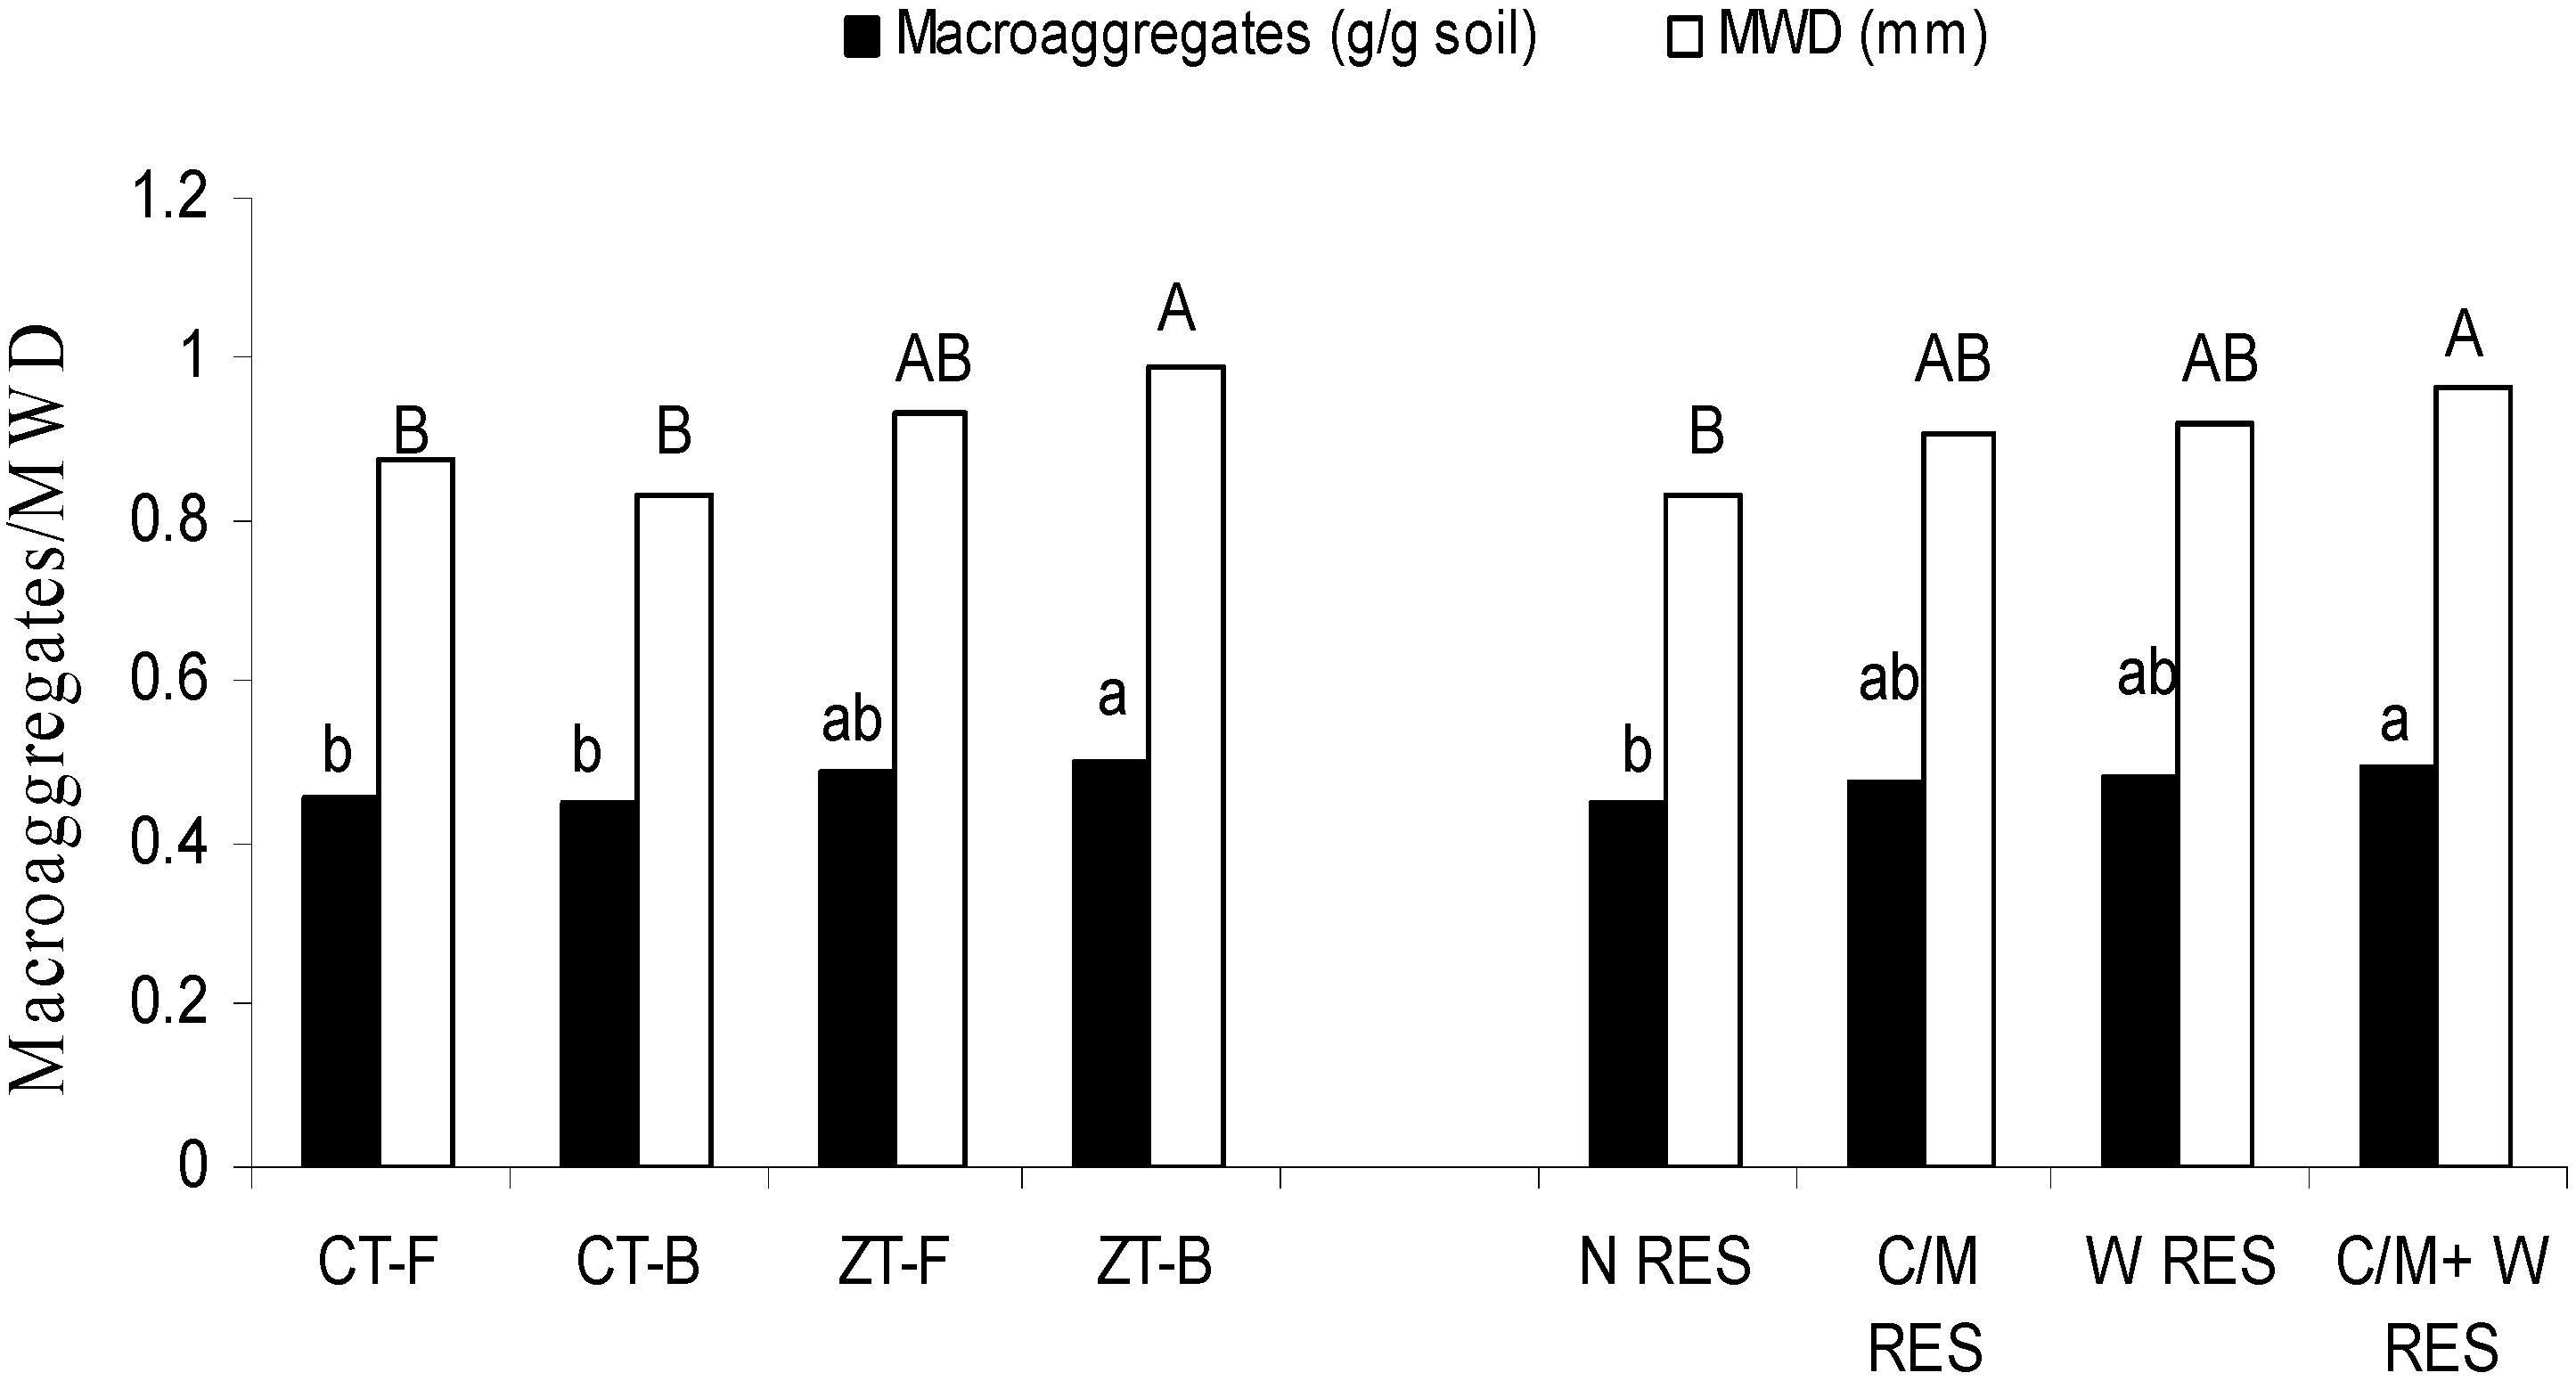
In another study in the Indo-Gangetic Plains, topsoil under ZT with bed planting had greater concentration of macroaggregates (0.25–8 mm) and mean weight diameter with a concomitant lower silt + clay sized particles than under CT with bed planting and CT with flat planting after 4 years. Soil with both cotton/maize and wheat residue retention had greater macroaggregate concentration and mean weight diameter and similar bulk density than with residue removal (Figure 6). Soil aggregation is improved with larger aggregates and greater mean weight diameter [110].
Conservation agriculture has the potential to decrease sub-surface compaction and improve least limiting water range [121]. During the third year of a study at New Delhi, soil penetration resistance exceeded 2 MPa in the 15–30 cm soil layer beneath puddled and transplanted rice in rotation with wheat under CT, but under direct seeded rice with brown manuring and ZT penetration resistance values were <1.5 MPa throughout the 0–60 cm profile. Soil bulk density was lower under the ZT system than under the CT system in the 0–30 cm soil layer (Table 25). Retaining crop residues with permanent broad beds had significantly lower penetration resistance than with permanent narrow-beds with residue and other tillage and residuce management in a cotton-wheat system [121]. Retaining crop residue resulted in lower BD values in the 15–30 cm soil layer under the cotton-wheat system than removing them (Table 26). Retaining crop resicue also had ~12% higher least limiting water range than with CT (10.1%) in the 15–30 cm layer. In the 0–15 cm soil layer, retaining residues under ZT, permanent broad beds, and permanent narrow beds had 13%, 24% and 11% higher mean least limiting water range, respectively, than the same tillage systems without residue retention. This indicates that ZT without residue addition had deleterious impact on soil water availability and structural property and should be avoided. Overall, among the treatments, PBB + R and DSR + BM-ZTW were the best management practices for improved soil physical environment under cotton-wheat and rice-wheat systems, respectively, and therefore should be adopted.
Figure 6. Impacts of conservation agriculture (CA) on soil aggregation in the 0–5 cm layer in the upper IGP (Source: Bhattacharyya et al. [110]).
Sustainability 07 03528 g006
Table 25. Soil bulk density of plots with different conservation agricultural practices in the rice–wheat system (Source: Mishra et al. [121]).
Bulk Density (Mean of Two Sampling Events) during Rice (Mg m−3 )
Conservation Agricultural Practices0–15 cm15–30 cm30–45 cm
PTR − CTW1.45 b1.70 a1.72 a
DSR + BM − ZTW1.47 ab1.63 b1.70 a
DSR − ZTW1.50 a1.64 ab1.72 a
PTR − CTW = Puddled transplanted rice-conventionally tilled wheat; DSR − ZTW = Direct seeded rice-zero tilled wheat and DSR + BM − ZTW = Direct seeded rice + Brown manuring-zero tilled wheat; Means with similar lowercase letters within a soil depth and crop growth period are not significant at P < 0.05 according to Tukey’s HSD test.
Adoption of CA, as a complete package, is one of the major strategies for increasing SOC stock. Although crop residue incorporation initially leads to immobilization of inorganic N, addition of 15–20 kg N ha−1 with straw incorporation eventually increases yield of rice and wheat. Incorporation/retention of rice residue in the soil returns essential organic C and N back to the field to favorably impact soil structural status. Surface residue placement had greater C retention than residue incorporation in a maize-wheat-greengram cropping system [120]. Zero tillage in particular can complicate manure application and may also contribute to nutrient stratification within the soil profile from repeated surface applications without mechanical incorporation. Conservation agriculture has tremendous potential to improve water use efficiency of crops and decrease water loss. If CA could be adopted on half of Haryana’s rice-wheat area, the practice would decrease diesel use by 17.4 million liters per year. Using a conversion factor of 2.6 kg CO2 per liter of diesel burned, this would represent a reduction of more than 25,000 tons each year in CO2 emissions [116]. Because ZT takes immediate advantage of residual moisture from the previous rice crop, as well as cutting down on subsequent irrigation, water use is decreased by about 10 cm-hectares, or approximately 1 million liters ha−1year−1.
Table 26. Soil bulk density of plots with different conservation agricultural practices in the cotton-wheat system during crop growth period (Source: Mishra et al. [121]).
Bulk Density (Mean of Four Sampling Events in Two Years) during Cotton (Mg m−3)
Conservation Agricultural Practices0–15 cm15–30 cm30–45 cm
CT1.52 bc 1.65 ab 1.70 a
PNB1.48 c 1.62 b 1.71 a
PBB1.50 c1.63 b1.70 a
ZT1.63 a1.68 a 1.70 a
PNB + R1.43 d1.56 c1.70 a
PBB + R1.44 d1.57 c 1.69 a
ZT + R1.57 b 1.60 bc 1.70 a
Means with similar lowercase letters within a crop growth period are not significantly different at P < 0.05. CT = conventional tillage; PNB = Permanent narrow bed; PNB + R = Permanent narrow bed + residue retention; PBB = Permanent broad bed; PBB + R = Permanent broad bed + residue retention; ZT = Zero tillage; ZT + R = Zero tillage + residue retention
With greater aggregation due to fewer disturbances by tillage operations and addition of surface residues, total pore space in soil under CA increases. In a study from central India, CA generally improved water retention properties of soil through its effect on pore size distribution and soil structure. Volumetric soil water retention of the surface 0–15 cm soil was greater in ZT and decreased tillage systems than in CT (Table 27). Similarly at permanent wilting point, CA treatments retained more water than with CT. Difference in water storage between tillage treatments was less at permanent wilting point (2.5%) than at field capacity (4.2%). Conservation agriculture increased soil-water retention more at lower suctions due to increase in micro-pores and inter-aggregate pores caused by enhanced SOC content and higher activity of soil fauna e.g., earthworms and termites. At higher tensions close to permanent wilting point (1.5 MPa), nearly all pores were filled with air and surface area and thickness of water films on soil particle surfaces determined moisture retention. Following addition of organic matter, specific surface area of soils increased resulting in increased water holding capacity at higher tensions [122].
Table 27. Effect of different tillage systems on soil water retention of Vertisols (Source: Hati et al. [122]).
TillageSoil Water Retention (%) (v/v)
Field Capacity (0.033 MPa)Permanent Wilting Point (1.5 MPa)Available Water Capacity
Conventional Tillage33.522.610.9
Mouldboard tillage35.424.710.7
Reduced Tillage36.524.611.9
No Tillage37.7 a25.112.6
LSD (P = 0.05)2.42.1NS
Despite many benefits of CA practices as mentioned above, the adoption rate in India is very low. Farmers prefer to follow a partial adoption of CA practices, i.e., transplanted rice in puddled soil in the Kharif season and CA (ZT with residue retention) for wheat in the Rabi season due to several factors, including (i) poor germination and low crop productivity under direct seeded rice, because puddling and waterlogged condition helps to reduce soil pH in alkaline soils and thus improve soil chemical health during the rice growing season; (ii) availability of rain and irrigation water for raising a good rice crop under puddled condition; and (iii) less care is needed for transplanted rice in puddled soil compared with direct seeding. Some farmers even grow CT maize/jowar in the Kharif season (for better weed control, aeration and reduction in surface compactness/crusting) and raise wheat under CA in the Rabi season. However, repeated puddling aggravates other problems like soil compaction, development of salt affected soils and decline in water table in the area (due to high evaporative demand in this climate). Looking at these facts and due to constant efforts by several institutions, some farmers of the district have started adopting full or complete CA (i.e., direct-seeded rice followed by ZT wheat), but the duration of adoption is less than 3–4 years.
In drylands, Jat et al. [123] opined that the major constraints to the use of CA include insufficient amounts of residues due to water shortage and degraded nature of soil resource, competing uses of crop residues, resource poor smallholder farmers, and lack of in-depth research. Even then, CA holds considerable promise in the arid region, because it can control soil erosion by wind and water, reduce compaction and crusting. Due to limited production of biomass, competing uses of crop residues and shortage of firewood, farmers often find it hard to use crop residues to cover soil surface in dryland eco-systems, where only a single crop is grown in a year. With CA (soil cover with crop residues), it is sometimes possible to grow a second crop with residual soil moisture in the profile. It is, however, better to use the chopped biomass of semi-hard woody perennial plants instead of crop residues to cover the soil surface [37].

4.18. Intensive Cropping, Diversified Cropping and Integrated Farming Systems

There is already a greater emphasis on crop diversification due to growing concerns about the unsustainability of the rice–wheat system throughout the Indo-Gangetic Plains. The water requirement for rice is about 80% greater than for other crops. Growing non-rice crops in some areas and summer cropping with legumes such as green gram, cowpea (Vigna unguiculata L.) or dhaincha (Sesbania sp.) are essential for conserving resources and improving productivity. In Punjab, Haryana and Rajasthan, >95% of the area of rice, as well as a large portion of wheat, is under irrigation. Water use efficiency could be greatly increased with cover crops or growing of non-rice based cropping systems. Productivity of waterlogged soils in the eastern Indo-Gangetic Plains could be increased by practicing a raised-sunken bed system. Soybean can be grown on raised beds, while paddy rice can be grown in sunken beds during the rainy season. Productivity of rice fallows in eastern India could be increased by growing rabi legumes on raised beds and wheat in sunken beds.
In a study to develop sustainable agricultural intensification with CA in an alkaline soil in Karnal, Gathala et al. [124] compared four novel scenarios. Maize under ZT was as productive and almost as profitable as rice during the rainy (kharif) season, while using 90%–95% and 88%–91% less irrigation water than puddle transplanted rice and ZT rice, respectively (Table 28). Maize can therefore be an alternative to rice in areas with extreme labor and water scarcity. Avoiding puddling and use of ZT (for rice or maize) with full residue retention increased profitability and yield of the succeeding wheat crop each year (by 0.5 to 1.2 ton ha−1) than farmers’ practice. Inclusion of green gram in the cropping system resulted in greater system productivity and profitability than without green gram.
Table 28. Drivers of agricultural change, crop rotation, tillage, crop establishment method and residue management of the four scenarios as studied by Gathala et al. [124].
Scenario Crop RotationTillageCrop EstablishmentResidue Management
Farmers’ practice; S1Rice–WheatCT-CT *Transplanted–BroadcastedRemoval
To deal with increasing food demand; S2 Rice–Wheat–Green gramCT-ZT-ZTTransplanted−
ZT-ZT
Anchored–Removal–Incorporation
To deal with rising scarcity of labor, water and energy and degrading soil health (CA based); S3Rice–Wheat–Green gramZT-ZT-ZTDirect DrillingRetention–Anchored–Retention
Futuristic intensified and diversified cropping system (CA based); S4Maize–Wheat–Green gramZT-ZT-ZTDirect Drilling /PlantingRetention–Anchored–Retention
* CA—Conservation agriculture, CT—Conventional tillage, ZT—Zero tillage.
In India, 65% of farming households are considered marginal in sustainability (<1 ha). These farms comprise nearly 400 million people and nearly 40% of them are vulnerable, marginalized and food insecure. Hence, integrated farming systems have emerged as a well-accepted, single window, and sound strategy for harmonizing simultaneously joint management of land, water, vegetation, livestock, and human resources. The goals of integrated farming systems are to meet soils’ productive potential and reduce risks of environmental degradation. By including tree crops with a high quality of leaf litter and root binding ability, erodibility from rainfall/runoff can be reduced and physico-chemical conditions improve. Soil health can be managed and sustained through organic inputs.

4.19. Disaster (Tsunami) Management

The following management aspects are important in case of a tsunami: (i) traditional disaster detection systems should be integrated with current scientific techniques; (ii) early warning systems need to be installed in coastal regions; (iii) protection against tsunamis can be achieved through construction of sea walls, beach defenses, tree plantations, and making buffer zones like raised land masses and forests; (iv) awareness about tsunamis and their impact in coastal areas has to be created not only among the public but also among officials; and (v) enforcement of by-laws and ‘Coastal Regulation Zone Norms’ should be strictly implemented to minimize tsunami damage. A tsunami early warning system for the Indian Ocean was installed. The Indian Ocean Tsunami Warning System was agreed to in a United Nations conference.

5. Conclusions

Appropriate mitigation strategies of the nearly 147 Mha of existing degraded land in the sub-continent of India are of the utmost importance. With changing climate, land degradation is expected to only increase due to high intensity storms, extensive dry spells, and denudation of forest cover. Combating further land degradation and investing in soil conservation is a major task involving promotion of sustainable development and nature conservation. An integrated watershed approach should be given maximum attention to combat land degradation and environmental problems particularly in fragile areas. Sustainable agricultural intensification using innovative farming practices have tremendous potential of increasing productivity and conserving natural resources, particularly by sequestering SOC (both labile and recalcitrant) and improving soil quality. Conservation agriculture (CA) coupled with other technologies like micro-irrigation, fertigation, and management of problem soils using specific and necessary technologies hold great promise to increase productivity of crops and fruits and reverse soil degradation. Novel CA practices include: permanent broad bed with residue retention under maize/cotton/pigeon pea-wheat cropping systems and seasonal tillage alterations under rainfed and rice-based agro-ecosystems. These practices need to be evaluated in micro-environments of different agro-climatic regions with different farming practices for wider adaptability on a watershed basis. For sure, the non-edible (to animals) agricultural residues must not be burnt and should be used for mulching along with growing of cover crops, preferably legumes. Improved grazing practices, irrigation management, control on urban sprawl and control and management on mining are a few other solutions for preventing land degradation. Domestic and municipal wastes, sludges, pesticides, industrial wastes, etc. need to be used if possible to close nutrient cycles, but with caution to avoid the possibility of soil pollution. Future research should focus on enhancing nutrient and water use efficiencies and reduction in the pesticide use under CA.
For promotion of CA practices across diverse agro-ecologies, appropriate policy and institutional and technology support would be a prerequisite. Suitable economic incentives should be given to internalize land degradation wherever feasible. Many CA practices like rainwater harvesting through farm pond renovation or construction and its recycling are both capital and labor-intensive, which resource-poor farmers in rainfed areas may not be able to afford and hence need to be supported. Initial incentives, to procure appropriate machinery and to offset any economic loss due to residue retention or production loss, are also important to motivate irrigated farmers to follow CA. Involvement is needed of local communities at every stage in the implementation of resource conserving technologies, judicious irrigation water management, wasteland reclamation, watershed development, and afforestation. A well-defined integrated land use policy to include rural fuelwood and fodder grazing is urgently needed at the implementation level to guide sustainable management of land and forest with a scientific backing. Finally, another critical challenge is controlling fragmentation of land holdings. This could be achieved by providing security of land rights and land tenure and encouraging the efficient use of marginal lands.

Acknowledgments

The authors are grateful to the anonymous reviewer and the Guest Editor for their valuable and editing comments.

Author Contributions

Ranjan Bhattacharyya and Alan Joseph Franzluebbers conceived and designed the whole review work based on invitation from the Guest Editor. Ranjan Bhattacharyya, Birendra Nath Ghosh, Prasanta Kumar Mishra, Biswapati Mandal, ChSrinivasa Rao, Dibyendu Sarkar, Krishnendu Das, Kokkuvayil Sankaranarayanan Anil, Manickam Lalitha, Kuntal Mouli Hati wrote the paper. Alan Joseph Franzluebbers and Ranjan Bhattacharyya edited the manuscript.

Conflicts of Interest

The authors declare no conflict of interest.

Supplementary Materials

Supplementary materials can be accessed at: https://www.mdpi.com/2071-1050/7/4/3528/s1.

References

  1. National Bureau of Soil Survey & Land Use Planning (NBSS&LUP). Soil Map (1:1 Million Scale); NBSS&LUP: Nagpur, India, 2004. [Google Scholar]
  2. Dhruvanarayan, V.V.N.; Ram, B. Estimation of soil erosion in India. J. Irrig. Drain. Eng. 1983, 109, 419–434. [Google Scholar] [CrossRef]
  3. NCA. Report of the National Commission on Agriculture. National Commission of Agriculture; Government of India: New Delhi, India, 1976; pp. 427–472.
  4. MoA. Indian Agriculture in Brief, 17th ed.Directorate of Economics and Statistics, Ministry of Agriculture, Department of Agriculture and Cooperation, Ministry of Agriculture and irrigation, Government of India: New Delhi, India, 1978.
  5. Vohra, B.B. A Policy for Land and Water; Department of Environment, Government of India: New Delhi, India, 1980; Volume 18, pp. 64–70.
  6. NWDB. Ministry of Environment and Forests, National Wasteland Development Board Guidelines for Action; Government of India: New Delhi, India, 1985.
  7. Bhumbla, D.R.; Khare, A. Estimate of Wastelands in India. Society for Promotion of Wastelands Development; Allied: New Delhi, India, 1984; p. 18. [Google Scholar]
  8. NRSA. Waste Land Atlas of India; Government of India Balanagar: Hyderabad, India, 2000.
  9. MoA. Indian Agriculture in Brief, 20th ed.Directorate of Economics and Statistics, Ministry of Agriculture, Department of Agriculture and Cooperation, Ministry of Agriculture, Goverment of India: New Delhi, India, 1985.
  10. MoA. Indian Agriculture in Brief, 25th ed.Directorate of Economics and Statistics, Ministry of Agriculture, Department of Agriculture and Cooperation, Goverment of India: New Delhi, India, 1994.
  11. National Bureau of Soil Survey and Land Use Planning (NBSS&LUP). Global Assessment of Soil Degradation (GLASOD) Guidelines; NBSS&LUP: Nagpur, India, 1994. [Google Scholar]
  12. National Bureau of Soil Survey and Land Use Planning (NBSS&LUP). Annual Report 2005, Nagpur; NBSS&LUP: Nagpur, India, 2005. [Google Scholar]
  13. Joshi, P.K.; Agnihotri, A.K. An Assessment of the Adverse Effects of Canal Irrigation in India. Ind. J. Agric. Ecol. 1984, 39, 528–536. [Google Scholar]
  14. Parikh, K.; Ghosh, U. Natural Resource Accounting for Soil: Towards and Empirical Estimate of Costs of Soil Degradation for India’; Discussion Paper No. 1995, 48; Indira Gandhi Institute of Development Research, IDEAS: Mumbai, India, 1995. [Google Scholar]
  15. Joshi, P.K.; Wani, S.P.; Chopde, V.K.; Foster, J. Farmers Perception of Land Degradation: A Case Study. Econ. Polit. Wkly. 1996, 31, A89–A92. [Google Scholar]
  16. Srinivasarao, C.H.; Venkateswarlu, B.; Lal, R.; Singh, A.K.; Sumanta, K. Sustainable management of soils of dry land ecosystems for enhancing agronomic productivity and sequestering carbon. Adv. Agron. 2013, 121, 253–329. [Google Scholar]
  17. Reddy, V.R. Land degradation in India: Extent, costs and determinants. Econ. Polit. Wkly. 2003, 38, 4700–4713. [Google Scholar]
  18. Sharda, V.N.; Dogra, P.; Prakash, C. Assessment of production losses due to water erosion in rainfed areas of India. Indian J. Soil Water Conserv. 2010, 65, 79–91. [Google Scholar] [CrossRef]
  19. NRSA. National Remote Sensing Agency, IRS-Utilisation Programme: Soil Erosion Mapping; Project Report National Remote Sensing Agency: Hyderabad, India, 1990. [Google Scholar]
  20. ARPU. Agro-Climatic Regional Planning: An Overview; Agro-Climatic Regional Planning Unit: New Delhi, India, 1990. [Google Scholar]
  21. Sehgal, J.; Abrol, I.P. Soil Degradation in India: Status and Impact; Oxford and IBH: New Delhi, India, 1994; p. 80. [Google Scholar]
  22. Sahay, K.B. Problems of livestock population. Available online: http://www.tribuneindia.com/2000/20000411/edit.htm (accessed on 20 March 2015).
  23. Sharma, K.D. Assessing the impact of overgrazing on soil erosion in arid regions at a range of spatial scales. Human impact on erosion and sedimentation. In Proceedings of the International Symposium of the Fifth Scientific Assembly of the International Association of Hydrological Sciences (IAHS), Rabat, Morocco, 23 April–3 May 1997; pp. 119–123.
  24. MoEF. National Forestry Action Programme of the Ministry of Environment and Forests; Goverment of India: New Delhi, India, 1999; Volume 1, p. 79.
  25. Sahu, H.B.; Dash, S. Land degradation due to Mining in India and its mitigation measures. In Proceedings of the Second International Conference on Environmental Science and Technology, Singapore, 26–28 February 2011.
  26. Anon. Dirty Metal, Mining Communities and Environment, Earthworks; Oxfam America: Washington, WA, USA, 2006; p. 4. [Google Scholar]
  27. Mythili, M. Intensive Agriculture and Its Impact on Land Degradation. 2013. Available online: http://coe.mse.ac.in/pdfs/coebreifs/Mythili.pdf (accessed on 13 October 2014).
  28. FAO. Land Degradation in South India; Its Severity, Causes and Effects on People; World Soil Resources Report; Food and Agriculture Organization: Rome, Italy, 1994; Volume 78, p. 100. [Google Scholar]
  29. Barman, D.; Sangar, C.; Mandal, P.; Bhattacharjee, R.; Nandita, R. Land degradation: Its Control, Management and Environmental Benefits of Management in Reference to Agriculture and Aquaculture. Environ. Ecol. 2013, 31, 1095–1103. [Google Scholar]
  30. Royal Commission on Agriculture in India Report; Agricole Publishing Academy: New Delhi, India, 1928; pp. 75–76.
  31. Maheswarappa, H.P.; Nanjappa, H.V.; Hegde, M.R.; Biddappa, C.C. Nutrient content and uptake by galangal (Kaempferia galanga L.) as influenced by agronomic practices as intercrop in coconut (Cocos nucifera L.) garden. J. Spices Arom. Crops 2011, 9, 65–68. [Google Scholar]
  32. Tandon, H.L.S. Assessment of Soil Nutrient Depletion. In Proceedings of the FADINAP Regional Seminar on Fertilization and the Environment, Chiangmai, Thailand, 7–11 September 1992.
  33. Tandon, H.L.S. Fertilizers in Indian Agriculture—From 20th to 21st Century; FDCO: New Delhi, India, 2004; p. 240. [Google Scholar]
  34. Prasad, R.N.; Biswas, P.P. Soil Resources of India. In 50 Years of Natural Resource Management; Singh, G.B., Sharma, B.R., Eds.; Indian Council of Agricultural Research: New Delhi, India, 2000. [Google Scholar]
  35. Hobbs, P.; Sayre, K.; Gupta, R. The role of conservation agriculture in sustainable agriculture. Phil. Trans. R. Soc. B 2008, 363, 543–555. [Google Scholar] [CrossRef] [PubMed]
  36. MNRE. Annual Report of the Ministry of New and Renewable Energy; Government of India: New Delhi, India, 2009.
  37. NAAS. Management of Crop Residues in the Context of Conservation Agriculture; Policy Paper No. 58; National Academy of Agricultural Sciences: New Delhi, India, 2012; p. 12. [Google Scholar]
  38. Mandal, D.; Sharda, V.N.; Tripathi, K.P. Relative efficacy of two biophysical approaches to assess soil loss tolérance for Doon Valley soils of India. J. Soil Water Conserv. 2010, 65, 42–49. [Google Scholar] [CrossRef]
  39. Srinivasarao, C.H.; Venkateswarlu, B.; Lal, R. Long-term manuring and fertilizer effects on depletion of soil organic stocks under Pearl millet-cluster vean-castor rotation in Western India. Land Degrad. Dev. 2014, 25, 173–183. [Google Scholar] [CrossRef]
  40. CSWCR&TI Vision, 2030; Vision 2030 of the Central Soil and water Conservation Research and Training Institute, Allied publisher: Dehradun, India, 2011; pp. 1–46.
  41. Mandal, K.G.; Hati, K.M.; Misra, A.K.; Bandyopadhyay, K.K.; Tripathy, A.K. Land surface modification and crop diversification for enhancing productivity of a Vertisol. Int. J. Plant Prod. 2013, 7, 455–472. [Google Scholar]
  42. Singh, G.; Ram, B.; Narain, P.; Bhushan, L.S.; Abrol, I.P. Soil erosion rates in India. Ind. J. Soil Conserv. 1992, 47, 97–99. [Google Scholar]
  43. Sharma, N.K.; Ghosh, B.N.; Khola, O.P.S.; Dubey, R.K. Residue and tillage management for soil moisture conservation in post maize harvesting period under rainfed conditions of north-west Himalayas. Ind. J. Soil Conserv. 2013, 42, 120–125. [Google Scholar]
  44. Ghosh, B.N.; Sharma, N.K.; Dadhwal, K.S. Integrated nutrient management and intercropping/cropping system impact on yield, water productivity and net return in valley soils of north-west Himalayas. Ind. J. Soil Conserv. 2011, 39, 236–242. [Google Scholar]
  45. Rao, J.V.; Khan, I.A. Research Gaps in Intercropping Systems under Rainfed Conditions in India, an On Farm Survey; CRIDA: Hyderabad, India, 2003. [Google Scholar]
  46. Pathak, P.; Mishra, P.K.; Rao, K.V.; Wani, S.P.; Sudi, R. Best opt-options on soil and water conservation. In Best Bet Options for Integrated Watershed Management, Proceedings of the Comprehensive Assessment of Watershed Programs in India (ICRISAT. Pantancheru 502 324), Andhra Pradesh, India, 23–27 July 2009; Wani, S.P., Venkateshwarlu, B., Sahrawat, K.L., Rao, K.V., Ramakrishna, Y.S., Eds.; pp. 75–94.
  47. Rao, K.P.C.; Steenhuis, T.S.; Cogle, A.L.; Srinivasan, S.T.; Yule, D.F.; Smith, G.D. Rainfall infiltration and runoff from an Alfisol in semi-arid tropical India. II. Tilled systems. Soil Tillage Res. 1998, 48, 61–69. [Google Scholar] [CrossRef]
  48. Palanisami, K.; Suresh Kumar, D.; Chandrasekharan, B. (Eds.) Watershed Management: Issues and Policies for 21st Century; Associated Publishing Company: New Delhi, India, 2002; p. 341.
  49. Joy, K.J.; Parnjpe, S.; Shah, A.; Badigar, S.; Lele, S. Scaling up of watershed development projects in India: learning from the first generation projects. In Proceedings of the Fourth IWMI-Tata Annual Partners Meet, International Water Management Institute, Anand, India, 24–26 February 2005; pp. 133–134.
  50. Sharda, V.N. Land degradation and watershed management issues in Himalayan region: Status and Strategies. In Workshop on “Mountain Agriculture in Himalayan Region: Status, Constraints and Potential”; ICAR: Dehradun, India, 2011; pp. 1–22. [Google Scholar]
  51. Adhikari, R.N.; Patil, A.; Raizada, D.; Ramajayam, M.; Prabhavathi, N.; Mondal, B.; Mishra, P.K. Participatory Resource Conservation and Management in Semi-arid India—A Case Study from Netranahalli Watershed (Karnataka); Technical Bulletin; Central Soil & Water Conservation Research & Training Institute, Research Centre: Bellary, Karnataka, India, 2013; p. 65. [Google Scholar]
  52. Natarajan, A.; Janakiraman, M.; Manoharan, S.; Kumar, A.K.S.; Vadivelu, S.; Sarkar, D. Assessment of land degradation and its impact on land resources of Sivagangai block, Tamil Nadu, India, 2010. In Land Degradation, and Desertification: Assessment, Mitigation and Remediation; Zdruli, P., Pagliai, M., Kapur, S., Faz Cano, A., Eds.; Springer Science: Berlin, Germany; pp. 235–252.
  53. Kundu, S.; Bhattacharyya, R.; Ved-Prakash; Ghosh, B.N.; Gupta, H.S. Carbon sequestration and relationship between carbon addition and storage under rainfed soybean–wheat rotation in a sandy loam soil of the Indian Himalayas. Soil Tillage Res. 2007, 92, 87–95. [Google Scholar] [CrossRef]
  54. Bhattacharyya, R.; Prakash, V.; Pandey, S.C.; Kundu, S.; Srivastva, A.K.; Gupta, H.S. Effect of fertilization on carbon sequestration in soybean-wheat rotation under two contrasting soils and management practices in the Indian Himalayas. Aust. J. Soil Res. 2009, 47, 592–601. [Google Scholar] [CrossRef]
  55. Bhattacharyya, R.; Kundu, S.; Srivastva, A.K.; Gupta, H.S.; Prakash, V.; Bhatt, J.C. Long term fertilization effects on soil organic carbon pools in a sandy loam soil of the Indian Himalayas. Plant Soil 2011, 341, 109–124. [Google Scholar] [CrossRef]
  56. Sharda, V.N.; Sharma, N.K.; Mohan, S.C.; Khybry, M.L. Green manuring for conservation and production in western Himalayas: 2. Effect on moisture conservation, weed control and crop yields. Indian J. Soil Conserv. 1999, 27, 31–35. [Google Scholar]
  57. Bhattacharyya, R.; Tuti, M.D.; Bisht, J.K.; Bhatt, J.C.; Gupta, H.S. Conservation tillage and fertilization impacts on soil aggregation and carbon pools in the Indian Himalayas under an irrigated rice-wheat rotation. Soil Sci. 2012, 177, 218–228. [Google Scholar] [CrossRef]
  58. Bhattacharyya, R.; Tuti, M.D.; Kundu, S.; Bisht, J.K.; Bhatt, J.C. Conservation tillage impacts on soil aggregation and carbon pools in a sandy clay loam soil of the Indian Himalayas. Soil Sci. Soc. Am. J. 2012, 76, 617–627. [Google Scholar] [CrossRef]
  59. Bhattacharyya, R.; Pandey, S.C.; Bisht, J.K.; Bhatt, J.C.; Gupta, H.S.; Titi, M.D.; Mahanta, D.; Mina, B.L.; Singh, R.D.; Chandra, S.; et al. Tillage and irrigation effects on soil aggregation and carbon pools in the Indian sub-Himalayas. Agron. J. 2013, 105, 101–112. [Google Scholar] [CrossRef]
  60. Mandal, B.; Majumder, B.; Bandopadhyay, P.K.; Hazra, G.C.; Gangopadhyay, A.; Samantaroy, R.N.; Misra, A.K.; Chowdhuri, J.; Saha, M.N.; Kundu, S. The potential of cropping systems and soil amendments for carbon sequestration in soils under long-term experiments in subtropical India. Global Change Biol. 2007, 13, 357–369. [Google Scholar] [CrossRef]
  61. Srinivasarao, C.H.; Ravindra Chary, G.; Venkateswarlu, B.; Vittal, K.P.R.; Prasad, J.V.N.S.; Singh, S.R.S.K.; Gajanan, G.N.; Sharma, R.A.; Deshpande, A.N.; Patel, J.J.; et al. Carbon Sequestration Strategies under Rainfed Production Systems of India; Central Research Institute for Dryland Agriculture, Hyderabad (ICAR): Hyderabad, India, 2009; p. 102. [Google Scholar]
  62. CSWCR&TI. Annual Report of the Central Soil Water Conservation Research and Training Institute; CSWCR&TI: Dehradun, India, 2012. [Google Scholar]
  63. Kannan, K.; Khola, O.P.S.; Selvi, V.; Singh, D.V.; Moharnraj, R. Agronomical Management Practices for Higher Productivity, Resource Use Efficiency and Farm Income in Semi-Arid Region-A Case Study in Ayalur Watershed; Technical Bulletin; Central Soil & Water Conservation Research & Training Institute, Research Centre, Udhagamandalam: Tamil Nadu, India, 2013; p. 20. [Google Scholar]
  64. Sharma, P.D.; Sarkar, A.K. Managing Acid Soils for Enchancing Productivity; Technical Bulletin; NRM Division, KAB-II, Pusa Campus: New Delhi, India, 2005; p. 23. [Google Scholar]
  65. Fageria, N.K.; Baligar, V.C. Ameliorating soil acidity of tropical Oxisols by liming for sustainable crop production. Adv. Agron. 2008, 99, 345–399. [Google Scholar]
  66. Bhat, J.A.; Mandal, B.; Hazra, G.C. Basic slag as a liming material to ameliorate soil acidity in Alfisols of sub-tropical India. Am.-Euras. J. Agric. Environ. Sci. 2007, 2, 321–327. [Google Scholar]
  67. Bhat, J.A.; Kundu, M.C.; Hazra, G.C.; Santra, G.H.; Mandal, B. Rehabilitating acid soils for increasing crop productivity through low-cost liming material. Sci. Total Environ. 2010, 408, 4346–4353. [Google Scholar] [CrossRef] [PubMed]
  68. Wilson, C.E.; Keisling, T.C., Jr.; Miller, D.M.; Dillon, C.R.; Pearce, A.D.; Frizzell, D.L.; Counce, P.A. Tillage influence on soluble salt movement in silt loam soils cropped to paddy rice. Soil Sci. Soc. Am. J. 2000, 64, 1771–1776. [Google Scholar] [CrossRef]
  69. Garg, V.K. Interaction of tree crops with a sodic soil environment: Potential for rehabilitation of degraded environments. Land Degrad. Dev. 1998, 9, 81–93. [Google Scholar] [CrossRef]
  70. Bhojvaid, P.P.; Timmer, V.R. Soil dynamics in an age sequence of Prosopis juliflora planted for sodic soil restoration in India. Forest Ecol. Manage. 1998, 106, 181–193. [Google Scholar] [CrossRef]
  71. Gupta, R.K.; Rao, D.L.N. Potential of wasteland for sequestering carbon by reforestation. Curr. Sci. 1994, 66, 378–380. [Google Scholar]
  72. Gupta, R.K.; Abrol, I.P. Salt-Affected Soils. Their Reclamation and Management for Crop Production; Lal, R., Stewart, B.A., Eds.; Springer: New York, NY, USA, 1990; pp. 223–288. [Google Scholar]
  73. Dhanushkodi, V.; Subrahmaniyan, K. Soil management to increase rice yield in salt affected coastal soil-a review. Int. J. Res. Chem. Environ. 2012, 2, 1–5. [Google Scholar]
  74. Prapagar, K.; Indraratne, S.P.; Premanandharajah, P. Effect of soil amendments on reclamation of saline-sodic soil. Trop. Agric. Res. 2012, 23, 168–176. [Google Scholar] [CrossRef]
  75. Bandyopadhyay, A.K. Effect of Lime, Superphosphate, Powdered Oystershell, Rock phosphate and Submergence on Soil Properties and Crop Growth in Coastal Saline Acid Sulphate Soils of Sundarbans. In Proceedings of the International Symposium on Rice Production on Acid Soil of the Tropics, 26–30 June 1989.
  76. Kumar, R.; Singh, R.D.; Sharma, K.D. Water resources of India. Curr. Sci. 2005, 89, 794–811. [Google Scholar]
  77. Moukhtar, M.M.; El-Hakim, M.H.; Abdel-Mawgoud, A.S.A.; Abdel-Aal, A.I.N.; El-Shewikh, M.B.; Abdel-Khalik, M.I.I. Drainage and Role of Mole Drains for Heavy Clay Soils under Saline Water Table, Egypt. In Proceedings of the 9th ICID International Drainage Workshop, Utrecht, The Netherlands, 10–13 September 2003.
  78. Abdel-Mawgoud, S.A.; El-Shewikh, M.B.; Abdel-Aal, A.I.N.; Abdel-Khalik, M.I.I. Open drainage and moling for desalinization of salty clay soils of Northeastern Egypt. In Proceedings of the 9th International Drainage Workshop, Utrecht, The Netherlands, 10–13 September 2003.
  79. Mukhopadhyay, D.; Mani, P.K.; Sanyal, S.K. Effect of phosphorus, arsenic and farmyard manure on arsenic availability in some soils of West Bengal. J. Indian Soc. Soil Sci. 2002, 50, 56–61. [Google Scholar]
  80. Ghosh, K.; Das, I.; Saha, S.; Banik, G.C.; Ghosh, S.; Maji, N.C.; Sanyal, S.K. Arsenic chemistry in groundwater in the Bengal Delta Plain: Implications in agricultural system. J. Indian Chem. Soc. 2004, 81, 1–10. [Google Scholar]
  81. Elliot, P.; Grandner, J.; Allen, D.; Butcher, G. Completion Criteria for Alcoa of Australia Limited Bauxite Mine Rehabilitation. In Proceedings of 3rd International and 21st Annual Minerals Council of Australia Environmental Workshop, Newcastle, Australia, 14–18 October 1996.
  82. Sharma, R.K.; Babu, K.S.; Chhokar, R.S.; Sharma, A.K. Effect of tillage on termites, weed incidence and productivity of spring wheat in rice-wheat system of North Western Indian plains. Crop Prot. 2004, 23, 1049–1054. [Google Scholar] [CrossRef]
  83. Sen, H.S.; Oosterbaan, R.J. Research on Water Management and Control in the Sunderbans, India; Annual Report; ILRI: Wageningen, The Netherlands, 1992. [Google Scholar]
  84. Ambast, S.K.; Sen, H.S. Integrated water management strategies for coastal ecosystem. J. Indian Soc. Coastal Agric. Res. 2006, 24, 23–29. [Google Scholar]
  85. Bandyopadhyay, K.K.; Ghosh, P.K.; Hati, K.M.; Misra, A.K. Efficient utilization of limited available water in wheat through proper irrigation scheduling and integrated nutrient management under different cropping systems in a Vertisol. J. Indian Soc. Soil Sci. 2009, 57, 121–128. [Google Scholar]
  86. Biswas, A.K.; Mohanty, M.; Hati, K.M.; Misra, A.K. Soil organic carbon and aggregate stability effects of applied distillery effluents on a vertisol in India. Soil Tillage Res. 2009, 104, 241–246. [Google Scholar] [CrossRef]
  87. Grewal, S.S. Agroforestry systems for soil and water conservation in Shivaliks. In Agroforestry in 2000 AD for the Semi-Arid and Arid Tropics; NRC for Agroforestry: Janshi, India, 1993; pp. 82–85. [Google Scholar]
  88. Ghosh, B.N. Vegetative Barriers for Erosion Control in Western Himalayan Region; CSWCR&TI: Dehradun, India, 2009; pp. 1–8. [Google Scholar]
  89. Bhattacharyya, R.; Fullen, M.A.; Booth, C.A.; Kertesz, A.; Toth, A.; Kozma, K.Z.; Jakab, G.; Jankauskas, B.; Jankauskiene, G. Effeciveness of biological geotextiles on soil and water conservation in different agro-environments. Land Degrad. Dev. Special Issue 2011, 22, 495–504. [Google Scholar] [CrossRef]
  90. Bhattacharyya, R.; Zheng, Y.; Li, Y.; Tang, L.; Panomtarachichigul, M.; Peukrai, S.; Dao, C.T.; Tran, H.C.; Truong, T.T.; Jankauskas, B.; et al. Effects of biological geotextiles on aboveground biomass production in selected agro-ecosystems. Field Crops Res. 2012, 126, 23–36. [Google Scholar] [CrossRef]
  91. Fullen, M.A.; Subedi, M.; Booth, C.A.; Sarsby, R.W.; Davies, K.; Bhattacharyya, R.; Kugan, R.; Luckhurst, D.A.; Han, K.; Black, A.W.; et al. Utilizing biological geotextiles: Introduction to the BORASSUS Project and global perspectives. Land Degrad. Dev. Spec. Issue 2011, 22, 453–462. [Google Scholar] [CrossRef]
  92. Smets, T.; Poesen, J.; Bhattacharyya, R.; Fullen, M.A.; Subedi, M.; Booth, C.A.; Kertesz, A.; Toth, A.; Szalai, Z.; Jakab, G.; et al. Evaluation of biological geotextiles for reducing runoff and soil loss under various environmental conditions using laboratory and field plot data. Land Degrad. Dev. Special Issue 2011, 22, 480–494. [Google Scholar] [CrossRef]
  93. Bhattacharyya, R.; Fullen, M.A.; Booth, C.A. Using palm-mat geotextiles on an arable soil for water erosion control in the UK. Earth Surf. Process. Landforms 2011, 36, 933–945. [Google Scholar] [CrossRef]
  94. Bhattacharyya, R.; Fullen, M.A.; Booth, C.A.; Smets, T.; Poesen, J.; Black, A. Using palm mat geotextiles for soil conservation. I. Effects on soil properties. Catena 2011, 84, 99–107. [Google Scholar] [CrossRef]
  95. Bhattacharyya, R.; Fullen, M.A.; Davies, K.; Booth, C.A. Use of palm-mat geotextiles for rainsplash erosion control. Geomorph. 2010, 119, 52–61. [Google Scholar] [CrossRef]
  96. Bhattacharyya, R.; Fullen, M.A.; Davies, K.; Booth, C.A. Utilizing palm leaf geotextile mats to conserve loamy sand soil in the United Kingdom. Agric. Ecosyst. Environ. 2009, 130, 50–58. [Google Scholar] [CrossRef]
  97. Narain, P.; Singh, R.K.; Sindhwal, N.S.; Joshi, P. Agroforestry for soil and water conservation in the western Himalayan valley region of India. Agrofor. Syst. 1998, 39, 191–203. [Google Scholar] [CrossRef]
  98. Mahmud, M.K.; Chowdhury, N.H.; Md-Manjur. Mitigation of soil erosion with Jute geotextile aided by vegetation cover: Optimization of an integrated tactic for sustainable soil conservation system (SSCS). Glob. J. Res. Eng. Civil Struct. Eng. 2012, 12, 8–14. [Google Scholar]
  99. Nair, P.K.R. An Introduction to Agro Forestry; Kluwer Academic Publishers: Dordrecht, The Netherland, 1993. [Google Scholar]
  100. Ramesh, P.; Panwar, N.R.; Singh, A.B.; Ramana, S.; Yadav, S.K.; Shrivastava, R. Status of organic farming in India. Curr. Sci. 2010, 98, 1190–1194. [Google Scholar]
  101. Nair, T. India to launch a brave new initiative to save the Critically Endangered Gharial. SPECIES–Mag. Spec. Surv. Comm. 2011, 21, 53. [Google Scholar]
  102. Rosenstock, T.S.; Tully, K.L.; Arias Navarro, C.; Neufeldt, H.; Butterbach Bahl, K.; Verchot, L.V. Agroforestry with N2-fixing trees: Sustainable development’s friend or foe? Curr. Opin. Environ. Sustain. 2014, 6, 15–21. [Google Scholar] [CrossRef]
  103. Singh, G. The Role of Prosopis in reclaiming high-pH soils and in meeting firewood and forage needs of small farmers. In Prosopis: Semi-Arid Fuelwood and Forage: Tree Building Consensus for the Disenfranchised; US National Academy of Science: Washington, DC, USA, 1996. [Google Scholar]
  104. Mishra, A.; Sharmaa, S.D.; Pandeyb, R. Amelioration of degraded sodic soil by afforestation. Arid Land Res. Manag. 2004, 18, 13–23. [Google Scholar] [CrossRef]
  105. Kaur, B.; Gupta, S.R.; Singh, G. Soil carbon, microbial activity and nitrogen availability in agroforestry systems on moderately alkaline soils in Northern India. Appl. Soil Ecol. 2000, 15, 283–294. [Google Scholar] [CrossRef]
  106. Basavaraja, P.K.; Sharma, S.D.; Dhananjaya, B.N.; Badrinath, M.S. Acacia nilotica: A tree species for amelioration of sodic soils in Central dry zone of Karnataka, India. In Proceedings of the 19th World Congress of Soil Science, Soil Solutions for a Changing World, Brisbane, Australia, 1–6 August 2010; pp. 73–76.
  107. Mishra, A.; Sharma, S.D.; Khan, G.H. Improvement in physical and chemical properties of sodic soil by 3, 6, and 9 year-old plantations of Eucalyptus tereticornis bio-rejuvenation of soil. For. Ecol. Manag. 2003, 184, 115–124. [Google Scholar] [CrossRef]
  108. Singh, A.; Kaur, J. Impact of conservation tillage on soil properties in rice wheat cropping system. Agric. Sci. Res. J. 2012, 2, 30–41. [Google Scholar]
  109. Food and Agriculture Organization (FAO). “Climate-Smart” Agriculture. Policies, Practices and Financing for Food Security, Adaptation and Mitigation; FAO: Rome, Italy, 2010; p. 41. [Google Scholar]
  110. Bhattacharyya, R.; Das, T.K.; Pramanik, P.; Ganeshan, V.; Saad, A.A.; Sharma, A.R. Impacts of conservation agriculture on soil aggregation and aggregate-associated N under an irrigated agroecosystem of the Indo-Gangetic Plains. Nutr. Cycl. Agro-Ecosyst. 2013, 96, 185–202. [Google Scholar] [CrossRef]
  111. VPKAS. Annual Report of the Vivekananda Parvatiya Krishi Anusandhan Sansthan; Vikas Publisher: Almora, India, 2011. [Google Scholar]
  112. Bhattacharyya, R.; Kundu, S.; Pandey, S.; Singh, K.P.; Gupta, H.S. Tillage and irrigation effects on crop yields and soil properties under rice-wheat system of the Indian Himalayas. Agric. Water Manag. 2008, 95, 993–1002. [Google Scholar] [CrossRef]
  113. Jat, M.L.; Saharawat, Y.S.; Gupta, R. Conservation agriculture in cereal systems of South Asia: Nutrient management perspectives. Karnataka J. Agric. Sci. 2011, 24, 100–105. [Google Scholar]
  114. RWC-CIMMYT. Addressing Resource Conservation Issues in Rice-Wheat Systems of South Asia: A Resource Book; Rice-wheat consortium for the Indo-Gangetic Plains–International Maize and Wheat Improvement Centre: New Delhi, India, 2003; p. 305. [Google Scholar]
  115. Gathala, M.K.; Ladha, J.K.; Saharawat, H.S.; Kumar, V.; Sharma, P.K. Effect of tillage and crop establishment methods on physical properties of a medium-textured soil under a seven-year rice−wheat rotation. Soil Sci. Soc. Am. J. 2011, 75, 1851–1862. [Google Scholar] [CrossRef]
  116. Hobbs, P.R.; Gupta, R.K. Sustainable resource management in intensively cultivated irrigated rice-wheat cropping systems of Indo-Gangetic plains of south Asia: Strategies and options. In Proceedings of the International Conference on Managing Natural Resources for Sustainable Production in 21st Century, New Delhi, India, 14−18 February 2000; Singh, A.K., Ed.; Indian Society of Soil Science: New Delhi, India; pp. 584–592.
  117. Ladha, J.K.; Kumar, V.; Alam, M.M.; Sharma, S.; Gathala, M.K.; Chandna, P.; Saharawat, Y.S.; Balasubramanian, V. Integrating crop and resource management technologies for enhanced productivity, profitability and sustainability of the rice–wheat system in South Asia. In Integrated Crop and Resource Management in the Rice–Wheat System of South Asia; Ladha, J.K., Singh, Y., Erenstein, O., Hardy, B., Eds.; IRRI: Los Banos, The Philippines, 2009; pp. 69–108. [Google Scholar]
  118. Das, T.K.; Bhattacharyya, R.; Sudhishri, S.; Sharma, A.R.; Saharawat, Y.S.; Bandyopadhyay, K.K.; Sepat, S.; Bana, R.S.; Aggarwal, P.; Sharma, R.K.; et al. Conservation agriculture in an irrigated cotton–wheat system of the western Indo-Gangetic Plains: Crop and water productivity and economic profitability. Field Crops Res. 2014, 158, 24–33. [Google Scholar] [CrossRef]
  119. Jat, M.L.; Gathala, M.K.; Saharawat, Y.S.; Terawal, J.P.; Gupta, R.; Singh, Y. Double no-till and permanent raised beds in maize-wheat rotation of north-western Indo-Gangetic plains of India: Effects on crop yields, water productivity, profitability and soil physical properties. Field Crops Res. 2013, 149, 291–299. [Google Scholar] [CrossRef]
  120. Das, T.K.; Bhattacharyya, R.; Sharma, A.R.; Das, S.; Pathak, H. Impacts of conservation agriculture on total soil organic carbon retention potential under an irrigated agro-ecosystem of the western Indo-Gangetic Plains. Eur. J. Agron. 2013, 51, 34–42. [Google Scholar] [CrossRef]
  121. Mishra, A.K.; Aggarwal, P.; Bhattacharyya, R.; Das, T.K.; Sharna, A.R.; Singh, R. Least limiting water range for two conservation agriculture cropping systems in India. Soil Tillage Res. 2015, 150, 43–56. [Google Scholar] [CrossRef]
  122. Hati, K.M.; Chaudhary, R.S.; Mohanty, M.; Singh, R.K. Impact of conservation tillage on soil organic carbon content, its distribution in aggregate size fractions and physical attributes of Vertisols. In IISS Contribution in Frontier Areas of Soil Research; Kundu, S., Manna, M.C., Biswas, A.K., Chaudhary, R.S., Lakaria, B.L., Subba Rao, A., Eds.; Indian Institute of Soil Science: Bhopal, India, 2013; pp. 187–200. [Google Scholar]
  123. Jat, R.A.; Wani, S.P.; Sahrawat, K.L. Conservation Agriculture in the Semi-Arid Tropics: Prospects and Problems. Adv. Agron. 2012, 117, 191–273. [Google Scholar]
  124. Gathala, M.K.; Kumar, V.; Sharma, P.C.; Yashpal, S.; Saharawat, H.S.; Jat, M.S.; Kumar, A.; Jat, M.L.; Humphreys, E.; Sarma, D.K.; et al. Optimizing intensive cereal-based cropping systems addressing current and future drivers of agricultural change in the northwestern Indo-Gangetic plains of India. Agric. Ecosyst. Environ. 2013, 177, 85–97. [Google Scholar] [CrossRef]

