1. Introduction
Britain has the oldest housing stock in the developed world [
1]. According to BRE [
2] more than 65% and 49% of domestic buildings in the UK have uninsulated walls and single glazed windows respectively. It is estimated that domestic buildings are responsible for one third of the UK carbon emissions [
3,
4]. Improving the quality and energy performance of new and existing buildings has therefore been one of the major priorities of the UK Government during the recent years. This is not only to achieve the CO
2 emission targets set for 2050 [
5,
6] but also to tackle fuel poverty which affects more than 2.3 million households [
7]. National schemes such as the Green Deal [
8] and Warm Front intend to improve energy efficiency of buildings through better insulation and reduced air permeability to reduce the risk of thermal discomfort as well as unnecessary heat loss [
9]. Building regulations and standards have also been increasing thermal insulation and airtightness requirements to improve the energy performance of new and refurbished buildings in the UK.
According to Xing
et al. [
10] improving airtightness is an effective way of reducing energy consumption in buildings. Yet, high airtightness could result in insufficient ventilation rates which may in turn lead to poor indoor air quality (IAQ), high risk of condensation and reduced comfort and productivity [
11,
12]. According to the Scottish Government [
13], when refurbishing existing properties, heating, ventilation and thermal insulation should be considered together as ignoring one could result in poor indoor conditions, higher risk of condensation and unnecessary energy consumption.
The results of a study by Staepels
et al. [
14] suggest that increasing airtightness in new buildings would not necessarily deteriorate the IAQ as Relative Humidity (RH%) and CO
2 levels may remain within the acceptable ranges. On the contrary, results of another study by of Hobday [
15] reveal that although increasing airtightness helps to reduce energy consumption and risk of thermal discomfort, it could considerably increase the risk of poor IAQ. Boulanger
et al. [
16] also reported considerably higher RH% levels in airtight buildings. Moreover, results of studies by Elsharkawy and Rutherford [
17] indicate that in energy efficient buildings, the occupants’ lifestyle does not change as fast as the other parameters and therefore, in actual buildings both energy consumption and IAQ are worse than the predicted conditions.
For very low air permeability rates, such as 1 m
3/h.m
2@50 pa in Zero Carbon Homes, mechanical ventilation systems are required [
18,
19] to maintain an acceptable IAQ in the building in order to avoid negative effects on the health and wellbeing of the occupants. Nevertheless, the results of a study by Wing and Huang [
20] show that applying mechanical ventilation in domestic buildings increased the number of sick building syndrome incidents and affected occupants’ perceived comfort. Although the situation slightly improved for buildings where fresh air was supplied by means of mechanical ventilation, CO
2 levels and occupants comfort remained worse than naturally ventilated buildings.
It should be noted that application of mechanical ventilation in UK domestic buildings is not a common practice and natural ventilation remains the main strategy for the majority of new and refurbished houses in the UK. Reducing air permeability could therefore result in higher risk of condensation, and unacceptable IAQ, affecting the health and wellbeing of the occupants of these buildings. To this end, this study intends to investigate the effects of air permeability, background ventilation and occupants’ lifestyles on the energy performance, indoor air quality and risk of condensation in naturally ventilated domestic buildings. The ultimate aim is to determine the most efficient way to improve energy efficiency in buildings without sacrificing IAQ.
2. Methodology
Dynamic Thermal Simulations (DTS) were conducted in EnergyPlus to evaluate building performance. Combined Heat and Moisture Finite Element was considered as the heat balance algorithm in order to achieve more accurate results for simulating moisture and the risk of condensation. London Gatwick was considered for the weather data.
Simulations were conducted for the heating seasons from October to the end of March when occupants are less likely to open the windows/vents and there are therefore higher risks of condensation and poor IAQ. According to the findings of a study by Hashemi
et al. [
21] on some UK domestic buildings, bedrooms have a considerably poorer IAQ compared to other areas of the building. Therefore, for the purpose of this study, a 3 m × 3 m × 2.4 m (length × width × height) room with a 1 m × 1 m window and masonry insulated cavity walls was modelled as the representative of a double bedroom.
Two occupants were defined as the only sources of internal heat gain and CO
2 generation in the simulated zone. According to ASHRAE 55 [
22] total heat gain of 120 W was assumed for seated and 72 W for sleeping occupants. The occupancy schedule was defined as fully occupied from 6 pm to 8 am during weekdays and 24 h during all other days. The bedrooms were supposed to be occupied for 8 h during working days and 9 h during all other days. An average heating set-point of 18 °C was considered during the occupied periods. This was specified based on the CIBSE Guide A [
23] guidelines in which temperature of 17 °C–19 °C is suggested for bedrooms.
In total, 30 different scenarios were simulated for five airtightness rates (1, 3, 5, 7 and 10 m
3/h.m
2@50 Pa) with two Trickle Vents (TV) positions (permanently closed or open) and three different lifestyle conditions of (Dry, Moist and Wet). It should be noted that according to approved document L1A, the limiting air permeability in domestic buildings is 10 m
3/h.m
2@50 Pa [
24]. CIBSE Technical Memoranda TM23: 2000 also recommends an air permeability of 5 m
3/h.m2@50 Pa as the best practice for naturally ventilated dwellings [
25]. For the purpose of background/whole building ventilation a TV of 5000 mm
2 was considered based on the approved document part F of the UK building regulations [
26]. Background ventilation is necessary to maintain the minimum IAQ requirements in the building. The ventilation was supposed to be through infiltration and TV only and no obstructions such as curtains or blinds were considered.
Regarding moisture generation, three lifestyle categories of “Dry”, “Moist” and “Wet” occupancy conditions were modelled based on the guidelines provided in Annex B, Table B.3 of BS 5250 [
27]. According to the provided guidelines, Dry, Moist and Wet occupancy conditions are defined as excess generated moisture of up to 0.3 kPa, 0.6 kPa and more than 0.6 kPa, respectively. For the Moist and Wet occupancy, internal humidity is higher than normal levels, while dry occupancy is representative of those conditions where occupants are out of the building during the daytime and generate lower amount of moisture. Therefore, for the purpose of simulations, excess vapour pressure values of 0.3 kPa, 0.6 kPa and 0.9 kPa were assumed as the Dry, Moist and Wet occupancy conditions, respectively. According to the BS 5250, the daily moisture generation of, for example, two occupants for Dry, Moist and Wet occupancy conditions are 4 kg, 8 kg and 11 kg, respectively. Since window surface temperatures are usually lower than the rest of the building elements, risk of condensation and mould growth around windows is usually higher than in other areas of buildings. The total number of hours when there was a risk of condensation on the window are therefore reported.
Moreover, as suggested by BB101 [
28] and BS EN 15251 [
29], CO
2 concentration can be used as an indicator of IAQ in occupied spaces. High CO
2 levels in occupied zones is an indicator of unacceptable IAQ and insufficient ventilation. The indoor air quality was therefore investigated by reporting CO
2 concentration level during occupied periods. For this reason, frequency of the times when CO
2 levels were higher than 1000, 1500 and 5000 parts per million (ppm) are reported. The 1000 ppm value is the target value suggested by BS EN 15251:2007 [
29] as the acceptable IAQ while 1500 ppm is the concentration value in which usually all the occupants show some symptom of sick building syndrome [
30] and the 5000 ppm is the concentration value in which occupants’ health can be affected [
31].
In addition, the effects of the application of each of 30 scenarios on energy consumption were also studied and the total heating energy consumptions were reported. It should be noted that the reported heating energy is for the studied thermal zone only and the results should either be divided by the total area or the volume of the heated zone in order to achieve heating energy per square/cubic meters as a more appropriate indicator for comparison with other buildings.
Table 1 summarises the conditions considered for the simulations.
Table 1.
Summary of conditions/scenarios considered for the simulations.
Table 1.
Summary of conditions/scenarios considered for the simulations.
| Summary of Conditions |
|---|
| Simulation Conditions | Simulation period: 6 Months (October-March) | Weather Data: London Gatwick | Heating Set-point: 18 °C | Occupancy pattern: 6 pm–8 am working days; Occupied all other times | Number of occupants: 2 |
| Construction | Masonry cavity with insulated walls | External walls U-Value: 0.35 W/m2·K | Window U-Value: 1.97 W/m2K | Room size: 3 m × 3 m × 2.4 m | - |
| Boundary conditions | Exposed: South wall; Roof | Ground: Floor | Adiabatic: North, East and West walls | Total exposed wall area: 7.2 m2 | - |
| Air Permeability Rates | 1 m3/h·m2@50 Pa | 3 m3/h.m2@50 Pa | 5 m3/h·m2@50 Pa | 7 m3/h.m2@50 Pa | 10 m3/h·m2@50 Pa |
| Occupancy Conditions | Dry: 0.3 Kpa excess vapour pressure | Moist: 0.6Kpa excess vapour pressure | Wet: 0.9 Kpa excess vapour pressure | - | - |
| TV Conditions | Open | Closed | Area: 5000 mm2 | Position: South façade | Discharge coefficient: 0.65 |
| Simulation Outputs | CO2: 1000 ppm, 1500 ppm, 5000 ppm | Risk of Condensation (h) | Energy Consumption (KW) | - | - |
3. Results
3.1. Indoor Air Quality
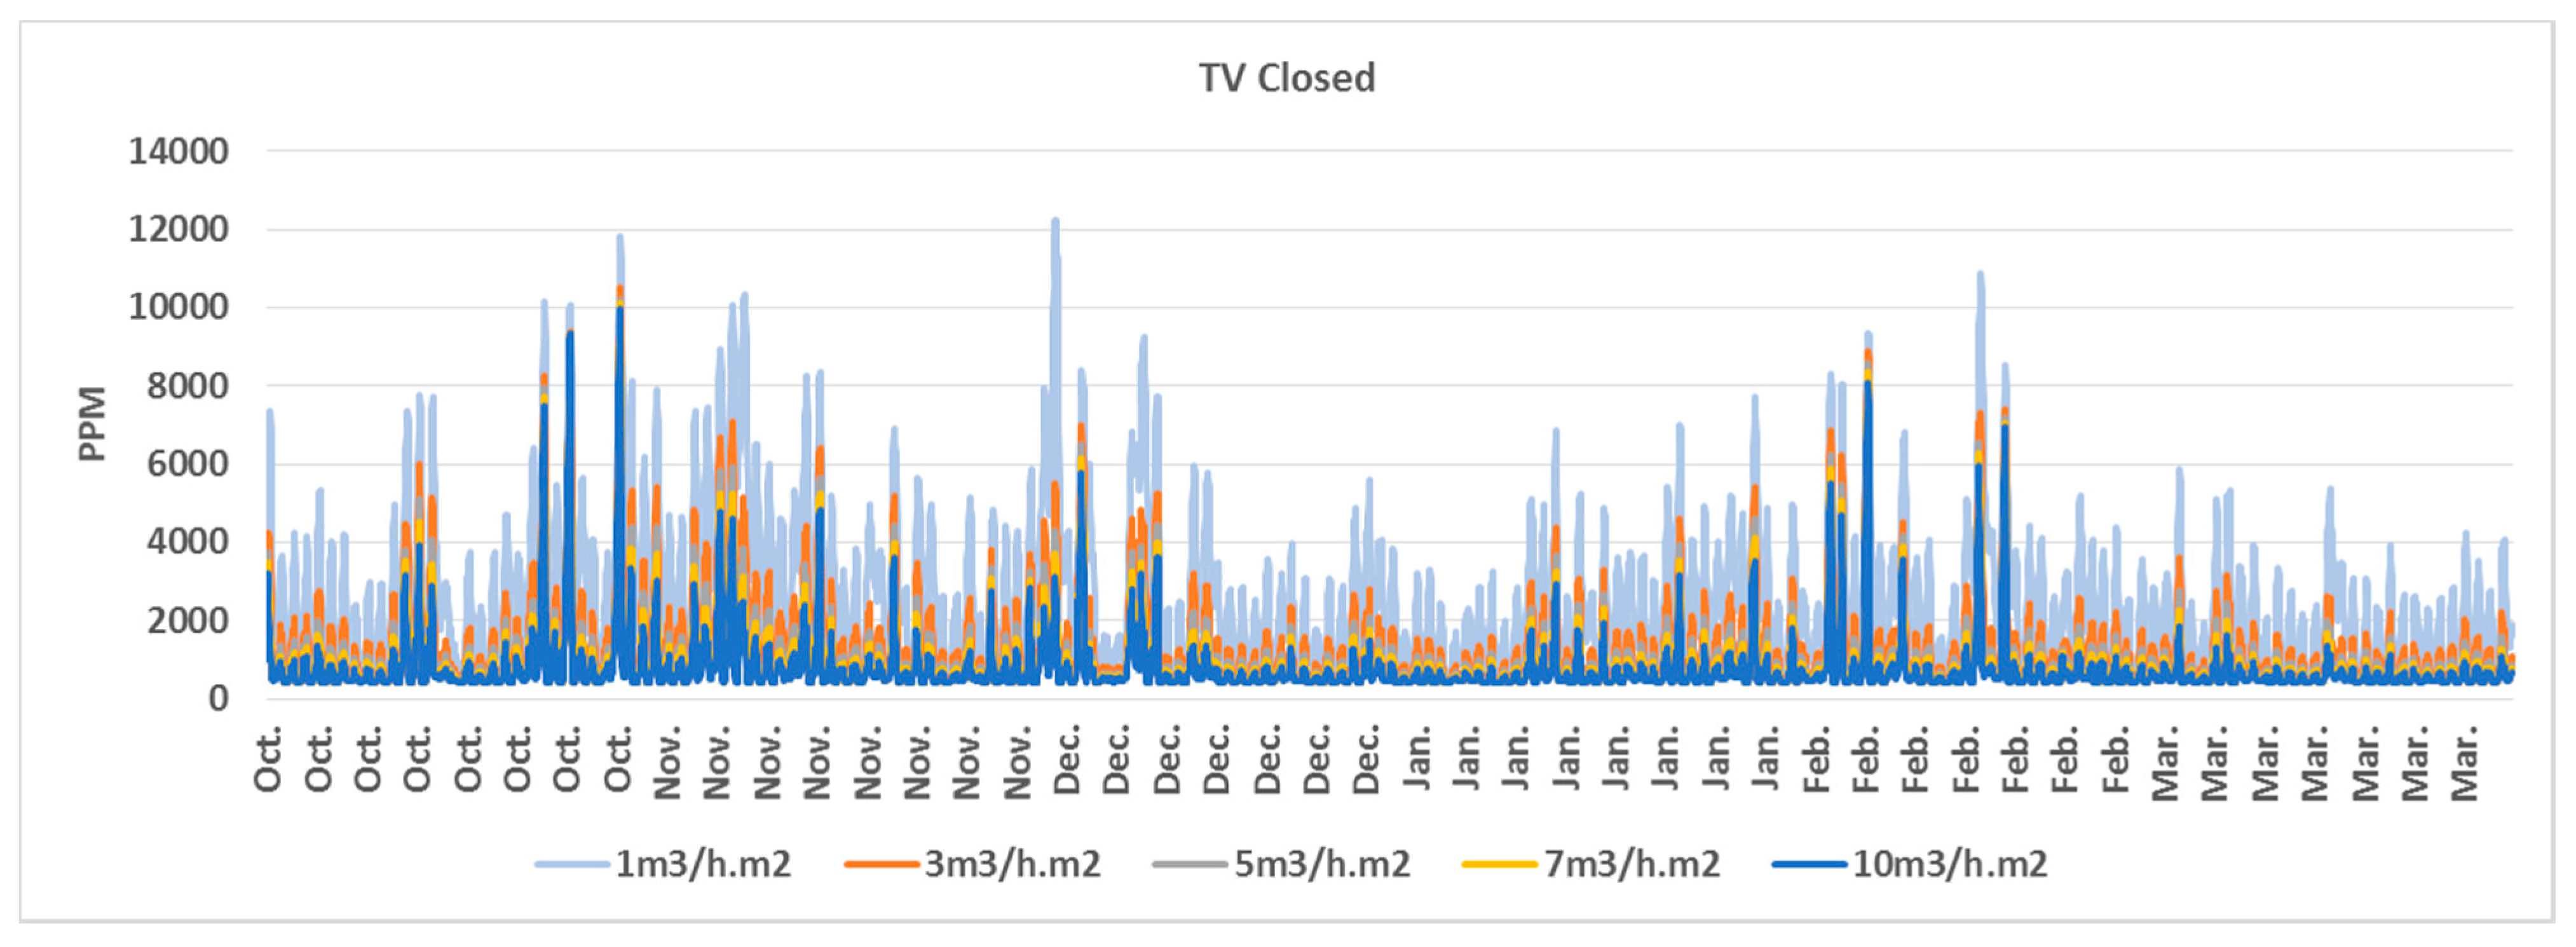
The results of simulations were evaluated for different airtightness values for the TV open and closed conditions. According to the results for the air permeability of 1 m3/h.m2@50 Pa when the TV was closed, CO2 concentration levels were above 1000 ppm, 1500 ppm and 5000 ppm for 85%, 69% and 10% of all occupied periods, respectively. The IAQ improved considerably when the TV was opened, reducing the above figures to 54%, 31% and 1.5% of the entire occupied periods. Opening the TV helped to reduce risk of poor IAQ by 85% reflecting the period of time when CO2 level was higher than 5000 ppm.
For the 3 m
3/h.m
2@50 Pa air permeability, the results indicated considerable reduction to around 31% during which CO
2 was above 1500 ppm. However CO
2 remained above 1000 ppm in 54% of the occupied periods. The IAQ continued to improve for all other air permeability values. For the air permeability of 10 m
3/h.m
2@50 Pa, CO
2 concentration was respectively in 8.3% and 1% of the times above 1500 ppm and 5000 ppm. This means 79%, 88% and 90% improvements in the CO
2 concentration for 1000, 1500 and 5000 ppm compared to 1 m
3/h.m
2@50 Pa.
Figure 1 and
Table 2 summarise the results of simulations for different air permeability values when the TV was closed.
Figure 1.
CO2 concentration values for different air permeability rates Oct.–Mar. (TV Closed).
Figure 1.
CO2 concentration values for different air permeability rates Oct.–Mar. (TV Closed).
Table 2.
Percentage of occupied time when CO2 concentration was above, 1000, 1500 and 5000 ppm (TV Closed).
Table 2.
Percentage of occupied time when CO2 concentration was above, 1000, 1500 and 5000 ppm (TV Closed).
| Air Permeability Values (TV Closed) | 1m3/h.m2@ 50 Pa | 3m3/h.m2@ 50 Pa | 5m3/h.m2@ 50 Pa | 7m3/h.m2@ 50 Pa | 10m3/h.m2@ 50 Pa |
|---|
| CO2 Concentration |
|---|
| 1000 ppm | 85.3% | 54.3% | 36.3% | 25.8% | 17.8% |
| 1500 ppm | 69.6% | 31.3% | 17.7% | 12.0% | 8.3% |
| 5000 ppm | 10.3% | 2.3% | 1.5% | 1.3% | 1.0% |
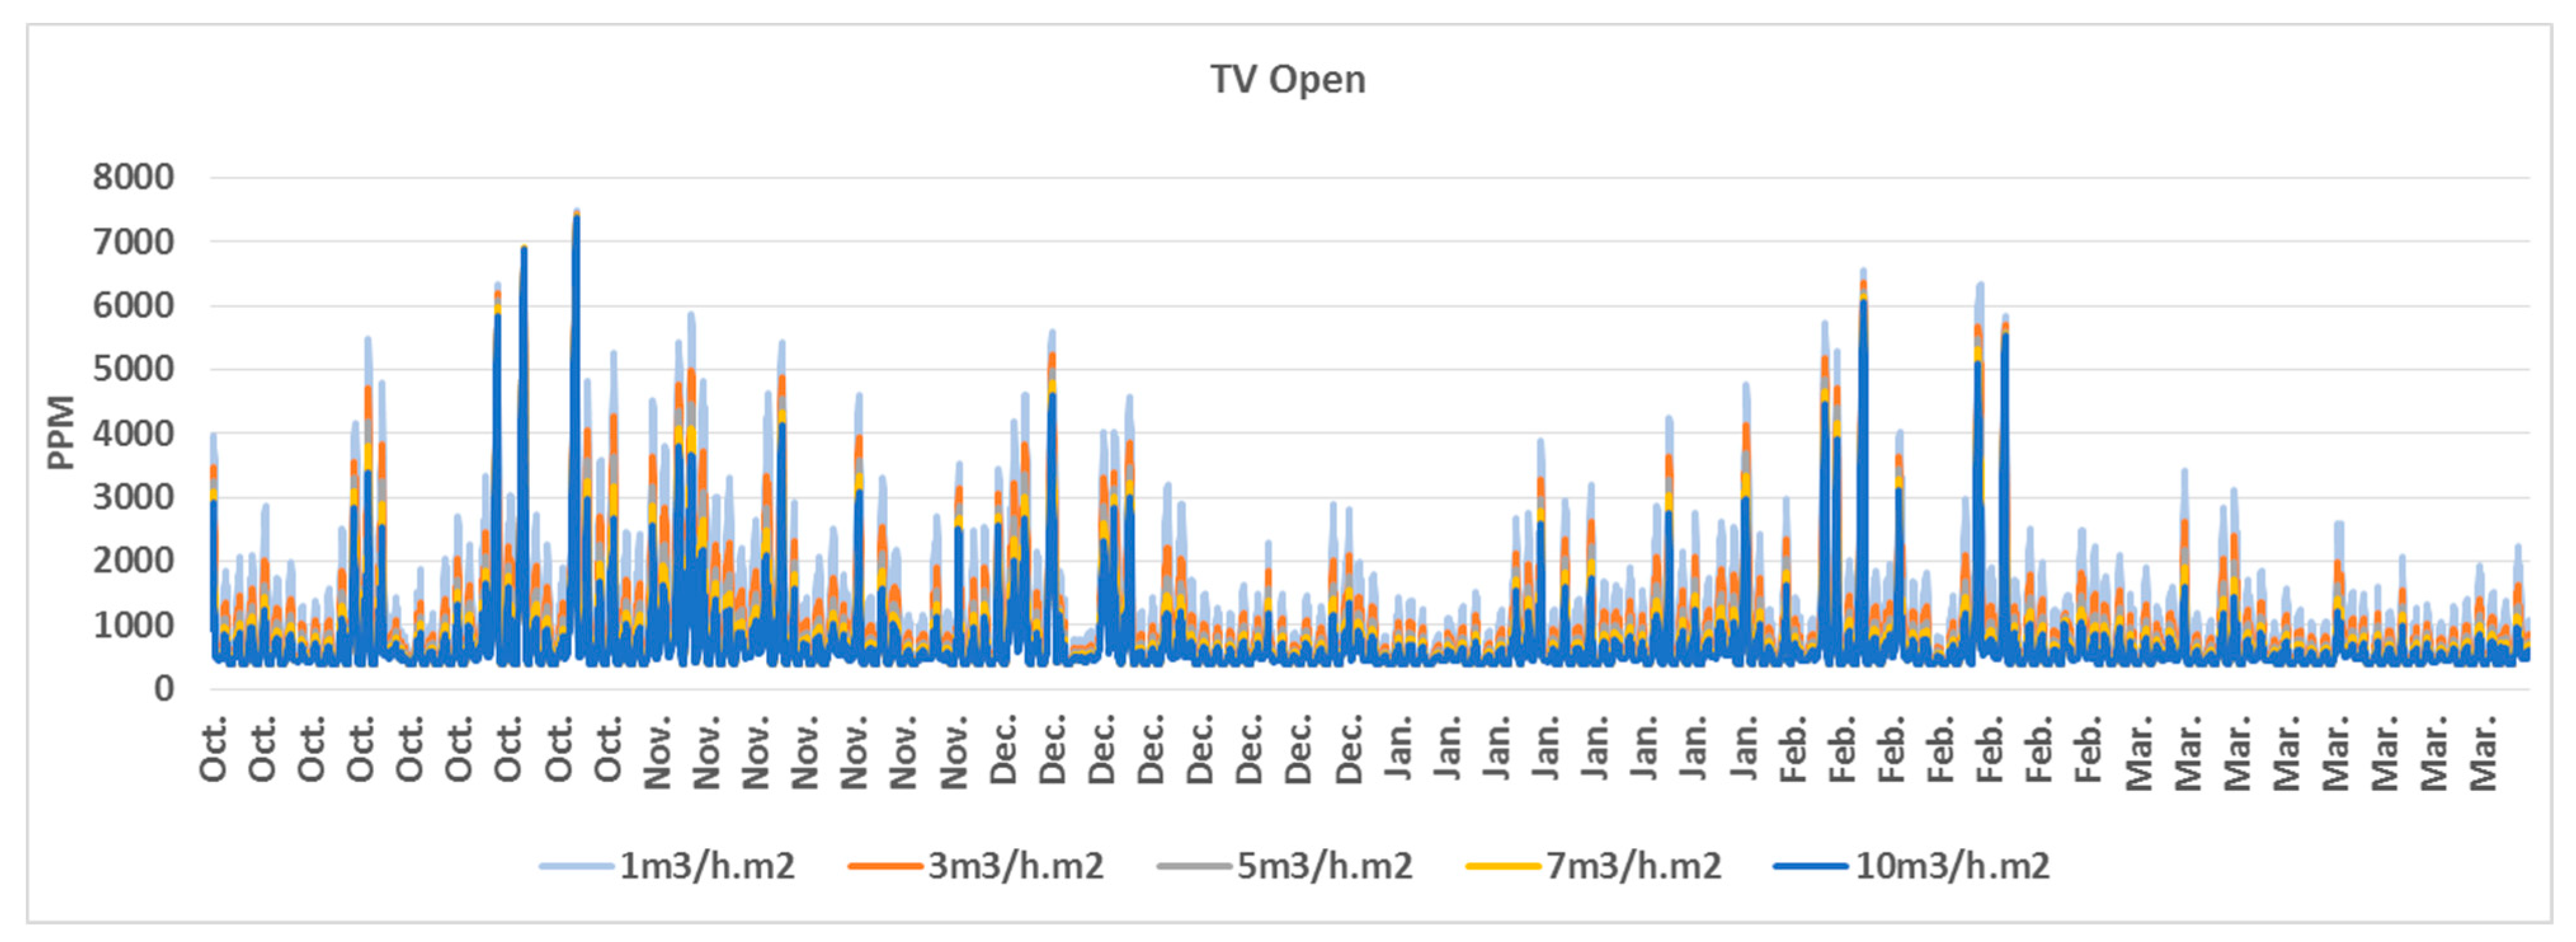
Opening the TV also significantly improved the IAQ. The best conditions in terms of IAQ was, as expected, achieved for the air permeability of 10 m
3/h.m
2@50 Pa. For this condition, CO
2 concentration was above 1000 ppm and 1500 ppm for 14.5% and 6.8% of the occupied periods, respectively. The CO
2 concentration was above 5000 ppm for 0.6% of the times. This implies a 73%, 78% and 60% improvement in the CO
2 concentration over the 1 m
3/h.m
2@50 Pa air permeability case for 1000, 1500 and 5000 ppm, respectively.
Figure 2 and
Table 3 summarise the results of simulations for different air permeability values when TV was open.
According to the results, increasing the air permeability by 2 m3/h.m2@50 Pa and/or opening the TV had almost identical effects on the CO2 concentration values. For instance a 3 m3/h.m2@50 Pa air permeability with open TV would result in almost the same CO2 concentration levels for the air permeability of 5 m3/h.m2@50 Pa with closed TV.
Figure 2.
CO2 concentration values for different air permeability rates Oct.-Mar. (TV Open).
Figure 2.
CO2 concentration values for different air permeability rates Oct.-Mar. (TV Open).
Table 3.
Percentage of occupied time when CO2 concentration was above, 1000, 1500 and 5000 ppm (TV Open).
Table 3.
Percentage of occupied time when CO2 concentration was above, 1000, 1500 and 5000 ppm (TV Open).
| Air Permeability Values (TV Open) | 1 m3/h.m2@ 50 Pa | 3 m3/h.m2@50 Pa | 5 m3/h.m2@ 50 Pa | 7 m3/h.m2@ 50 Pa | 10 m3/h.m2@ 50 Pa |
|---|
| CO2 Concentration |
|---|
| 1000 ppm | 54.3% | 36.7% | 25.8% | 19.4% | 14.5% |
| 1500 ppm | 31.1% | 17.5% | 11.7% | 8.7% | 6.8% |
| 5000 ppm | 1.5% | 1.0% | 0.7% | 0.6% | 0.6% |
3.2. Risk of Condensation
This section evaluates the effects of different occupancy conditions/lifestyles (“Dry”, “Moist” and “Wet” occupancy) on the risk of condensation. The results show strong relations between the risk of condensation and lifestyle as an indicator of generated moisture by the occupants during the day. According to the results, there is a very high risk of condensation for all Wet occupancy conditions regardless of the air permeability and/or the position of the TV. The situation moderately improved for the Moist and considerably improved for the Dry occupancy conditions.
Table 4 and
Table 5 summarise the risk of condensation for different air permeability values and lifestyle conditions with and without TV.
The risk of condensation was negligible for almost all Dry occupancy conditions except for the 1 m3/h.m2@50 Pa air permeability during October when 159 h of condensation was observed when the TV was closed. Higher air permeability did not generally improve the situation although it greatly improved the conditions in October for the 1 m3/h.m2@50 Pa air permeability. Similar effects were observed for the rest of airtightness rates when the TV was opened. The results also indicate that, apart from October, opening the TV did not improve the conditions, and marginally deteriorated the situations resulting in slightly higher risk of condensation. A possible explanation for this may be that opening the TV would reduce the surface temperature of the window and surrounding walls resulting in higher risk of condensation. More research is required in this respect.
Natural and background ventilation due to the higher air permeability and/or through TVs, seem to be adequate for the dry occupancy conditions only. Wet occupancy conditions increased the risk of condensation by up to 2.7 times compared to the Moist conditions. Yet, none of the Moist and Wet occupancy conditions achieved desirable results as very high risk of condensation was observed for these conditions compared to the Dry occupancy condition. Either mechanical or purge ventilation through windows/vents may be required to mitigate the risk of condensation in these conditions.
Table 4.
Number of hours when there was a risk of condensation for different air permeability rates and occupancy conditions (TV Closed).
Table 4.
Number of hours when there was a risk of condensation for different air permeability rates and occupancy conditions (TV Closed).
| TV Closed | 1 m3/h.m2@ 50 Pa | 3 m3/h.m2@ 50 Pa | 5 m3/h.m2@ 50 Pa | 7 m3/h.m2@50 Pa | 10 m3/h.m2@ 50 Pa |
|---|
| | Dry Occupancy |
| October | 159.1 | 5.7 | 0.0 | 0.0 | 0.0 |
| November | 40.2 | 0.0 | 0.1 | 0.1 | 0.3 |
| December | 9.2 | 3.1 | 3.5 | 4.0 | 5.2 |
| January | 0.4 | 0.9 | 1.5 | 2.2 | 3.5 |
| February | 3.2 | 6.5 | 8.6 | 9.9 | 11.9 |
| March | 0.2 | 0.4 | 0.8 | 1.3 | 1.7 |
| Total (Hours) | 212.3 | 16.6 | 14.5 | 17.5 | 22.6 |
| | Moist Occupancy |
| October | 161.4 | 21.8 | 12.6 | 18.5 | 24.0 |
| November | 71.4 | 80.4 | 105.6 | 117.8 | 125.6 |
| December | 211.9 | 222.5 | 229.9 | 235.6 | 241.3 |
| January | 286.3 | 323.8 | 331.6 | 335.1 | 338.7 |
| February | 232.8 | 250.0 | 264.5 | 271.3 | 277.1 |
| March | 72.6 | 117.6 | 139.3 | 149.7 | 161.4 |
| Total (Hours) | 1036.4 | 1016.1 | 1083.5 | 1128 | 1168.1 |
| | Wet Occupancy |
| October | 206.9 | 133.8 | 185.7 | 224.3 | 257.1 |
| November | 305.7 | 357.7 | 393.3 | 411.8 | 422.1 |
| December | 634.2 | 593.7 | 569.1 | 558.4 | 546.2 |
| January | 613.7 | 580.2 | 561.9 | 549.2 | 524.4 |
| February | 556.2 | 517.9 | 506.6 | 489.7 | 478.9 |
| March | 479.2 | 477.7 | 474.0 | 472.2 | 470.5 |
| Total (Hours) | 2795.9 | 2661 | 2690.6 | 2705.6 | 2699.2 |
Table 5.
Number of hours when there was a risk of condensation for different air permeability rates and occupancy conditions (TV Open).
Table 5.
Number of hours when there was a risk of condensation for different air permeability rates and occupancy conditions (TV Open).
| TV Open | 1 m3/h.m2@ 50 Pa | 3 m3/h.m2@ 50 Pa | 5 m3/h.m2@ 50 Pa | 7 m3/h.m2@ 50 Pa | 10 m3/h.m2@ 50 Pa |
|---|
| | Dry Occupancy |
| October | 3.5 | 0.0 | 0.0 | 0.0 | 0.0 |
| November | 0.0 | 0.1 | 0.1 | 0.3 | 0.5 |
| December | 2.4 | 3.3 | 4.2 | 5.0 | 6.1 |
| January | 0.9 | 1.5 | 2.2 | 3.1 | 4.1 |
| February | 6.5 | 8.5 | 9.9 | 11.4 | 13.0 |
| March | 0.3 | 0.8 | 1.4 | 1.6 | 1.9 |
| Total (Hours) | 13.6 | 14.2 | 17.8 | 21.4 | 25.6 |
| | Moist Occupancy |
| October | 12.0 | 11.4 | 14.3 | 18.5 | 22.6 |
| November | 78.8 | 104.4 | 117.5 | 122.9 | 129.3 |
| December | 221.4 | 230.1 | 234.9 | 240.2 | 243.8 |
| January | 324.8 | 331.7 | 335.3 | 337.7 | 340.0 |
| February | 250.1 | 264.1 | 270.6 | 275.0 | 279.8 |
| March | 115.5 | 138.6 | 150.0 | 158.1 | 166.6 |
| Total (Hours) | 1002.6 | 1080.3 | 1122.6 | 1152.4 | 1182.1 |
| | Wet Occupancy |
| October | 133.7 | 187.1 | 225.9 | 248.5 | 271.3 |
| November | 356.4 | 395.3 | 412.4 | 419.8 | 427.4 |
| December | 597.6 | 570.4 | 559.0 | 551.8 | 543.0 |
| January | 580.3 | 562.4 | 549.2 | 533.0 | 514.3 |
| February | 518.1 | 506.9 | 489.9 | 481.9 | 474.4 |
| March | 476.9 | 474.0 | 472.0 | 471.2 | 469.5 |
| Total (Hours) | 2663 | 2696.1 | 2708.4 | 2706.2 | 2699.9 |
3.3. Energy Consumption
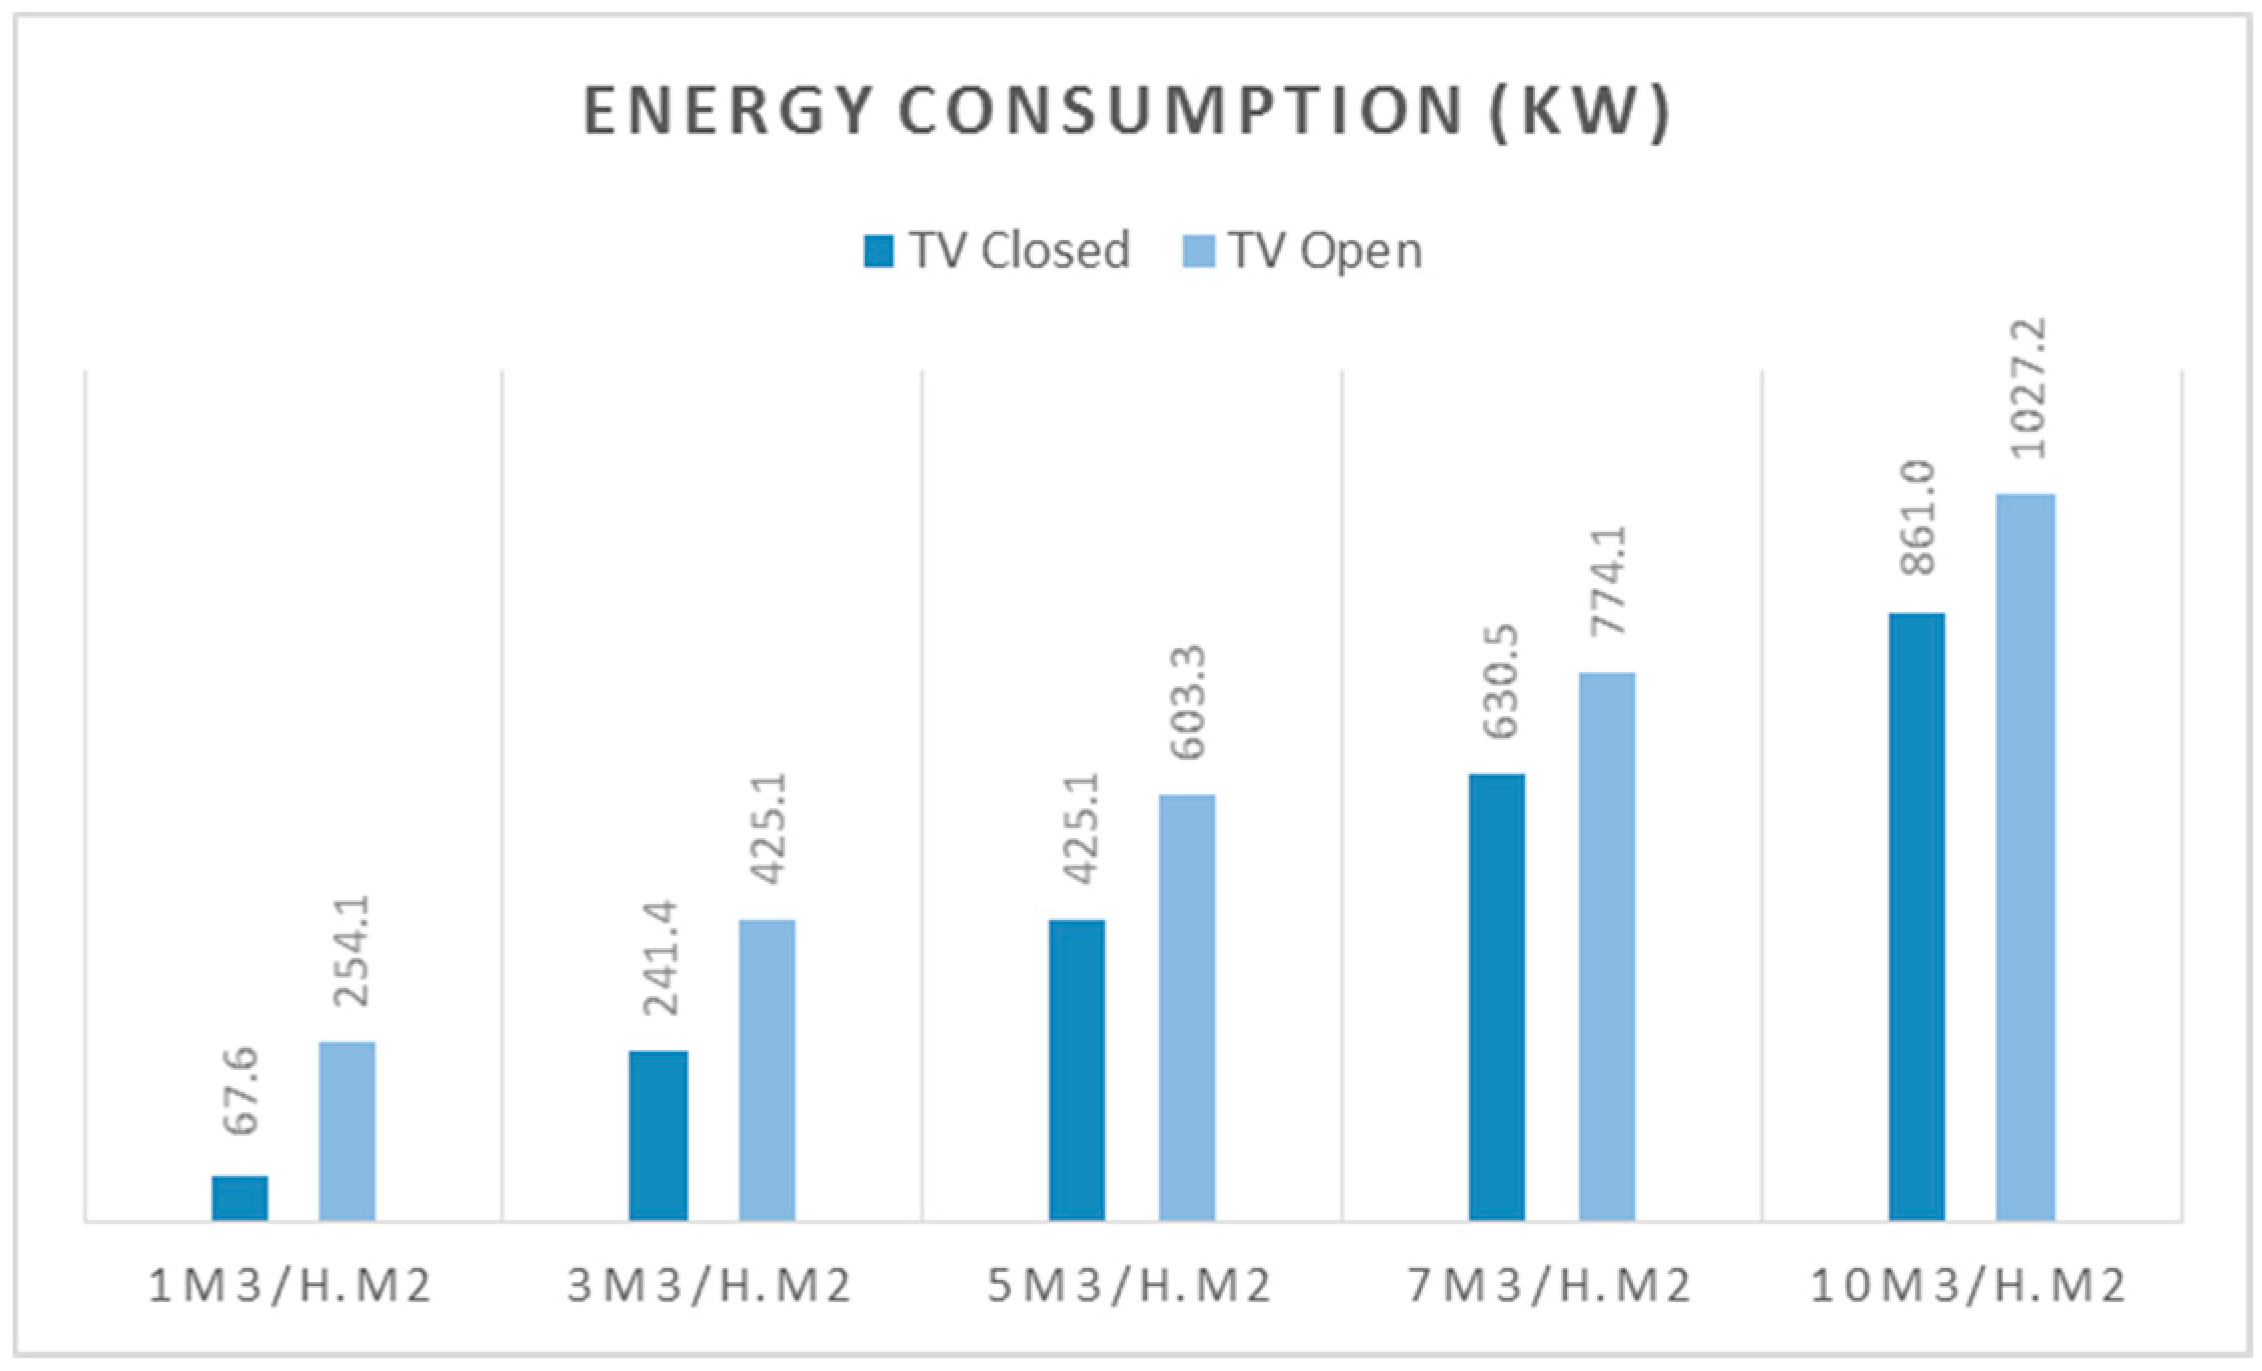
Energy consumption was also investigated for all of the scenarios. The results of the simulations reveal direct relations between energy consumption and ventilation rates in general, and air permeability and background ventilation in particular. According to the results, energy consumption during heating seasons increased by around thirteen times (from 7.5 kW/m
2 to 96.6 kW/m
2) for the closed TV condition when the air permeability increased from 1 to 10 m
3/h.m
2@50 Pa (such an increase in energy consumption may not occur in real world conditions). For the open TV, energy consumption increased by around four times. It should be noted that the background ventilation is necessary to achieve acceptable IAQ in airtight buildings, and therefore, this fourfold increase in energy consumption may be a better reflection of the real world conditions.
Figure 3 summarises the energy performance of the building from October to March for different air permeability ranges when the TV was open or closed.
Figure 3.
Total energy consumption between October and March for different air permeability rates when TV was open or closed.
Figure 3.
Total energy consumption between October and March for different air permeability rates when TV was open or closed.
Table 6 and
Table 7 also compare the relative increases in energy consumption for different scenarios during the heating seasons. According to the results of simulations for the TV open conditions, increasing air permeability by 2 m
3/h.m
2@50 Pa could increase the energy consumptions between 29%–42%. In scenarios where TV was closed, this figure was between 37%–76% excluding the 1 m
3/h.m
2@50 Pa air permeability (where there results are unrealistically low). The energy consumption increased by 2.4 times when comparing 3 m
3/h.m
2@50 Pa with 10 m
3/h.m
2@50 Pa for the TV open conditions. This figure was around 4 times when comparing 1 m
3/h.m
2@50 Pa with 10 m
3/h.m
2@50 Pa. The energy consumption increased by 3.6 times when comparing 3 m
3/h.m
2@50 Pa with 10 m
3/h.m
2@50 Pa for the TV closed conditions.
Table 6.
Total energy consumption for different air permeability rates (TV Closed).
Table 6.
Total energy consumption for different air permeability rates (TV Closed).
| Air Permeability Values (TV Closed) | 1 m3/h.m2@ 50 Pa | 3 m3/h.m2@ 50 Pa | 5 m3/h.m2@ 50 Pa | 7 m3/h.m2@ 50 Pa | 10 m3/h.m2@ 50 Pa |
|---|
| Energy Consumption | | | | | |
|---|
| Annual (KW) | 68.9 | 265.2 | 493.6 | 713.8 | 1044.2 |
| Heating Seasons (KW) | 67.6 | 241.4 | 425.1 | 630.5 | 861.0 |
| Relative Increase % | 100.0% | 357.3% | 629.2% | 933.2% | 1274.3% |
| Relative Increase Compared to the previous % | N/A | 100% | 176.1% | 148.3% | 136.6% |
Table 7.
Total energy consumption for different air permeability rates (TV Open).
Table 7.
Total energy consumption for different air permeability rates (TV Open).
| Air Permeability Values (TV Open) | 1 m3/h.m2@ 50 Pa | 3 m3/h.m2@ 50 Pa | 5 m3/h.m2@ 50 Pa | 7 m3/h.m2@ 50 Pa | 10 m3/h.m2@ 50 Pa |
|---|
| Energy Consumption |
|---|
| Annual (KW) | 269.2 | 495.0 | 718.6 | 934.0 | 1249.9 |
| Heating Seasons (KW) | 254.1 | 425.1 | 603.3 | 774.1 | 1027.2 |
| Relative Increase % | 100.0% | 167.3% | 237.4% | 304.7% | 404.3% |
| Relative Increase Compared to the previous % | N/A | 100% | 141.9% | 128.5% | 132.7% |
4. Conclusions
Improving the energy performance of new and existing buildings has been one of the major priorities of the UK Government during the recent years. National schemes such as the Green Deal and Warm Front intend to improve energy efficiency of buildings through better insulation and reduced air permeability. However, improving building energy performance without considering its effects on the other factors such as indoor air quality may negatively affect the health and wellbeing of the occupants. This paper demonstrated the effects of different air permeability rates and background ventilation on the energy performance, indoor air quality (IAQ) and risk of condensation in domestic buildings.
The results of this study reveal invers relations between energy performance and indoor air quality/ventilation rates in buildings. Higher ventilation rates by means of infiltration and/or background ventilation through, for example, Trickle Vents (TV) significantly decreased the risk of unacceptable IAQ; however, they increased the energy consumption by up to 4 times. Although very low air permeability rates significantly reduce energy consumption, they may not be capable of providing acceptable IAO if they rely on background ventilation alone. Larger ventilation areas and/or mechanical ventilation may therefore be required to achieve acceptable indoor air quality in airtight buildings.
The results of this study also reveal that occupants’ behaviours/occupancy conditions are important factors in mitigating or increasing the risk of condensation in naturally ventilated buildings. Risk of condensation increased by up to 2.7 times for Wet occupancy conditions compared to Moist occupancy. Nevertheless, neither higher air permeability nor background ventilation through TVs are effective in controlling condensation in buildings with Moist and/or Wet occupancy conditions. However, for the Dry occupancy conditions, where the excess vapour pressure is not more than 0.3 kPa of the internal vapour pressure, all air permeability rates along with the background ventilation through TVs can achieve acceptable results in terms of the risk of condensation. For higher moisture generation rates, purge or mechanical ventilation may be required to effectively remove the excess moisture at the source. This said, it should be noted that other factors such as poor ventilation, design and detailing can also contribute to high risks of condensation, damp and mould growth in new and refurbished buildings.
Based on the results of this study, it could be argued that for naturally ventilated homes with Dry occupancy conditions, an air permeability of 3 m3/h.m2@50 Pa could achieve optimum results in terms of energy consumption and IAQ if adequate background ventilation is provided to achieve acceptable indoor air quality (e.g., CO2 concentrations less than 1% of the occupied times above 5000 ppm). For the buildings where TV or other means of background ventilation is not provided, a minimum air permeability of 10 m3/h.m2@50 Pa is recommended to achieve acceptable IAQ. It should be noted that these figures may apply to households with a maximum of two occupants. For bigger households, higher air permeability rates and/or background ventilation may be required to achieve acceptable results.
Providing more airtight buildings along with controllable background ventilation may improve occupants’ perceived thermal comfort by giving them more control over their environments. However as people are usually unaware of CO
2 levels in the environment, [
32] they may keep the TVs closed which may in turn increase the risk of poor indoor air quality particularly during colder seasons when occupants are less likely to open the windows/vents. Moreover, in view of the high costs of achieving airtight buildings, as far as energy performance and IAQ are concerned, it may be more economical to consider higher air permeability rates instead of increasing airtightness along with more background ventilation to achieve acceptable IAQ in naturally ventilated buildings.
In summary, the results of this study show that increasing airtightness may escalate the risk of poor IAQ by reducing the rate of ventilation; however, this relation was not as evident for the risks of condensation. The latter requires more investigation. The current building regulations and standards are less concerned about the IAQ in general and generated moisture in particular (as the most critical pollutant in domestic buildings [
33,
34]). It is therefore recommended to include detailed CO
2 and moisture control strategies/requirements in the building regulations and standards, as well as in the national energy efficiency schemes, not only to improve the energy performance of buildings but also to improve the health and wellbeing of the occupants of new and refurbished buildings. It is also recommended to refurbish buildings by carefully considering their current performance and evaluating the effects of refurbishment strategies on their future performance in terms of changes in risks of condensation and poor IAQ. Moreover, it should be noted that people’s behaviours and lifestyles may not change as quickly as the building regulations are. Any modifications in the building regulations and standards should therefore take into account the effects of occupancy conditions and occupants’ behaviours in order to avoid negatively affecting their health and wellbeing.


