
Ranking Water Transparency of Dutch Stock-Listed Companies


Abstract
:1. Introduction
2. Method and Data

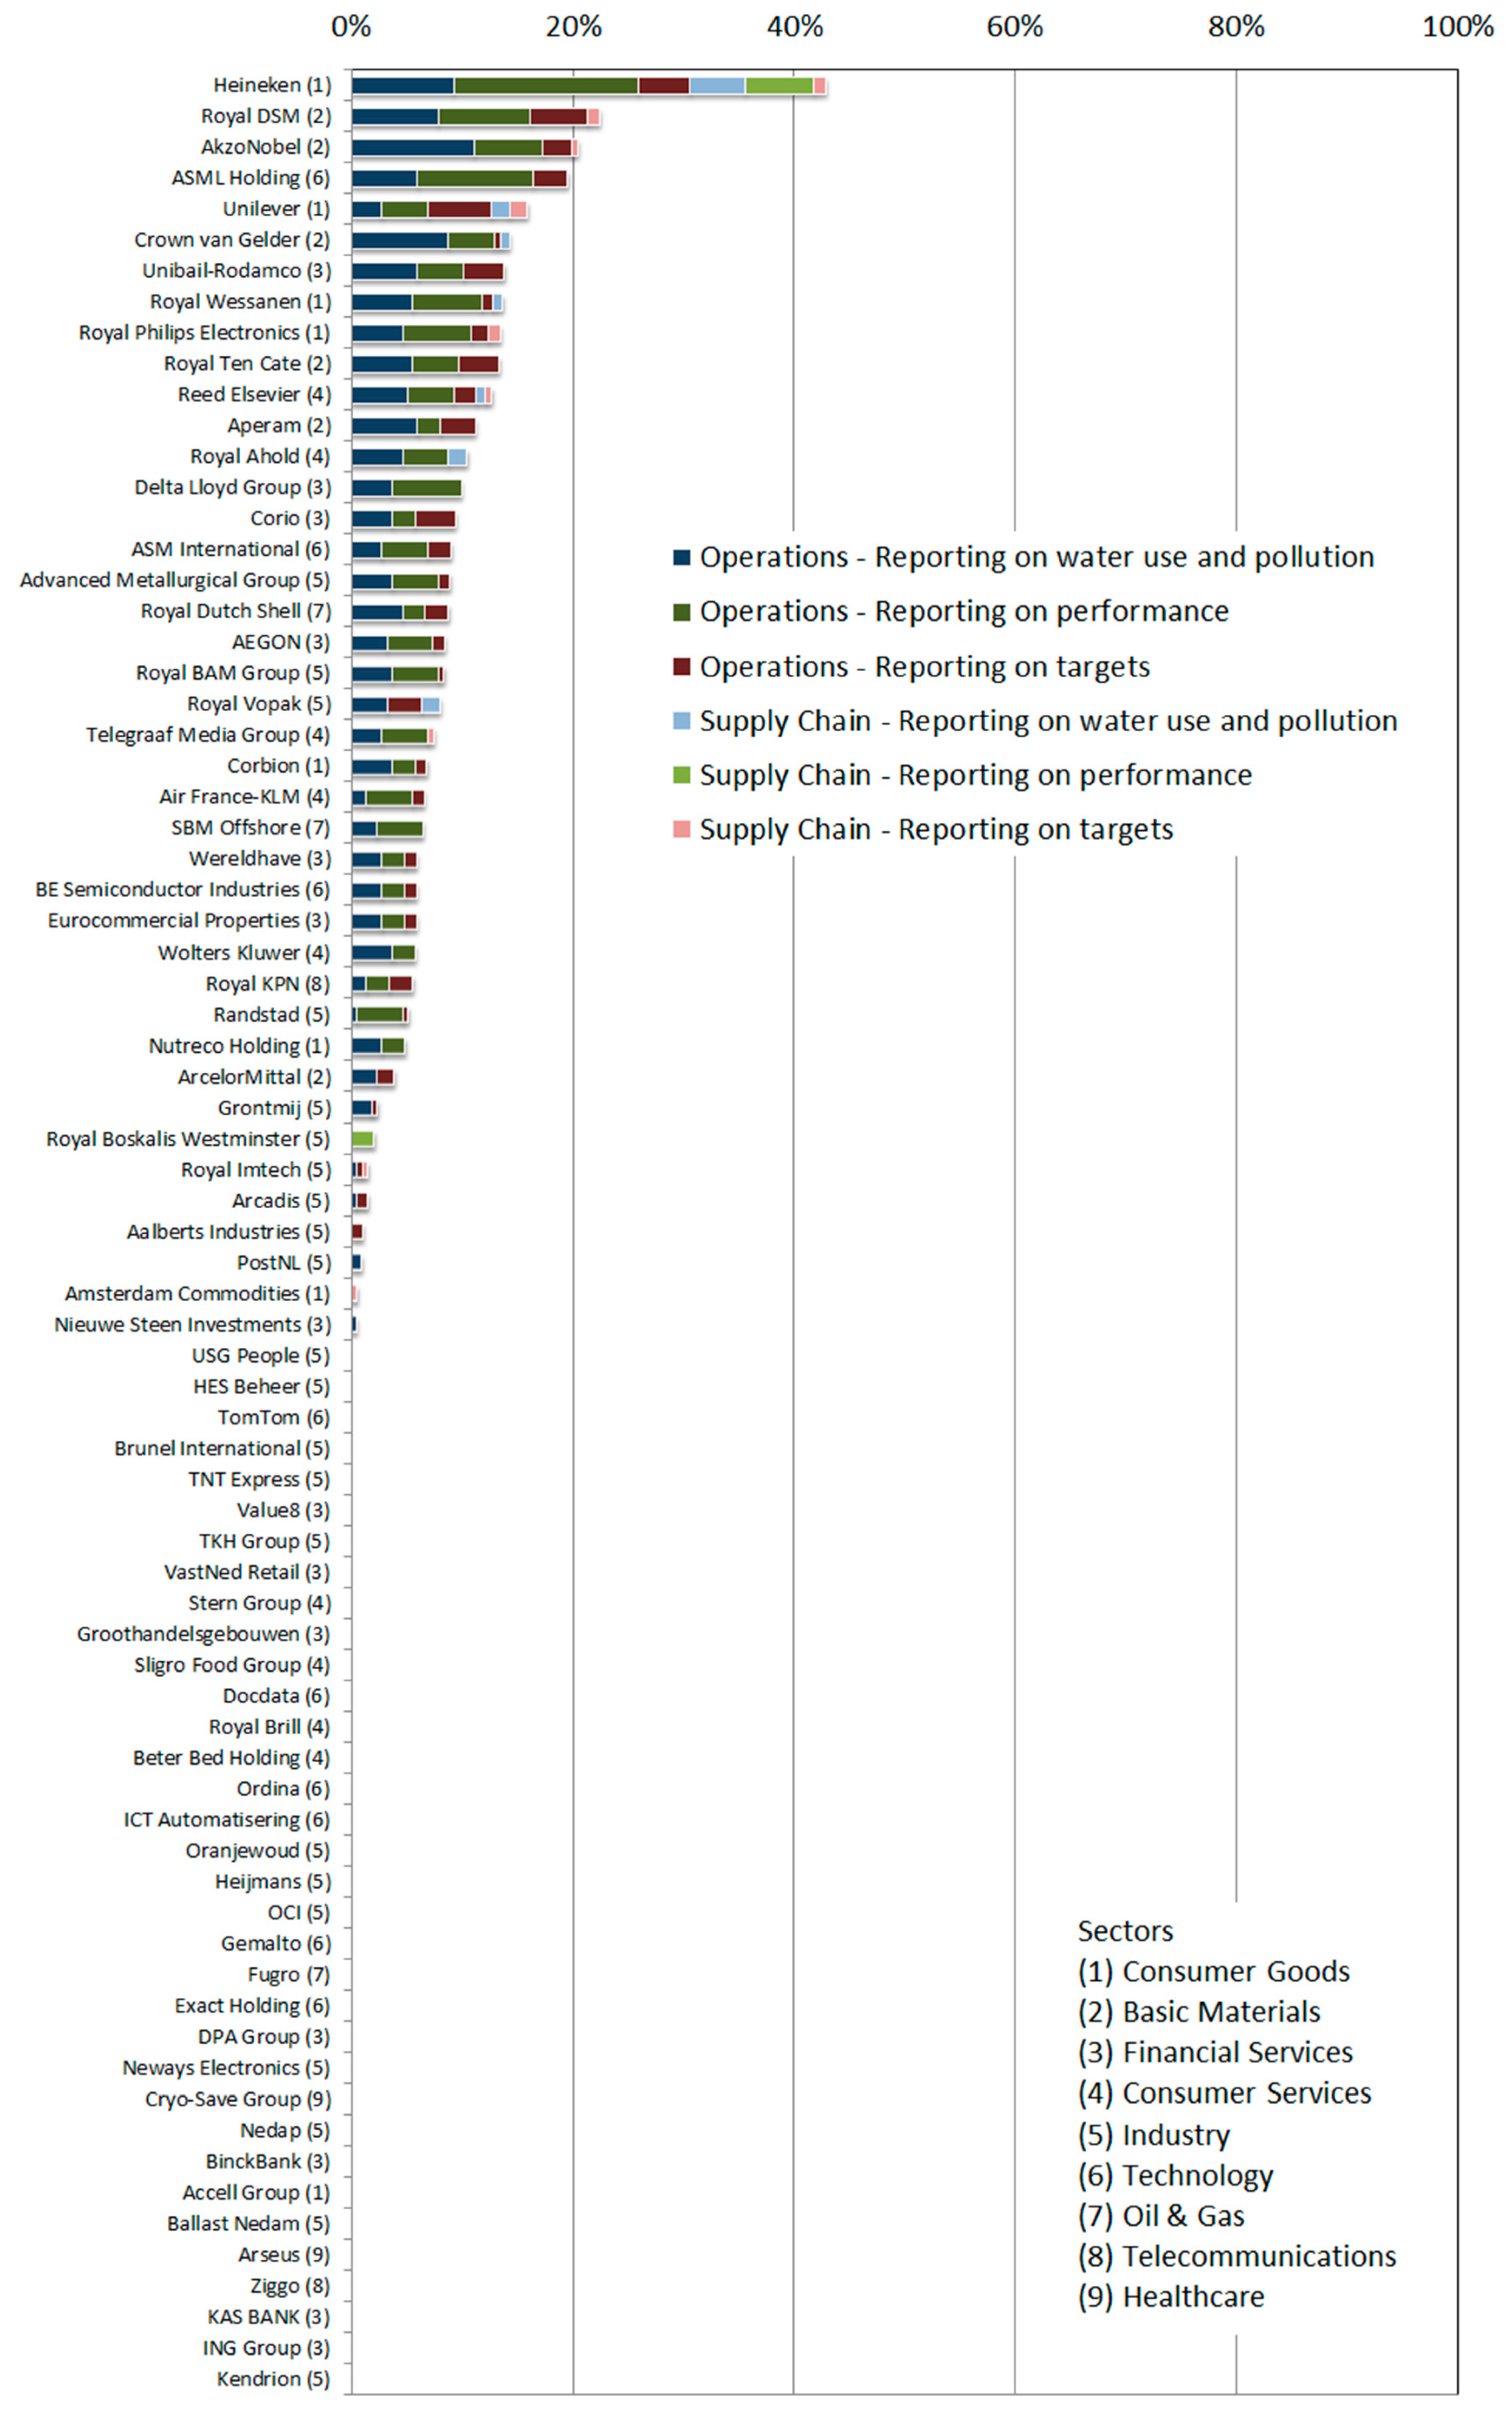
| Operations | Supply chain | |
|---|---|---|
| Reporting on water use and pollution | Does the company report indicators related to water use and pollution in its operations? | Does the company report indicators related to water use and pollution in its supply chain? |
| Reporting on performance | Does the company report about its operational water performance by comparing its performance to previous years or to other companies from the same sector? | Does the company report about its supply-chain water performance by comparing its performance to previous years or to other companies from the same sector? |
| Reporting on targets | Does the company report about its targets for improving its operational performance? How detailed are these targets? Have deadlines been set? Has some progress already been made? Have programs to reach the targets been set up? | Does the company report about its targets for improving its supply-chain performance? How detailed are these targets? Have deadlines been set? Has some progress already been made? Have programs to reach the targets been set up? |
3. Results

4. Discussion
| Maximum score (out of 16.7%) | Number of reporting companies (out of 75) | |
|---|---|---|
| Operations | ||
| reporting on water use and pollution | 11.1% | 38 |
| reporting on performance | 16.7% | 31 |
| reporting on targets | 5.7% | 31 |
| Supply chain | ||
| reporting on water use and pollution | 5.0% | 7 |
| reporting on performance | 6.3% | 2 |
| reporting on targets | 1.6% | 9 |
5. Conclusions
Acknowledgments
Author Contributions
Appendix 1
- 1.1:
- Does the company report about the total volume of water withdrawn?
- 1.2:
- Does the company report about its operational blue water footprint (net volume of water withdrawal)?
- 1.3:
- Does the company report about its water sources?
- 1.4:
- Does the company report about the total volume of water recycled and reused?
- 1.5:
- Does the company report about its water efficiency or blue water footprint per unit of product?
- 1.6:
- Does the company report about the total volume of water discharged and the discharge destinations?
- 1.7:
- Does the company report about the quality of the water discharged and its grey water footprint?
- 1.8:
- Does the company report about water pollution per unit of product?
- 1.9:
- Does the company report about water risks?
- 2.1:
- Does the company compare its performance to a previous (reference) year?
- 2.2:
- Does the company compare its own performance to the performance of other companies?
- a:
- Specific: does the company mention targets for its operational use?
- a:
- Measurable: are the targets quantified?
- c:
- Assignable: is it clear who is assigned to realize the targets?
- d:
- Realistic: has some progress already been made?
- e:
- Time-related: does the report mention targets for the short term (≤ 1 year)?
- f:
- Time-related: does the report mention targets for the long term (> 1 year)?
- g:
- Does the company mention programs or plans that have been set up for reaching the targets?
- h:
- Does the company mention investments that have been made for reaching the targets?
- 4.1:
- Does the company report about its water use along its supply chain?
- 4.2:
- Does the company report about its green and blue supply-chain water footprint?
- 4.3:
- Does the company report about the water sources of the supply chain?
- 4.4:
- Does the company report about water quality and its grey water footprint along the supply chain?
- 4.5:
- Does the company report about water risks related to the areas its suppliers operate in?
- 5.1:
- Does the company compare its supply chain performance to a previous (reference) year?
- 5.2:
- Does the company compare its own supply chain performance to the supply chain performance of other companies?
- a:
- Specific: does the company mention targets for its supply chain?
- b:
- Measurable: are the targets quantified?
- c:
- Assignable: is it clear who is assigned to realize the targets?
- d:
- Realistic: has some progress already been made?
- e:
- Time-related: does the report mention targets for the short term (≤1 year)?
- f:
- Time-related: does the report mention targets for the long term (>1 year)?
- g:
- Does the company mention programs or plans that have been set up for reaching the targets?
- h:
- Does the company mention investments that have been made for reaching the targets?
Appendix 2
| AEX Companies | Source documents |
|---|---|
| Aegon | Annual Report Supplemental Annual Report 2013 Aegon’s 2013 Integrated Revie www.aegon.com |
| Royal Ahold | Annual Report 2013 Responsible Retailing Report 2013 www.ahold.com |
| Akzo Nobel | Annual Report 2013 www.akzonobel.com |
| ArcelorMittal | Annual Report 2013 corporate.arcelormittal.com |
| ASML | Annual Report 2013 Corporate Responsibility Report 2013 www.asml.com |
| Boskalis | Annual Report 2013 CSR Report 2013 www.boskalis.com |
| Corio | Annual Report 2013 CSR Report 2013 www.corio-eu.com |
| Delta Lloyd Group | Annual Report 2013 www.deltalloydgroep.com |
| Royal DSM | Annual Report 2013 www.dsm.com |
| Fugro | Annual Report 2013 www.fugro.com |
| Gemalto | Annual Report 2013 www.gemalto.com |
| Heineken | Annual Report 2013 Sustainability Report 2013 www.heineken.com |
| ING Group | Annual Report 2013 Sustainability Report 2013 ING Environmental and Social Risk Framework www.ing.com |
| Royal KPN | Annual Report 2013 Annual Report 2013 Social & Environmental Figures corporate.kpn.com |
| OCI | Annual Report 2013 www.ocinv.nl |
| Philips | Annual Report 2013 www.philips.com |
| Randstad Holding | Annual Report 2013 www.randstad.com |
| Reed Elsevier | Annual Report 2013 Corporate Responsibility Report 2013 www.reedelsevier.com |
| SBM Offshore | Annual Report 2013 Report on selected Key Sustainability Indicators 2013 www.sbmoffshore.com |
| Royal Dutch Shell | Annual Report 2013 Sustainability Report 2013 www.shell.com |
| TNT Express | Annual Report 2013 www.tnt.com |
| Unibail-Rodamco | Annual and Sustainability Report 2013 www.unibail-rodamco.com |
| Unilever | Annual Report 2013 Unilever Sustainable Living Plan 2013 www.unilever.com |
| Wolters Kluwer | Annual Report 2013 Sustainability Report 2013 www.wolterskluwer.com |
| Ziggo | Annual Report 2013 www.ziggo.com |
| AMX Companies | Source documents |
| Aalberts Industries | Annual Report 2013 www.aalberts.nl |
| Accell Group | Annual Report 2013 www.accell-group.com |
| Air France-KLM | Registration Document 2013 Including the annual financial report www.airfranceklm.com |
| Aperam | Annual Report 2013 Sustainability Report “Made for Life” 2013 Made for Life Report Supplement C www.aperam.com |
| Arcadis | Annual Report 2013 www.arcadis.com |
| Arseus | Annual Report 2013 www.arseus.com |
| ASM International | Annual Report 2013 www.asm.com |
| BAM Group | Annual Report 2013 Sustainability Report 2013 www.bam.eu |
| Binckbank | Annual Report 2013 www.binck.com |
| Brunel International | Annual Report 2013 www.brunel.et |
| Corbion | Annual Report 2013 www.corbion.com |
| Eurocommercial Properties | Annual Report 2012/2013 www.eurocommercialproperties.com |
| Exact Holding | Annual Report 2013 www.exact.com |
| Royal Imtech | Annual Report 2013 Sustainability Report 2013 Code of Sustainable Supply imtech.com |
| Nieuwe Steen Investments | Annual Report 2013 www.nsi.nl |
| Nutreco | Annual Report 2013 Sustainability Vision 2020 www.nutreco.com |
| PostNL | Annual Report 2013 www.postnl.com |
| Sligro Food Group | Annual Report 2013 CSR Report 2013 GRI Table 2013 www.sligrofoodgroup.nl |
| Royal Ten Cate | Annual Report 2013 www.tencate.com |
| TKH Group | Annual Report 2013 CSR Report 2013 www.tkhgroup.com |
| TomTom | Annual Report 2013 www.tomtom.com |
| USG People | Annual Report 2013 www.usgpeople.com |
| VastNed Retail | Annual Report 2013 www.vastned.com |
| Royal Vopak | Annual Report 2013 Sustainability Report 2013 www.vopak.com |
| Wereldhave | Annual Report 2013 Sustainability Report 2013 www.wereldhave.com |
| AscX Companies | Source documents |
| Amsterdam Commodities | Annual Report 2013 www.acomo.nl |
| Advanced Metallurgical Group | Annual Report 2013 www.amg-nv.com |
| Ballast Nedam | Annual Report 2013 www.ballast-nedam.com |
| BE Semiconductor | Annual Report 2013 www.besi.com |
| Beter Bed | Annual Report 2013 2013 GRI Index www.beterbedholding.com |
| Royal Brill | Annual Report 2013 www.brill.com |
| Cryo-Save Group | Annual Report 2013 www.cryo-save.com |
| Crown van Gelder | Annual Report 2013 www.cvg.nl |
| Docdata | Annual Report 2013 www.docdatanv.com |
| DPA Group | Annual Report 2013 www.dpa.nl |
| Grontmij | Annual Report 2013 www.grontmij.com |
| Groothandelsgebouwen | Annual Report 2013 www.ghg.nl |
| Heijmans | Annual Report 2013 Sustainability Report 2013 www.heijmans.nl |
| HES Beheer | Annual Report 2013 www.hesbeheer.nl |
| ICT Automatisering | Annual Report 2013 www.ict.eu |
| KAS BANK | Annual Report 2013 www.kasbank.com |
| Kendrion | Annual Report 2013 CSR Report 2013 www.kendrion.com |
| Nedap | Annual Report 2013 www.nedap.com |
| Neways Electronics | Annual Report 2013 www.neways.nl |
| Oranjewoud | Annual Report 2013 www.oranjewoudnv.nl |
| Ordina | Annual Report 2013 www.ordina.com |
| Stern Group | Annual Report 2013 www.sterngroep.nl |
| Telegraaf Media Groep | Annual Report 2013 corporate.tmg.nl |
| Value8 | Annual Report 2013 www.value8.com |
| Royal Wessanen | Annual Report 2013 Sustainability Factsheet 2013 Wessanen GRI Table 2013 wessanen.com |
Appendix 3
| Company | Operations | Supply chain | Tot al score overall | |||||||
|---|---|---|---|---|---|---|---|---|---|---|
| Reporting on: | Total score for operations | Reporting on: | Total score for supply chain | |||||||
| Water use and pollution | Performance | Targets | Water use and pollution | Performance | Targets | |||||
| Heineken | 9.3% | 16.7% | 4.7% | 30.6% | 5.0% | 6.3% | 1.0% | 12.3% | 42.9% | |
| Royal DSM | 7.9% | 8.3% | 5.2% | 21.4% | 0.0% | 0.0% | 1.0% | 1.0% | 22.5% | |
| AkzoNobel | 11.1% | 6.3% | 2.6% | 20.0% | 0.0% | 0.0% | 0.5% | 0.5% | 20.5% | |
| ASML Holding | 6.0% | 10.4% | 3.1% | 19.6% | 0.0% | 0.0% | 0.0% | 0.0% | 19.6% | |
| Unilever | 2.8% | 4.2% | 5.7% | 12.7% | 1.7% | 0.0% | 1.6% | 3.2% | 15.9% | |
| Crown van Gelder | 8.8% | 4.2% | 0.5% | 13.5% | 0.8% | 0.0% | 0.0% | 0.8% | 14.3% | |
| Unibail-Rodamco | 6.0% | 4.2% | 3.6% | 13.8% | 0.0% | 0.0% | 0.0% | 0.0% | 13.8% | |
| Royal Wessanen | 5.6% | 6.3% | 1.0% | 12.8% | 0.8% | 0.0% | 0.0% | 0.8% | 13.7% | |
| Royal Philips Electronics | 4.6% | 6.3% | 1.6% | 12.4% | 0.0% | 0.0% | 1.0% | 1.0% | 13.5% | |
| Royal Ten Cate | 5.6% | 4.2% | 3.6% | 13.4% | 0.0% | 0.0% | 0.0% | 0.0% | 13.4% | |
| Reed Elsevier | 5.1% | 4.2% | 2.1% | 11.3% | 0.8% | 0.0% | 0.5% | 1.4% | 12.7% | |
| Aperam | 6.0% | 2.1% | 3.1% | 11.2% | 0.0% | 0.0% | 0.0% | 0.0% | 11.2% | |
| Royal Ahold | 4.6% | 4.2% | 0.0% | 8.8% | 1.7% | 0.0% | 0.0% | 1.7% | 10.5% | |
| Delta Lloyd Group | 3.7% | 6.3% | 0.0% | 10.0% | 0.0% | 0.0% | 0.0% | 0.0% | 10.0% | |
| Corio | 3.7% | 2.1% | 3.6% | 9.4% | 0.0% | 0.0% | 0.0% | 0.0% | 9.4% | |
| ASM International | 2.8% | 4.2% | 2.1% | 9.0% | 0.0% | 0.0% | 0.0% | 0.0% | 9.0% | |
| Advanced Metallurgical Group | 3.7% | 4.2% | 1.0% | 8.9% | 0.0% | 0.0% | 0.0% | 0.0% | 8.9% | |
| Royal Dutch Shell | 4.6% | 2.1% | 2.1% | 8.8% | 0.0% | 0.0% | 0.0% | 0.0% | 8.8% | |
| AEGON | 3.2% | 4.2% | 1.0% | 8.4% | 0.0% | 0.0% | 0.0% | 0.0% | 8.4% | |
| Royal BAM Group | 3.7% | 4.2% | 0.5% | 8.4% | 0.0% | 0.0% | 0.0% | 0.0% | 8.4% | |
| Royal Vopak | 3.2% | 0.0% | 3.1% | 6.4% | 1.7% | 0.0% | 0.0% | 1.7% | 8.0% | |
| Telegraaf Media Group | 2.8% | 4.2% | 0.0% | 6.9% | 0.0% | 0.0% | 0.5% | 0.5% | 7.5% | |
| Corbion | 3.7% | 2.1% | 1.0% | 6.8% | 0.0% | 0.0% | 0.0% | 0.0% | 6.8% | |
| Air France-KLM | 1.4% | 4.2% | 1.0% | 6.6% | 0.0% | 0.0% | 0.0% | 0.0% | 6.6% | |
| SBM Offshore | 2.3% | 4.2% | 0.0% | 6.5% | 0.0% | 0.0% | 0.0% | 0.0% | 6.5% | |
| Wereldhave | 2.8% | 2.1% | 1.0% | 5.9% | 0.0% | 0.0% | 0.0% | 0.0% | 5.9% | |
| BE Semiconductor Industries | 2.8% | 2.1% | 1.0% | 5.9% | 0.0% | 0.0% | 0.0% | 0.0% | 5.9% | |
| Eurocommercial Properties | 2.8% | 2.1% | 1.0% | 5.9% | 0.0% | 0.0% | 0.0% | 0.0% | 5.9% | |
| Wolters Kluwer | 3.7% | 2.1% | 0.0% | 5.8% | 0.0% | 0.0% | 0.0% | 0.0% | 5.8% | |
| Royal KPN | 1.4% | 2.1% | 2.1% | 5.6% | 0.0% | 0.0% | 0.0% | 0.0% | 5.6% | |
| Randstad | 0.5% | 4.2% | 0.5% | 5.2% | 0.0% | 0.0% | 0.0% | 0.0% | 5.2% | |
| Nutreco Holding | 2.8% | 2.1% | 0.0% | 4.9% | 0.0% | 0.0% | 0.0% | 0.0% | 4.9% | |
| ArcelorMittal | 2.3% | 0.0% | 1.6% | 3.9% | 0.0% | 0.0% | 0.0% | 0.0% | 3.9% | |
| Grontmij | 1.9% | 0.0% | 0.5% | 2.4% | 0.0% | 0.0% | 0.0% | 0.0% | 2.4% | |
| Royal Boskalis Westminster | 0.0% | 0.0% | 0.0% | 0.0% | 0.0% | 2.1% | 0.0% | 2.1% | 2.1% | |
| Royal Imtech | 0.5% | 0.0% | 0.5% | 1.0% | 0.0% | 0.0% | 0.5% | 0.5% | 1.5% | |
| Arcadis | 0.5% | 0.0% | 1.0% | 1.5% | 0.0% | 0.0% | 0.0% | 0.0% | 1.5% | |
| Aalberts Industries | 0.0% | 0.0% | 1.0% | 1.0% | 0.0% | 0.0% | 0.0% | 0.0% | 1.0% | |
| PostNL | 0.9% | 0.0% | 0.0% | 0.9% | 0.0% | 0.0% | 0.0% | 0.0% | 0.9% | |
| Amsterdam Commodities | 0.0% | 0.0% | 0.0% | 0.0% | 0.0% | 0.0% | 0.5% | 0.5% | 0.5% | |
| Nieuwe Steen Investments | 0.5% | 0.0% | 0.0% | 0.5% | 0.0% | 0.0% | 0.0% | 0.0% | 0.5% | |
| USG People | 0.0% | 0.0% | 0.0% | 0.0% | 0.0% | 0.0% | 0.0% | 0.0% | 0.0% | |
| HES Beheer | 0.0% | 0.0% | 0.0% | 0.0% | 0.0% | 0.0% | 0.0% | 0.0% | 0.0% | |
| TomTom | 0.0% | 0.0% | 0.0% | 0.0% | 0.0% | 0.0% | 0.0% | 0.0% | 0.0% | |
| Brunel International | 0.0% | 0.0% | 0.0% | 0.0% | 0.0% | 0.0% | 0.0% | 0.0% | 0.0% | |
| TNT Express | 0.0% | 0.0% | 0.0% | 0.0% | 0.0% | 0.0% | 0.0% | 0.0% | 0.0% | |
| Value8 | 0.0% | 0.0% | 0.0% | 0.0% | 0.0% | 0.0% | 0.0% | 0.0% | 0.0% | |
| TKH Group | 0.0% | 0.0% | 0.0% | 0.0% | 0.0% | 0.0% | 0.0% | 0.0% | 0.0% | |
| VastNed Retail | 0.0% | 0.0% | 0.0% | 0.0% | 0.0% | 0.0% | 0.0% | 0.0% | 0.0% | |
| Stern Group | 0.0% | 0.0% | 0.0% | 0.0% | 0.0% | 0.0% | 0.0% | 0.0% | 0.0% | |
| Groothandelsgebouwen | 0.0% | 0.0% | 0.0% | 0.0% | 0.0% | 0.0% | 0.0% | 0.0% | 0.0% | |
| Sligro Food Group | 0.0% | 0.0% | 0.0% | 0.0% | 0.0% | 0.0% | 0.0% | 0.0% | 0.0% | |
| Docdata | 0.0% | 0.0% | 0.0% | 0.0% | 0.0% | 0.0% | 0.0% | 0.0% | 0.0% | |
| Royal Brill | 0.0% | 0.0% | 0.0% | 0.0% | 0.0% | 0.0% | 0.0% | 0.0% | 0.0% | |
| Beter Bed Holding | 0.0% | 0.0% | 0.0% | 0.0% | 0.0% | 0.0% | 0.0% | 0.0% | 0.0% | |
| Ordina | 0.0% | 0.0% | 0.0% | 0.0% | 0.0% | 0.0% | 0.0% | 0.0% | 0.0% | |
| ICT Automatisering | 0.0% | 0.0% | 0.0% | 0.0% | 0.0% | 0.0% | 0.0% | 0.0% | 0.0% | |
| Oranjewoud | 0.0% | 0.0% | 0.0% | 0.0% | 0.0% | 0.0% | 0.0% | 0.0% | 0.0% | |
| Heijmans | 0.0% | 0.0% | 0.0% | 0.0% | 0.0% | 0.0% | 0.0% | 0.0% | 0.0% | |
| OCI | 0.0% | 0.0% | 0.0% | 0.0% | 0.0% | 0.0% | 0.0% | 0.0% | 0.0% | |
| Gemalto | 0.0% | 0.0% | 0.0% | 0.0% | 0.0% | 0.0% | 0.0% | 0.0% | 0.0% | |
| Fugro | 0.0% | 0.0% | 0.0% | 0.0% | 0.0% | 0.0% | 0.0% | 0.0% | 0.0% | |
| Exact Holding | 0.0% | 0.0% | 0.0% | 0.0% | 0.0% | 0.0% | 0.0% | 0.0% | 0.0% | |
| DPA Group | 0.0% | 0.0% | 0.0% | 0.0% | 0.0% | 0.0% | 0.0% | 0.0% | 0.0% | |
| Neways Electronics | 0.0% | 0.0% | 0.0% | 0.0% | 0.0% | 0.0% | 0.0% | 0.0% | 0.0% | |
| Cryo-Save Group | 0.0% | 0.0% | 0.0% | 0.0% | 0.0% | 0.0% | 0.0% | 0.0% | 0.0% | |
| Nedap | 0.0% | 0.0% | 0.0% | 0.0% | 0.0% | 0.0% | 0.0% | 0.0% | 0.0% | |
| BinckBank | 0.0% | 0.0% | 0.0% | 0.0% | 0.0% | 0.0% | 0.0% | 0.0% | 0.0% | |
| Accell Group | 0.0% | 0.0% | 0.0% | 0.0% | 0.0% | 0.0% | 0.0% | 0.0% | 0.0% | |
| Ballast Nedam | 0.0% | 0.0% | 0.0% | 0.0% | 0.0% | 0.0% | 0.0% | 0.0% | 0.0% | |
| Arseus | 0.0% | 0.0% | 0.0% | 0.0% | 0.0% | 0.0% | 0.0% | 0.0% | 0.0% | |
| Ziggo | 0.0% | 0.0% | 0.0% | 0.0% | 0.0% | 0.0% | 0.0% | 0.0% | 0.0% | |
| KAS BANK | 0.0% | 0.0% | 0.0% | 0.0% | 0.0% | 0.0% | 0.0% | 0.0% | 0.0% | |
| ING Group | 0.0% | 0.0% | 0.0% | 0.0% | 0.0% | 0.0% | 0.0% | 0.0% | 0.0% | |
| Kendrion | 0.0% | 0.0% | 0.0% | 0.0% | 0.0% | 0.0% | 0.0% | 0.0% | 0.0% | |
Conflicts of Interest
References
- UN. Report of the Open Working Group of the General Assembly on Sustainable Development Goals. A/68/970; United Nations: New York, NY, USA, 2014. [Google Scholar]
- WEF. Global Risks 2015, 10th ed.; World Economic Forum: Geneva, Switzerland, 2015. [Google Scholar]
- Hoekstra, A.Y.; Chapagain, A.K. Globalization of Water: Sharing the Planet’s Freshwater Resources; Blackwell Publishing: Oxford, UK, 2008. [Google Scholar]
- Sojamo, S.; Keulertz, M.; Warner, J.; Allan, J.A. Virtual water hegemony: The role of agribusiness in global water governance. Water Int. 2012, 37, 169–182. [Google Scholar] [CrossRef]
- CEO Water Mandate. Corporate Water Disclosure Guidelines: Toward a Common Approach to Reporting Water Issues; Pacific Institute: Oakland, CA, USA, 2014. [Google Scholar]
- Gleick, P. Global freshwater resources: Soft-path solutions for the 21st century. Science 2003, 302, 1524–1528. [Google Scholar] [CrossRef] [PubMed]
- Savenije, H.H.G.; Hoekstra, A.Y.; van der Zaag, P. Evolving water science in the Anthropocene. Hydrol. Earth Syst. Sci. 2014, 18, 319–332. [Google Scholar] [CrossRef]
- IPCC. Climate Change 2013: The Physical Science Basis. Working Group I Contribution to the Fifth Assessment Report of the Intergovernmental Panel on Climate Change; Cambridge University Press: New York, NY, USA, 2013. [Google Scholar]
- Irbaris. CDP Water Disclosure: The Case for Water Disclosure; Carbon Disclosure Project: London, UK, 2009. [Google Scholar]
- Vörösmarty, C.; Green, P.; Salisbury, J.; Lammers, R. Global water resources: Vulnerability from climate change and population growth. Science 2000, 289, 284–288. [Google Scholar] [CrossRef] [PubMed]
- Ercin, A.E.; Hoekstra, A.Y. Water footprint scenarios for 2050: A global analysis. Environ. Int. 2014, 64, 71–82. [Google Scholar] [CrossRef] [PubMed]
- Hoekstra, A.Y. The Water Footprint of Modern Consumer Society; Routledge: London, UK, 2013. [Google Scholar]
- Oki, T.; Kanae, S. Global hydrological cycles and world water resources. Science 2006, 313, 1068–1072. [Google Scholar] [CrossRef] [PubMed]
- Hoekstra, A.Y. Sustainable efficient and equitable water use: The three pillars under wise freshwater allocation. WIREs Water 2014, 1, 31–40. [Google Scholar] [CrossRef]
- Alliance for Water Stewardship (AWS). The AWS International Water Stewardship Standard. Version 1.0. 8 April 2014. Available online: http://allianceforwaterstewardship.org/assets/documents/AWS-Standard-v-1-Abbreviated-print.pdf (accessed on 19 January 2015).
- Van Marrewijk, M. Concepts and definitions of CSR and corporate sustainability: Between agency and communion. J. Bus. Ethics 2003, 44, 95–105. [Google Scholar] [CrossRef]
- Daub, C.-H. Assessing the quality of sustainability reporting: an alternative methodological approach. J. Clean. Product. 2007, 15, 75–85. [Google Scholar] [CrossRef]
- Herva, M.; Franco, A.; Carrasco, E.F.; Roca, E. Review of corporate environmental indicators. J. Clean. Product. 2011, 19, 1687–1699. [Google Scholar] [CrossRef] [Green Version]
- Larson, W.M.; Freedman, P.L.; Passinsky, V.; Grubb, E.; Adriaens, P. Mitigating corporate water risk: Financial market tools and supply management strategies. Water Altern. 2012, 5, 582–602. [Google Scholar]
- Hepworth, N. Open for business or opening pandora’s box? A constructive critique of corporate engagement in water policy: An introduction. Water Altern. 2012, 5, 543–562. [Google Scholar]
- BIER. Water Use Benchmarking in the Beverage Industry: Trends and Observations 2012; Beverage Industry Environmental Roundtable. Anteagroup: Saint Paul, MN, USA, 2012. [Google Scholar]
- Mekonnen, M.M.; Hoekstra, A.Y. Water footprint benchmarks for crop production: A first global assessment. Ecol. Indic. 2014, 46, 214–223. [Google Scholar] [CrossRef]
- CDP. CDP Global Water Report 2014: From Water Risk to Value Creation; CDP: London, UK, 2014. [Google Scholar]
- Peiró-Signes, A.; Segarra-Oña, M.; Mondéjar-Jiménez, J.; Vargas-Vargas, M. Influence of the environmental social and corporate governance ratings on the economic performance of companies: An overview. Int. J. Environ. Res. 2013, 7, 105–112. [Google Scholar]
- Hoekstra, A.Y. Water scarcity challenges to business. Nat. Clim. Chang. 2014, 4, 318–320. [Google Scholar]
© 2015 by the authors; licensee MDPI, Basel, Switzerland. This article is an open access article distributed under the terms and conditions of the Creative Commons Attribution license (http://creativecommons.org/licenses/by/4.0/).
Share and Cite
Linneman, M.H.; Hoekstra, A.Y.; Berkhout, W. Ranking Water Transparency of Dutch Stock-Listed Companies. Sustainability 2015, 7, 4341-4359. https://doi.org/10.3390/su7044341
Linneman MH, Hoekstra AY, Berkhout W. Ranking Water Transparency of Dutch Stock-Listed Companies. Sustainability. 2015; 7(4):4341-4359. https://doi.org/10.3390/su7044341
Chicago/Turabian StyleLinneman, Marissa H., Arjen Y. Hoekstra, and Wouter Berkhout. 2015. "Ranking Water Transparency of Dutch Stock-Listed Companies" Sustainability 7, no. 4: 4341-4359. https://doi.org/10.3390/su7044341
APA StyleLinneman, M. H., Hoekstra, A. Y., & Berkhout, W. (2015). Ranking Water Transparency of Dutch Stock-Listed Companies. Sustainability, 7(4), 4341-4359. https://doi.org/10.3390/su7044341