1. Introduction
In 1987, the United Nations World Commission on Environment and Development (WCED) published a report entitled “Our Common Future”, which proposed a term, “sustainable development” [
1]. Building a resource-saving and environment-friendly society is a strategic mission for China’s economic and social development [
2]. Under the dual constraints of global fossil energy’s increasing depletion and the ecological environment’s rapid deterioration, developing renewable energy has become a strategic choice for building a sustainable energy system and achieving a low-carbon economy in many countries, which is also an important path for implementing the concept of sustainable development [
3,
4]. Especially for China, as the largest energy consumer and producer in the world, exploring and developing renewable energy has become imperative and urgent under current constrains on resource endowment, consumption habits and technological dependence. In China, fossil energy (including coal, petroleum and natural gas) consumption has a long-term dominant role in the national primary energy consumption structure. At the end of 2013, the consumption shares of coal, petroleum and natural gas were 67.5%, 17.8% and 5.1% respectively, while new and renewable energy consumption had a 9.6% share of the total energy consumption [
5]. China needs make greater efforts to develop new and renewable energy sources to tackle the issues that face it, such as energy security and environmental protection.
China’s “Renewable Energy Law” implemented in 2006 proposes vigorously exploiting and developing renewable energy resources. In 2007, the “Medium and Long Term Development Plan for Renewable Energy” issued by the China Development and Reform Commission set a development goal of renewable energy consumption making up 15% of total energy consumption in 2020 [
6,
7]. In the last few years, the haze occurring in many provinces and cities has also highlighted the need to develop renewable energy to replace traditional fossil fuels. In this context, renewable energy has been more and more emphasized by the government and the public. In the past ten years, the Chinese government has provided many subsidies for renewable energy power development [
8]. At the end of 2013, the on-grid installed capacity of wind power, solar PV power and biomass power increased to 77.16 million kW, 14.79 million kW and 12.23 million kW, respectively. However, there are some issues that need to be solved in the renewable energy power industry, such as the low technology level and unbalanced industrial development [
9]. Renewable energy power is an important way of utilizing renewable energy resources [
10]. Developing renewable energy power needs clear development goals and effective policy support. An external benefit evaluation on renewable energy power accessing the power grid can identify the comprehensive impacts of different renewable energy power types on multiple stakeholders, which can act as a reference for Chinese government when setting diverse development goals and implementing differentiated supporting policies for different renewable energy types. It can also promote the sustainable development of the renewable energy power industry in China.
Currently, some studies related to the non-technical impacts (such as the economic impact and environmental impact) of renewable energy power accessing the power grid have been conducted. Delarue
et al. [
11] employed the mixed integer linear programming (MILP) and advanced unit commitment (UC) models to study the actual effects of wind power on overall electricity generation costs and CO
2 emissions in Belgium. Holttinen and Tuhkanen [
12] applied the EMPS power market model and the EFOM energy system model to assess the effects of large-scale wind production on CO
2 abatement in the Nordic countries. Ummels
et al. [
13] used a unit commitment and economic dispatch (UC-ED) method to assess the impacts of large-scale wind power on system operations from cost, reliability, and environmental perspectives. Hirth [
14] adopted the regression analysis of market data and the EMMA calibrated model of the European electricity market to study the market value of solar and wind power with penetration and how policies and prices affect the market value. Keith
et al. [
15] analyzed the possible climatic impacts (including global-mean surface temperature, emissions of CO
2 and air pollutants) of wind power at regional to global scales by using two general circulation models and several parameterizations of the interaction of wind turbines with the boundary layer. Morales
et al. [
16] proposed a stochastic programming market-clearing model spanning a daily time horizon to analyze the economic valuation of reserves in power systems with high penetration of wind power. Delucchi and Jacobson [
17] studied the economics of wind, water, and solar power (WWS) generation and transmission, the economics of WWS use in transportation, and policy measures needed to enhance the viability of a WWS system. Katzenstein and Apt [
18] evaluated the effects of wind and solar power on NOx and CO
2 emissions by modeling a wind or solar photovoltaic plus gas system using measured 1-min time-resolved emissions and heat rate and power data. Turney and Fthenakis [
19] evaluated the land use and life cycle CO
2 emission of large-scale solar power plants compared with that of coal-based electricity. Heller
et al. [
20] proposed a willow biomass production model to study the life cycle energy and environmental benefit effects of generating electricity from willow biomass. Santisirisomboon
et al. [
21] estimated the impact of biomass power generation on power generation expansion planning and mitigating carbon dioxide emission from the power sector. To the best of our knowledge, external benefit evaluations of renewable energy power which simultaneously takes the economic, social and environmental aspects into account are rarely conducted. Therefore, the external benefit evaluation of renewable energy power, comprehensively considering economic benefits, social benefits and environmental benefits based on sustainability, will be studied in this paper. This study should be an important topic for the sustainable development of renewable energy power industry and can also fill a current research gap.
The external benefits of renewable energy power consist of positive effects and negative effects of renewable energy power accessing the power grid on multiple stakeholders in the electric power system. The positive effects include pollutant emission reduction, employment increase, energy security enhancement, and so on; the negative effects include declining revenues for the power grid company and power generation enterprise, increased expenses for electric power consumers, and so on. Among these effects, some can be quantitatively accounted, such as the pollutant emission reduction and revenue decline for the power grid company, but some can only be estimated using subjective experiences from experts and practitioners, such as the energy security enhancement. Therefore, the external benefit evaluation of renewable energy power is a multi-criteria decision making (MCDM) issue which needs to consider multiple conflicting criteria. Furthermore, some criteria can only be estimated using personal subjective experience, which produces the characteristics of fuzziness and uncertainty. Therefore, more accurately, the external benefit evaluation of renewable energy power is a fuzzy MCDM issue.
There are many fuzzy MCDM methods for evaluating and ranking alternatives, such as fuzzy-TOPSIS [
22,
23], fuzzy-VIKOR [
24,
25], fuzzy-ELECTRE [
26,
27], fuzzy-GRA [
28,
29]. The fuzzy-GRA (Grey Relational Analysis) method combines fuzzy set theory and conventional GRA, which can remove the subjective limitation of decision makers and tackle the issues of incomplete information and unknown distribution type. Therefore, fuzzy-GRA has been employed in many fields, including investment company selection [
30], service quality evaluation [
31], system analysis engineer selection [
32], and so on. It is very unfortunate to find that the fuzzy-GRA has rarely been applied to issues related to renewable energy. Therefore, the extended fuzzy-GRA method will be employed to perform the external benefit evaluation of renewable energy power in this paper. Meantime, the entropy weighting method (a kind of objective weighting method) and superiority linguistic ratings (a kind of subjective weighting method) will be combined to determine the index weights, which can embody the conscious tendencies of decision-makers and reflect the essential information from the index data.
The rest of this paper is organized as follows:
Section 2 analyzes the impacts of renewable energy power accessing the power grid for multiple stakeholders in the electric power system; the external benefit evaluation index system of renewable energy power will be built in
Section 3;
Section 4 introduces the basic hybrid fuzzy MCDM theory used in this paper; the external benefits of three renewable energy power types, namely wind power, solar PV power and biomass power, will be evaluated in
Section 5; and
Section 6 provides conclusions.
3. External Benefit Evaluation Index System for Renewable Energy Power
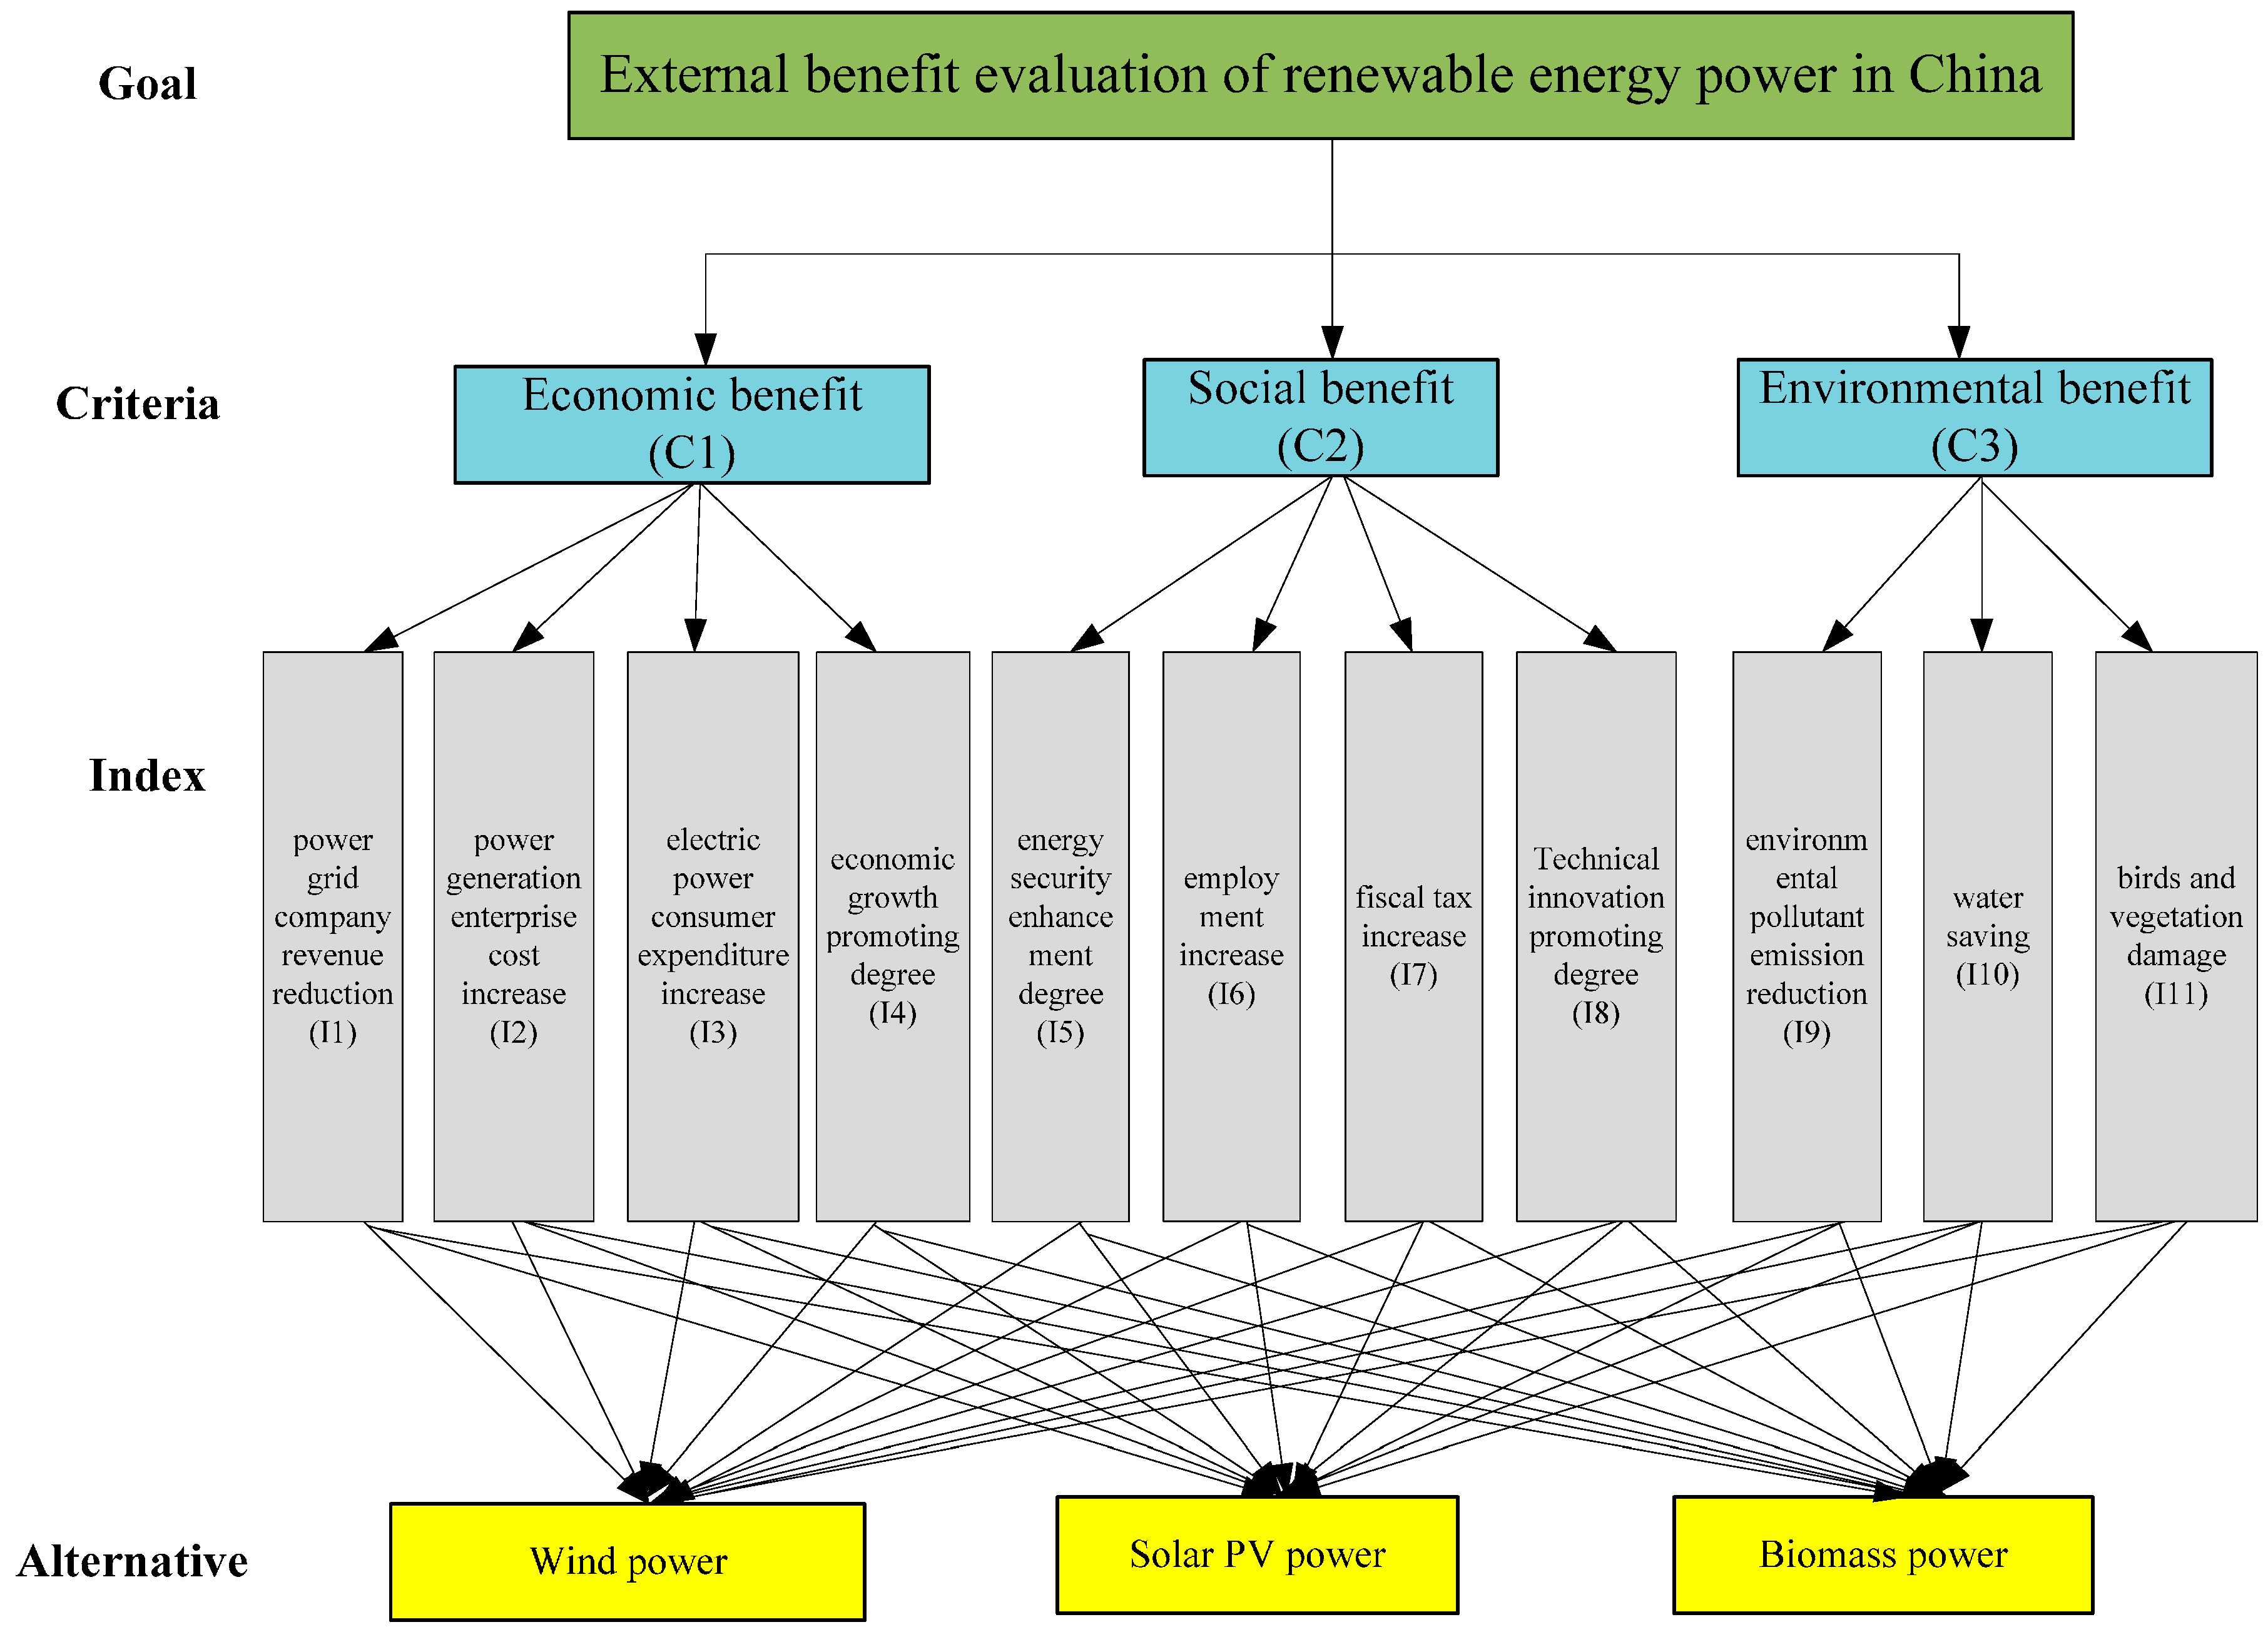
Evaluating the external benefits of renewable energy power is a systems engineering issue, which is related to several aspects such as economy, society and environment. Based on the above analysis in
Section 2 and related literature, the hierarchical structure of the external benefit evaluation index system for renewable energy power is built from a sustainability perspective, which is shown in
Figure 1. It includes four levels, namely the goal, criteria, index and alternative. The goal level is the external benefit evaluation for renewable energy power; the criteria level contains economic benefit, social benefit and environmental benefit; the index level includes 11 indicators, namely power grid company revenue reduction, power generation enterprise cost increase, electric power consumer expenditure increase, economic growth promotion degree, energy security enhancement degree, employment increase, fiscal tax increase, technical innovation promotion degree, environmental pollutant emission reduction, water savings, and bird and vegetation damage; and the alternative level consists of wind power, solar PV power and biomass power.
Figure 1.
Hierarchical structure of external benefit evaluation index system for renewable energy power.
Figure 1.
Hierarchical structure of external benefit evaluation index system for renewable energy power.
3.1. Economic Benefit Criteria
The economic benefit (C1) of renewable energy power accessing the power grid refers to the revenue (namely positive benefit) and cost (namely negative benefit) increases for multiple stakeholders in the electric power system caused by on-grid renewable energy power. It includes power grid company revenue reduction (I1), power generation enterprise cost increase (I2), electric power consumer expenditure increase (I3), and economic growth promotion degree (I4). Of these, I1, I2 and I3 are minimal-type (i.e., the smaller the better) quantitative indices measured in monetary value; I4 is a maximum-type (i.e., the larger the better) qualitative index measured in superiority linguistic ratings of decision-makers.
3.2. Social Benefit Criteria
The social benefit (C2) of renewable energy power accessing the power grid refers to the promotion (positive benefit) or inhibition (negative benefit) on social factors (such as employment and social security) due to on-grid renewable energy power. It includes energy security enhancement degree (I5), employment increase (I6), fiscal tax increase (I7) and technical innovation promotion degree (I8). Of these, I5, I6, I7 and I8 are maximum-type indices; I5 and I8 are qualitative indices, and I6 and I7 are quantitative indices.
3.3. Environmental Benefit Criteria
The environmental benefit (C3) of renewable energy power accessing the power grid refers to the protection (positive benefit) or damage (negative benefit) on natural resources (such as air and water) and ecological systems (such as animals and plants or atmospheric and soil environments) due to on-grid renewable energy power. It includes environmental pollutant emission reduction (I9), water savings (I10), and bird and vegetation damage (I11). Of these, I9 and I10 are maximum-type indices, and I11 is a minimal-type index; I9, I10 and I11 are quantitative indices.
From the above analysis, the external benefit evaluation indicators for renewable energy power and their attributes and types are listed in
Table 1. For a quantitative index, we can obtain the index value based on empirical calculation; for a qualitative index, the index value can be acquired using the expert investigation method.
Table 1.
External benefit evaluation index of renewable energy power.
Table 1.
External benefit evaluation index of renewable energy power.
| Criteria | Index | Index attribute | Index type |
|---|
| Economic benefit | Power grid company revenue reduction (I1) | quantitative | minimal |
| Power generation enterprise cost increase (I2) | quantitative | minimal |
| Electric power consumer expenditure increase (I3) | quantitative | minimal |
| Economic growth promotion degree (I4) | qualitative | maximum |
| Social benefit | Energy security enhancement degree (I5) | qualitative | maximum |
| Employment increase (I6) | quantitative | maximum |
| Fiscal tax increase (I7) | quantitative | maximum |
| Technical innovation promotion degree (I8) | qualitative | maximum |
| Environmental benefit | Environmental pollutant emission reduction (I9) | quantitative | maximum |
| Water savings (I10) | quantitative | maximum |
| Bird and vegetation damage (I11) | quantitative | minimal |
4. Basic Theory of the Hybrid MCDM Method
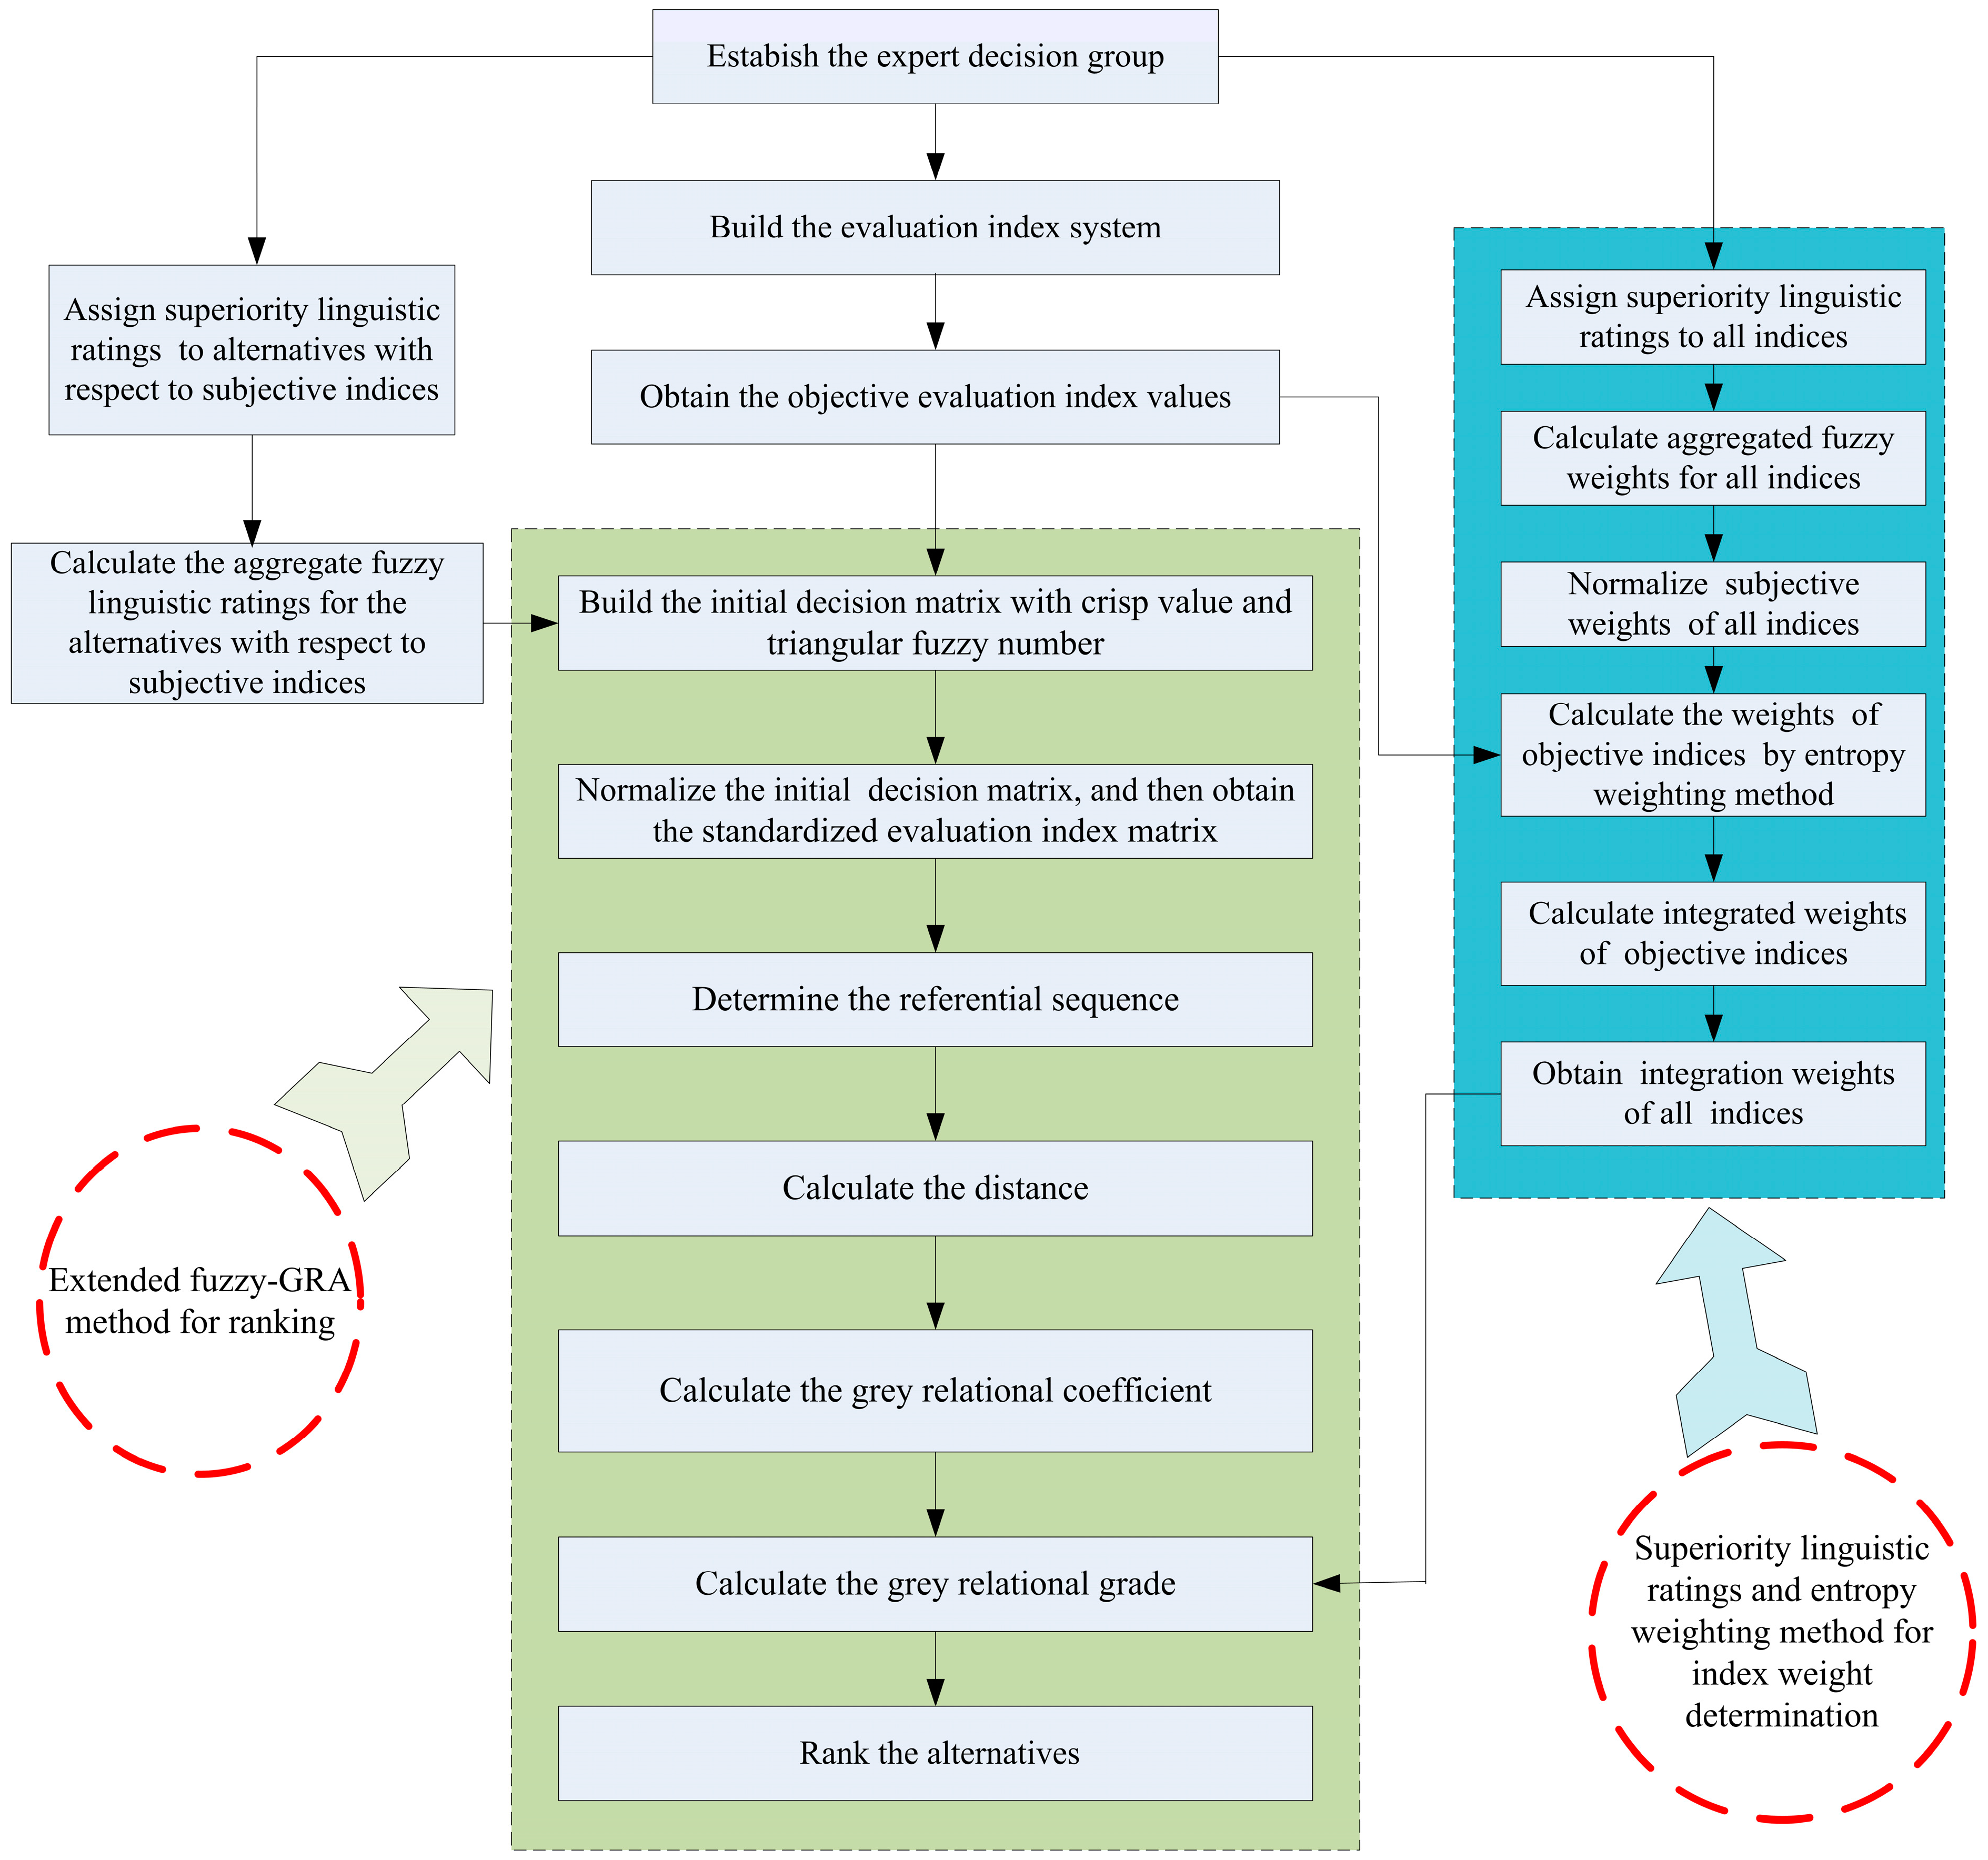
Due to the characteristics of evaluation object, a hybrid MCDM method is employed in this paper. The hybrid MCDM for evaluating the external benefit of renewable energy power consists of two parts. One part is the weight determination of objective and subjective indices using decision makers’ superiority linguistic ratings (subjective weighting method) and the entropy weighting method (objective weighting method); the other part is ranking alternatives and optimal alternative selection by using the extended fuzzy grey relational analysis (fuzzy-GRA) method.
4.1. Superiority Linguistic Ratings and Entropy Weighting Method for Index Weight Determination
Fuzzy set theory, proposed by Zadeh (1965), is an extension of the classical notion of set theory, which can solve the issues in an environment of uncertainty [
39]. A fuzzy set
is a pair (
U,
m) where
U is a set and
is the membership function, provided by
. Each element
x in a universe of discourse
X is mapped to a real number in the interval [0, 1] by the membership function
.
A triangular fuzzy number is represented as a triplet
, and its membership function
is expressed as
where
,
,
are crisp numbers and
.
and
are the lower and upper bounds of available area for evaluation data respectively, reflecting the fuzziness of the evaluation index.
To quantify the index and rank the alternatives in the fuzzy environment, the graded mean integration representation method (
GMIR) proposed by Chen and Hsieh is employed to calculate the converted value of a triangular fuzzy number for ranking in this paper [
40]. By using
GMIR method, the graded mean integration representation value
of triangular fuzzy number
can be calculated as
In order to transform the linguistic terms (represented by a word or a sentence) into triangular fuzzy numbers, the transformation rules between the linguistic variables and fuzzy ratings used for the alternatives with respect to subjective indices are listed in
Table 2, and the transformation rules between the linguistic variables and fuzzy ratings used for the index weight determination are listed in
Table 3 [
23,
28].
Table 2.
Linguistic terms transformation rule for the ratings of alternatives with respect to subjective indices.
Table 2.
Linguistic terms transformation rule for the ratings of alternatives with respect to subjective indices.
| Linguistic Term | Membership Function |
|---|
| Very poor (VP) | (0,0,0.2) |
| Poor (P) | (0,0.2,0.4) |
| Fair (F) | (0.3,0.5,0.7) |
| Good (G) | (0.6,0.8,1) |
| Very good (VG) | (0.8,1,1) |
Table 3.
Linguistic terms transformation rule for the ratings of index weight.
Table 3.
Linguistic terms transformation rule for the ratings of index weight.
| Linguistic Term | Membership Function |
|---|
| Very low (VL) | (0,0,0.3) |
| Low (L) | (0,0.3,0.5) |
| Medium (M) | (0.2,0.5,0.8) |
| High (H) | (0.5,0.7,1) |
| Very high (VH) | (0.7,1,1) |
The entropy weighting method is an objective method for index weight determination, which can effectively reflect the essential information of the index among different alternatives and measure the useful information implied in the index data. Many papers have introduced the basic principles and calculation steps for the entropy weighting method, such as [
41] and [
42], so this method will not be introduced in detail in this paper.
In this paper, the objective index weights are determined by combining the superiority linguistic ratings of decision-makers and the entropy weighting method, and the subjective index weights are assigned by the superiority linguistic ratings of decision-makers. The combination of a subjective weighting method (i.e., superiority linguistic ratings of decision-makers) and an objective weighting method (i.e., the entropy weighting method) not only can embody the conscious tendencies of decision-makers, but also can reflect the essential information and measure the useful information implied in the index data among different alternatives.
Suppose there are
objective indices and
subjective indices. Let
,
,
,
be the superiority linguistic ratings assigned to index
by decision-maker
, and the transformation rules between the linguistic variables and fuzzy ratings are given in
Table 3. Then, the aggregated fuzzy weights
for the index
can be calculated by
where
,
,
.
The normalized index weight of all indices using the subjective weighting method can be calculated according to Equation (4).
Allow be the crisp value of alternative in terms of objective index . Then the objective weight of objective index can be calculated by using the entropy weighting method.
Then, the integrated weight
of the objective index
can be obtained by
Therefore, the integration weights
of all indices (including objective indices and subjective indexes) can be obtained by
4.2. Extended Fuzzy Grey Relation Analysis for Ranking
For the external benefit evaluation of renewable energy power, some indicators can be represented by a crisp value, such as I1 and I2. However, some indicators such as I4 and I5 cannot be represented by crisp value due to fuzziness and incomplete information, which can only be represented by a fuzzy number, namely a triangular fuzzy number in this paper. Therefore, during the evaluation, there are two representation formats for indices, i.e., a crisp value and triangular fuzzy number, which can characterize the actual situation of evaluation indices and enhance the reasonability and effectiveness of the quantification process. The extended fuzzy grey relation analysis method employed in this paper combines the traditional grey relation analysis method and fuzzy set theory, which is more valid and effective for evaluating the external benefit of renewable energy power in a fuzzy environment.
The initial hybrid decision matrix
A, which includes a crisp value and a triangular fuzzy number, can be shown as follows:
where
is the crisp value representing the
kth objective evaluation index value of alternative
i,
;
is the triangular fuzzy number representing the
kth subjective evaluation index value of alternative
i,
.
where
is the triangular fuzzy number representing the
kth subjective evaluation index value of alternative
i given by expert
j,
.
The calculation steps of the extended fuzzy grey relation analysis (fuzzy-GRA) method for alternative ranking and selection are as follows.
Step 1: Index value standardization
In order to eliminate the index type and dimension effects on the evaluation, index value standardization must be done. For the external benefit evaluation of renewable energy power, there are maximum-type indices and minimum-type indices, which are represented by crisp values or triangular fuzzy numbers. Wei [
43] proposed the normalization methods for crisp numbers, interval numbers, and triangular numbers. Wang
et al. [
44] proposed the normalization methods for maximum-type indices and minimum-type indices. With reference to the above two references, the index value standardization will be performed according to Equations (10)–(13).
For maximum-type index
with a crisp value, the standardization value
can be calculated by
For maximum-type index
with a triangular fuzzy number, the standardization value
can be calculated by
For minimum-type index
with a crisp value, the standardization value
can be calculated by
For minimum-type index
with a triangular fuzzy number, the standardization value
can be calculated by
Then, we can obtain the standardize evaluation index matrix B with a crisp value and triangular fuzzy number.
Step 2: Determine the referential sequence
A referential sequence in Grey system theory is a benchmarking sequence which is used for measuring the different between it and other sequences [
45]. The referential sequence
with a crisp value and triangular fuzzy number can be calculated using Equation (15).
Step 3: Calculate the distance
Let be the comparative sequences.
Let
be the distance between the referential sequence
and a comparative sequence
with respect to index
k. There are some methods for calculating the distance between two triangular fuzzy numbers. A modified geometrical distance with the advantages of easy implementation and powerful concept is employed to calculate the distance between two triangular fuzzy numbers in this paper [
28,
40]. Therefore, the distance
can be calculated by Equation (17).
Step 4: Calculate the grey relational coefficient
The grey relational coefficient
of alternative
i from the ideal one with respect to index
k can be calculated using Equation (18).
where
and
represent the minimum and maximum element of
, respectively;
is a distinguishing coefficient which ranges between 0 and 1. In general, when the relative conditions among sequences and alternative elements are uncertain, setting
= 0.5 is a better choice [
46].
Step 5: Calculate the Grey relational grade
The Grey relational grade of alternative i from the ideal one can be calculated by Equation (19).
Therefore, according to the obtained Grey relational grade, the alternatives can be ranked. The alternative with the maximum Grey relational grade should be selected as the optimal one.
The framework of the hybrid MCDM approach for external benefit evaluation of renewable energy power in China is shown in
Figure 2.
Figure 2.
Calculation framework of the hybrid MCDM approach for external benefit evaluation of renewable energy power in China.
Figure 2.
Calculation framework of the hybrid MCDM approach for external benefit evaluation of renewable energy power in China.
5. External Benefit Evaluation of Renewable Energy Power in China
In this section, the hybrid MCDM method is employed to evaluate the external benefit of renewable energy power in China. In a regional electric power system, there are 13 conventional thermal power units with 3080 MW of installed capacity, 6 wind farms with 345 MW of installed capacity, 8 solar photovoltaic power plants with 66.6 MW of installed capacity, and 6 biomass power plants with 91 MW of installed capacity. The total installed capacity of this electric power system amounts to 3582.6 MW, and the renewable energy power takes a 14.03% share in the total installed capacity. The average operating life of renewable energy power projects is 20 years. The parameters related to thermal power generation and renewable energy power generation, such as thermal power standard coal consumption, thermal power generation cost, equivalent forced outage rate, wind speed, lighting condition, biomass material supply shortage probability and so on, can refer to [
47,
48].
According to the previous studies of our research team [
47,
48,
49], the objective evaluation index values can be obtained, which are listed in
Table 4.
Table 4.
The objective evaluation index value [Units: RMB Yuan]
Table 4.
The objective evaluation index value [Units: RMB Yuan]
| | Index | I1 | I2 | I3 | I6 | I7 | I9 | I10 | I11 |
|---|
| Alternative | |
|---|
| Wind power | 66,900,120 | 12,713,328 | 20,576,005 | 9,312,000 | 52,295,507 | 84,207,641 | 3,720,437 | 7,875,000 |
| Solar PV power | 13,017,902 | 1,553,992 | 460,943 | 3,312,000 | 11,667,544 | 10,292,975 | 454,761 | 2933 |
| Biomass power | 19,517,562 | 9,222,004 | 1,290,020 | 3,408,000 | 45,449,956 | 30,541,304 | 1,079,494 | 2590 |
We selected four experts in different fields, also called decision makers (
j = 1, 2, 3, 4) to provide the linguistic preference ratings for the alternatives and the indices according to
Table 2 and
Table 3. The specific calculation steps for employing the hybrid MCDM approach to evaluate the external benefit of renewable energy power are given below.
Step 1: Calculate the evaluation index weight
(1) Calculate the fuzzy subjective evaluation index weights
The fuzzy subjective weights of all indices based on the experts’ superiority linguistic ratings should first be calculated. Four decision makers provided the linguistic ratings for all indices and the results are given in
Table 5. Then, the linguistic ratings can be transformed into the triangular fuzzy number according to
Table 3. Finally, the aggregate fuzzy linguistic ratings for all indices can be calculated according to Equation (3). For example, the aggregated fuzzy weight
of index I1 is computed as follows:
So, .
Table 5.
Linguistic ratings for all indices.
Table 5.
Linguistic ratings for all indices.
| | DM1 | DM2 | DM3 | DM4 |
|---|
| I1 | M | L | L | M |
| I2 | M | L | L | M |
| I3 | M | M | L | H |
| I4 | H | M | M | H |
| I5 | H | H | M | H |
| I6 | H | M | L | H |
| I7 | L | L | L | M |
| I8 | M | M | L | H |
| I9 | H | M | H | H |
| I10 | H | M | H | M |
| I11 | M | M | H | M |
Likewise, the aggregate fuzzy weights of the remaining ten indices can be computed, and the results are list in
Table 6.
Table 6.
Aggregate fuzzy weights of all indices.
Table 6.
Aggregate fuzzy weights of all indices.
| Index | Aggregated fuzzy weight |
|---|
| I1 | (0.1,0.4,0.65) |
| I2 | (0.1,0.4,0.65) |
| I3 | (0.225,0.5,0.775) |
| I4 | (0.35,0.6,0.9) |
| I5 | (0.425,0.65,0.95) |
| I6 | (0.3,0.55,0.825) |
| I7 | (0.05,0.35,0.575) |
| I8 | (0.225,0.5,0.775) |
| I9 | (0.425,0.65,0.95) |
| I10 | (0.35,0.6,0.9) |
| I11 | (0.275,0.550.85) |
Then, the normalized subjective weights
of all indices based on the decision makers’ superiority linguistic ratings can be calculated according to Equation (4), which are
(2) Calculate the objective weights of objective indices by using entropy weighting method
For the objective index I1, I2, I3, I6, I7, I9, I10 and I11, the objective weights can be computed based on the index value (listed in
Table 4) by using the entropy weighting method, and the calculation result are listed in
Table 7.
Table 7.
Objective weights of objective indices.
Table 7.
Objective weights of objective indices.
| Index | I1 | I2 | I3 | I6 | I7 | I9 | I10 | I11 |
|---|
| Objective weight | 0.0768 | 0.0685 | 0.2428 | 0.0399 | 0.0443 | 0.0881 | 0.0989 | 0.3406 |
(3) Calculate the integrated weight of all indices
The integrated weight
of objective indices can be computed according to Equations (5) and (6), and the results are as follows,
Then, the integration weights of all indices can be obtained according to Equation (7), as listed in
Table 8.
Table 8.
The integration weights of all indices by using superiority linguistic ratings and the entropy weighting method.
Table 8.
The integration weights of all indices by using superiority linguistic ratings and the entropy weighting method.
| Index | I1 | I2 | I3 | I4 | I5 | I6 | I7 | I8 | I9 | I10 | I11 |
|---|
| Integration weight | 0.040 | 0.036 | 0.161 | 0.105 | 0.115 | 0.029 | 0.020 | 0.087 | 0.077 | 0.080 | 0.250 |
As listed in
Table 8, it can be seen that I3 (electric power consumer expenditure increase), I4 (economic growth promotion degree), I5 (energy security enhancement degree) and I11 (bird and vegetation damage) have larger weights, which indicate these indicators will have greater impacts on the external benefit evaluation of renewable energy power in China. I8 (technical innovation promotion degree), I9 (environmental pollutant emission reduction) and I10 (water savings) will have medium impacts on the final evaluation, and the remaining indicators do not dominate.
Step 2: Calculate the aggregate fuzzy linguistic ratings for alternatives with respect to subjective indices
Four decision makers provided the linguistic ratings for the alternatives with respect to subjective indices, and the results are given in
Table 9. Then, the linguistic ratings could be transformed as the triangular fuzzy number according to
Table 2. Finally, the aggregate fuzzy linguistic ratings for the alternatives with respect to subjective indices (including I4, I5 and I8) could be calculated according to Equation (9). For example, the aggregate fuzzy rating of wind power in term of index I4 is computed as follows:
So, .
Table 9.
Linguistic ratings for renewable energy power with respect to subjective indices.
Table 9.
Linguistic ratings for renewable energy power with respect to subjective indices.
| | DM1 | DM2 | DM3 | DM4 |
|---|
| (I4) | | | | |
| wind power | F | G | G | G |
| PV power | F | F | G | F |
| bomass power | F | P | F | P |
| (I5) | | | | |
| wind power | G | G | F | F |
| PV power | G | G | F | F |
| bomass power | F | G | F | P |
| (I8) | | | | |
| wind power | G | F | F | P |
| PV power | G | F | G | G |
| bomass power | F | F | F | VP |
Likewise, the aggregate fuzzy ratings of PV power and biomass power in term of indices I5 and I8 can be computed. The aggregate fuzzy ratings of renewable energy power with respect to subjective indices are presented in
Table 10.
Table 10.
Aggregate fuzzy ratings of renewable energy power with respect to subjective indices.
Table 10.
Aggregate fuzzy ratings of renewable energy power with respect to subjective indices.
| | Index | I4 | I5 | I8 |
|---|
| Alternatives | |
|---|
| wind power | (0.525,0.725,0.925) | (0.45,0.65,0.85) | (0.3,0.5,0.7) |
| PV power | (0.375,0.575,0.775) | (0.45,0.65,0.85) | (0.525,0.725,0.925) |
| bomass power | (0.15,0.35,0.55) | (0.3,0.5,0.7) | (0.225,0.375,0.575) |
Step 3: Build the initial hybrid decision matrix
According to
Table 4 and
Table 10, the initial hybrid decision matrix
A which includes crisp values and triangular fuzzy numbers can be obtained:
Step 4: Standardize the initial hybrid decision matrix
In the external benefit evaluation index system of renewable energy power, the index need to be normalized. According to Equations (10)–(13), we can get the normalized hybrid evaluation index matrix
B with crisp values and triangular fuzzy numbers, as follows:
Step 5: Determine the referential sequence
The referential sequence
with crisp values and triangular fuzzy numbers can be calculated according to Equation (15), and the result is as follows:
Step 6: Calculate the distance
The distances between referential sequence
and alternative sequences (wind power, PV power and biomass power) with respect to total 11 indicators can be separately calculated according to Equation (17), and the results are listed in
Table 11.
Table 11.
The distances between referential sequence B0 and alternative sequences with respect to all indices.
Table 11.
The distances between referential sequence B0 and alternative sequences with respect to all indices.
| | I1 | I2 | I3 | I4 | I5 | I6 | I7 | I8 | I9 | I10 | I11 |
|---|
| Wind power | 0.433 | 0.680 | 0.709 | 0.000 | 0.000 | 0.000 | 0.000 | 0.243 | 0.000 | 0.000 | 0.531 |
| PV power | 0.000 | 0.000 | 0.000 | 0.162 | 0.000 | 0.374 | 0.371 | 0.000 | 0.591 | 0.621 | 0.062 |
| Biomass power | 0.179 | 0.644 | 0.466 | 0.405 | 0.176 | 0.368 | 0.063 | 0.366 | 0.429 | 0.503 | 0.000 |
Step 7: Calculate the Grey relational coefficient
The grey relational coefficient of alternatives (wind power, PV power and biomass power) from the ideal one with respect to each index can be calculated according to Equation (18), and the results are listed in
Table 12.
Table 12.
Grey relational coefficient of alternatives from the ideal one with respect to each index.
Table 12.
Grey relational coefficient of alternatives from the ideal one with respect to each index.
| | I1 | I2 | I3 | I4 | I5 | I6 | I7 | I8 | I9 | I10 | I11 |
|---|
| Wind power | 0.450 | 0.343 | 0.333 | 1.000 | 1.000 | 1.000 | 1.000 | 0.593 | 1.000 | 1.000 | 0.400 |
| PV power | 1.000 | 1.000 | 1.000 | 0.686 | 1.000 | 0.486 | 0.488 | 1.000 | 0.375 | 0.363 | 0.851 |
| Biomass power | 0.664 | 0.355 | 0.432 | 0.466 | 0.668 | 0.490 | 0.850 | 0.492 | 0.452 | 0.413 | 1.000 |
Step 8: Calculate the Grey relational grade
The Grey relational grade of alternatives (wind power, PV power and biomass power) from the ideal one can be calculated according to Equation (19), which are as followings.
The calculation result shows the external benefit ranking of renewable energy power is . Therefore, we can draw the conclusion that PV power has the greatest external benefit, the second is wind power, and the external benefit of biomass power is minimal.


