Article

Exploring the Upgrading of Chinese Automotive Manufacturing Industry in the Global Value Chain: An Empirical Study Based on Panel Data

1
School of Business Administration, Jiangxi University of Finance and Economics, No.168, East Shuanggang Road, Changbei, Nanchang 330013, China
2
Center for Industrial Production, Aalborg University, Fibigerstraede 10, DK-9220 Aalborg, Denmark
3
School of Information Technology, Jiangxi Key Laboratory of Data and Knowledge Engineering, Jiangxi University of Finance and Economics, Nanchang 330013, China
*
Author to whom correspondence should be addressed.
Sustainability 2015, 7(5), 6189-6211; https://doi.org/10.3390/su7056189
Submission received: 17 March 2015 / Revised: 30 April 2015 / Accepted: 13 May 2015 / Published: 20 May 2015
(This article belongs to the Special Issue Competitive and Sustainable Manufacturing in the Age of Globalization)

Abstract

:
In the age of globalization, the upgrading of China’s manufacturing industries has attracted great attention from both academicians and practitioners, as it certainly has great implications for the development of China and, even further, for the development of the whole world. To address this issue, the study clarifies the effects of the internal technological innovation capability (ITIC) and external linkages (ELs) on upgrading the Chinese automotive manufacturing industry (CAMI) in the global value chain, in order to indicate the appropriate way for the CAMI to be further upgraded and provide references for the formulation of regional automotive industrial policies. Based on Chinese panel data, the results confirm that both ITIC and EL are important for the upgrading of the CAMI, with ITIC being the more important. Improvement of ITIC facilitates the industry’s cooperation with the EL, resulting in better knowledge access. Furthermore, the results of cluster analysis reveal that regions with relatively developed automotive industries place emphasis on both the ITIC and EL. However, in some regions (e.g., Shanghai and Chongqing), the utility of EL seems insufficient. Therefore, the results of this paper, on the one hand, suggest policies should be directed towards increasing the ITIC of CAMI. On the other hand, in some regions, managers and policymakers need to explore further the advantage of clustering.

Graphical Abstract

1. Introduction

Since its “open door” policy, China has achieved great milestones in manufacturing and become one of the most important manufacturers in the world. According to China’s Statistical Yearbook of 2011, the output of the Chinese manufacturing industry has reached $2.05 trillion, exceeding that of the USA and making China the world’s leading manufacturing nation [1]. However, Chinese manufacturing industries still lack strong innovation ability, and their structures are not sound enough to support their further development. Meanwhile, the nation’s cost advantage is actually disappearing gradually. Because of that and the rising cost of energy and raw materials, the appreciation of the RMB, the stringency of financial policies, and the depression of Western markets, China’s manufacturers have been forced to upgrade to regain growth vitality in the competitive environment so as not to lose competitiveness and be surpassed by other emerging economies. The upgrading of China’s manufacturing industries has accordingly attracted the attention of both academicians and practitioners, as it certainly has great implications for the development of China and, even further, for the development of the whole world.
The Chinese automotive manufacturing industry (CAMI), one of the pillar industries of the Chinese economy, seems to be facing difficult challenges in upgrading. In addition, the modern production mode in the form of the global value chain also prioritises upgrading as the top issue for the CAMI. Global value chain normally refers to the full range of activities across geographies that are required to bring a product from its conception, through its design, sourced raw materials and production, marketing, distribution and support to the final consumer [2]. Moreover, it is a cooperation network comprised of different roles, such as developers, suppliers and producers. Each of them, separated in time and space, can add value to products, as products pass from one link in the chain to the next. In today’s global value chain, it is generally accepted that firms from developed countries often occupy the high-value-added parts, such as R&D, designing, marketing and branding, whereas firms from developing countries usually take on simple and low-value-added work, such as assembly and production of parts. The same situation applies to the global automotive industry value chain. Facing the fact that huge profits are seized by automotive manufacturing magnates from developed countries, those in the CAMI must think about how to break the “low-locked” situation to upgrade the industry in the global value chain.
However, the process of industrial upgrading is never easy, and it might be influenced by internal technological innovation capability (ITIC) and/or external linkage (EL) according to different viewpoints. One viewpoint is called the endogenous impetus view, and it suggests that industrial upgrading mainly relies on the internal accumulation of technologies and the cultivation of independent innovation ability [3,4,5,6]. In contrast, the other view, the exogenous impetus view, emphasises the influence of the EL of an industry on its upgrading [2,7,8,9,10,11,12,13,14,15]. In fact, these two views are both widely accepted, but there also exists a debate about the influence of ITIC and EL on upgrading, and to some extent, it is difficult to judge which way is the most efficient. This issue also applies to the CAMI. After decades of learning and accumulation, the CAMI is believed to have passed the era of mainly relying on cooperation with foreign enterprises. If that is so, then what is the appropriate way for the CAMI to upgrade itself further in the global value chain at the current stage, focusing more on internal accumulation and cultivation of ITIC or depending more on taking advantages of EL or both? This study attempts to address this question by drawing on panel data of the CAMI. In addition, considering the vast territory of China, this paper further explores the regional differences in both the development of ITIC and the utility of EL. By doing so, this study is expected to provide suggestions for how to upgrade the CAMI and references for the formulation of regional automotive industrial policies.
The article is structured as follows. Section 2 reviews the literature, to investigate the influences of ITIC and EL on industrial upgrading, based on which our hypotheses can be formulated. This is followed, in Section 3, by a description of the methodology used in this paper. In Section 4, the analysis results are presented and discussed. Finally, in Section 5, conclusions are drawn, managerial suggestions are given, and possible future lines of research are proposed.

2. Literature Review and Hypotheses

2.1. Core of Industrial Upgrading in Global Value Chain

Gereffi was the first scholar who introduced upgrading analysis under the framework of the global value chain. According to him, industrial upgrading refers to the improvement of the positions of firms or nations in the global value chain, moving towards more profitable and technologically sophisticated capital and skill-intensive economic niches [2,16]. Hereafter, different terminologies were used to describe this phenomenon. Some scholars further proposed the concept of “upgrading in an industrial cluster” [7], whereas the other scholars just used the word upgrading [4,17,18]. Despite their different understandings about industrial upgrading, the scholars generally accept that industrial upgrading is the transformation of an economy from a lower operating state to a higher operating state and from a labour-intensive and low-value-added production to capital and technologically intensive and high-value-added production [2,7,8,9,10,11,19,20].
Nevertheless, industrial upgrading can still have different forms. Humphrey and Schmitz [7] distinguished four types of upgrading that can be observed in the global value chain: process upgrading, product upgrading, functional upgrading, and inter-sectoral upgrading. According to Humphrey and Schmitz [7], both process upgrading and product upgrading are about the internal improvement of an industry, whereas functional upgrading is related to moving to higher positions in the global value chain. Since this paper mainly focuses on the intra-industry upgrading of the CAMI, we, in this paper, tend to investigate industrial upgrading in the global value chain in terms of the increase of the industry’s production ability and the improvement of its positions in the global value chain.

2.2. Internal Technological Innovation Capability and Industrial Upgrading

It is widely recognized that the knowledge resources possessed by an enterprise decide its operation capability and further construct an important foundation for its high performance [21,22,23]. The accumulation of knowledge can actually improve the ITIC of an enterprise, promote its R&D activities, improve its production processes, and eventually enhance its competitive advantages [24,25,26,27]. From a micro point of view, the competitiveness of manufacturing/service enterprises, constructed by the ITIC of enterprises in the long term [28,29] is normally believed to be the basis for industrial upgrading [30,31]. In this sense, industrial upgrading can be viewed as being developed based on the current technological capability of enterprises, as well as the innovation capability derived from the current technological capability.

2.3. External Linkages and Industrial Upgrading

It is generally accepted in the existing studies that there are two types of ELs: local linkage within an industrial cluster and EL with global buyers outside of that cluster [7,14]. Local linkage normally refers to the interactions amongst enterprises within a cluster. It is acknowledged in the existing literature that such linkage contributes significantly to industrial upgrading [32,33], through such as the externalities and the increasing returns to scale brought by clustering [34,35]. Some other scholars also note that the industrial cluster of enterprises could produce knowledge spill over and technology diffusion, which in turn stimulates the improvement of the technological level of industries [36,37].
EL with the global buyers and actors can be viewed as a kind of network system, building based on the bridging ties [38]. Some studies mainly attempted to explore the influence of EL with global buyers on the upgrading of an industry, by addressing different forms of insertion in the global value chain [2,8,9,10,12,13,14,15]. According to Gereffi et al. (2005), there are five types of value chaingovernance [13]. The global automotive value chain is generally recognized as a modular value chain because of the modular production of the automotive industry [39]. It is normally believed that such a modular value chain could offer benefits to both supply and demand sides. It can further facilitate industrial upgrading [40], by parallel innovations, the exchange of codified information [41], the reduction the industrial entry barriers, and the reorganization of the industries [42,43]. All these findings imply that ELs have high impact on industrial upgrading in the context of the global automotive value chain.

2.4. Debate about the Influences of Internal Technological Innovation Capability and External Linkage on Upgrading

As mentioned in the introduction, there is still no consensus on the effect of ITIC and EL on industrial upgrading. Two different views are both widely accepted:
Endogenous impetus view: industrial upgrading in global value chain is not a spontaneous process. Instead, it is the outcome of the continuous learning and innovative activities of value chain enterprises within that industry [17,44].
Exogenous impetus view: the EL of an industry in terms of both global and local linkages actually plays a more important role on bringing more upgrading opportunities to that industry [45].
Therefore, a debate exists about the influence of ITIC and EL on upgrading. To some extent, it is difficult to judge which would be the most efficient approach to upgrading. Most of the existing studies tend to focus on how ITIC may promote industrial upgrading. Few studies explore the comparative importance of both ITIC and EL on industrial upgrading.
Regarding the CAMI, the EL promotes its industrial upgrading in a short time through technology transfer and technology spillover from the developed countries [7,46]. The economic interaction between China and the world economies is indeed helpful for reshaping the production technological capability of the CAMI [47]. However, some studies showed that the leading enterprises in the global value chain tend to adopt all possible approaches and strategies to avoid the spillovers of their core technologies and knowledge [12,48]. In this case, it seems that industries in the developing countries have to rely on themselves to break through the above-mentioned blockade to realize upgrading. In this case, ITIC seems to be the only way for them [49,50,51]. Nevertheless, merely depending on the accumulation of ITIC is also problematic especially in today’s environment with fast technology development. It is certainly time consuming and difficult for industries in developing countries to keep up with the fast development of technologies. So whether both ITIC EL can contribute to the upgrading of the CAMI and what is the appropriate way for the CAMI to further upgrade in the global value chain at the current stage? Based on the above discussion, we propose the following hypotheses:
Hypothesis 1—The ITIC approach contributes (more) to the upgrading of the CAMI in the global value chain.
Hypothesis 2—The EL approach contributes (more) to the upgrading of the CAMI in the global value chain.

2.5. Upgrading the Chinese Automotive Manufacturing Industry in Different Regions

According to the factor endowment theory and the theory of comparative advantage [52], economic activities and resources are not equally distributed geographically. The regions with good factor conditions often tend to attract more economic activities and resources, which have significant influences on the development of these regions [53,54]. This certainly applies to the regional development of the CAMI of China [55,56]. Especially since the implementation of reform and open policy, some particular regions, such as the eastern coastal regions, have attracted both domestic and international resources because of the preferential national policies and favorable geographical positions. In this case, it is reasonable to assume that different regions in China have different conditions for the upgrading of the automotive manufacturing industry, which accordingly leads to different choices of upgrading paths for different regions. Two propositions can therefore be developed:
Hypothesis 3—The extent of development on the ITIC in different regions of China is different.
Hypothesis 4—The extent of development on the EL in different regions of China is different.

3. Research Design

3.1. Variable Selection

In the study, we have three main variables: industrial upgrading effect, ITIC, and EL effect, they are further measured in terms of sub-variables as introduced below.

3.1.1. Industrial Upgrading Effect

We used “industrial upgrading effect” as a dependent variable to measure the degree of upgrading of the CAMI. As discussed in Section 2.1, the study exclusively focuses on the intra-industrial upgrading of the CAMI. Among the three types of intra-industrial upgrading, process upgrading and product upgrading are more related to the internal improvement of an industry, whereas functional upgrading is closely linked to the position movement of an industry within the global value chain. Therefore, we chose to measure industrial upgrading effects in terms of the internal improvement of the automotive manufacturing industry and the relative position of the automotive manufacturing industry in the global value chain. In fact, this measurement has already been adopted in the existing studies, and more importantly, with good results [57].
To measure further the internal improvement of the automotive manufacturing industry, we chose to use “overall labor productivity” (y1), which is defined as a ratio of the industrial benefit of the automobile industry to the total number of employees of the automobile industry. This indicator has actually been widely used in the existing literature to measure the internal improvement of manufacturing industries [56,58]. The bigger y1 is, the higher the degree of the internal improvement of the automotive manufacturing industry.
Furthermore, we measured the relative position of the CAMI in the global value chain through a ratio of the total business income of the CAMI to the total business incomes of the leading automotive manufacturing enterprises in the global value chain (y2). The twelve automotive manufacturing enterprises that are usually acknowledged as the leading enterprise in the automotive industry were included in this study: TOYOTA, GM, Volkswagen, FORD, KIA, HYUNDAI, NISSAN, PSA Peugeot Citroen, Renault, Daimler Chrysler, Fiat and BMW. The bigger the y2, the higher the position the CAMI has in its global value chain. Because of differences in currency units, we used the average exchange rate released by the state at that year to convert the total business income of the twelve enterprises into RMB to calculate the ratio. This indicator is developed because the competitiveness of the CAMI and its position in global value chain, to a large degree, depend on the scale of production and sales. As a capital-intensive industry, its large scale generally enables the CAMI to control many upstream and downstream activities and makes it occupy a leading position in the global value chain. In addition, we chose to use business income as the indicator instead of profit because business income can better reflect the influence of the leading automotive manufacturing enterprises in their global value chains. For example, GM and Ford recently faced internal crisis and operated at a loss. Their profits were accordingly negative. However, supported by the US government, they survived and greatly influenced the other enterprises in their global value chains. This case in turn suggests that profit as an indicator can hardly measure the leading position of these enterprises in their global value chains.

3.1.2. Internal Technological Innovation Capability

The first independent variable in this study is “ITIC”. It is generally believed that the key path to enhance the competitiveness of manufacturing industries lies in the cultivation of its ITIC. According to the existing literature, the improvement of an industry’s ITIC can often be embodied by the input perspective, such as the increase of R&D input, and the output perspective, such as the increase of the production amount of new products [59,60,61]. These two perspectives were also adopted in this paper to measure ITIC. The detailed indicators thereby included (1) the ratio of R&D expense of the CAMI to revenue (a1) and (2) the output value of new products (a2).

3.1.3. External-Linkage Effect

The second independent variable in this study is related to the industrial effect of EL. As mentioned in Section 2.3, the ELs can be divided into local linkage within an industrial cluster and ELs with global buyers outside of the cluster. For the two different linkages, we used different measurement variables.
On the one hand, “the extent of modularity” was used to represent EL with global buyers outside of the cluster. In fact, there is no well-accepted indicator to measure the extent of modularity. Hence, we developed a new indicator for this study, i.e., the ratio of investment on automotive components to the total investment in the automotive industry (b1). To our understanding, this indicator has the closest meaning to the definition of modularity. It is proposed because it can reflect the degree of production scale of manufacturers of auto components, which further represents the supply ability of the manufacturers of auto components. Usually the higher supply ability the manufacturers of auto components have, the higher the possibility is that they are able to provide “turn-key” solutions for auto manufacturers. Given the modular nature of the automotive industry, if a supplier has the ability to provide “turn-key” solutions, it may be more preferred by auto manufacturers. Accordingly, the dependence of auto manufacturers on this components supplier would be increased. In other words, the supply ability of the manufacturers of auto components and the inter-dependence between the manufacturers of auto components and auto manufacturers can be viewed as two determinants of the extent of modularity [62]. Therefore, the bigger the b1, the higher the supply ability of the manufacturers of auto components, and the higher inter-dependence between manufacturers of auto components and auto manufacturers; all of which together lead to the greater extent of modularity.
On the other hand, we used “the extent of clustering” to represent local linkage within an industrial cluster. More specifically, it was measured by location quotient (b2), which is a common way to reflect the spatial distribution of elements in one region [63,64,65,66]. It is often used as an important tool to measure the distribution intensity or degree of specialization of an industry or a sector in a region [67,68]. In general, location quotient can be a good indicator to calculate the degree of industrial clustering. The bigger the b2, the higher the extent of industrial clustering.

3.2. Data Collection

In the study, we mainly relied on the panel data of the automotive manufacturing industry in 29 provinces of China from 2001 to 2008. All data was obtained from the China Automotive Industry Yearbook, China Statistical Yearbook and Zhonghong Industry Database (the specific data please refer to Supplementary Material), as shown in Table 1. All three data sources are authentic and authoritative, which, in turn, bring higher reliability to the study.
Table 1. Sources of indicators.
VariablesSource of Data
Independent variablesRatio of R&D expense of automobile industry to revenue (a1)Zhonghong Industry Database [69]
Output value of new products (a2)Zhonghong Industry Database [69]
Ratio of automobile parts investment to total investment in the auto industry (b1)Zhonghong Industry Database [69]
Location quotient (b2)Zhonghong Industry Database [69], China Statistical Yearbooks [70]
Dependent variablesOverall labour productivity of the automobile industry (y1)China Automotive Industry Yearbooks [71]
Ratio of the total business income of the automobile manufacturing industry of different regions of China to the total business income of the twelve largest automobile manufacturing enterprises in the world (y2)China Automotive Industry Yearbooks [71], www.fortunechina.com [72]
The first data source, the China Automotive Industry Yearbook, is edited jointly by the State-owned Assets Management Committee, National Development and Reform Commission, the Ministry of Commerce, and the Federation of Machinery Industry. This yearbook tracks all aspects of China’s automobile industry development and comprises the important indicators concerning the CAMI. Therefore, it is widely used by scientific researchers as a continuous, comprehensive, and authoritative tool.
The China Statistical Yearbook is the other annual statistical publication from the National Bureau of Statistics of China, and it reflects every aspect related to both the economic and social development of China. It includes data for the reported years, key statistical data in recent years, and some historically important years on both national and local levels.
The Zhonghong Industry Database is developed based on the data from the National Bureau of Statistics of China, National Development and Reform Commission, General Administration of Customs, and the departments in charge of industry sectors and industry associations. It incorporates the data of ten pillar industries of Chinese manufacturing, such as the automotive, petrochemical, and mechanical industries and the data of five pillars of the service industry, such as transportation and tourism. Because of its enormous amount of data information, the Zhonghong Industry Database is considered useful for industrial analysis. However, it is mainly recognized and used by Chinese researchers [3,73,74], but not by foreign researchers, mostly because of the language issue.
Finally, yet importantly, we chose the panel data of 29 provinces, excepting Tibet and Ningxia provinces. This is mainly because automotive industry in these two regions almost does not exist.

3.3. Data Analysis

As mentioned previously, the study used multiple regression analysis to test hypotheses 1 and 2 and cluster analysis to test hypotheses 3 and 4. The two methods are explained in detail, as follows. Their reliability and validity are also discussed.

3.3.1. Multiple Regression Analysis of the Panel Data

We mainly used Eviews 6.0 to run a multiple regression analysis of the panel data. Firstly, we established the multivariable linear regression model as follows:
Y i t = φ A i t + λ B i t + u i t
where Y i t denotes the industrial upgrading effect, A i t denotes internal technological innovation capability, B i t denotes external linkage effect, A i t denotes the error term.
Before we run a multiple regression analysis of the panel data, the data had to be processed beforehand. In this case, we used mean-standard deviation method to make the original data dimensionless, and we then weighted the relevant indicators to represent each variable. Accordingly, industrial upgrading effect, ITIC, and EL effect are represented as fellows.
Industrial upgrading effect:
Y i t = 1 / 2 ( α y 1 i t + β y 2 i t )
Internal technological innovation capability:
A i t = 1 / 2 ( γ a 1 i t + δ a 2 i t )
External-linkage effect:
B i t = 1 / 2 ( η b 1 i t + ω b 2 i t )
where α , β , γ , δ , η , ω are equal to 1; y 1 i t denotes internal improvement of the automotive manufacturing industry, y 2 i t denotes elevation of relative position of automotive manufacturing industry in the global value chain; a 1 i t denotes ratio of R&D expense of automobile industry to revenue, a 2 i t denotes output value of new products; b 1 i t denotes ratio of automobile parts investment to total investment in the auto industry, b 2 i t denotes location quotient.
For the multiple regression analysis of the panel data, there are generally three types of estimation models: the pooled regression, individual-mean corrected regression, and unrestricted models. The co-variance test method can be used to decide which model is appropriate for the study. We input the processed independent variables and the dependent variable into Eviews. According to the formulas F 1 = ( s 2 s 1 ) / [ ( n 1 ) k ] s 1 / [ n ( t k 1 ) ] and F 2 = ( s 3 s 1 ) / [ ( n 1 ) ( k + 1 ) ] s 1 / [ n ( t k 1 ) ] , it is possible to calculate two F statistics: F1 = 1.2973733 and F2 = 6.9928127. Checking the F distribution table, the corresponding critical values were determined as F1 (84, 116) = 1.390598 and F2 (112, 116) = 1.362008, given the 5% significant level. Because F1 was less than the corresponding critical value and F2 was greater than the corresponding critical value, the individual-mean corrected regression model was chosen. Nevertheless, it can be further divided into the fixed-effect model and random-effect model, according to the different forms of individual effect. In regional economy studies, the fixed-effect model is generally believed to be better than the random-effect model, considering that the error term and independent variables are significantly correlated. This choice was further confirmed using the Hausman test in the study, as the P value is 0.0084, meaning that the null hypothesis should be refused and the fixed-effect model chosen. Finally, we adopted the “cross-section weights” method for estimation, to eliminate the heteroscedasticity of the panel data.

3.3.2. Cluster Analysis of the Panel Data

Panel data has a complicated numeric structure form, incorporating not only cross-sectional data but also time-series data, which is the source of the difficulty in conducting the cluster analysis of panel data. Bonzo and Hermosilla (2002) firstly introduced multivariable statistics to the analysis of panel data [75]. They used a probability link function and a genetic algorithm to improve the algorithm for the cluster analysis of panel data. Since their study, the cluster analysis of panel data has seldom been discussed. To make a cluster analysis of the multivariable panel data, this study followed the method proposed by Zheng (2008), according to which, cluster analysis of the panel data has to deal with two core problems [76]: determining which statistics represent the similarity between objects and which systematic clustering method should be used to identify the similarity between clusters. Regarding the former, this paper adopted Euclidean distance function to describe the similarity between the objects, and more specifically, a new Euclidean distance function proposed by Zheng (2008):
d r k = { t = 1 T j = 1 P [ X r j ( t ) X k j ( t ) ] 2 } 1 2
where drk denotes the “Euclidean distance” between the rth object and the kth object.
For the clustering method, this study relied on the hierarchical clustering with Ward’s method, following the suggestion of Zheng (2008). The function of error sum of squares of multivariable panel data can be calculated as:
S g = t = 1 T j = 1 P i i g [ X i j ( t ) X ¯ j g ( t ) ] 2
where Sg denotes the error sum of squares in the gth cluster, ig denotes the set of all objects in the gth cluster, and denotes the average value of all objects in the gth cluster on the ith indicator at the tth time.
Last but not least, the normal software, such as SPSS and Eviews, does not provide the function for cluster analysis of multivariable panel data. In this case, we followed the suggestion of Zheng (2008) and processed the data by programming based on the CLUSTER model in R software.

4. Results and Discussions

4.1. Results of the Regression Analysis and Discussions

As mentioned previously, the regression analysis was used to test hypotheses 1 and 2. In this part, we also conducted a sensitive check. We constructed two other regression models, i.e., model 2 and model 3, which were modified based on model 1. In model 2, we removed the independent variable “ITIC” to check the individual influence of EL on industrial upgrading. Similarly, in model 3, we removed the independent variable “EL” to check the individual influence of ITIC on industrial upgrading. By comparing models 1, 2, and 3, we are able to find whether the independent variables “ITIC” and “EL” are sensitive to the dependent variable industrial upgrading effect or not. The results obtained from the regression analysis can be found in Table 2.
Table 2. Empirical results of regression analysis.
VariablesModel 1Model 2Model 3
Constant4.20 × 10−112.34 × 10−3220.64 × 10−43 *
(1.79 × 10−9)(1.14 × 10−55)(2.23 × 10⁻²³)
Internal technological innovation capability ( A i t )0.217423 *** 0.423562 **
(3.719894)(4.156323)
External linkage effect ( B i t )0.197047 *2.472564 **
(2.370632)(2.512144)
R20.8560470.8334410.843251
Modified R20.8337340.8128630.827342
F38.3659033.7452335.63453
Note: “***”, “**”, and “*” respectively denotes the significant level of 1%, 5%, and 10%; the values in the brackets are t values.
From model 1, it is possible to see that the equation has a high R-Square (0.856047), reflecting a good degree of overall fit. The P statistics is very small (0.0000), indicating that the overall linear regression equation is significant. The value of the Durbin-Watson test is within 1.8–2.2 (1.831633), showing there is no autocorrelation. Furthermore, the multicollinearity is also not significant in this equation. By comparing models 1, 2 and 3, we can find that both the ITIC and EL are sensitive to industrial upgrading effect. In model 2, without the variable “ITIC”, the effect of EL on industrial upgrading is significant, while in model 3 without the variable “EL effect”, the effect of ITIC on industrial upgrading is also significant. Therefore, it is reasonable to propose that both ITIC and EL are the main factors which influence the industrial upgrading in the global value chain because each of them can greatly affect the industrial upgrading independently. In addition, model 1 also indicates that ITIC and EL effects can have great influence on the industrial upgrading of CAMI in global value chain jointly. Furthermore, the influence of ITIC on the upgrading of the CAMI seems to be a little bit more than that of the EL effect.
According to the above results, it can be concluded that, at the current stage, the effects of both the ITIC and the EL on the global value chain are important for the upgrading of the CAMI. It is therefore not sensible to recommend only one way to facilitate the upgrading. ITIC is indeed a very important source for the upgrading of the CAMI. However, the CAMI should also take full advantage of EL, as well as external knowledge, to accelerate the accumulation of its ITIC. The industry, according to the results shown in Table 2, definitely benefits significantly from the ELs, including both global modular-production cooperation and location clustering, although it is common that the partners from the developed countries are less positive on transferring higher knowledge and more knowledge [11,49]. In short, not surprisingly, it is suggested that at this stage, the CAMI should depend on both ITIC and the EL effect to realize its upgrading in the global value chain.
However, the results in Table 2 also show that the ITIC is comparatively more important than the EL effect for the upgrading of the CAMI, although the relative importance is not so significant. This, to some extent, indicates that the CAMI might have already passed the phase in which it depends only on the technology spillover of Western multinational corprorations and mainly focuses on low-value-added manufacturing activities. Instead, the improvement of ITIC will play an increasingly important role in the upgrading of CAMI. In fact, in the process of learning from Western MNCs, the CAMI has gradually accumulated certain ITICs. The increase of ITIC of the CAMI enterprises, in turn, promotes the cooperation with external partners and the acquisition of external knowledge. For example, the development of ITIC enables the CAMI to participate in or even play an important role in the global modular value chains, in which partners are more-or-less equal [13] and are willing to transfer more-advanced technologies between each other through unique cooperation-competition mechanisms [77,78]. Furthermore, in the local automotive clusters, the improvement of the ITIC of leading automotive enterprises may promote the increase of technology diffusion within the cluster, and it is regarded as one of the main motives to stimulate the upgrading of the whole cluster [79,80].
In summary, as for the debate about the influence of ITIC and ELs, it is firstly believed that their influence on the upgrading of the CAMI is different at different development phases. Based on the empirical study results, it is proposed that, at the current phase, ITIC is the more-important approach for the upgrading of the CAMI in the global value chain. Nevertheless, it should also be noted that it might not be so effective if solely relying on the development of ITIC for the upgrading. As an accelerator for the upgrading in the global value chain, the ELs are also indispensable.

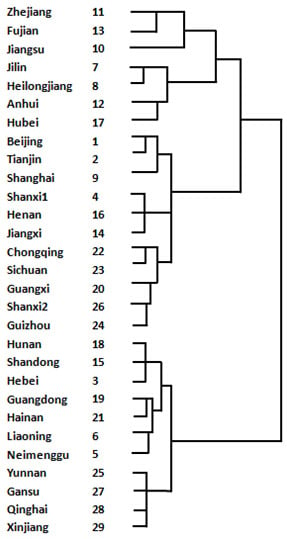
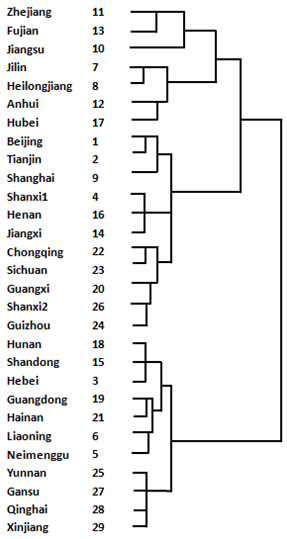
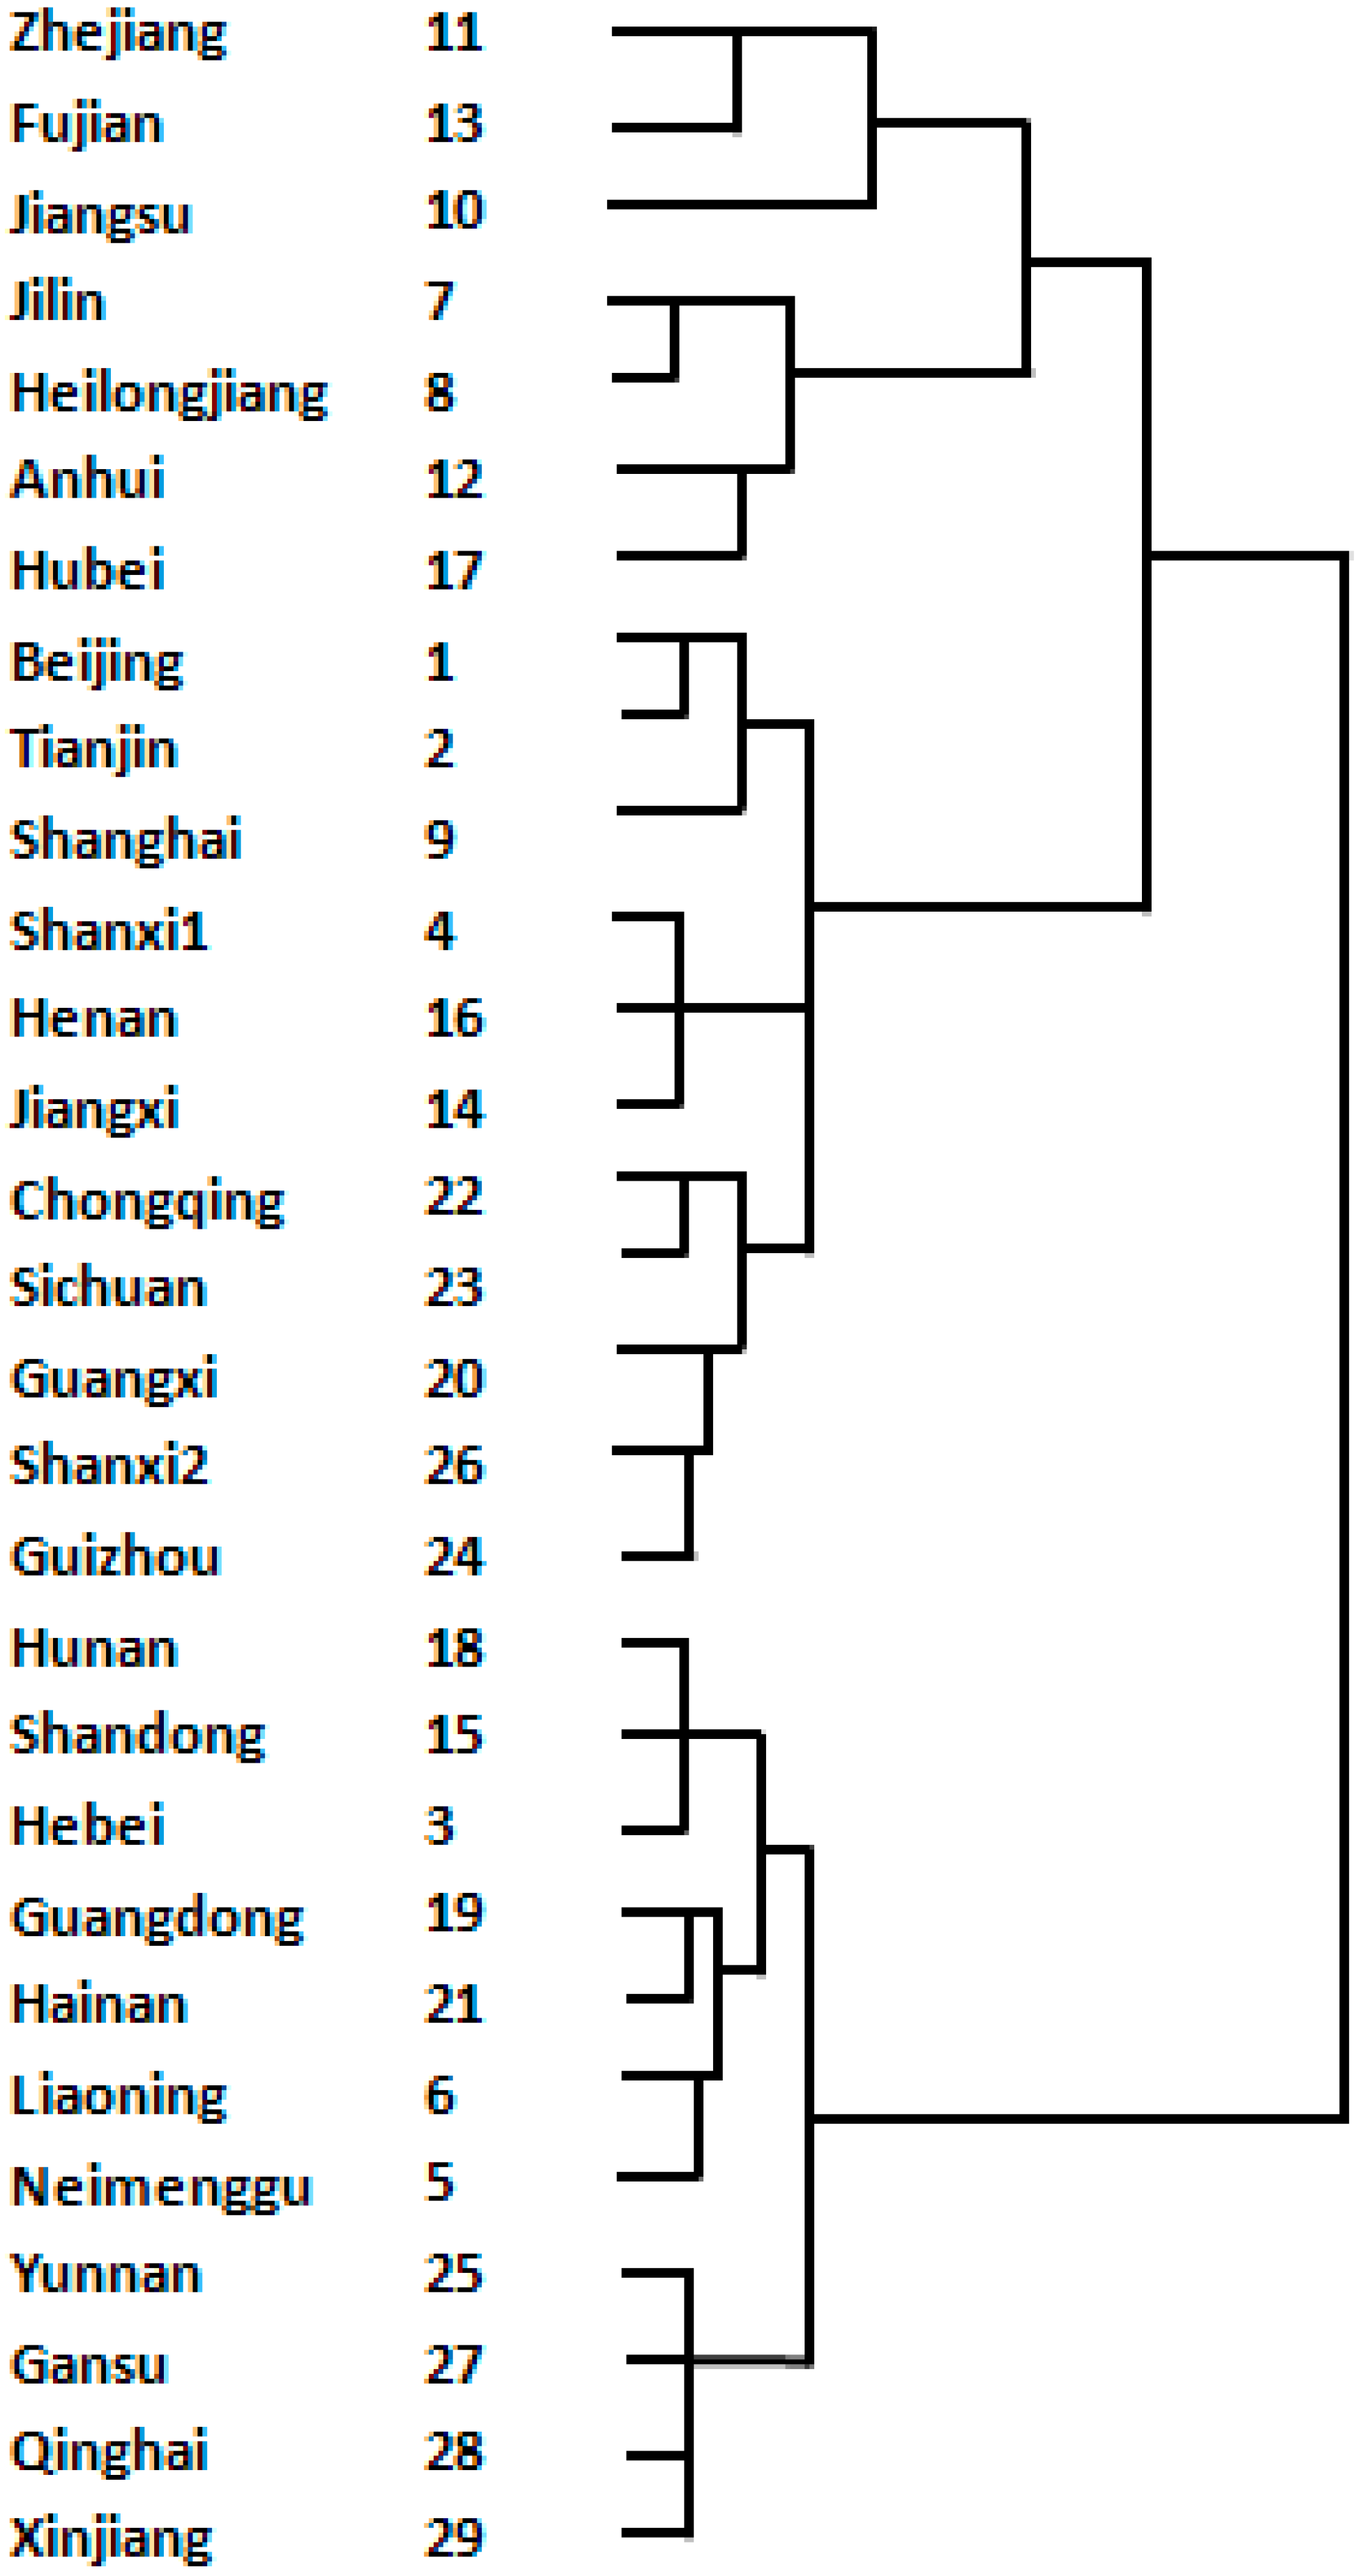
4.2. Results of the Cluster Analysis and Discussions

Based on the methods described in Section 3, we made a cluster analysis of the multivariable panel data. The cluster pedigree charts can be seen in Figure 1 and Figure 2. The choice of number of clusters is often ambiguous. To a large degree, it depends on the desired clustering resolution of the users. To make the cluster analysis more intelligible, we adopted the simple rule of thumb to set the number of the clusters. According to Mardia et al. (1980), the possible number of clusters can be estimated according to: k n 2 , where n is the number of objects [81]. Based on this formula and considering n = 29 in this paper, we were able to know k is between 3 to 4. Combing our knowledge and judgment, we finally decided that the number of clusters for the first cluster analysis is 3 and the number of clusters for the second cluster analysis is 4.
Based on Figure 1, we classified the 29 provinces into three categories in terms of the development of ITIC as follows:
Figure 1 shows that hypothesis 3 is supported, as different regions of China are indeed different in terms of the development of the ITIC of their automotive manufacturing industries (see Table 3).
Figure 1. Cluster pedigree chart of development of ITIC of provinces. Note: Shanxi1 and Shanxi2 are different provinces. The capital of Shanxi1 is Taiyuan, whereas the capital of Shanxi2 is Xi’an.
Sustainability 07 06189 g001
Figure 2. Cluster pedigree chart of development of EL of provinces. Note: Shanxi1 and Shanxi2 are different provinces. The capital of Shanxi1 is Taiyuan, whereas the capital of Shanxi2 is Xi’an.
Sustainability 07 06189 g002
Table 3. Cluster analysis result of development of internal technological innovation capability (ITIC) of provinces.
Level of development of ITICProvinces
Provinces with high development of ITIC Jiangsu, Shanghai, Guangdong, Anhui, Hubei, and Chongqing
Provinces with medium-level development of ITIC Jilin, Beijing, Heilongjiang, Henan, Jiangxi, Fujian, and Zhejiang
Provinces with low development of ITIC Liaoning, Tianjing, Shandong, Hebei, Sichuan, Shanxi2, Shanxi1, Hunan, Neimenggu, Hainan, Guangxi, Guizhou, Yunnan, Gansu, Qinghai, and Xinjiang
In the first category, i.e., provinces with a high development of ITIC, Shanghai, Jiangsu and Guangdong are the coastal provinces while Hubei, Anhui, and Chongqing are located in the middle and the west of China. It is actually not surprising to see Shanghai, Jiangsu and Guangdong are on the list, as they have relatively high-developed automotive manufacturing industry and many big automobile joint-ventures. Nevertheless, for the latter three provinces, they are on the list because they are the ones where some big state-owned or private-owned enterprises are located. For example, the headquarters of Dongfeng motor corporation, i.e., one of the four automobile magnets in China, is located in Hubei. For Anhui province, it also has several big automotive manufacturers such as Jianghuai Motor Co. Ltd. and Cherry Automobile Co. Ltd. Chongqing is the automotive manufacturing center of the western regions of China. Therefore, the automotive industry in these provinces also has high ITIC.
In the second category, i.e., provinces with medium-level development of ITIC, Jilin and Heilongjiang are the traditional automotive manufacturing bases of China. Accordingly, they have relatively good foundations for developing their ITIC. The other regions (i.e., Beijing, Henan, Jiangxi, Zhejiang and Fujian) have relatively developed automotive industries. All of them have some big automotive manufacturing enterprises, such as Beijing Automotive Manufacturing Enterprise in Beijing, Jiangling Motors Corporation in Jiangxi province, Geely Holding Group in Zhejiang province, Zhengzhou YuTong Group in Henan province, and Fujian Automobile Industry Group Co., Ltd., in Fujian province.
In the third category, i.e., provinces with low development of ITIC, all of them do not have highly developed automotive manufacturing industry.
Based on these results, we can find most Chinese domestic leading automotive manufacturing enterprises are distributed in the regions of first two categories. In this case, it is reasonable to propose that the more developed the regional automotive manufacturing industry is, the greater importance is attached there to the development of ITIC.
Similarly, based on Figure 2, we classified the 29 provinces into four categories in terms of the development of EL (see Table 4):
Table 4. Cluster analysis result of development of external linkages (ELs) of provinces.
Level of development of ELProvinces
Provinces with highest development of EL Jilin, Heilongjiang, Anhui, Hubei
Provinces with high development of EL Zhejiang, Fujian, Jiangsu
Provinces with general development of EL Beijing, Tianjing, Shanghai, Shanxi1, Henan, Jiangxi, Chongqing, Sichuan, Guangxi, Shanxi2, Guizhou
Provinces with low development of EL Hunan, Shandong, Hebei, Guangdong, Hainan, Liaoning, Neimenggu, Yunnan, Gansu, Qinghai, Xinjiang
It is possible to see from Figure 2 that hypothesis 4 is not fully supported.
First, based on Figure 2, we find that, for all four provinces in the first category, i.e., provinces with highest development of EL, none of them are the eastern regions. In these regions, large state-owned automotive manufacturing enterprises constitute their automotive industries, especially Jilin and Hubei, where two of the three biggest automotive enterprises of China are located. The leading state-owned automotive enterprises in these provinces have generally developed good ELs. They have established strong cooperation relationship with large foreign automotive enterprises. For example, the First Automobile Works (FAW) has cooperated widely with Volkswagen, Toyota, Mazda, GM, etc. Dongfeng Motor Corporation has also established numbers of joint ventures with Honda, Nissan, and KIA. Besides the traditional industrial bases in China mentioned earlier, relatively mature automotive industrial clusters exist in Jilin and Heilongjiang, to support the development of automotive manufacturing industries in these provinces. The situation is a little different for Anhui province. As the traditional automotive manufacturing province, Anhui has some big private and state-owned automotive enterprises, but it still places much emphasis on developing the independent brands as well on the development of ELs.
The second category reflected in Figure 2, i.e., provinces with a high development of EL, includes three coastal provinces that focus on automotive parts and components manufacturing. To some extent, their locations enable them to have many opportunities to cooperate with foreign automotive industries. Furthermore, they have also grown relatively mature automotive industrial clusters since the 1980s, which has greatly stimulated the development of their automotive components industries, constituted mostly by small and medium-sized companies. Meanwhile, as illustrated in Figure 1, the industries in these provinces also have attached great importance to the development of their ITIC. Therefore, we might suggest that at the present stage, the automotive manufacturing industries in these regions focus on cultivating their ITIC, while also taking full advantage of their ELs to facilitate their upgrading in the global value chain.
As for the third category, i.e., provinces with general development of EL, it is surprising to find that some regions with developed automotive industries, such as Chongqing and Shanghai, have a relatively low extent of EL effect. In fact, this might influence the upgrading of automotive manufacturing industries in these regions. Taking Chongqing as an example of the big automotive manufacturing base in China, the automotive industry there has established quite a large number of joint ventures with foreign automotive enterprises, and it is actively involved in the global value chain. However, it is also necessary to indicate that the industrial cluster in this region is not sound enough to provide solid support for the upgrading of the industry. As it is located in the west of China, the automotive manufacturing industry in Chongqing lacks the support of related industries in the surrounding areas. Similarly, the automotive manufacturing industry in Shanghai has also established wide linkages with foreign industries in terms of R&D, manufacturing and components manufacturing. One of the three biggest automotive enterprises in China, SAIC Motor Corporation Limited, is actually located in Shanghai, which has established broad cooperation with Volkswagen and GM. However, these two automotive magnets have their own series of technology standards and systems. This in turn leads to the incompatibility of the automotive components and accordingly makes the formulation of industrial clusters difficult in this region. In other words, the support of automotive industrial clusters is limited to the automotive manufacturing industry in Shanghai.

5. Conclusions

5.1. Theoretical Contributions

Today, the upgrading of China’s manufacturing industries has attracted much attention from both academics and practitioners, as it certainly has great implications for the development of China and even further for the development of the world. This study specifically focused on one of the pillar industries of the Chinese economy, the CAMI. Based on the panel data of the CAMI, the study investigated the influence of both ITIC and EL on the upgrading of the CAMI in global value chain, and further explored the regional differences in both the development of ITIC and the utility of EL. The contributions of this paper are threefold.
First, the results of our regression analysis confirm that, at the current stage, both ITIC and ELs are important for the upgrading of CAMI. With the development of ITIC, the CAMI can still get a considerable amount of external knowledge from the ELs. This is different from the international investment theory, which holds the view that, with the narrowing of technology gap, the party with higher technology will be less likely to transfer more and higher knowledge to their partners.
Second, the results indicate that ITIC seems to be relatively more important than EL for the upgrading of the CAMI. The improvement of ITIC actually facilitates the CAMI to cooperate with ELs and have better access to their knowledge. It enables the CAMI to participate in the modular-production network, which accordingly facilitates the upgrading of the CAMI. Moreover, it also helps to prompt the upgrading of industrial clusters that the CAMI depends on. The upgrading of automotive industrial clusters, in turn, increases the quality and amount of technology transferred in the clusters and further accelerates the upgrading of the automotive industry.
Third, the results of the cluster analysis reveal regional differences in the development of both ITIC and the utility of ELs. It is found that most regions with relatively developed automotive industries place great emphasis on both ITIC and ELs. The upgrading of the automotive industry in these regions is relatively healthy. However, the cluster analysis also indicates some potential issues. One notable issue is that in some regions with relatively developed automotive industries, such as Shanghai and Chongqing, the utility of ELs seems to be insufficient. Although automotive industries in these regions have generally established wide collaborations with big foreign automotive enterprises, less emphasis is attached to the development of local industrial clusters. The problem of forming clusters but not enjoying the advantage of clustering is quite common in these regions.

5.2. Managerial Implications

The empirical results provide some practical references for the upgrading of the CAMI in the global value chain. First, more emphasis should be placed on the accumulation of ITIC for the CAMI. With the deepening of the opening and reform policy, there is a tendency for most Chinese enterprises to place too much emphasis on cooperation with foreign enterprises. However, the development of CAMI joint ventures shows that relying heavily on ELs without having a planned development strategy may make the CAMI gradually lose its competitiveness. The results also indicate that an industry’s investment in innovation activities and their efforts to improve their products are quite essential for their upgrading in the global value chain. This is significant for the CAMI, when facing the development difficulties and obstacles set by foreign lead enterprises in the global value chain. The results suggest that enterprise managers should realize the importance of accumulating ITIC. Learning by imitation and integrated innovation are the effective ways for the CAMI to accumulate ITIC. Joint efforts of managers and policymakers are needed to stimulate the learning of the CAMI for advanced technology. In particular, the manufacturers’ absorptive capacity should be further enhanced. Moreover, a more competitive environment is needed, especially for Chinese state-owned automotive manufacturers, to stimulate their strong desire to learn and absorb new knowledge. Second, a regional development map of the CAMI is described in this paper. It matches the development realities of these regions and helps us to better evaluate the development and upgrading possibility of these regions. In addition, some potential problems are also highlighted, such as, that the clustering advantages are not being fully used in some relatively advanced regions. In this case, comprehensive measures are needed in the regions to stimulate the development of local clusters, such as governmental policies to help the development of related industries and enterprises and the design of motivation mechanism to promote cooperation within clusters [82,83].

5.3. Limitations and Future Research

Certainly, the study has some limitations. Because of the obtainability of data, the selection of indicators is somewhat constrained. Most of the indicators have been used in some articles, and their reliability is convincible. Two of them are designed for this paper. Although their designs are based on the definitions of the corresponding concepts and are logical enough, it will still make the empirical study more thorough if the use of them can be further tested. Future research could be developed in this direction. Besides, it would be equally important to further explore how and why internal capacity and external linkages influence the upgrading of the CAMI, where case-study approach with in-depth interviews with the main stakeholders can be quite useful.

Acknowledgments

This work is supported by the National Natural Science Foundations of China (grant numbers: 71462009, 71163014, 71463020, and 71361013), and the Natural Science Foundations of Jiangxi Province (grant number: 20142BA217018).

Author Contributions

Prof. Lu and Dr. Cheng were responsible for the design of the whole paper; Dr. He and Dr. Cheng wrote the paper; Dr. Chen gave valuable advices for the revision; Dr. Ning and Dr. Mei collected the data and also related papers for literature review.

Supplementary Materials

Supplementary materials can be accessed at: https://www.mdpi.com/2071-1050/7/5/6189/s1.

Conflicts of Interest

The authors declare no conflict of interest.

References

  1. China’s Statistical Yearbook; China Statistics Press: Beijing, China, 2011.
  2. Gereffi, G. International trade and industrial upgrading in the apparel commodity chain. J. Int. Econ. 1999, 48, 37–70. [Google Scholar] [CrossRef]
  3. Ding, Z.; Wu, Y. Choice of upgrading path of Chinese car industry and suggestions-based on global value chain. Soc. Sci. J. 2009, 1, 104–107. [Google Scholar]
  4. Xue, S.P. The issue of Chinese automobile parts small and medium-sized enterprises embedded in global value chain and suggestions. Econ. Res. Guide 2009, 8, 28–29. [Google Scholar]
  5. Yang, D.H. Analysis on the development model of Chinese automobile industry-from global value chain perspective. Int. Econ. Cooper. 2010, 2, 20–24. [Google Scholar]
  6. Liu, Y.; Ma, W. Micro mechanism of automobile industrial upgrading in China based on SEM-take Jiangxi Province as an example. East China Econ. Manag. 2012, 8, 66–70. [Google Scholar]
  7. Humphrey, J.; Schmitz, H. How does insertion in global value chains affect upgrading in industrial clusters. Reg. Stud. 2002, 36, 1017–1027. [Google Scholar] [CrossRef]
  8. Ernst, D.; Kim, L. Global production networks, knowledge diffusion, and local capability formation a conceptual framework. In Proceedings of the Nelson & Winter Conference, Aalborg, Denmark, 12–15 June 2001.
  9. Ernst, D. How Sustainable are Benefits from Global Production Networks? Malaysia’s Upgrading Prospects in the Electronics Industry; Working Paper [No. 58] of East-West Center Economics Series; East-West Center: Honolulu, HI, USA, 2003. [Google Scholar]
  10. Avdasheva, A.; Budanov, I.; Golikova, V.; Yakovlev, A. Upgrading Russian Enterprises from the Value Chain Perspective: The Case Study of Tube & Pipe and Furniture Sectors. Available online: http://discovery.ucl.ac.uk/17511/ (accessed on 18 May 2015).
  11. Yang, Y. The Taiwanese Notebook Computer Production Network in China: Implication for Upgrading of the Chinese Electronics Industry. Working Paper of Personal Computing Industry Center. Available online: http://escholarship.org/uc/item/82h77681#page-2 (accessed on 18 May 2015).
  12. Humphrey, J. Upgradingg in Global Value Chain. Working Paper No. 28 for International Labor Office. Available online: http://www.ilo.int/wcmsp5/groups/public/---dgreports/---integration/documents/publication/wcms_079105.pdf (accessed on 18 May 2015).
  13. Gereffi, G.; Humphrey, J.; Sturgeon, T. The governance of global value chains. Rev. Int. Polit. Econ. 2005, 12, 78–104. [Google Scholar] [CrossRef]
  14. Giuliani, E.; Pietrobelli, C.; Rabellotti, R. Upgrading in global value chains: Lessons from Latin American clusters. World Dev. 2005, 33, 549–573. [Google Scholar] [CrossRef]
  15. Lopez, R.V. Is it possible to upgrade in global value chains? A comparison between industrial policy in Mexico and the Asian experience. Revista de Globalización, Competitividad & Gobernabilidad 2012, 6, 119–130. [Google Scholar]
  16. Gereffi, G.; Tam, T. Industrial upgrading through organizational chains: Dynamics of rent, learning, and mobility in the global economy. In Proceedings of the 93rd Annual Meeting of the American Sociological Association, San Francisco, CA, USA, 21–25 August 1998.
  17. Kaplinsky, R.; Morris, M. A Handbook for Value Chain Research. Working Paper of IDRC. Available online: http://www.prism.uct.ac.za/papers/vchnov01.pdf (accessed on 18 May 2015).
  18. Tokatli, N.; Eldener, Y.B. Upgrading in the Global Clothing Industry: The Transformation of Boyner Holding. Compet. Change 2004, 8, 173–193. [Google Scholar] [CrossRef]
  19. Humphrey, J.; Schmitz, H. Governance and Upgrading: Linking Industrial Cluster and Global Value Chain Research; Working Paper 120 of IDS; Institute of Development Studies: Brighton, UK, 2000. [Google Scholar]
  20. Poon, T.S.C. Beyond the global production networks: A case of further upgrading of Taiwan’s information technology industry. Int. J. Technol. Glob. 2004, 1, 130–144. [Google Scholar] [CrossRef]
  21. Abernathy, W.J.; Clark, K.B. Innovation: Mapping the winds of creative destruction. Rese. Policy 1985, 4, 3–22. [Google Scholar] [CrossRef]
  22. Zahra, S.A.; George, G. Absorptive capacity: A review, reconceptualization, and extension. Acad. Manag. Rev. 2002, 27, 185–203. [Google Scholar]
  23. Felin, T.; Hesterly, W.S. The knowledge-based view, nested heterogeneity, and new value creation: Philosophical considerations on the locus of knowledge. Acad. Manag. Rev. 2007, 32, 195–218. [Google Scholar] [CrossRef]
  24. Cockburn, I.M.; Henderson, R.M. Absorptive capacity, coauthoring behavior, and the organization of research in drug discovery. J. Ind. Econ. 1998, 46, 157–182. [Google Scholar] [CrossRef]
  25. DeCarolis, D.M.; Deeds, D.L. The impact of stocks and flows of organizational knowledge on firm performance: An empirical investigation of the biotechnology industry. Strat. Manag. J. 1999, 20, 953–968. [Google Scholar] [CrossRef]
  26. Deeds, D.L. The role of R&D intensity, technical development and absorptive capacity in creating entrepreneurial wealth in high technology start-ups. J. Eng. Technol. Manag. 2001, 18, 29–47. [Google Scholar] [CrossRef]
  27. Coombs, J.E.; Bierly, P.E. Measuring technological capability and performance. R&D Manag. 2006, 36, 421–438. [Google Scholar] [CrossRef]
  28. Stuart, T.E. Interorganizational alliances and the performance of firms: A study of growth and innovation rates in a high-technology industry. Strat. Manag. J. 2000, 21, 791–811. [Google Scholar] [CrossRef]
  29. Zong, G.; Ma, N. Study on the evaluation of industrial enterprises’ competitiveness based on DEA method. Quant. Techn. Econ. 2002, 12, 92–95. [Google Scholar]
  30. Gong, S. Industrial upgrading, position in global value chain and enterprise competitiveness. North. Econ. 2009, 10, 67–68. [Google Scholar]
  31. Liu, Y.; Ma, W.; Liu, D. Study on macro mechanism of automobile industrial upgrading in China. Sci. Technol. Manag. Res. 2012, 13, 135–139. [Google Scholar]
  32. Kishimoto, C. Clustering and upgrading in global value chains: The Taiwanese personal computer industry. In Local Enterprises in the Global Economy: Issues of Governance and Upgrading; Schmitz, H., Ed.; Edward Elgar Publishing: Northampton, MA, USA, 2004. [Google Scholar]
  33. Saxenian, A.; Hsu, J.Y. The Silicon Valley–Hsinchu connection: Technical communities and industrial upgrading. Ind. Corp. Change 2010, 10, 893–920. [Google Scholar] [CrossRef]
  34. Krugman, P. Increasing returns and economic geography. J. Polit. Econ. 1991, 99, 483–499. [Google Scholar] [CrossRef]
  35. Best, M.H. The New Competitive Advantage: The Renewal of American Industry; Oxford University Press: New York, NY, USA, 2001. [Google Scholar]
  36. Wallsten, S.J. An empirical test of geographic knowledge spillovers using geographic information systems and firm-level data. Reg. Sci. Urban Econ. 2001, 31, 571–599. [Google Scholar] [CrossRef]
  37. Asheim, B.T.; Isaksen, A. Regional innovation systems: The integration of local ‘sticky’ and global ‘ubiquitous’ knowledge. J. Technol. Transfer 2002, 7, 77–86. [Google Scholar] [CrossRef]
  38. McEvily, B.; Zaheer, A. Bridging ties: A source of firm heterogeneity in competitive capabilities. Strat. Manag. J. 1999, 20, 1133–1156. [Google Scholar] [CrossRef]
  39. Zhou, Y. A research of upgrading of automobile industry in China on the base of global value chain. Automobile Sci. Technol. 2006, 6, 7–10. [Google Scholar]
  40. Langlois, R.N.; Robertson, P.L. Networks and innovation in a modular system: Lessons from the microcomputer and stereo component industries. Res. Policy 1992, 21, 297–313. [Google Scholar] [CrossRef]
  41. Sturgeon, T.J. What Really Goes on in Silicon Valley? Spatial Clustering and Dispersal in Modular Production Networks. J. Econ. Geogr. 2003, 3, 199–225. [Google Scholar] [CrossRef]
  42. Liang, J. Study on industrial upgrading in developing countries-a global value chain framework. Tianjing Soc. Sci. 2007, 4, 86–92. [Google Scholar]
  43. He, W.; Chen, S.H. Game analysis of determinants of stability of semiconductor modular production networks. Sustainability 2014, 6, 4772–4794. [Google Scholar] [CrossRef]
  44. Mao, Y.; Wu, Y. Study on enterprise upgrading path and analysis model. J. Sun Yat-Sen Univ. 2009, 1, 178–186. [Google Scholar]
  45. Gereffi, G.; Korzeniewicz, M. Commodity Chains and Global Capitalism; Praeger: Westport, CT, USA, 1994. [Google Scholar]
  46. Kaplinsky, R.; Readman, J. Integrating SMEs in Global Value Chains: Towards Partnership for Development. In Proceedings of the United Nations Conference on Trade and Development, Vienna, Austria, 10–12 August 2001.
  47. Bair, J. Global capitalism and commodity chains: Looking back and going forward. Compet. Change 2005, 9, 153–180. [Google Scholar] [CrossRef]
  48. Madalena, F. Global value chains and technological upgrading in peripheral regions: The footwear industry in North Portugal. In Proceedings of the Regional Studies Association International Conference, Aalborg University, Aalborg, Denmark, 28–31 May 2005.
  49. Lorentzen, J.; Barnes, J. Learning, upgrading, and innovation in the South African automotive industry. Eur. J. Dev. Res. 2004, 16, 465–498. [Google Scholar] [CrossRef]
  50. Hotopp, U.; Radosevic, S.; Bishop, K. Trade and industrial upgrading in countries of Central and Eastern Europe: Patterns of scale- and scope-based learning. Emerg. Mark. Finance Trade 2005, 41, 20–37. [Google Scholar]
  51. Lin, J.Y.; Wang, Y. China’s Integration with the World Development as a Process of Learning and Industrial Upgrading; Working Paper [No. 4799] of Policy Research; World Bank: Washington, DC, USA, 2008. [Google Scholar]
  52. Richado, D. On the Principles of Political Economy and Taxation; The Commercial Press: Beijing, China, 1976. [Google Scholar]
  53. Richardson, H.W. Elements of Regional Economics; Penguin Books: Harmondsworth, USA, 1969. [Google Scholar]
  54. Wu, Y. Study on comparative advantages and absolute advantages. Cooper. Econ. Sci. Technol. 2008, 4, 12–18. [Google Scholar]
  55. Li, X.J.; Pang, L. Empirical study on regional differences of automotive industrial effect. Commerc. Res. 2009, 8, 23–27. [Google Scholar]
  56. Pang, L.; Li, X. Empirical study on regional differences of Chinese automotive industry competitiveness. J. Appl. Stat. Manag. 2011, 6, 46–52. [Google Scholar]
  57. Gong, S. Influence on Performance by the Impetus of Upgrading: An Analysis of Enterprises in Global Value Chains. Ph.D. Thesis, Jinan University, Jinan, China, 2007. [Google Scholar]
  58. Wang, Z.; Chen, G. Empirical analysis of interactive development between manufacturing sub-sectors and logistics industry: Based on gray correlational model. J. Shanghai Univ. Finance Econ. 2010, 12, 65–74. [Google Scholar]
  59. Yu, Y. Research on Competitive Power for Automobile Components and Parts Industry in China. Ph.D. Thesis, Jilin University, Jilin, China, 2008. [Google Scholar]
  60. Sheng, Y.; Wang, S.; Qiu, K. An empirical study of manufacturing technology transformation modes. Stud. Sci. Sci. 2011, 29, 692–698. [Google Scholar]
  61. Xiao, J.; Li, B.; Dong, W. Research on technical innovation influence to Jilin information technology manufacture industry and competitiveness. Inf. Sci. 2012, 30, 287–292. [Google Scholar]
  62. Wang, J.; Zhang, G. Organizational modularity and its measurement-an analytical framework based on loosely coupled system. J. Xidian Univ. 2008, 18, 1–10. [Google Scholar]
  63. Yan, B. Theory and Empirical Study of Chinese Automobile Industrial Cluster. Ph.D. Thesis, Shanghai Jiao Tong University, Shanghai, China, 2008. [Google Scholar]
  64. Wu, S. Empirical study on high-tech industrial clustering in Guangdong province. Spec. Zone Econ. 2010, 1, 34–36. [Google Scholar]
  65. Cui, Y.; Zang, X. Comparison with industry agglomeration and its participating in new international division of labor: Taking typical industries, agglomerate districts, Dongguan and Shaoxing, as an example. J. Int. Trade 2010, 4, 58–63. [Google Scholar]
  66. Zhang, L.; Lin, S. Research on the correlation between innovation agglomeration and industrial agglomeration. Stud. Sci. Sci. 2010, 4, 635–640. [Google Scholar]
  67. Illeris, S.; Sjoholt, P. The Nordic countries: High quality service in a low density environment. Progr. Plan. 1995, 43, 205–221. [Google Scholar] [CrossRef]
  68. Vera, B.; Zane, Z. The potential of cluster development and the role of cluster support policies in Latvia. Econ. Ann. 2011, 56, 35–67. [Google Scholar] [CrossRef]
  69. Zhonghong Industry Database. Available online: http://edu1.macrochina.com.cn (accessed on 18 May 2015).
  70. China Statistical Yearbooks; China Statistics Press: Beijing, China, 2001–2009.
  71. China Automotive Industry Yearbooks; China Automotive Industry Association Press: Beijing, China, 2001–2009.
  72. Fortune China. Available online: www.fortunechina.com (accessed on 18 May 2015).
  73. Tao, F.; Guo, J.W.; Yang, S.X. Technical efficiency of Chinese power generation and its deternimants in the period of electric-system transition. China Ind. Econ. 2008, 1, 68–76. [Google Scholar]
  74. Jiang, J.F.; Luo, Q.L. Resolving unfair distribution of income through transforming the mode of economic development. Finance Trade Econ. 2012, 9, 22–32. [Google Scholar]
  75. Bonzo, D.C.; Hrmosilla, A.Y. Clustering panel data via perturbed adaptive simulated annealing and genetic algorithms. Adv. Complex Syst. 2002, 4, 339–360. [Google Scholar] [CrossRef]
  76. Zheng, B.Y. The clustering analysis of multivariable panel data and its application. Appl. Stat. Manag. 2008, 27, 265–270. [Google Scholar]
  77. Sturgeon, T.J. Modular production networks: A new American model of industrial organization. Ind. Corp. Change 2002, 11, 451–496. [Google Scholar] [CrossRef]
  78. Cao, L.; Wang, H.; Chen, S. Dualism of modular production network and its implication on China’s enterprise. China Ind. Econ. 2008, 10, 33–42. [Google Scholar]
  79. Liu, K. Research on the Mechanism and Upgrading Path of Industrial Cluster. Ph.D. Thesis, Tianjing University, Tianjing, China, 2007. [Google Scholar]
  80. Zhang, J.; Zhang, S.; Liu, Z. Multi technology spillover effect, innovation impetus of local firms and path selection of industrial upgrading-based on the forms of Chinese local industrial clusters. Nankai Econ. Stud. 2007, 3, 34–43. [Google Scholar]
  81. Mardia, K.V.; Kent, J.T.; Bibby, J.M. Multivariate Analysis; Academic Press: London, UK, 1980. [Google Scholar]
  82. Agostino, M.; Giunta, A.; Nugent, J.; Scalera, D.; Trivieri, F. The importance of being a capable supplier: Italian industrial firms in global value chain. Int. Small Bus. J. 2014. [Google Scholar] [CrossRef]
  83. Bacchiocchi, E.; Florio, M.; Giunta, A. Internationalization and industrial districts: Evidence from the Italian automotive supply chain. Int. Rev. Appl. Econ. 2014, 28, 1–21. [Google Scholar] [CrossRef]

