Article

Computational and Experimental Investigation for an Optimal Design of Industrial Windows to Allow Natural Ventilation during Wind-Driven Rain

1
Department of Environmental Engineering, Changwon National University, Changwon 641-773, Korea
2
Department of Eco-Friendly Offshore Plant FEED Engineering, Changwon National University, Changwon 641-773, Korea
3
Andaman Environment and Natural Disaster Research Center, Interdisciplinary Graduate School of Earth System Science and Andaman Natural Disaster Management, Prince of Songkla University, Phuket Campus 83120, Thailand
4
Ventech Corp., Changwon 641-773, Korea
*
Author to whom correspondence should be addressed.
Sustainability 2015, 7(8), 10499-10520; https://doi.org/10.3390/su70810499
Submission received: 6 June 2015 / Revised: 24 July 2015 / Accepted: 28 July 2015 / Published: 5 August 2015

Abstract

:
With an increased awareness of sustainability issues, natural ventilation has become an elegant method for reducing the costs and environmental effects of the energy that is used to maintain comfortable indoor air quality rather than using mechanical ventilation. The windows in many industrial buildings are continuously open to exhaust pollutants and intake fresh air. Though windows are functional and efficient for natural ventilation, rainwater is able to penetrate through the windows during wind-driven rain. For industries in which the moisture content affects the quality of the product, the intrusion of a large amount of rainwater through windows must be prevented without compromising the effective ventilation. The aim of this research is to determine an innovative design for windows to accomplish the optimum of high ventilation and low rain penetration. For this purpose, windows are variously innovated and tested in full-scale measurements, reduced-scale wind-tunnel measurements and computational fluid dynamics (CFD). An artificial rain and wind velocity to mimic the average of the maximum values in Korea are created. The maximum reduction in rain penetration of over 98% compared to basic 90° open windows is attained with only a 4%–9% decrement of ventilation efficiency in the two recommended designs.

1. Introduction

Ventilation is used by industrial, residential, and commercial buildings to displace stale and polluted air with fresh external air to maintain a good indoor air quality (IAQ) and thermal comfort. Insufficient ventilation in enclosed spaces can cause problems such as excessive pollution, odors, overheating, and humidity, which can lead to adverse effects for an individual, such as nuisances, tiredness, suffocation, and sickness. The required air quality for any building is developed using either mechanical or natural ventilation. Mechanical ventilation, which is usually used as part of the heating, ventilation and air-conditioning (HVAC) systems, is desired because of its easy control. However, mechanical ventilation is also a major part of the building energy consumption and accounts for more than one third of the total energy used worldwide [1,2,3,4,5,6]. Natural ventilation uses natural forces, i.e., external wind and thermal buoyancy, as the main driving forces to introduce fresh air into the building [5,6]. Because of these natural factors, the ventilation depends on the size, shape and position of the openings such as the doors, windows, louvers, and gravity ventilators [2,7]. These ventilation devices are designed to facilitate the exchange of air without utilizing any energy or forced flow [1,2,8]. This process is designed to obtain satisfactory IAQs while realizing energy savings and sustainable development [4,9]. Natural ventilation is promoted for its adaptability into buildings and more comfortable environments when it is integrated correctly compared with mechanical ventilation. Mechanical ventilation is prone to complaints from users because of its noise, consumption of energy, requirement of routine maintenance and potential occurrence of health problems (sick building syndrome) [10,11]. Additionally, people are fascinated with natural ventilation because of its cost effectiveness, i.e., the capital, operational and maintenance costs, compared with those of mechanical ventilation [11]. To design a building that uses natural ventilation is more difficult than designing a similar building that uses mechanical ventilation because of the natural inconstancy of factors such as the external temperature, wind speed, occupant activities, and internal heating loads [12]. Therefore, an interdisciplinary knowledge of factors such as the climate, topography, orientation, and pollution is required for the proper design of naturally ventilated systems [13]. Despite the difficulty of such a design, people are encouraged to use natural ventilation because of its advantages over mechanical ventilation (no energy requirements and substantial cost effectiveness).
In previous years, the selection of windows based on its ventilation performance was judged rather qualitatively by using theoretical assumptions, and the effect of different window types was usually discounted because of the lack of quantitative information [14]. However, studies have been performed to quantify the performance and efficiency of windows using several methods, including full-scale measurements, reduced-scale wind-tunnel measurements and computational fluid dynamics (CFD). These methods each have their advantages and disadvantages [15]. Advantage of the full-scale on-site measurements include the assessment of true physical conditions and the avoidance of the scaling dilemma; this method was utilized by Van Hooff and Blocken [16] to generate data for the indoor environmental conditions that could be used in a CFD model validation. They concluded that the vital limiting factors for the reliability of the data were the lower number of measurement points and the ambiguity of measured data because of the limited repeatability of the analysis due to varying meteorological conditions. Gaoand Lee [17] and Fracastoro et al. [18] also performed full-scale measurements and used the results to perform a numerical analysis to compare the ventilation rate through open windows with different dimensions, ultimately producing a faster estimation of ventilation effectiveness and assisting in the design of buildings using natural ventilation. Reduced scale models display good repeatability in the measurements but the problem is lean possibility to perfectly imitate phenomena of a full-scale building [16]. Walker et al. [19] and Teppner et al. [20] adopted reduced-scale models to perform experiments, validate the numerical models, and understand phenomena related to a naturally ventilated building. CFD modeling could be utilized to imitate a full-scale experiment, but this process requires validation by a full- or reduced-scale measurement, and data for these indoor environmental parameters for the validation of the model remain scarce [16]. CFD was exploited by Stavrakakis et al. [4] and Shetabivash [21], and the CFD model was verified using available climatic and experimental data to investigate the effect of the opening on the airflow characteristics of the room and suggest optimum design variables for good ventilation. Additionally, studies have been conducted based on CFD, full-scale and reduced-scale measurements and have focused on natural ventilation through windows with varying factors, such as their types, opening angles, dimensions, opening configuration, building orientations, air velocities, and temperature differences [12,13,14,15,17,18,19,20,21,22,23,24]. Despite the abundance of research, most of the studies on the design and optimization of window openings for better ventilation and thermal comfort have been implemented for residential buildings, and minimal research has focused on industrial windows.
Although windows are efficient and useful for natural ventilation, they are also prone to rainwater penetration during wind-driven rain. Wind-driven rain has oblique paths because of the horizontal velocity component of the wind [25] and is a serious moisture source that has a great effect on the performance of the building [26] because it creates problems such as mold growth, wood decay, corrosion, paint peeling, and moisture penetration [27]. The passage of rain into a building depends on the driving rain loads. These loads are driven by topological and building geometrical factors, in addition to the wind velocity, rainfall intensity and raindrop size distribution [28]. An investigation into the performance of residential windows subjected to wind-driven rain was performed by Lopez et al., who provided a technique to evaluate the water tightness of windows [29]. However, studies on windows are generally limited to residential buildings or public housing with a focus on ventilation characteristics. Additionally, studies on rainwater penetration during wind-driven rain are confined to rain seepage and runoff through walls, facades, and wall-window interfaces on residential buildings [29,30,31,32,33,34,35,36]. Kim et al. [6] performed an experimental study on the rain penetration through industrial gravity ventilators that were used for natural ventilation and revealed that different factors affect the amount of rain penetration into the building; however, a lack of research on rainwater penetration through window openings remains. Various industries that use natural ventilation generally have their windows open continuously, and the entrance of moisture into the room must be avoided because moisture may also have a significant effect on the quality of the product and the interior components of the building. Therefore, industries that utilize natural ventilation must consider both aspects (i.e., building ventilation and moisture avoidance) when installing windows. Therefore, parallel studies on the ventilation and rainwater penetration must be conducted for the different types of windows used in industrial buildings.
The purpose of this study is to develop a design for windows to achieve the optimum combination of lower rain penetration and higher ventilation for better IAQ and thermal comfort. To achieve this objective, the following must be executed: (1) select the window type to secure efficient ventilation; (2) understand different paths and trajectories through which raindrops entered through the selected window; and (3) add design supplements that could be used to intercept and prevent the raindrops from following those paths while maintaining the ventilation efficiency. Both numerical and experimental methods are applied to select window configurations. In the preliminary study of selecting the proper type of window, CFD is exploited to assess the ventilation efficiency inside a designed full-scale industrial model, and an experimental study is conducted on a reduced-scale model for the validation. For the addition of supplements, a small portion of the building with the actual size of window is created to obtain more accurate results in the experimental examination of rain penetration and ventilation. Reduced-scale testing requires fulfilling similarity criteria with a full-scale building, which could be problematic, particularly for the measurement of rain penetration [37]. The application of CFD in wind-driven rain is limited because of reasonable inconsistencies that are noted between simulated and experimental results and might be due to the varying role of the turbulent dispersion of raindrops, which depends on the geometry and position of building [26,37]. Therefore, in this phase, a numerical method is exercised only to study the ventilation and not to consider rain penetration. The combination of design factors that produces the best possible decrement in rainwater penetration without compromising the required ventilation capacity is selected as the optimum window design.

2. Experimental Section

2.1. Preliminary Study: Window Type Selection

The objective of the preliminary study is to detect the change in ventilation that is induced by the use of different window types using experimental and numerical methods. This comparison provides sufficient information on ventilation efficiency to select a type of window in advance of a comprehensive study. For this purpose, 90° open, 45° open and louver windows (the three basic types extensively used in industries) are initially investigated. Theoretically, the airflow through a window opening is given by
Q = Av
where A is the minimum cross-sectional area of the flow through the opening (m2) and v is the airflow velocity through the area (m/s). Greater opening sizes supply higher air flows when the velocity is constant [14]. Therefore, the 90° opening should have the largest cross sectional area and should correspond to the best ventilation capacity among these window types. Experimental and numerical studies are conducted on these three types of windows to assert this concept. The significance of these changes on the superiority of ventilation is the key to judging whether further studies on rain penetration should be conducted. The schematic diagram of the basic windows used for the preliminary study is shown in Figure 1. The sizes of the windows considered are regularly found in industries. Each blade of the louver type is 0.1 m in length and spaced at 0.1 m from each other, and the length of each windowpane for both 90° and 45° type windows is 0.8 m. In addition to these selected sizes of windows, an extensive experiment is performed on the ventilation and rain penetration through variations of the size, angle, and modification of the selected window (by use of supplements, as described in the comprehensive study—Section 3.2.1).
Figure 1. Basic windows used in the preliminary study.
Sustainability 07 10499 g001

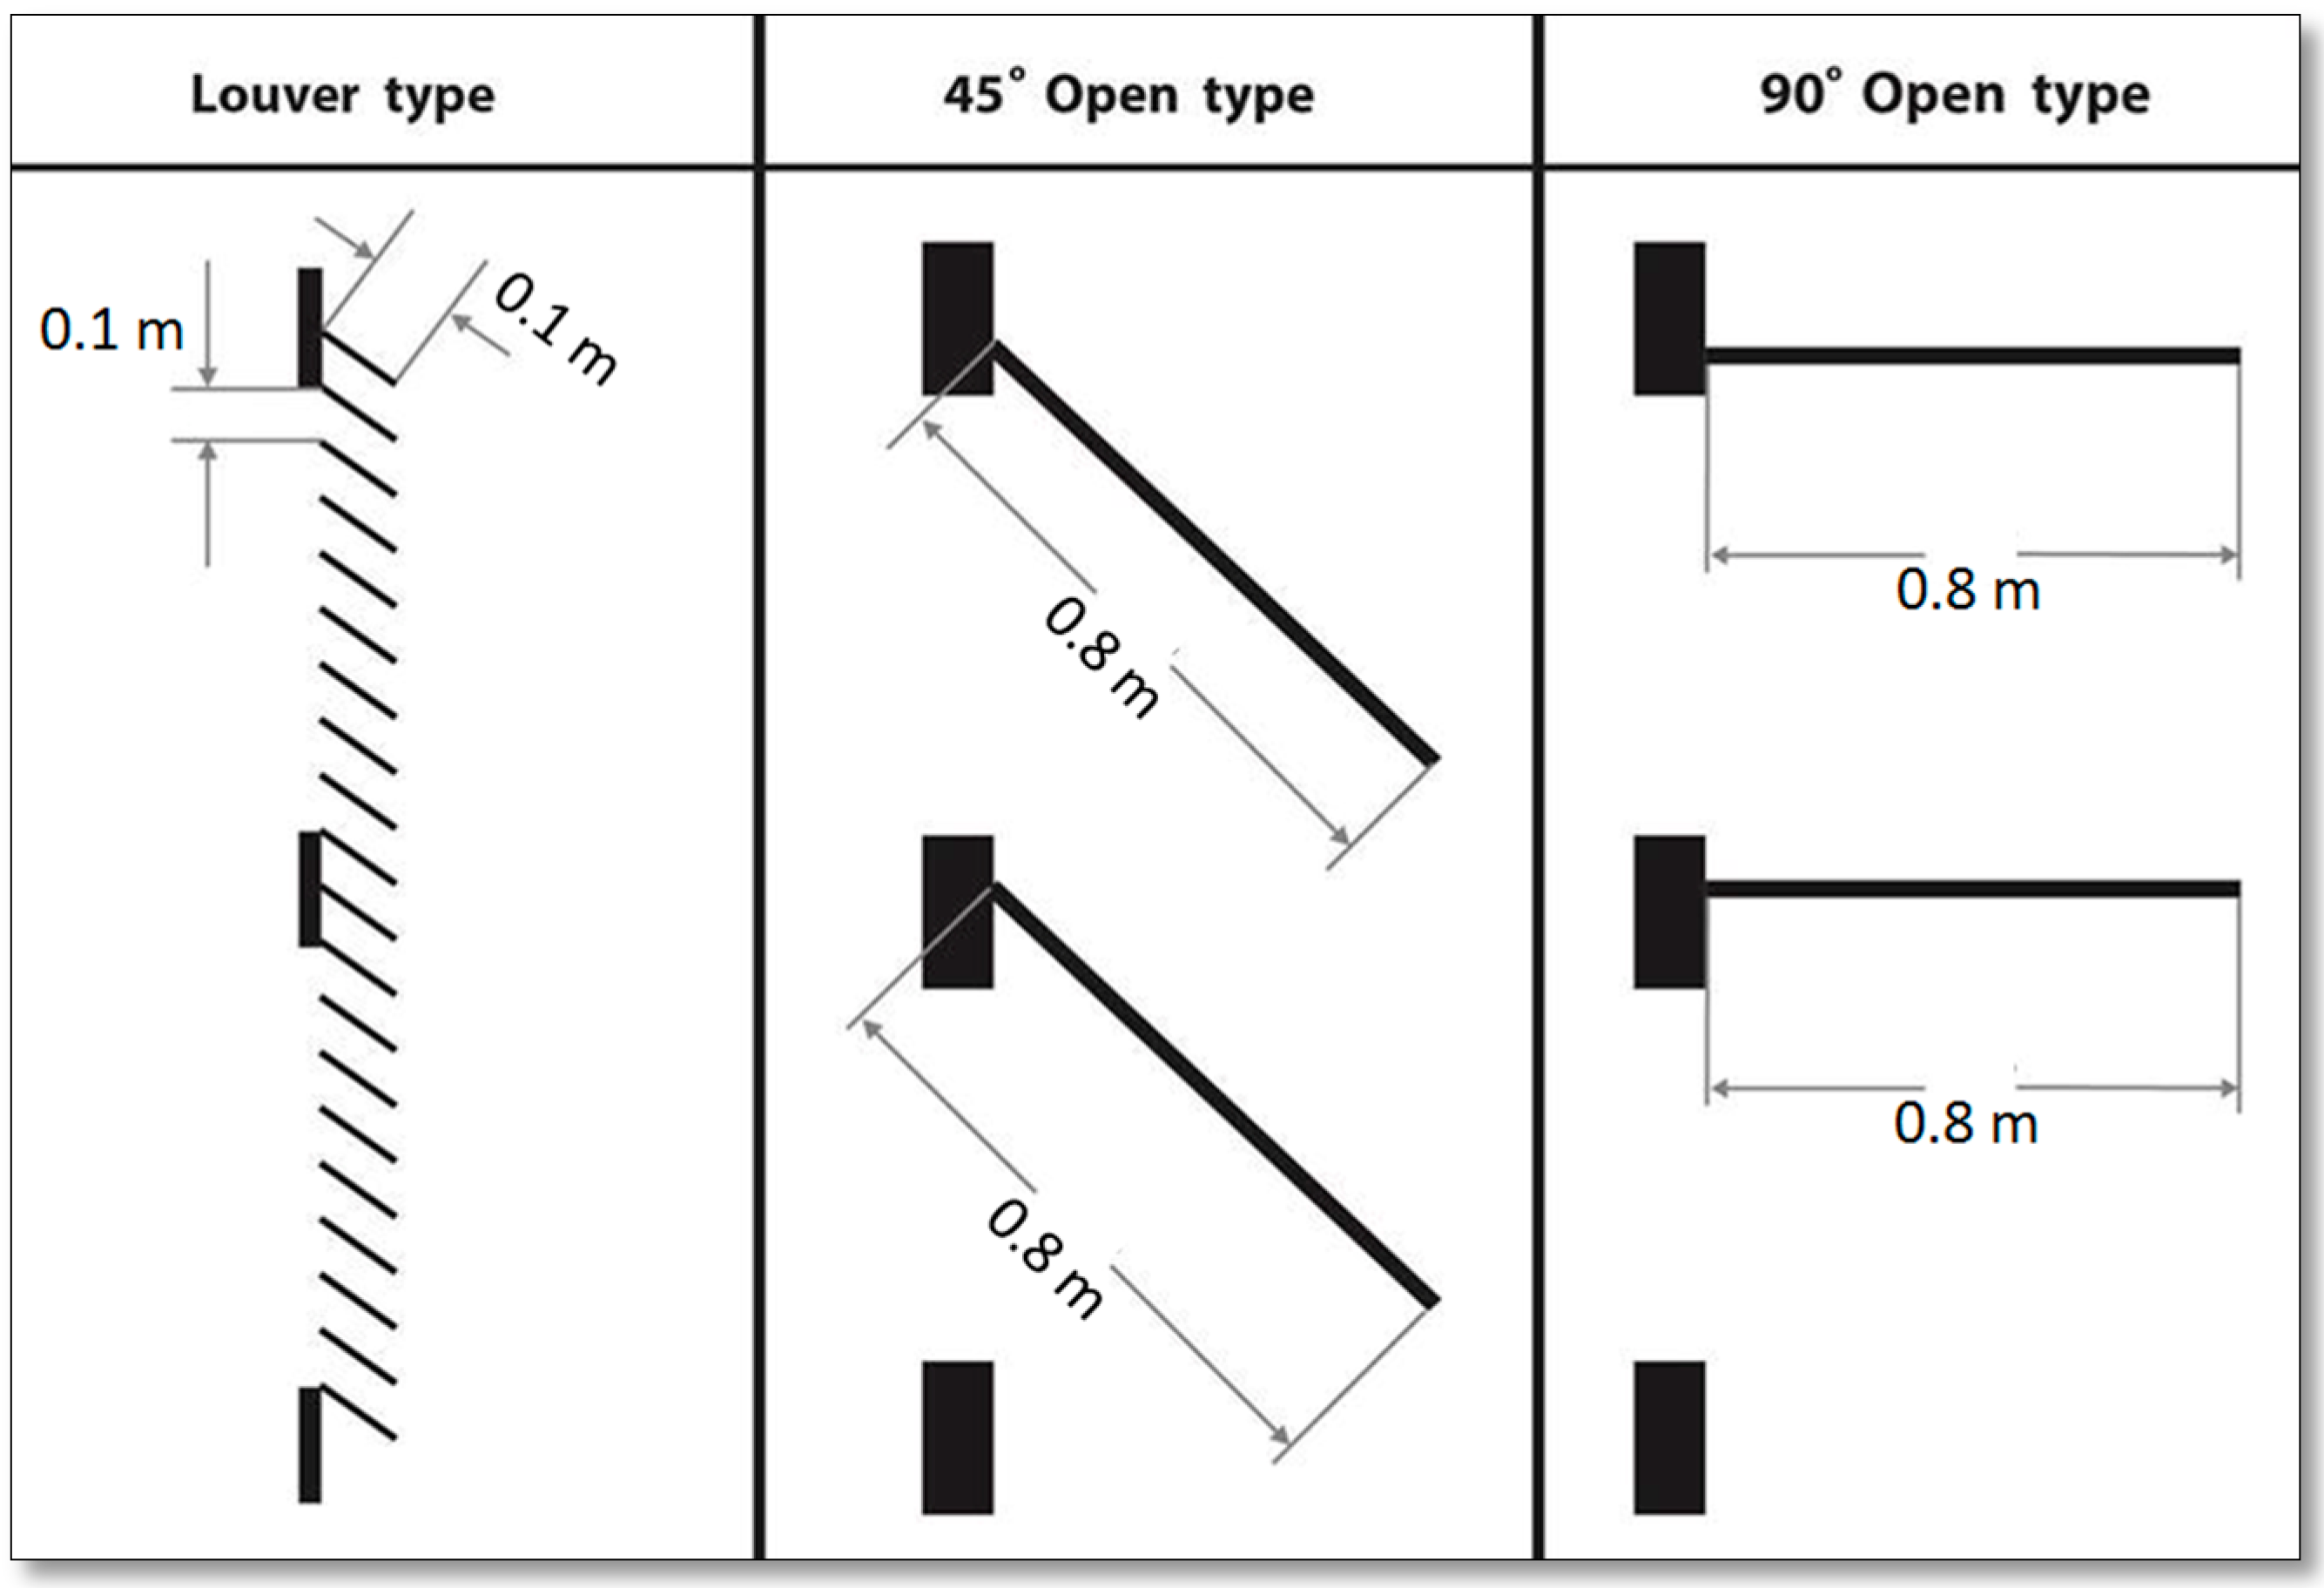
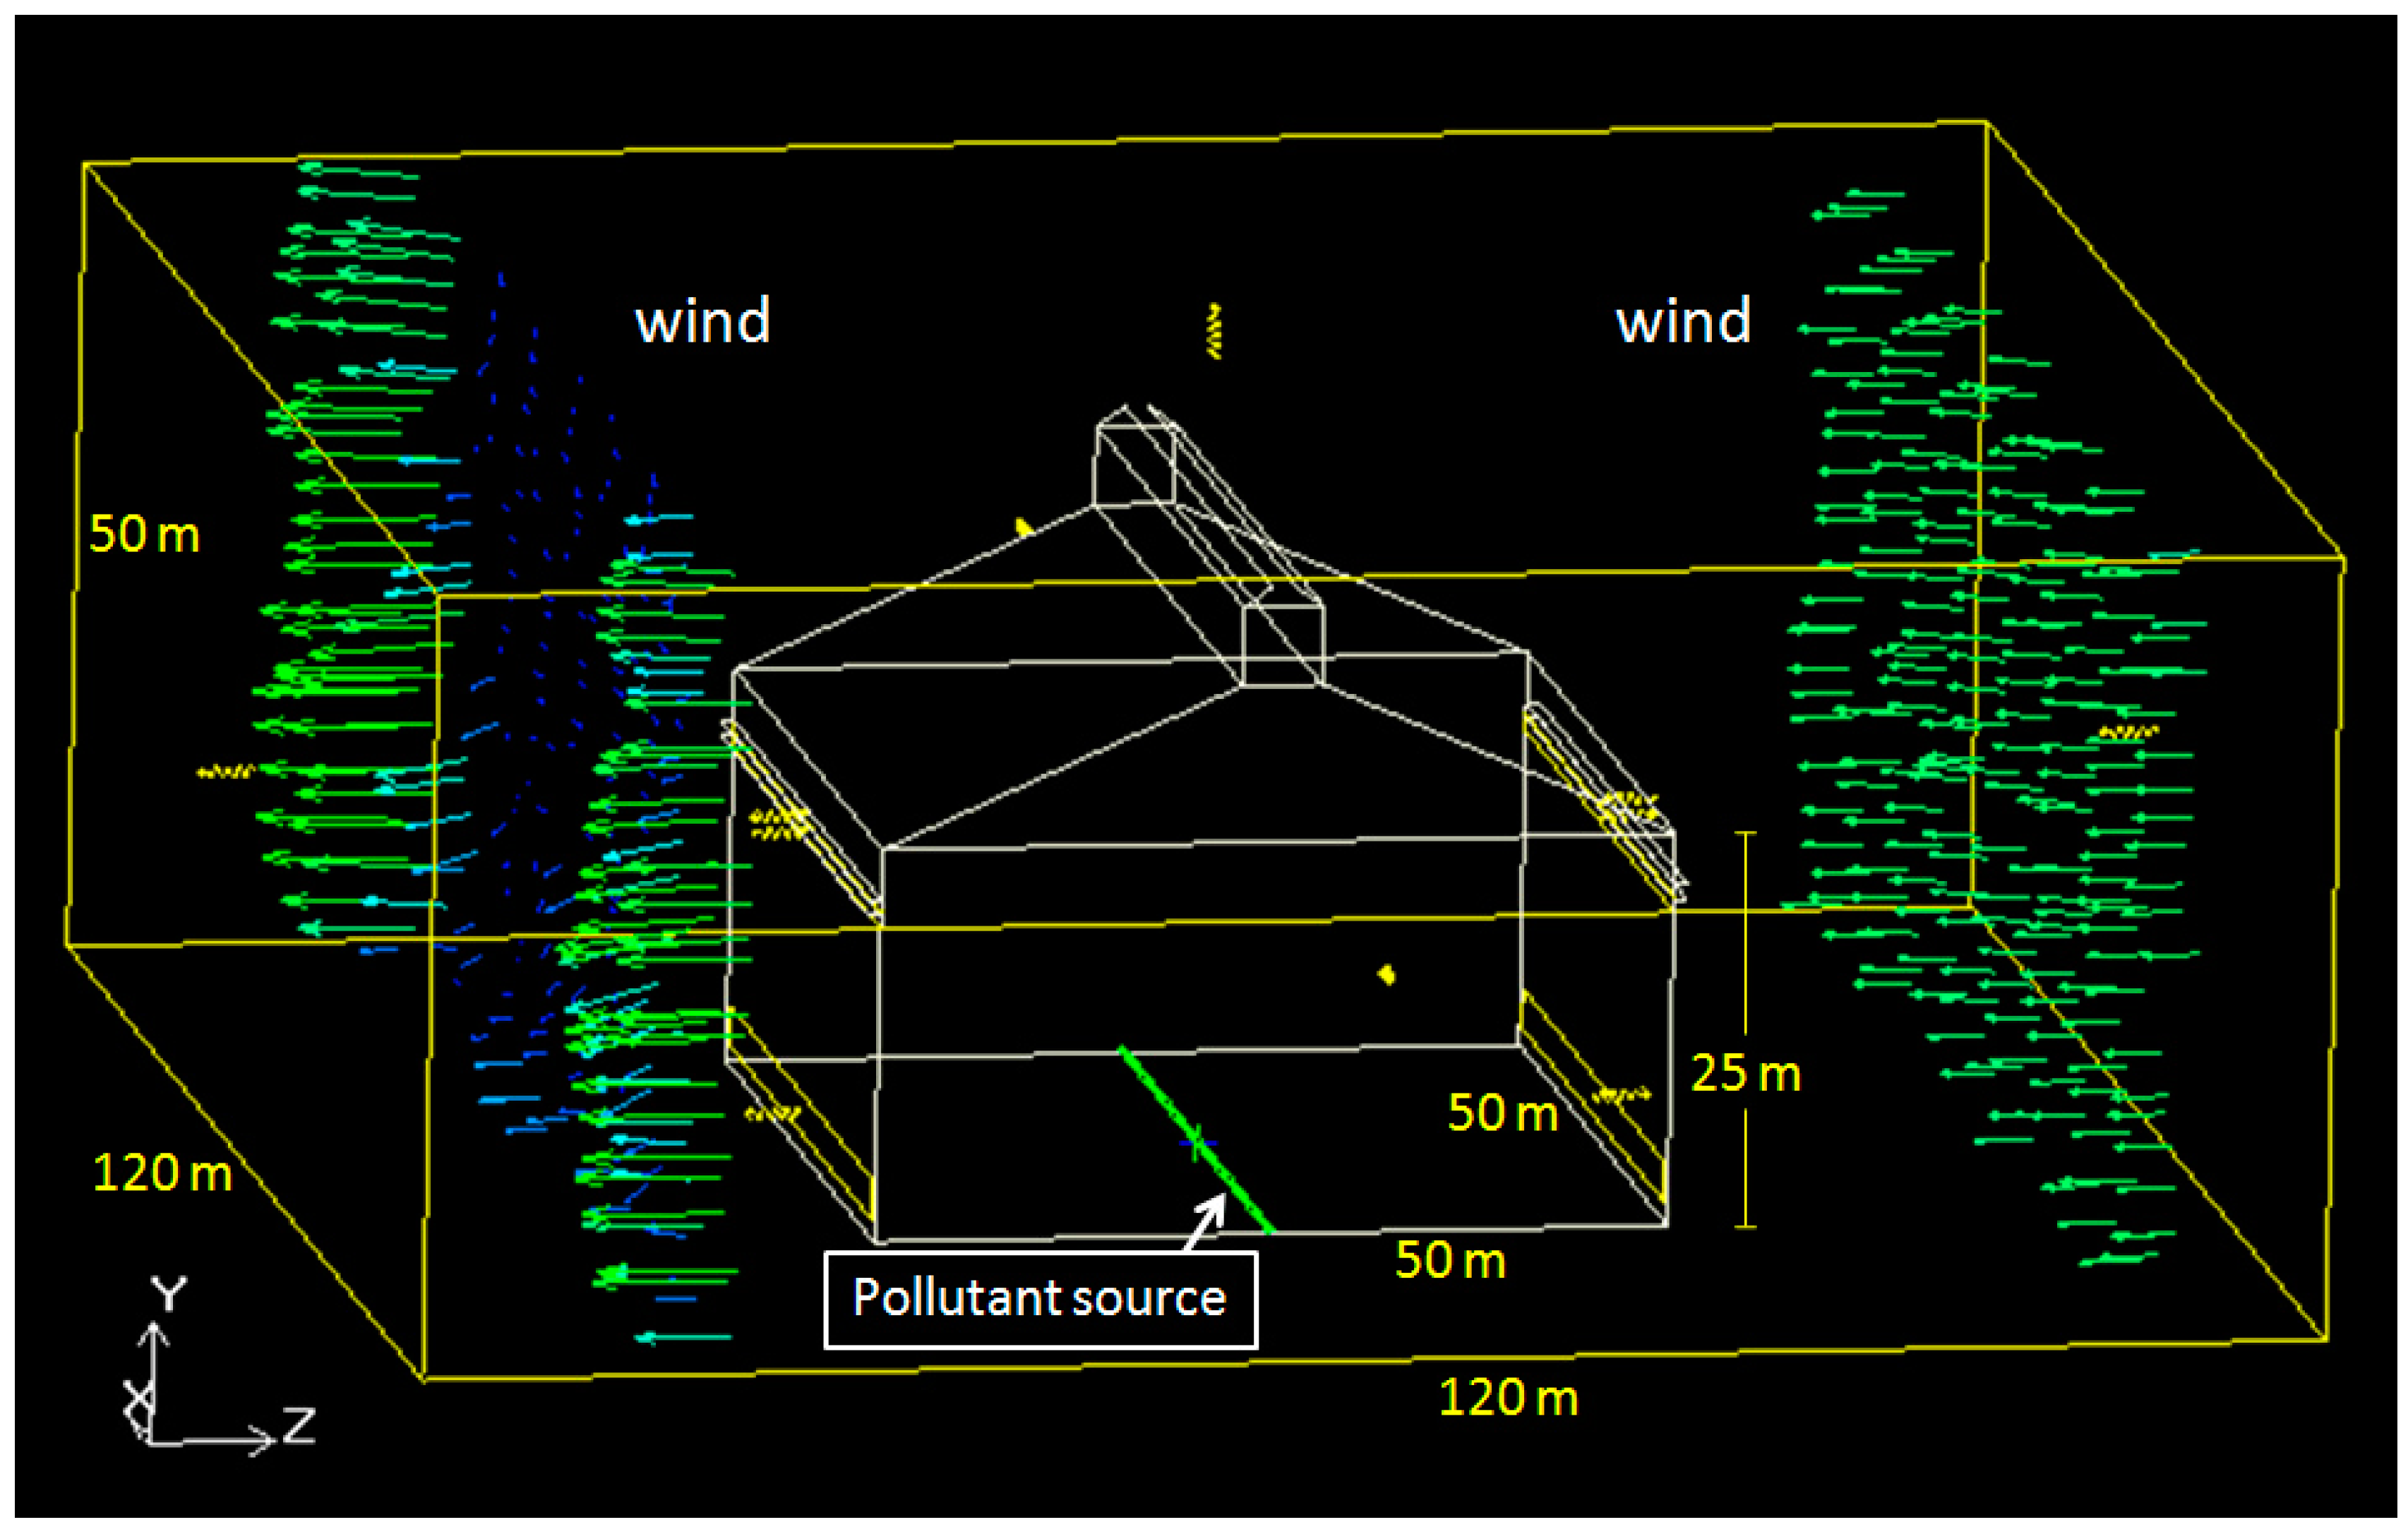
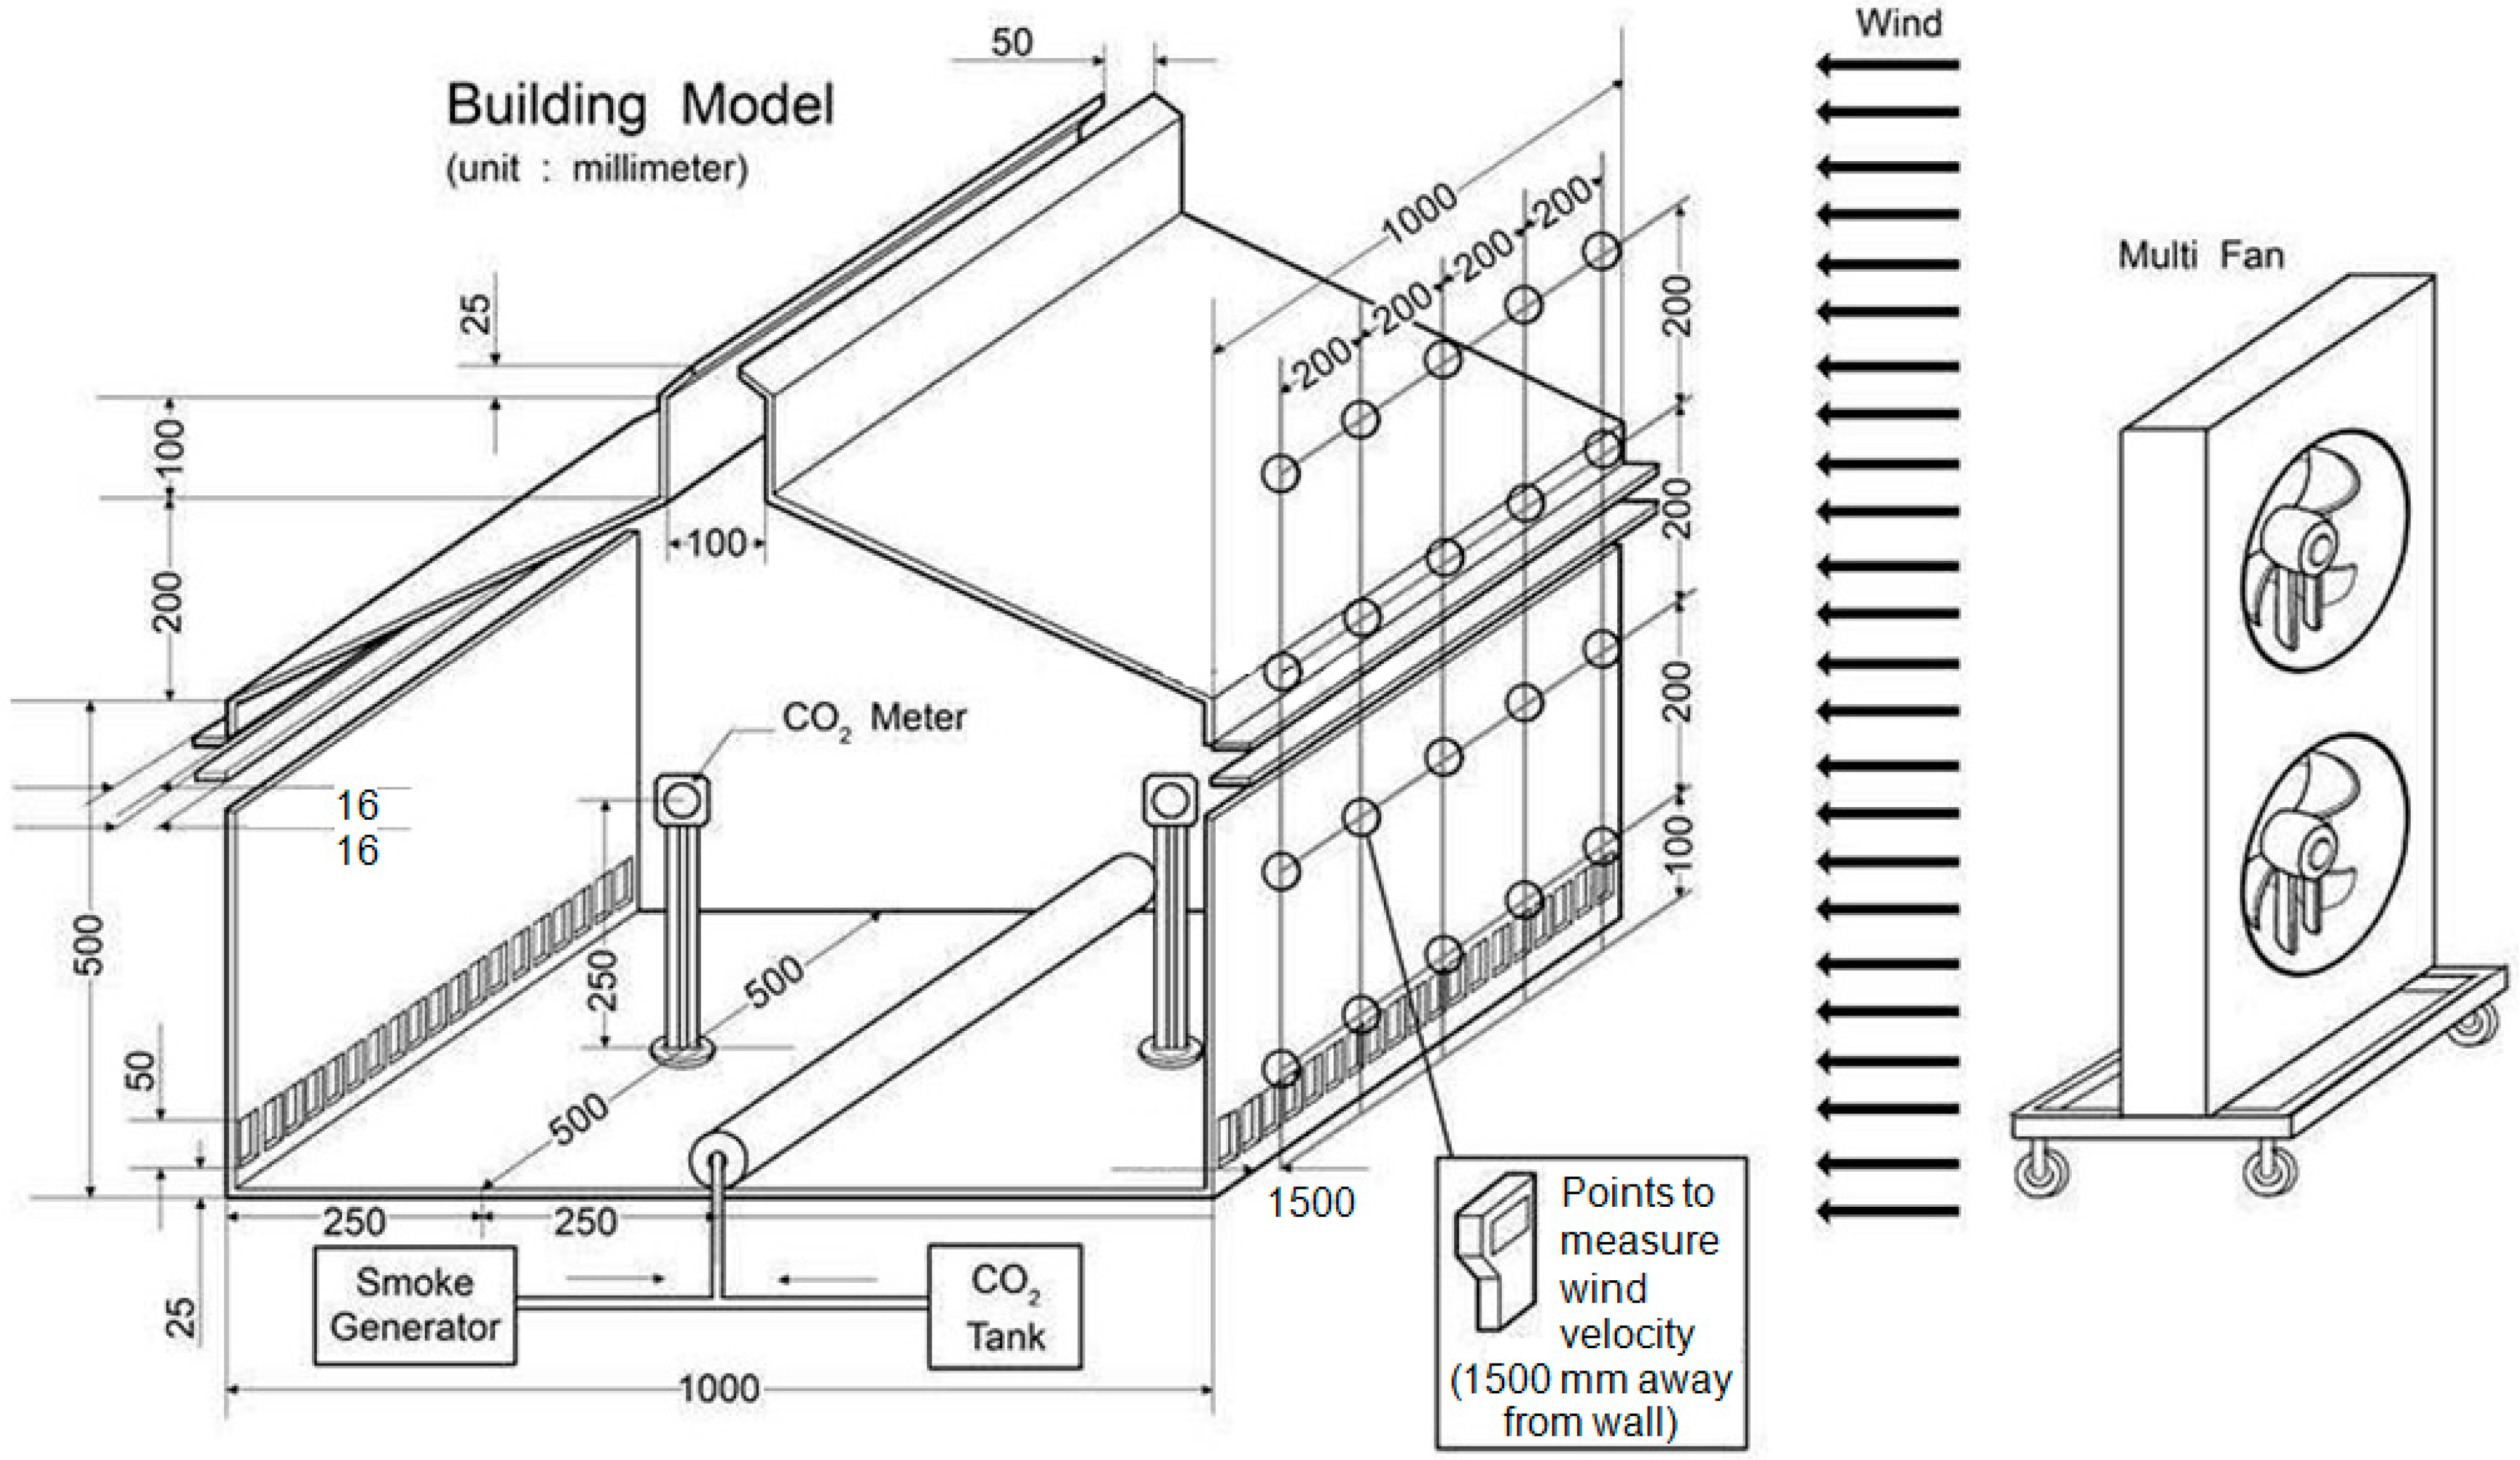
2.1.1. Numerical Study

Figure 2 shows the 3D model of the simulation of a full-scale industrial building of dimensions L ×W × H = 50 × 50 × 25 m3 (with a roof height of approximately 16.3 m) and a control volume of L × W × H = 120 × 120 × 50 m3. CO2 (with a concentration of 5000 ppm) is selected as the tracer gas and is continuously released at a velocity of 5 m/s through a 5-cm-wide rectangular slot at the center of the building along the longitudinal direction. The monthly average of the maximum wind speed in 2014 for the Seoul area ranges from 5.3–9.7 m/s, and the average annual value is approximately 7 m/s. In the annual data, the highest average wind speed (33.9 m/s in May) is not included [38]. This average annual value (7 m/s) acts perpendicular in the near distance to the building in all of the experiments. However, the study also determines the effects of varying the wind speed with different designs of windows to confirm the robustness of the results. All three basic windows in Figure 1 (with the identical opening size (total height = 1.6 m) at 3.2 m from top) and a single opening (with a width of = 2.5 m, at 1.25 m from the bottom of the wall) on both the windward and leeward sides of the building, along with a gravity ventilator (opening width = 5 m) at the top of the building, are present throughout the building length. These three different types of openings are used to mimic the actual conditions in the factory, in which each of these inlet and outlet openings is present. The inlet through the control volume is the velocity inlet, and the outlet of the control volume and all openings present in the building are the pressure outlets. The wall and air temperature is considered to be ambient (20 °C) and is assumed to be constant. The commercially available CFD software ANSYS Airpak 3.0.16 (Fluent Inc., Lebanon, NH, USA) is selected for designing the model and predicting the ventilation capacity of the windows. Airpak uses Fluent to solve turbulent flow equations based on the finite volume method. Equations for the conservation of energy, mass and momentum of incompressible air are solved by Fluent to determine a solution for the model. The two-equation K-ε turbulence model is used to solve the turbulent flow conditions, in which k is the turbulent kinetic energy and ε is the rate of dissipation of the turbulent kinetic energy. A fine mesh of hexa-unstructured geometry is used to discretize the domain with cell numbers approximately equal to 1.4 million. All the cases are iterated up to the convergence level of 10−3, at least, and the solutions are stable with increasing number of iterations. At this stage, the scaled residuals are about 2.7 × 10⁻⁴ for continuity, 1.0 × 10⁻³ for k and 1.0 × 10⁻³ for ε. The performance of each window type is evaluated through the flow of air, mean age of air, and concentration of CO2 present inside the model room by applying the post production tools in Airpak.
Figure 2. Model of the full-scale building in Airpak.
Sustainability 07 10499 g002

2.1.2. Experimental Study

As shown in Figure 3, a reduced-scale model (scale = 1:50) representing the industrial building is built to perform the wind tunnel experiment and validate the CFD model for all three window types. The walls and windows of the model are built using transparent Plexiglas acrylic sheets. The model is designed to be adjustable to enable the use of 45° open, 90° open and louver type windows, as shown in the supplementary file (Figure S1). A multi-fan (DWV-20, 250 m3/min, 750 W, MJ AIRTECH) is placed 3 m from the right wall of the building to generate the air speed. The desired air speed of 7 m/s is achieved by taking the average of the speed measured using a hot wire anemometer (AVM430A) at 20 different points across the face with a distance of 1.5 m from the wall. The measurement plane is divided into four rows that are spaced at a distance of 0.2 m. Each row consists of five measurement points separated by 0.2 m. Smoke and CO2 are released from a generator located at the center of the building, identical to the location of the pollutant source in the numerical study of the full-scale industrial building. The diffusion of smoke is monitored to visualize the airflow inside the model. Two sets of CO2 meters (GrayWolf Sensing Solutions) are placed in the middle of half of the room between the wall and pollutant source and at the height of 0.25 m from the floor. The concentration at both CO2 meters is measured 10 min after 5000 ppm of CO2 is continuously released at a velocity of 0.1 m/s. The experiment on each window is repeated three times, and the average of both meters is considered to be representative of the CO2 concentration in the room. The window type with the lowest average CO2 concentration is considered to be the best option for ventilation.
Figure 3. Experimental setup for assessing the ventilation of smoke and CO2 through different types of windows, i.e., 90°, 45° and louver types (the 90° open type is presented in this figure).
Sustainability 07 10499 g003

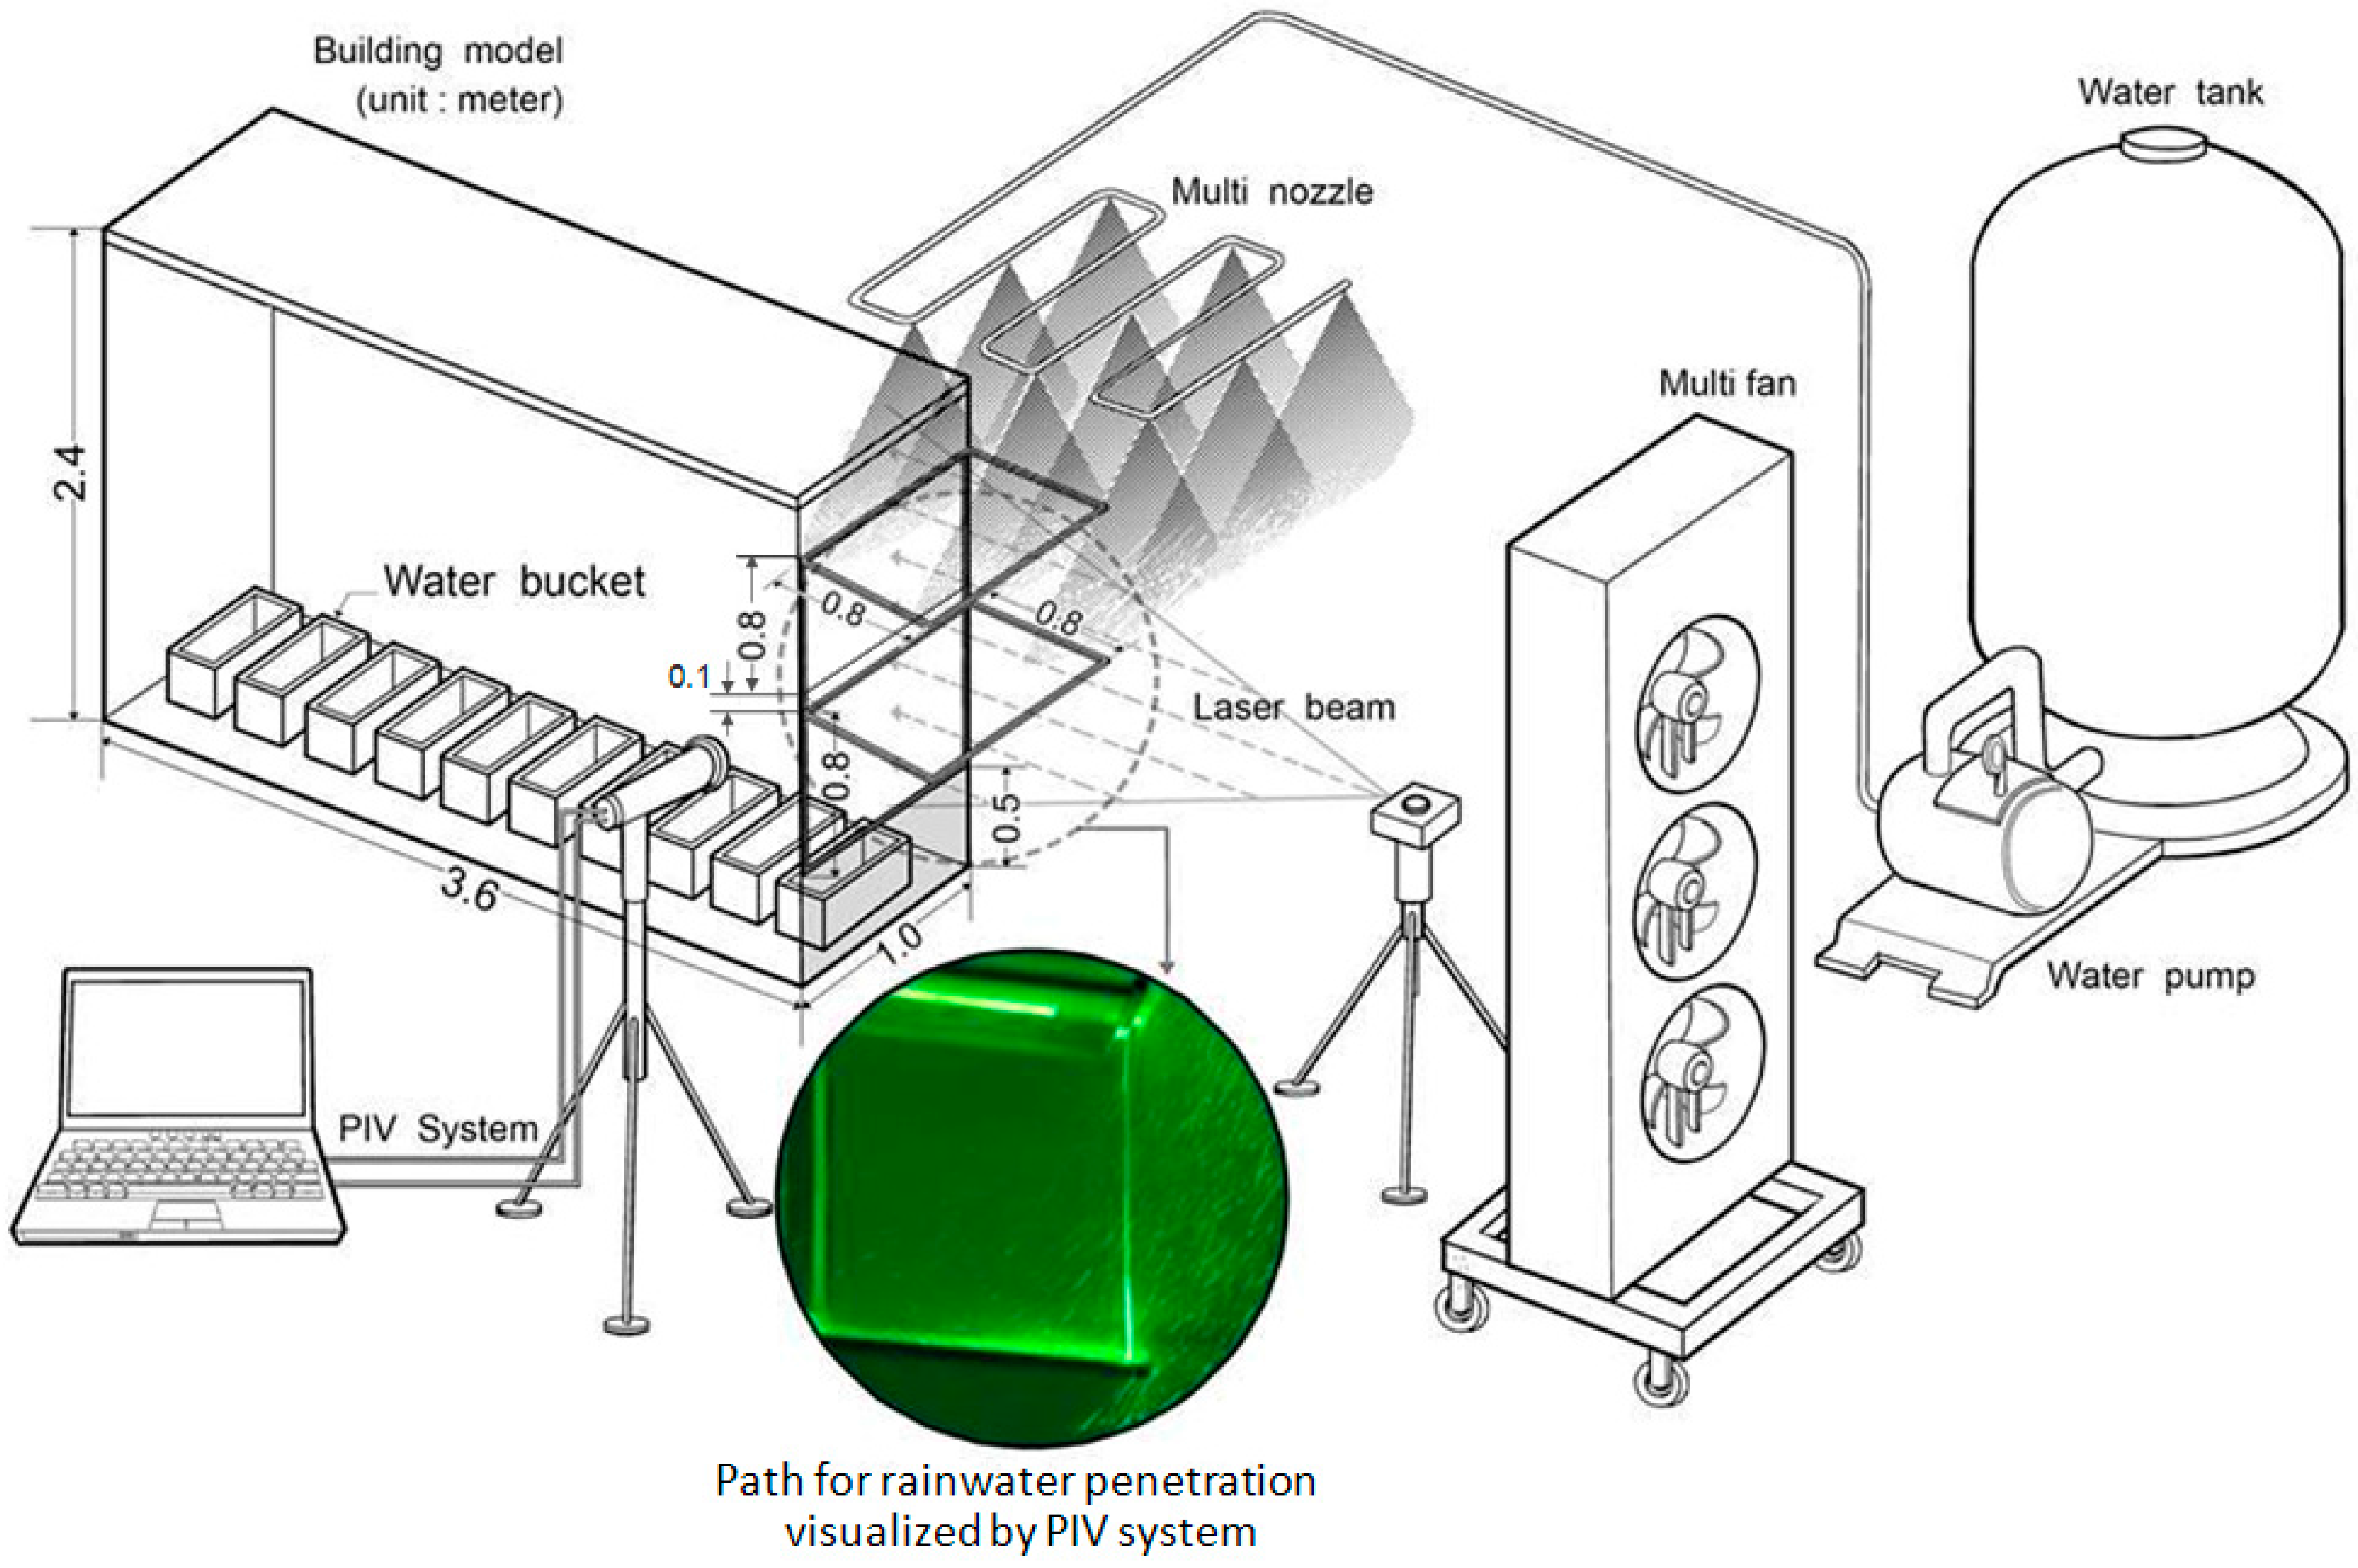
2.2. Optimization Study: Addition of Supplements for a Selected Window

The investigation of the addition of supplements is performed in an experimental model room with a size of L × W × H = 3.6 × 1.0 × 2.4 m3 (Figure 4) and a control volume for CFD simulation is L × W × H = 10 × 6 × 4 m3. The distances between the model room and faces of the domain are 4.2 m, 2.5 m, 1.6 m and 2.2 m, in the upstream, sideward, upward and downstream directions, respectively. The walls and windows of the model are Plexiglas acrylic sheets that are attached to an aluminum frame. A two-stepped adjustable window with each step of dimensions L × W = 1.0 × 0.8 m2 is presented as the base case scenario (case study 1) for comparison. The length and height of the model are taken as 3.6 m and 2.4 m, respectively, to prevent unstable movements of the air inside the room, which can cause possible errors in the measurements of the airflow and rain penetration. A rainfall intensity of 120 mm/h is selected because this value was observed as a maximum value in Korea [39]. Artificial wind is generated by blowers that contain multiple fans (DWV-20, 250 m3/min, 750 W, MJ AIRTECH). The wind velocity is measured at 10 locations, i.e., the 4 corners (each at a distance of 0.2 m from the adjacent walls) and the center of each opening, and the average of the values is calculated. These measurements are performed at a distance of 1.5 m from the model room using a hot wire anemometer (AVM430A), and the required average velocity of 7 m/s is generated by setting the number of revolutions in the blower. Therefore, for all simulations in this study, we control the value of average velocity to be as close as possible to 7 m/s at the same area and same distance with the desired measurement. The artificial rainfall device consists of 5 pipes with an inner diameter of 0.025 m and a length of 1 m that are placed at an interval of 0.4 m. Three nozzles with a 2 mm diameter are installed at the lower part of each pipe at an interval of 0.3 m. The pipes are placed 1 m above the experimental room, and the rain is sprayed towards the top of the window openings.
Figure 4. Experimental model and PIV system setup for studying the ventilation and the paths and intensity of rainwater penetration through the windows (a 90° open type window with a length = 0.8 m (the base case (case study 1)) is presented in this figure).
Sustainability 07 10499 g004
Because the windows and walls are composed of transparent sheets, the raindrop paths can be viewed through the windows. Particle image velocimetry (PIV) is used to measure the raindrop size and their trajectory. PIV can identify the size, movement path and speed of particles through a high-speed focusing method. The PIV system consists of the following: (1) a laser light source to generate the light sheet across the vertical plane of the rainfall through the windows; (2) a high-speed camera for recording and (3) a computer for visualizing and interpreting the results. First, the raindrop size is measured to adjust and maintain the water injection pressure in the nozzle to produce artificial raindrop sizes identical to the size of a natural raindrop (0.5–5 mm) [40]. Second, the PIV system is applied to visualize the movement path of the raindrops through the windows. After the major paths of rainwater are identified, various designs for the window are invented to reduce the amount of rainwater penetrating into the building. To investigate the ventilation efficiency of the newly designed windows, the wind velocity is measured at 10 places across the outlet face (size = 1.0 × 2.4 m2), which are divided into two rows spaced at a distance of 0.25 m from the rim of the outlet. Each row consists of five measurement points, which are equally separated at a distance of 0.48 m (the gap between the highest and lowest rows with the rim of the wall is 0.24 m). The application of the CFD simulation, as verified in the previous step, is adopted to cross-examine the average wind speed at the outlet of the model room.
To investigate the protection efficiency from rain penetration for each designed window, the rainwater inflow into the model is measured using 10 water buckets (L × W × H = 0.2 × 0.1 × 0.04 m3; weight of vessel = 152 g) that are made of plastic material and are placed inside the room, each at a distance of 0.35 m (center-to-center distance) in the longitudinal direction of the model. All experiments are performed for 3 min, and the weight of rainwater collected in the buckets after each experiment is measured using an electronic scale (MW-200, Maximum capacity: 200 g; least count: 0.01 g). The difference between the initial and final weight of the bucket donates the weight of the rainwater collected. The weight of the rainwater collected in an individual bucket is converted into an intensity (R: mm/h) using Equation (2), and each bucket is examined to obtain the average intensity value. This experiment is repeated three times for each window type, and the resulting intensity values are averaged to obtain the final value of rainfall intensity into the building.
R = M W × S × H
where
  • R = Flow rate (intensity) of rainwater into each bucket (mm/h),
  • M = Total weight of inflow rainwater collected in the buckets (g),
  • W = Density of rainwater (g/mm3),
  • S = Cross sectional area of each bucket (mm2), and
  • H = Measurement time (h).

2.3. Sensitivity Analysis

The outcome of the situation may change when a parameter value is different, notably when the wind speed fluctuates naturally. According to the referred maximum wind speeds in 2014, the monthly average value has a range from 5.3 to 9.7 m/s [38]. Therefore, apart from the fixed speed value (7 m/s), wind speeds of 3, 5, and 9 m/s are tested to evaluate the confidence in the results.
Besides, the actual natural airflow that should be applied in this situation is atmospheric boundary layer (ABL) wind flow, occurring due to the local terrain applying a shear effect to the wind. As a result, the velocity of the flow in part that is tangent to the surface falls close to zero [15,20,22]. However, due to difficulty in creating ABL flow for the experiment, a simulation with a uniform velocity profile is performed so as to compare consistently with measurement results by varying the wind speed. To investigate how this simplification of the wind flow conditions can lead to deviations from reality and its influence on the results and the conclusion of research, the CFD simulation of the flow through the windows with an ABL wind profile is carried out. ABL wind profiles, generated from 2 terrain types: (1) urban, suburban, wooded areas; and (2) scattered obstacles on open terrain, can be produced, using optional function available in Airpak program.
Grid-sensitivity analysis is also performed to determine the dependence of the flow field on the change of the cell. To conduct grid independence test for both preliminary and optimization studies, four different mesh systems (coarser, course, medium, and fine) are created and compared. The results of these sensitivity analyses are presented in Section 3.2.3.

3. Results and Discussion

3.1. Preliminary Study: Comparison of Numerical and Experimental Methods for Window Type Selection

Comparison between the simulated and experimental results is performed to validate the numerical model and the measurement method. The comparison is based on the CO2 concentration measured at two center points on either side of the source in the reduced scale and predicted through the CFD model. The initial concentration of CO2 inside the model and the concentration of CO2 in the supplied air are assumed to be 400 ppm (the general concentration of CO2 in the atmosphere) [41]. The resulting measured and predicted CO2 concentrations for the three basic window types are shown in Table 1. The results are analogous to each other, with a maximum error of 8.3% for the 45° open type window at the center of the leeward side (Point 2).
Table 1. Predicted and experimentally measured CO2 concentrations and the mean age of air.
Window TypeCFD Predicted ValuesMeasured Values
Mean age of air (s)CO2 Concentration (ppm)CO2 Concentration (ppm)
Point 1 (windward side)Point 2 (leeward side)AveragePoint 1 (windward side)Point 2 (leeward side)Average
90° open type58.0608.8609.0608.9568580574
45° open type62.7622.7644.5633.6583591587
Louver type63.1627.0643.1635.1585599592
The selection of the basic window is based on the predicted and measured results for the CO2 concentration, the diffusion of smoke (compared with the predicted velocity vectors), and the predicted results of the mean age of air. The mean age of air is the average time of air movement through the room that provides the magnitude of the freshness of air and helps determine the ventilation efficiency of the building [42,43,44]. From Table 1, the 90° open type window has the best ventilation capacity, as supported by the least average indoor CO2 concentration, followed by the 45° type and the louver type windows. A comparison of the mean age of air also shows results with the identical tendency and with a value of 58 s for the 90° window and indisputably higher values for the other two types. The paths followed by the generated smoke are visualized (Figure S2) using each window type, and the time required for the clearance of smoke from the room is noted: 27, 35 and 42 s for the 90° open type, 45° open type and louver type, respectively. The cause of these differences is demonstrated by the velocity vectors and drawings of the smoke paths (Figure S3). An important note from this demonstration is that the ventilation flow rate can be significantly increased/decreased by a single modification and that the internal airflow pattern can change to adversely affect the discharge of pollutants. From the support of experimental and numerical results in this section, the 90° open type is shown to be the best window among the three types.

3.2. Optimization Study: Addition of Supplements for 90° Open Windows

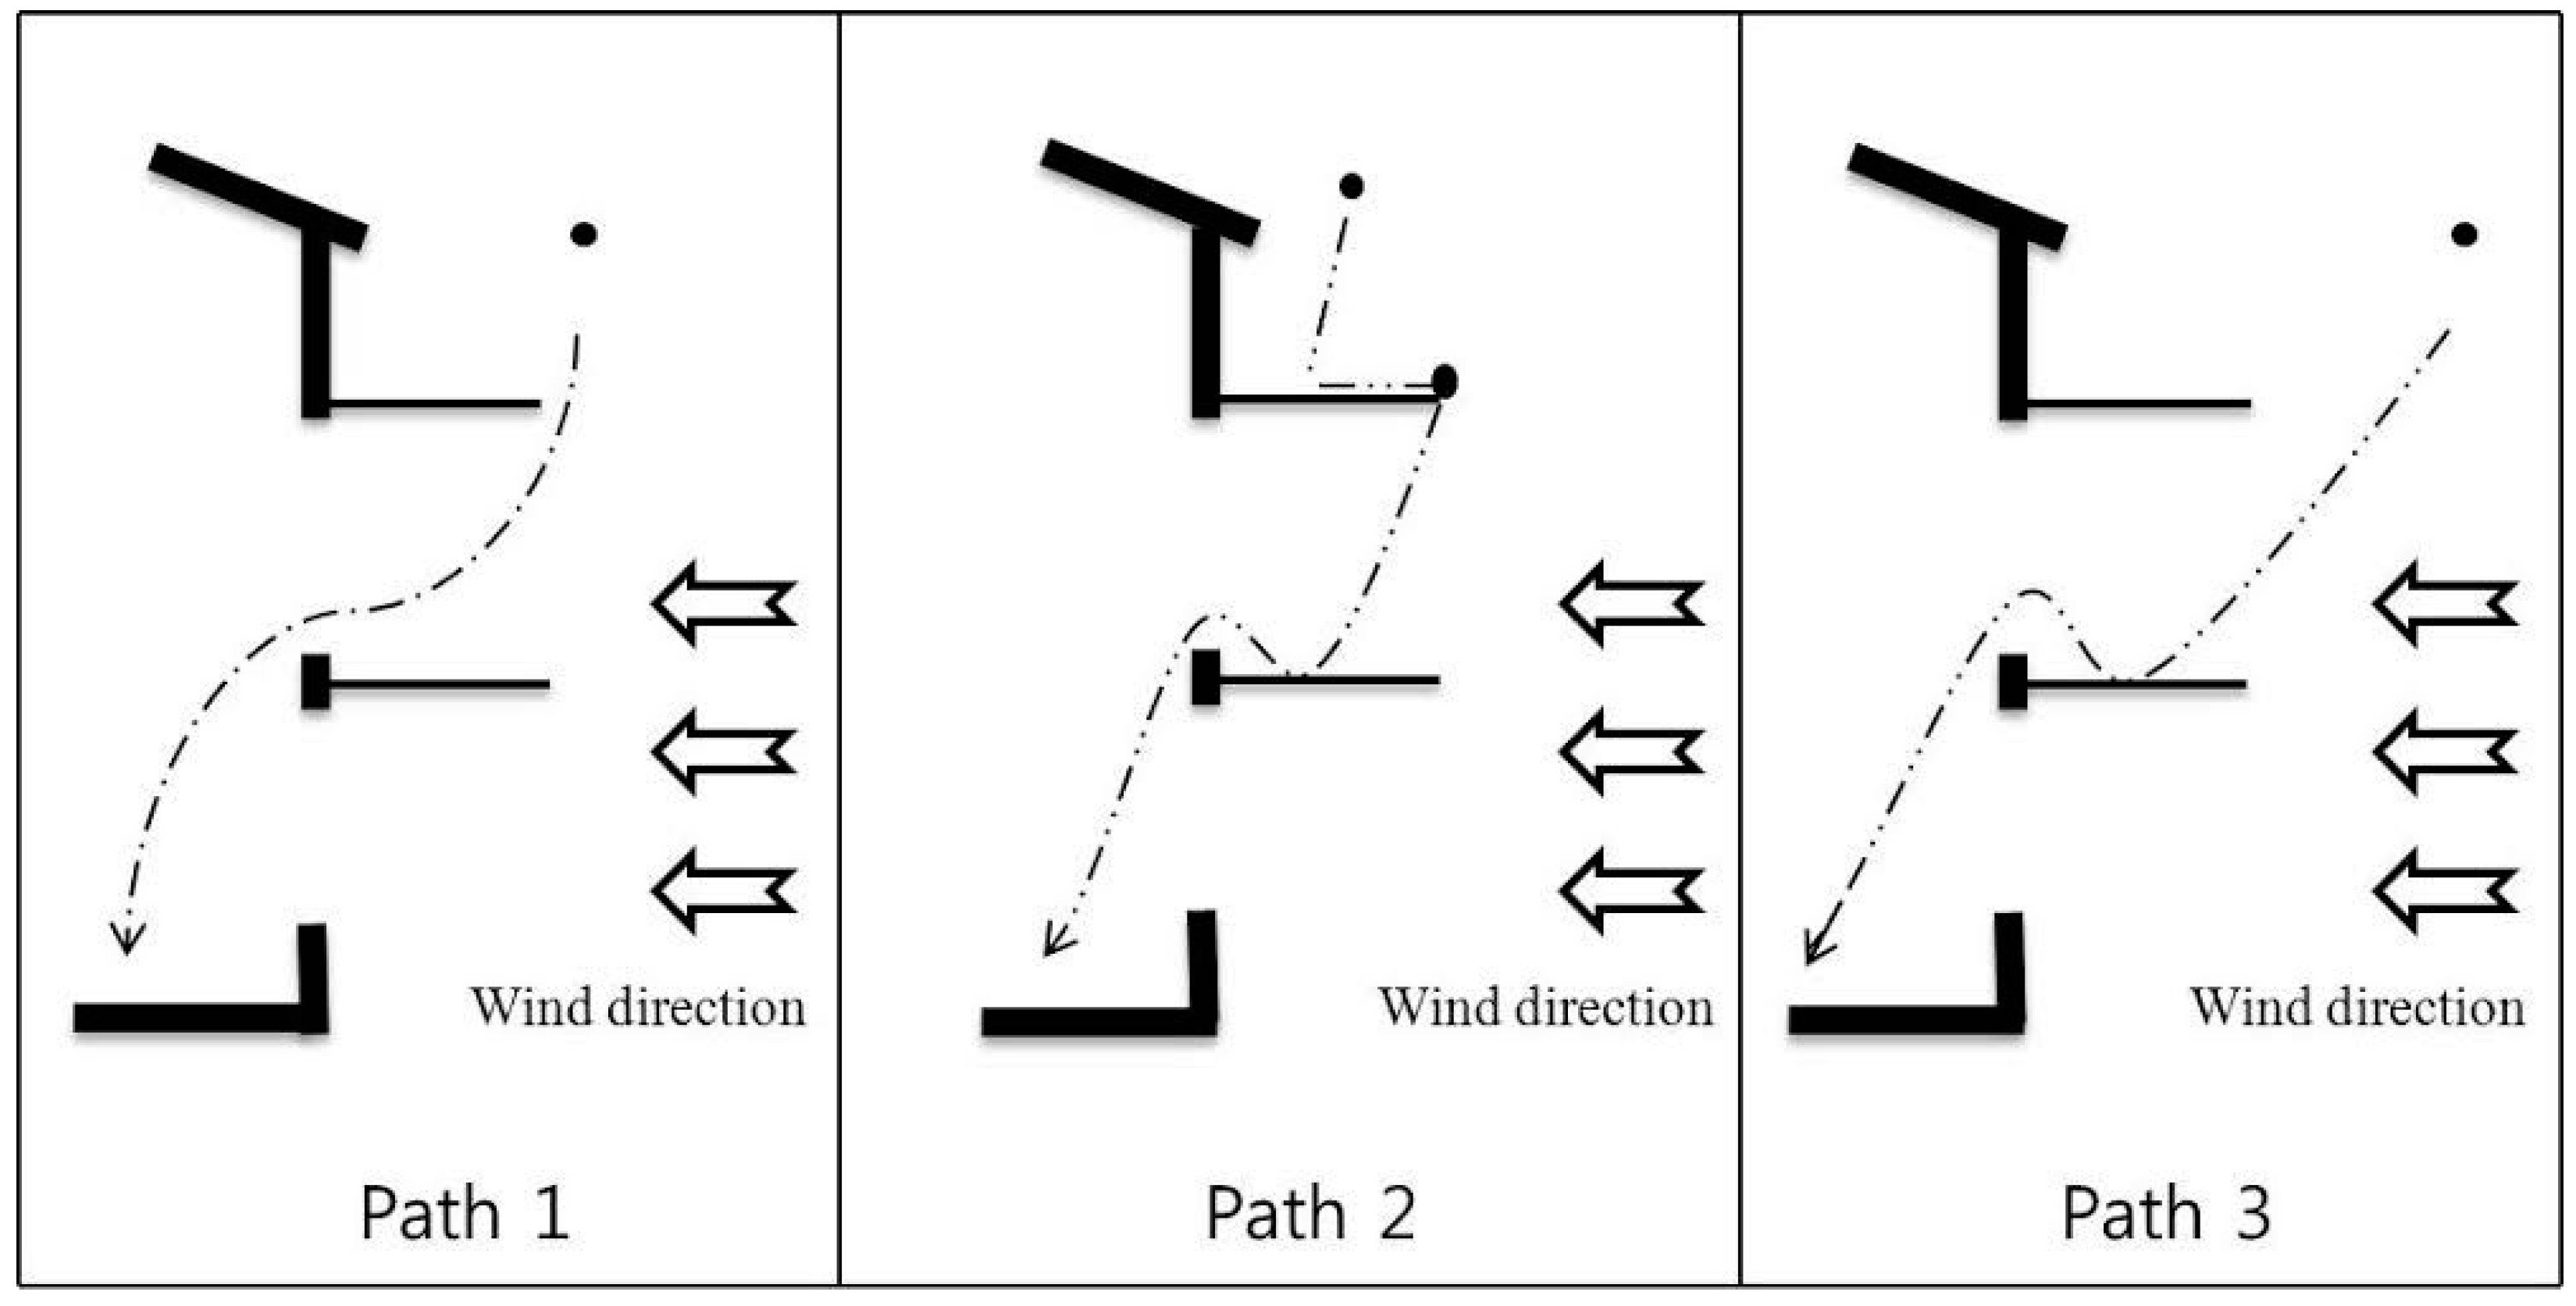
3.2.1. Identification of the Rainwater Inflow Path

A PIV system is used to determine the trajectories of the rainwater inflow paths through the windows during wind-driven rain conditions. This determination is performed to assist in the selection of control measures that intercept each path and prevent rainwater from entering the windows. The results of the PIV experiment shown in Figure 5 demonstrate three different inflow paths depending on the size and initial position of the raindrops. These paths are listed below:
  • Path 1: The small raindrops near the entrance of windows instantly gain horizontal velocity from the wind and enter directly into the room.
  • Path 2: The rainwater that fell onto the upper surface of window creates bigger drops at the edge, and when the drops fall, they are carried with the wind. Those drops collide with the bottom window surface, thereby creating a splash and generating small drops that enter through the window opening with the assistance of the wind and the momentum of the bigger drop.
  • Path 3: The smaller raindrops relatively far away from the window are unable to enter directly but collide with the bottom window surface, thus producing a similar phenomenon as path 2.
Figure 5. Schematic diagram of different rainwater inflow paths (visualized by a PIV system as presented in Figure S4).
Sustainability 07 10499 g005
Apart from the above-mentioned paths, select minor unknown flow paths may have been disregarded for the ease of determination of paths and application of the control measures.

3.2.2. Remedy Methods and Consequences According to the Identified Rainwater Inflow Path
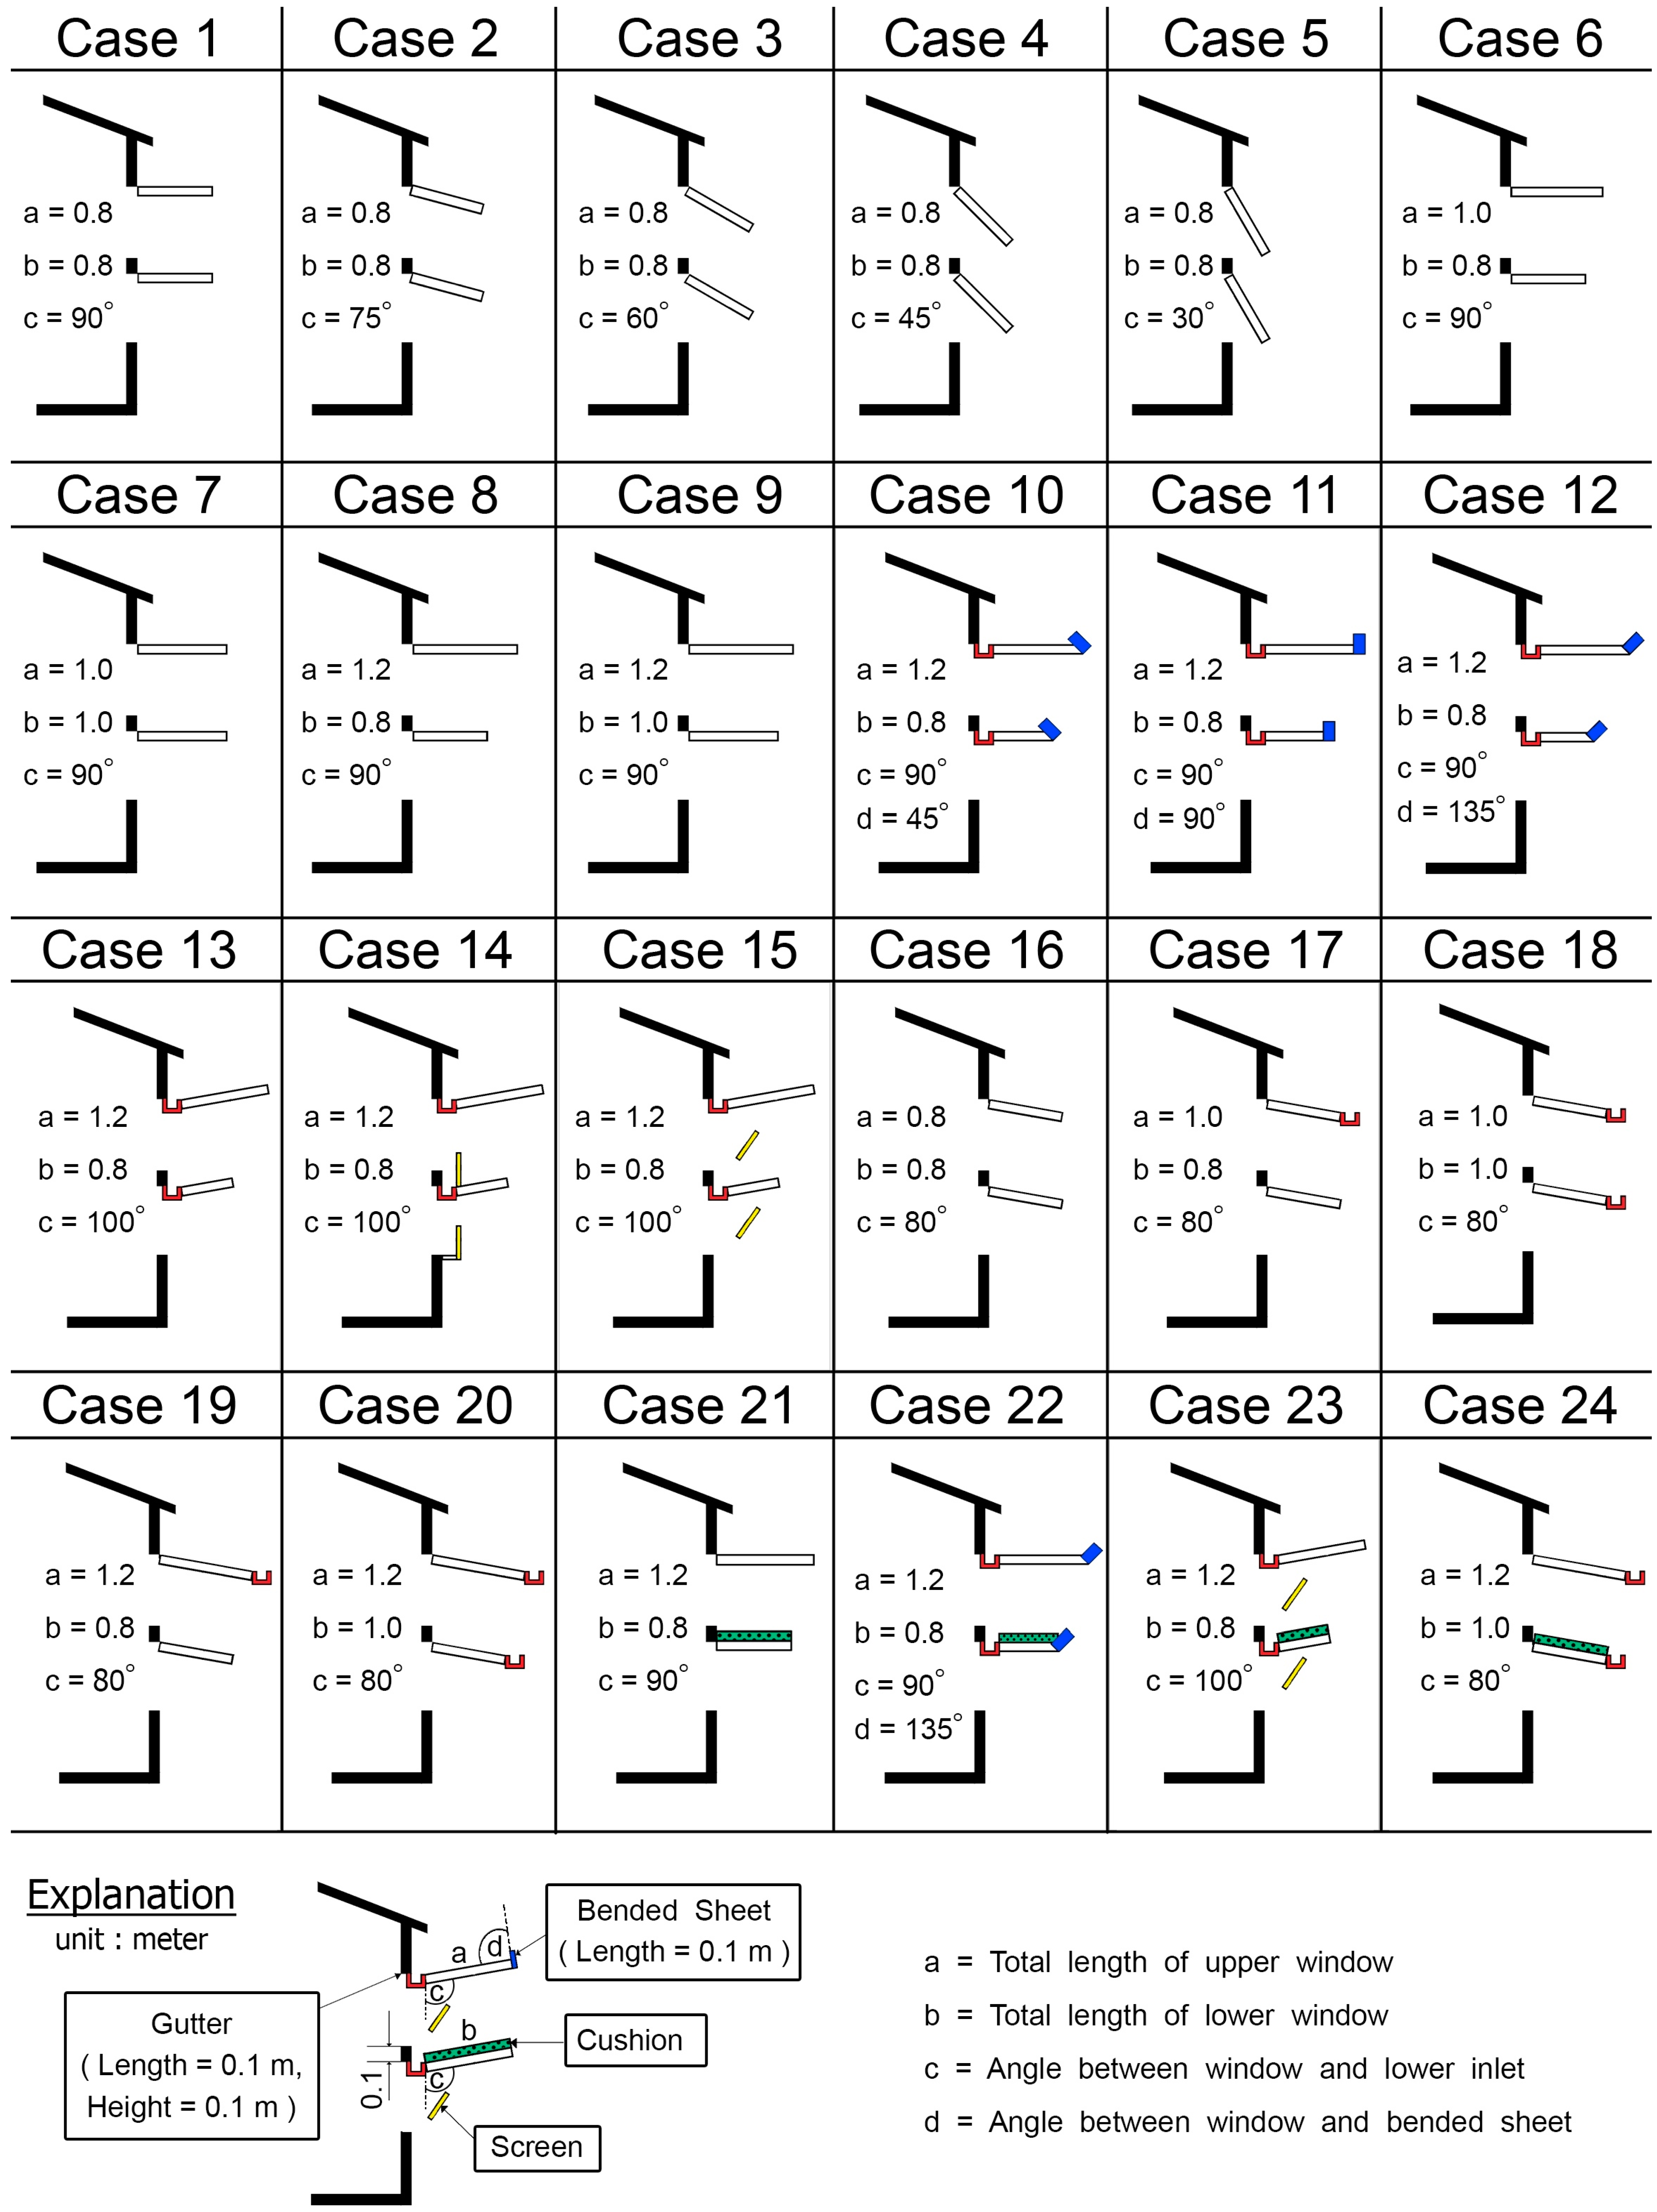
The identification of the rainwater penetration paths is followed by the selection and use of additional components to intercept these paths. The selection of additional components is based on the experience, ease of usage, and function of each component. Notably, the final solution loses significance when the designed structure is too weak or unpractical. The modifications used are the window angle, window extension, rainwater gutter, bended sheet, cushion, and screen.
Function of each additional component/modification:
(1)
Window angle: As the window angle deviates from 90°, the area of the opening changes accordingly, which results in the increase/decrease of airflow and rain penetration rate through the opening (Figure 6, cases 2–5, 13–20 and 23–24).
(2)
Window extension: Extensions of the windows decrease the distance that raindrops can travel to enter through the opening, predominantly intercepting path 1 flows (Figure 6, cases 6–15 and 17–24).
(3)
Gutter: A gutter collects and funnels the rainwater that falls on the surface of the window and decreases the amount of rainwater following path 2 (Figure 6, cases 10–15, 17–20 and 22–24).
(4)
Bended sheet: A bended sheet directs rainwater on the upper surface of the window towards the gutter to block path 2 flows (Figure 6, cases 10–12 (blue color)).
(5)
Cushion: The use of buffer material such as artificial grass to facilitate the soft landing of raindrops on the window surface reduces the entry of water through splashing, thus countering the effect of path 3 flows (Figure 6, cases 21–24).
(6)
Screen: A screen allows airflow but obstructs rain penetration because of the presence of small sieves (Figure 6, cases 14–15 and 23). Adjustable screens further aid in manually modifying the orientation of the screen, depending on the rainfall conditions for cases 15 and 23.
These techniques are either used independently or in combination to develop several experimental cases. Outstanding cases or cases with notable issues are presented in Figure 6. The experiments were executed at a velocity of 7 m/s for all cases to measure the rain flow and ventilation. The rainwater inflow is measured following the procedure described in Section 2.2, and the ventilation is evaluated by using measured and CFD predicted values of the average wind speed on the leeward outlet of the model. The details of the additional adjustment for all studied cases are shown in Tables S1 and S2, and the experimental and simulation results according to the adjustments are shown in Table 2.

Effects Resulting from Changing the Opening Angle (Cases 1–5)

The analysis covering the influence of the opening angle on the ventilation efficiency was briefly performed earlier in the preliminary analysis. In this step, to measure the effectiveness of the opening angles on the reduction of rain penetration, four additional windows types were utilized with our basic window (90°) (Table 2). The results show that starting from 90° open windows, a gradual decrease in rainwater penetration is noted as the angle of the window is decreased, and a window opening angle of 30° displays no rainwater inflow into the room. However, along with the reduction of rainwater inflow, the ventilation of the room with a window angle of 30° is also decreased by approximately 40% compared with the 90° angled window. For industries with windows that are continuously open, the selection of the window opening angle could be a major factor in reducing the rainwater inflow. Additionally, a higher reduction in the rainwater penetration might be obtained at the expense to the ventilation of the room.
Figure 6. Addition of the supplement for the 24 case studies.
Sustainability 07 10499 g006
Table 2. Measurement results for the rain penetration and ventilation and the CFD simulation results of the ventilation for modified windows.
Case StudyRain Penetration (mm/h)Ventilation (m/s)Rain Penetration (%)Ventilation (%)
MeasurementCFDMeasurementCFD
13.701.961.89100.0100.0100.0
21.201.851.7232.494.491.0
30.201.811.835.492.396.8
40.091.611.542.482.181.5
50.001.211.140.061.760.3
63.311.951.8889.599.599.5
72.021.941.8954.699.0100.0
80.971.901.8726.296.998.9
90.821.921.8622.298.098.4
100.211.891.855.796.497.9
110.151.691.824.186.296.3
120.101.881.852.795.997.9
130.242.031.966.5103.6103.7
140.041.34-1.168.4-
150.051.79-1.491.3-
162.211.891.7259.796.491.0
171.541.341.2541.668.466.1
181.031.451.3827.874.073.0
190.061.781.631.690.886.2
200.031.591.450.881.176.7
210.891.90 *-24.196.9-
220.061.88 *-1.695.9-
230.041.79 *-1.191.3-
240.021.59 *-0.581.1-
250.162.03 **-4.3103.6-
260.202.03 **-5.4103.6-
270.232.03 **-6.2103.6-
280.142.03 **-3.8103.6-
290.232.03 **-6.2103.6-
* Ventilation efficiency for case 21, 22, 23, and 24 is assumed to be equal to the original cases (case 8, 12, 15, and 20, respectively). ** Ventilation efficiency for cases 25–29 (use of different cushions: Table S2) is assumed to be equal to the original case (case 13).

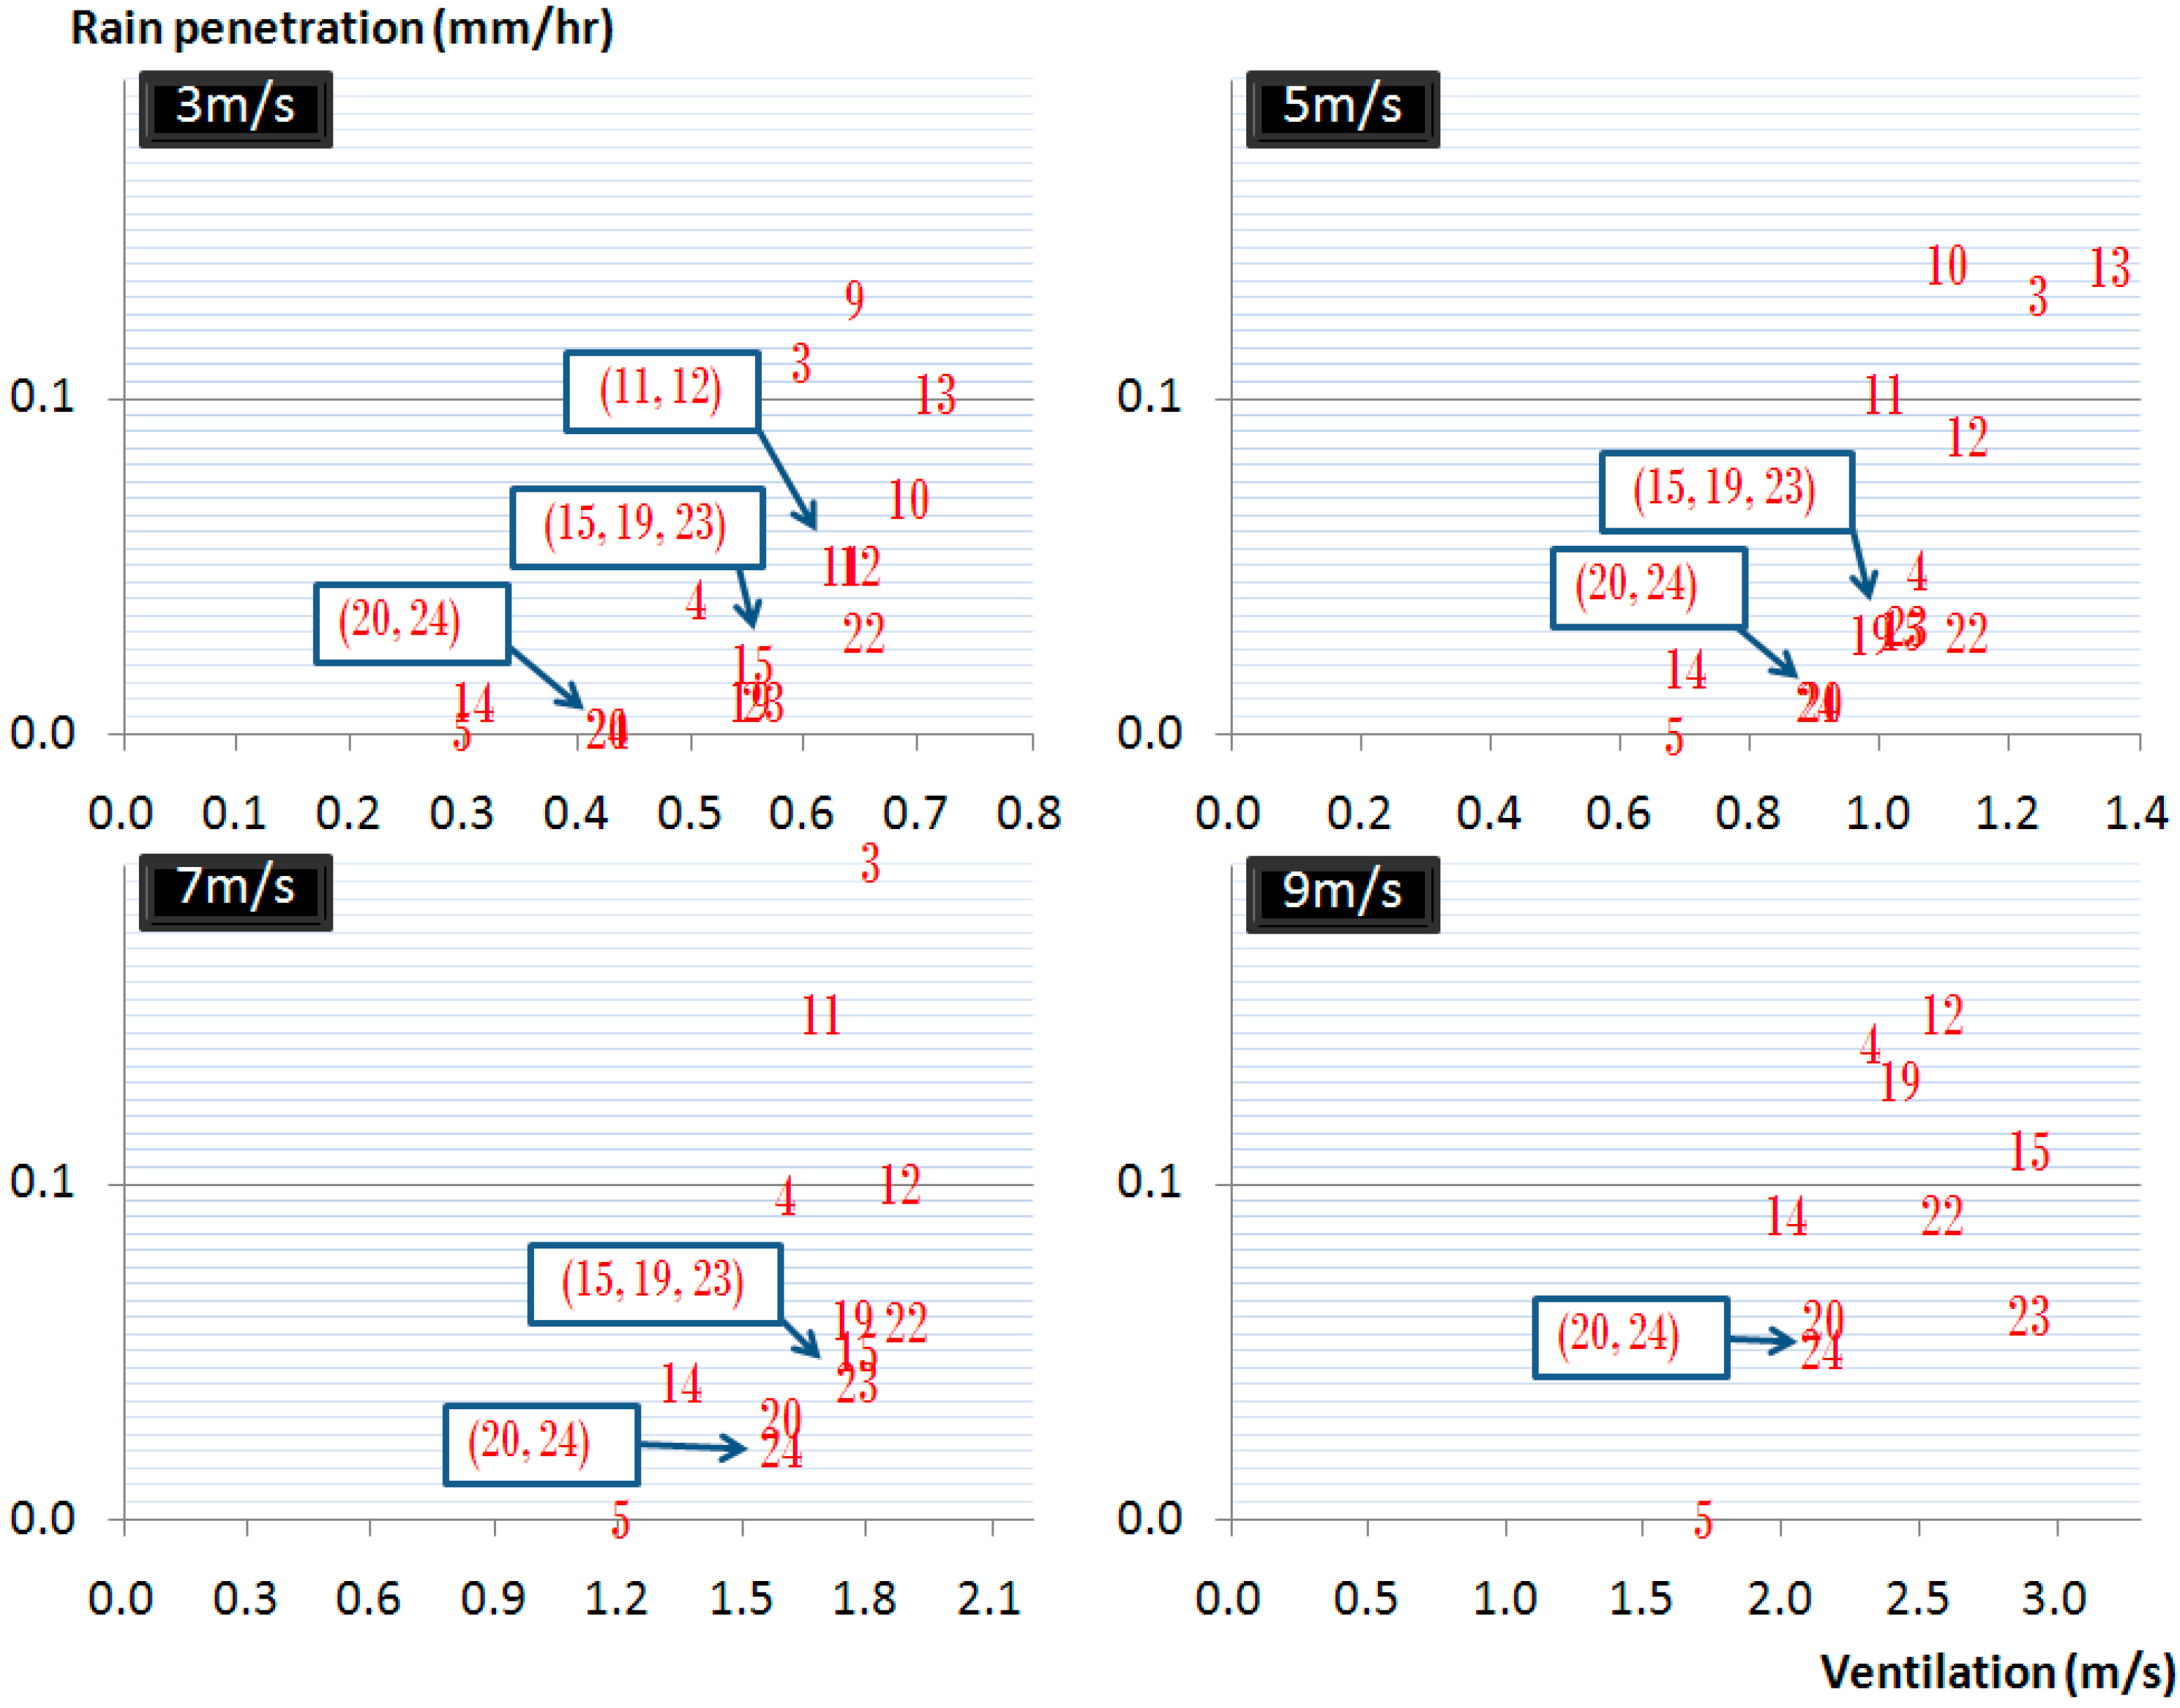
Effects Resulting from Changing the Windowpane Length (Cases 6–9)

The length of the windowpane is extended gradually by 0.2 m on both the upper and lower windows. An immediate improvement in the reduction of rainwater of approximately 50% is observed by increasing the upper and lower windowpanes by 0.2 m in case 7. This reduction in rain penetration is further increased to almost 80% by extending the upper window by another 0.2 m in case 8. With this extension of the windowpane, the ventilation capacity remained approximately 97%–100% of the basic window (0.8 × 0.8 m2). A comparison of cases 8 and 9 shows only a slight increase in rainwater inflow reduction; case 8 is therefore selected as the optimum from this set of cases. Further reduction in rainwater inflow could be achieved by longer extensions to the windowpanes, but this could affect the structural stability of the window, which would require additional studies.

Effects Resulting from the Addition of a Bended Sheet and Gutter (Cases 10–12)

Rainwater gutters at the base and a bended sheet with changing angles at the front edge of the 1.2 × 0.8 m2 windows are added, as shown in cases 10–12. The length of the gutter (0.1 m) is included in the total length of the windowpane in all cases. The combination of the gutter and bended sheet produces an angle of 135° (case 12) with the windowpane and results in a rainwater inflow reduction of approximately 95% and a small reduction in ventilation capacity. This combination is significantly better than the other setups, which use 45° and 90° angled bended sheets. In addition to the better effect in blocking rainwater following path 2 flows, this change in angle may serve as a longer length of the windowpane.

Effects Resulting from the Addition of a Gutter and a Screen Plus a Change in the Angle (Cases 13–15)

From cases 13–15, the possibility of using obtuse angled windows (100°) to direct the rainwater flow into the gutters instead of a bended sheet is tested. This design is intended to reduce the burden of the water weight that remains on the window surface, notably at an angle of 90° (case 10–12). Additionally, screens of two different inclinations (90° and 135° with horizontal ground) were added on the lower and upper windows of the model to strengthen the rainwater reduction potential. Using 100° inclined windows (case 13) to replace the bended sheets (case 12) caused a slight increase in the rainwater inflow but increased the ventilation rate. The ventilation efficiency of case 13 is the best among all of the created windows because of its largest cross-sectional area, which results from the increased angle and length of the upper window. The addition of screens to the model is followed by a substantial reduction in the rainwater inflow (to negligible amounts) with a decrease in the ventilation rate. However, instead of using 90° screens, 45° screens could be used to achieve ventilations of approximately 90% (case 15) in exchange for a small increase in the rain penetration amount. An additional advantage of the screens used in this model is that they are adjustable; thus, the angle could be manually changed according to the comfort of the users (Figure S5). The ventilation for cases 14 and 15 cannot be simulated because the Airpak program does not have the functionality to create such a screen.

Effects Resulting from the Addition of a Gutter and the Length Plus a Change in the Angle (Cases 16–20)

A contrasting method of employing obtuse angled windows (cases 13–15) is used in cases 16–20, i.e., the use of acute angled windows (80°) to reduce the angle though rain might enter directly (path 1). These cases employ rain gutters at the front edge of the windowpane to drain surface water and utilize a varying windowpane length. The extension of windows and the use of a gutter for cases 17 and 18 reduced the rainwater inflow by approximately 60% and more than 70%, respectively, with an associated reduction in the ventilation efficiency of approximately 30% for both cases. The identical design with a shorter (case 16) and a longer (cases 19 and 20) length of windowpane displayed a better ventilation performance. This unexpected result may be because of the wake of the airflow created by the attached gutter at the front edge (shown in Figure S6). Surprisingly, in cases 19–20, which used a longer windowpane compared with cases 17–18, the overall performances (decrease in the rain penetration and increase in ventilation) improved. The extension of the windowpane in this length may have provided sufficient space to create a smoother airflow to the entrance of inlet and reduce the effect of the wake (Figure S7: a weaker wake effect still appears). Compared with case 20, adding a gutter at the upper window with a slightly shorter length of the lower windowpane (case 19) provided a better ventilation rate but increased the amount of rain penetration. Selecting between these cases (19–20) thus depend on the desired preference. Among all cases, the case that displayed the most substantial difference between the measurement and simulation value is in this group, i.e., case 16 at 9.0%.

Effects Resulting from the Addition of a Cushion (Buffer Material Code JN 108: Table S2) (Cases 21–24)

A cushion is provided to the best performing windows from the preceding sections (cases 8, 12, 15, and 20) to prevent the splashes from the raindrops from falling onto the surface of the lower window. The use of cushions has a slight effect on reducing the rainwater inflow (notably for cases 12, 15, and 20; therefore, rainwater paths 2 and 3 for these three cases are mostly prevented after the previous modifications). Although the reduction in the rainwater inflow was not significant, this improvement is achieved without compromising the ventilation efficiency. For the comparison among these best cases, the use of a window with the upper window extended by 0.4 m, with gutters and with bended sheets (135°) on both the lower and upper windows along with a cushion (case 22) is judged as the best performing combination to achieve a higher ventilation and lower rain penetration. The ventilation for cases 21–24 (and 25–29) is not simulated based on the assumption that the cushions do not affect the ventilation efficiency.

Effects Resulting from the Use of Different Cushions (Cases 25–29)

The cushions used in this section are selected from the set of 5 different types of materials and file lengths (Table S2). These cushions are added to case 13 to determine their effect in preventing path 3 rain entry (assuming that path 2 entry should be intercepted because of the angle of the windowpane). The addition of cushions (cases 25–29) to case 13 shows a reduction in the amount of rainwater inflow. As the file length of the cushions used increases, the rainwater inflow unexpectedly increases, except when using a JNE 135 that is composed of polyester and nylon and has a file length of 35 mm (case 28). This material is able to reduce approximately half of the rainwater entry that would otherwise enter the building (case 13). These results confirm the significant effect of rainwater path 3 flow. Therefore, JNE 135 is recommended as a buffer material because of its ability to reduce rainwater inflow.

3.2.3. Sensitivity Analysis and Correlation Coefficient

A sensitivity analysis is implemented to infer when the designed windows with the best possible performances for both objectives (high ventilation and low rain penetration) can work properly for all situations by varying the wind speed: 3, 5, 7, and 9 m/s. The plot for the rain penetration against the ventilation results for the four wind speeds is shown in Figure 7 (raw data in Table S3). As concluded above, case 22 is a good option for all wind speeds because it displays a combination of better ventilation with lower rain penetration. In addition, case 23 (case 15 with the addition of a cushion) performs well in all four wind speeds. The utilization of case 23 with an adjustable screen (Figure S5) is also suggested as an option because the ventilation efficiency can be maximized (equaling the best study case (case 13)) in the case of no rain. The correlations between the measurement and simulation results for the ventilation efficiency are presented in Table S4. The numerical prediction of the ventilation based on the velocity at the leeward outlet is performed for all external wind velocities (3, 5, 7, and 9 m/s) and is validated using the experimental results for the identical conditions. A good correlation coefficient between the predicted and measured values of the wind velocities was obtained (the lowest correlation coefficient was 0.87 for a wind speed of 5 m/s). Thus, the results of this study were considered to be robust.
Figure 7. Sensitivity analysis for the designed windows in terms of ventilation and rain penetration for four different wind speeds (3, 5, 7, and 9 m/s); overlapped numbers are displayed again in blue blocks for clearer illustration.
Sustainability 07 10499 g007
Six cases considered good representatives for the analyses of ABL wind profile and a mesh independence study, i.e., two best performing windows: cases 12 and 19 (only cases that the simulation can be performed), two best cases for ventilation: cases 1 and 13, and two worst cases for ventilation: cases 5 and 17, are selected. To create an ABL wind profile, a larger size of boundary (compared to original cases of simulations) is required. After performing many simulation cases for identifying an appropriate computational domain, modeling an ABL flow in a computation domain of dimensions L × W × H = 14 × 6 × 8 m3 is fixed and carried out. The distances between the model room and faces of the domain are 8.2 m, 2.5 m, 5.6 m and 2.2 m, in the upstream, sideward, upward and downstream directions, respectively. The test to investigate if there is a significant effect from expanding boundary size of simulation is also presented together with the simulation results of ABL flow through the windows in Figure S8 for the comparison with the results of experiment and main simulation. It is seen from Figure S8 that the volume flow rate at the exit of window configuration does not vary significantly with change in boundary size for all cases. Therefore, effect from boundary expansion can be disregarded. From this analysis, there is not much difference between the results of ABL1 and ABL2 while there are huge differences in values between original case and both ABLs, except case 5 having worst ventilation efficiency, originally. Not only the increases in the values for both cases of ABL take place immensely, but also there is a change in ranking of ventilation efficiency, i.e., cases 17 and 19. As aforementioned, it is anticipated that case 17 should have better ventilation performance than case 19 but it is contrary as explained in Section 3.2.2. Unexpectedly, applying a realistic ABL profile could help to reduce the effect of the wake. Whatsoever, this does not change the conclusion that case 12 is recommended as the best performing window (among these cases that can be tested by CFD simulation).
For the analysis to minimize the discretization errors, a grid-sensitivity test is performed based on four grids; coarser, coarse, medium and fine grid, with approximately 0.4–0.5 million, 0.8–0.9 million, 1.4–1.5 million (main cases) and 1.6–1.8 million cells, respectively. For the preliminary study, average mass flow rate through six windows in the building is used for comparison of the meshes. The differences between medium grid and the other grids, i.e., coarser, coarse and fine grids, are about 5.7%, 1.9% and 1.7%, respectively. For the optimization study, the average ventilation flow rate of six designed windows (cases 1, 5, 12, 13, 17 and 19) through the outlet opening is used for the test. The differences between medium grid and other grids, i.e., coarser, coarse and fine grid, are about 4.5%, 1.1% and 0.5%, respectively. Therefore, it is concluded that the medium grid is suitable for both preliminary and optimization studies.

4. Conclusions

This study accesses window designs to optimize the efficiency of natural ventilation, rain penetration prevention and structural composition through actual experiments on both full- and reduced-scale models with the assistance of numerical analyses of a full-scale model. A wide range of additional components that could be used in the design of windows is tested. Starting from the determination of rain flow paths, several techniques to counter those paths are tested. The use of a CFD was critical for this study to visualize the wind flow paths and compare the numerical and experimental results for validation purposes. Finally, the design for the best performing windows (cases 12 and 15 with cushion code JNE 135) during wind-driven rain over a wide range of wind speeds is proposed. Although this study is performed for a specific industrial building model, the results could also be used as a reference in designing windows for residential and public building ventilation. Furthermore, individuals can select the design of windows according to their requirement of ventilation and the desired threshold of rain penetration from the datasheet and window designs provided in this paper.
However, this study has select limitations that must be considered when applying the results in the design of the windows. These limitations could be a subject for further investigations. The main limitation is the assumption of a horizontal wind with a constant speed that act perpendicular to the window opening, distinct from the real world but it is applied for all cases in the experiment. One of the reasons is that a uniform flow acting as designed in this study can result in the highest amount of driving rain on the surface of a wall [45] considered in conjunction with the maximum values in Korea of artificial wind speed and rainfall intensity to be a potential worst case scenario of rain penetration. Nevertheless, in reality, airflow patterns in front of (and around) buildings are highly variable (and various patterns of vortices can form) due to factors such as roof shape, building height, opening location and size, surrounding buildings, and air inflow [46,47,48,49,50,51] leading to a large number of cases for consideration. Wind patterns including ABL flows from different directions and speeds may influence the performance results of not only ventilation but also of wind-driven rain protection, due to the change of raindrop paths (and intensity of each), for all designed windows. To remove this limitation, further studies could be performed, e.g., considering varying wind directions, wind speeds, etc. For other limitations, case 15 is one of the proposed methods, and the screen is an important part of the design. Varying the sieve size of the screen may also enhance the performance. In [52] (for example), many products are available for use as buffer material, and substituting the buffer does not affect the efficiency of ventilation, which encourages experimentation with other products. In addition, studies could be performed on the structural soundness of the proposed designs of windows.

Supplementary Files

Supplementary File 1

Acknowledgments

This research was supported by Changwon National University (CWNU), the Brain Korea 21 Plus Project, and Ventech Corp., South Korea. The authors would like to thank Sujit Dahal for his enthusiastic assistance in conducting simulations and writing the manuscript in the initial stage of the research, thank Jungho Lim for his valuable suggestions on academic ideas of this paper, and thank Jungwan Lee for his continued support and cooperation. The authors also wish to thank the editor and anonymous reviewers for their constructive comments on the earlier version of the article.

Author Contributions

Kritana Prueksakorn designed the study, applied CFD simulation, analyzed the results, wrote the manuscript, and revised it until its final version. Hyunchul Ha and Cheng Xu Piao contributed to the conceptual framework of project, controlled experiments, and provided good advice throughout the paper. Taehyeung Kim supervised the whole work and led the research in general. All authors have read and approved the final manuscript.

Conflicts of Interest

The authors declare no conflict of interest.

References

  1. Bangalee, M.Z.I.; Lin, S.Y.; Miau, J.J. Wind driven natural ventilation through multiple windows of a building: A computational approach. Energy Build. 2012, 45, 317–325. [Google Scholar] [CrossRef]
  2. Evola, G.; Popov, V. Computational analysis of wind driven natural ventilation in buildings. Energy Build. 2006, 38, 491–501. [Google Scholar] [CrossRef]
  3. Homod, R.Z.; Sahari, K.S.M.; Almurib, H.A.F. Energy saving by integrated control of natural ventilation and HVAC systems using model guide for comparison. Renew. Energy 2014, 71, 639–650. [Google Scholar] [CrossRef]
  4. Stavrakakis, G.M.; Zervas, P.L.; Sarimveis, H.; Markatos, N.C. Optimization of window-openings design for thermal comfort in naturally ventilated buildings. Appl. Math. Model. 2012, 36, 193–211. [Google Scholar] [CrossRef]
  5. Wang, Y.; Zhao, F.Y.; Kuckelkorn, J.; Liu, D.; Liu, J.; Zhang, J.L. Classroom energy efficiency and air environment with displacement natural ventilation in a passive public school building. Energy Build. 2014, 70, 258–270. [Google Scholar] [CrossRef]
  6. Yang, D.; Li, P. Natural ventilation of lower-level floors assisted by the mechanical ventilation of upper-level floors via a stack. Energy Build. 2015, 92, 296–305. [Google Scholar] [CrossRef]
  7. Kim, T.; Lee, D.H.; Ahn, K.; Ha, H.; Park, H.; Piao, C.X.; Li, X.; Seo, J. Characteristics of rain penetration through a gravity ventilator used for natural ventilation. Ann. Occup. Hyg. 2008, 52, 35–44. [Google Scholar] [CrossRef] [PubMed]
  8. Von Grabe, J.; Svoboda, P.; Bäumler, A. Window ventilation efficiency in the case of buoyancy ventilation. Energy Build. 2014, 72, 203–211. [Google Scholar] [CrossRef]
  9. Stavridou, A.D.; Prinos, P.E. Natural ventilation of buildings due to buoyancy assisted by wind: Investigating cross ventilation with computational and laboratory simulation. Build. Environ. 2013, 66, 104–119. [Google Scholar] [CrossRef]
  10. Redlich, C.A.; Sparer, J.; Cullen, M.R. Sick-building syndrome. Lancet 1997, 349, 1013–1016. [Google Scholar] [CrossRef]
  11. Santamouris, M. Natural Ventilation in Buildings: A Design Handbook, 1st ed.; James & James (Science Publishers) Ltd.: London, UK, 1998; pp. 2–3. [Google Scholar]
  12. Fontanini, A.; Vaidya, U.; Ganapathysubramanian, B. A stochastic approach to modeling the dynamics of natural ventilation systems. Energy Build. 2013, 63, 87–97. [Google Scholar] [CrossRef]
  13. Kleiven, T. Natural Ventilation in Buildings Architectural Concepts, Consequences and Possibilities. DoktorIngeniør Ph.D. Thesis, Norwegian University of Science and Technology, Trondheim, Norway, 2003. [Google Scholar]
  14. Heiselberg, P.; Svidt, K.; Nielsen, P.V. Characteristics of airflow from open windows. Build. Environ. 2001, 36, 859–869. [Google Scholar] [CrossRef]
  15. Van Hooff, T.; Blocken, B. CFD evaluation of natural ventilation of indoor environments by the concentration decay method: CO2 gas dispersion from a semi-enclosed stadium. Build. Environ. 2013, 61, 1–17. [Google Scholar] [CrossRef]
  16. Van Hooff, T.; Blocken, B. Full-scale measurements of indoor environmental conditions and natural ventilation in a large semi-enclosed stadium: Possibilities and limitations for CFD validation. J. Wind Eng. Ind. Aerodyn. 2012, 104–106, 330–341. [Google Scholar] [CrossRef]
  17. Gao, C.F.; Lee, W.L. Influence of window types on natural ventilation of residential buildings in Hong Kong. Available online: http://docs.lib.purdue.edu/ihpbc/16 (accessed on 1 April 2015).
  18. Fracastoro, G.V.; Mutani, G.; Perino, M. Experimental and theoretical analysis of natural ventilation by windows opening. Energy Build. 2002, 34, 817–827. [Google Scholar] [CrossRef]
  19. Walker, C.; Tan, G.; Glicksman, L. Reduced-scale building model and numerical investigations to buoyancy-driven natural ventilation. Energy Build. 2011, 43, 2404–2413. [Google Scholar] [CrossRef]
  20. Teppner, R.; Langensteiner, B.; Meile, W.; Brenn, G.; Kerschbaumer, S. Air change rates driven by the flow around and through a building storey with fully open or tilted windows: An experimental and numerical study. Energy Build. 2014, 76, 640–653. [Google Scholar] [CrossRef]
  21. Shetabivash, H. Investigation of opening position and shape on the natural cross ventilation. Energy Build. 2015, 93, 1–15. [Google Scholar] [CrossRef]
  22. Kang, J.H.; Lee, S.J. Improvement of natural ventilation in a large factory building using a louver ventilator. Build. Environ. 2008, 43, 2132–2141. [Google Scholar] [CrossRef]
  23. Cruz-Salas, M.V.; Castillo, J.A.; Huelsz, G. Experimental study on natural ventilation of a room with a windward window and different windexchangers. Energy Build. 2014, 84, 458–465. [Google Scholar] [CrossRef]
  24. Yin, W.; Zhang, G.; Yang, W.; Wang, X. Natural ventilation potential model considering solution multiplicity, window opening percentage, air velocity and humidity in China. Build. Environ. 2010, 45, 338–344. [Google Scholar] [CrossRef]
  25. Blocken, B.; Carmeliet, J. A review of wind-driven rain research in building science. J. Wind Eng. Ind. Aerodyn. 2004, 92, 1079–1130. [Google Scholar] [CrossRef]
  26. Briggen, P.M.; Blocken, B.; Schellen, H.L. Wind-driven rain on the facade of a monumental tower: Numerical simulation, full-scale validation and sensitivity analysis. Build. Environ. 2009, 44, 1675–1690. [Google Scholar] [CrossRef]
  27. World Health Organization (WHO). WHO Guidelines for Indoor Air Quality: Dampness and Mould; WHO Regional Office of Europe: Copenhagen, Denmark, 2009; pp. 36–77. Available online: https://books.google.co.kr/books?hl=en&lr=&id=PxB8UUHihWgC&oi=fnd&pg=PR7&dq=WHO+Guidelines+for+Indoor+Air+Quality:+Dampness+and+Mould.&ots=9zJXOYO4FO&sig=DiQf8RL7jiY_VDGZQL0oARBRBS0&redir_esc=y#v=onepage&q&f=false (accessed on 19 April 2019).
  28. Blocken, B.; Carmeliet, J. Spatial and temporal distribution of driving rain on a low-rise building. Wind Struct. 2002, 5, 441–462. [Google Scholar] [CrossRef]
  29. Lopez, C.; Masters, F.J.; Bolton, S. Water penetration resistance of residential window and wall systems subjected to steady and unsteady wind loading. Build. Environ. 2011, 46, 1329–1342. [Google Scholar] [CrossRef]
  30. Lacasse, M.A.; Rousseau, M.Z.; Cornick, S.M.; Manning, M.M.; Ganapathy, G.; Nicholls, M.; Williams, M.F. Laboratory tests of water penetration through wall-window interfaces based on U.S. residential window installation practice. J. ASTM Int. 2009, 6, 1–35. [Google Scholar] [CrossRef]
  31. Salzano, C.T.; Masters, F.J.; Katsaros, J.D. Water penetration resistance of residential window installation options for hurricane-prone areas. Build. Environ. 2010, 45, 1373–1388. [Google Scholar] [CrossRef]
  32. Blocken, B.; Derome, D.; Carmeliet, J. Rainwater runoff from building facades: A review. Build. Environ. 2013, 60, 339–361. [Google Scholar] [CrossRef]
  33. Coutu, S.; Wyrsch, V.; Rossi, L.; Emery, P.; Golay, F.; Carneiro, C. Modelling wind-driven rain on buildings in urbanized area using 3-D GIS and LiDAR datasets. Build. Environ. 2013, 59, 528–535. [Google Scholar] [CrossRef]
  34. MohaddesForoushani, S.S.; Ge, H.; Naylor, D. Effects of roof overhangs on wind-driven rain wetting of a low-rise cubic building: A numerical study. J. Wind Eng. Ind. Aerodyn. 2014, 125, 38–51. [Google Scholar] [CrossRef]
  35. Pérez-Bella, J.M.; Domínguez-Hernández, J.; Rodríguez-Soria, B.; del Coz-Díaz, J.J.; Cano-Suñén, E. Combined use of wind-driven rain and wind pressure to define water penetration risk into building façades: The Spanish case. Build. Environ. 2013, 64, 46–56. [Google Scholar] [CrossRef]
  36. Blocken, B.; Carmeliet, J. Impact, runoff and drying of wind-driven rain on a window glass surface: Numerical modelling based on experimental validation. Build. Environ. 2015, 84, 170–180. [Google Scholar] [CrossRef]
  37. Blocken, B.; Stathopoulos, T.; Carmeliet, J.; Hensen, J. Application of CFD in building performance simulation for the outdoor environment. In Proceedings of the Building Simulation. Eleventh International IBPSA Conference, Glasgow, UK, 27–30 July 2009; pp. 489–496.
  38. Weather Underground (WU)—History, Monthly Summary. Available online: http://www.webcitation.org/6YYSJgbl1 (accessed on 16 May 2015).
  39. Shin, K.B. Ageing of composites in transport applications. In Ageing of Composites; Martin, R., Ed.; Woodhead Publishing Limited: Great Abington, UK, 2008; Chapter 10; p. 294. [Google Scholar]
  40. Homepage of Steve Horstmeyer—Typical raindrop sizes. Available online: http://www.webcitation.org/6Ybwgtqi0 (accessed on 18 May 2015).
  41. CO2 Now.org—What the World Needs to Watch, Earth’s CO2 Home Page. Available online: http://www.webcitation.org/6YZbg68tj (accessed on 17 May 2015).
  42. Buratti, C.; Mariani, R.; Moretti, E. Mean age of air in a naturally ventilated office: Experimental data and simulations. Energy Build. 2011, 43, 2021–2027. [Google Scholar] [CrossRef]
  43. Chanteloup, V.; Mirade, P.S. Computational fluid dynamics (CFD) modelling of local mean age of air distribution in forced-ventilation food plants. J. Food Eng. 2009, 90, 90–103. [Google Scholar] [CrossRef]
  44. Tian, L.; Lin, Z.; Liu, J.; Yao, T.; Wang, Q. The impact of temperature on mean local air age and thermal comfort in a stratum ventilated office. Build. Environ. 2011, 46, 501–510. [Google Scholar] [CrossRef]
  45. Krpan, R. Wind-driven Rain on Buildings in Metro Vancouver: Parameters for Rain Penetration Testing of Window Assemblies. Master’s Thesis, Concordia University, Montreal, QC, Canada, 2013. [Google Scholar]
  46. Perén, J.I.; van Hooff, T.; Leite, B.C.C.; Blocken, B. CFD analysis of cross-ventilation of a generic isolated building with asymmetric opening positions: Impact of roof angle and opening location. Build. Environ. 2015, 85, 263–276. [Google Scholar] [CrossRef]
  47. Perén, J.I.; van Hooff, T.; Leite, B.C.C.; Blocken, B. Impact of eaves on cross-ventilation of a generic isolated leeward sawtooth roof building: Windward eaves, leeward eaves and eaves inclination. Build. Environ. 2015, 92, 578–590. [Google Scholar] [CrossRef]
  48. Abohela, I.; Hamza, N.; Dudek, S. Effect of roof shape, wind direction, building height and urban configuration on the energy yield and positioning of roof mounted wind turbines. Renew. Energy 2013, 50, 1106–1118. [Google Scholar] [CrossRef]
  49. Krishnan, A.; Paraschivoiu, M. 3D analysis of building mounted VAWT with diffuser shaped shroud. Sustain. Cities Soc. 2015. [Google Scholar] [CrossRef]
  50. Zhang, Y.; Habashi, W.G.; Khurram, R.A. Predicting wind-induced vibrations of high-rise buildings using unsteady CFD and modal analysis. J. Wind Eng. Ind. Aerodyn. 2015, 136, 165–179. [Google Scholar] [CrossRef]
  51. Liu, J.; Srebric, J.; Yu, N. Numerical simulation of convective heat transfer coefficients at the external surfaces of building arrays immersed in a turbulent boundary layer. Int. J. Heat Mass Transfer 2013, 61, 209–225. [Google Scholar] [CrossRef]
  52. Singwang Mat—Product Information. Available online: http://www.webcitation.org/6Ycw7U6na (accessed on 19 May 2015). (In Korean)

