1. Introduction
The Commission of the European Union States in the white paper “European transport policy for 2010: time to decide” [
1] reports that each state has the right to aspire to have a transportation system able to fulfill the advancement expected by virtue of the economic requirements. The sustainable development, that every state must guarantee, should be able to combine the current goods exchange demand without weighing on the potential development of future generations. Nowadays, in respect to any other type of transportation, road transportation is the one presenting the highest activity and widest distribution of goods (85%) and people (93%) [
2], even if every year reports high costs in terms of human lives. The most difficult and dangerous zones for road conditions are tunnels, where very often a simple bumper crash can degenerate into a tragic event.
During the last 50 years the road network development, together with the necessity of ensuring direct and short roads, has led to the construction of a high number of long (more than one km) road tunnels [
2] (
Table 1).
Table 1.
Number of road tunnels divided according to their geographical position and length.
Table 1.
Number of road tunnels divided according to their geographical position and length.
| Country | Tunnel Length (km) |
|---|
| 0 < L < 1 | 1 < L < 2 | 2 < L < 3 | 3 < L < 4 | 4 < L < 5 | 5 < L < 6 | 6 < L < 7 | 7 < L < 8 | 8 < L < 10 | L > 10 |
|---|
| Austria | 55 | 22 | 16 | 3 | 1 | 6 | 3 | 1 | 2 | 1 |
| Belgium | 7 | 6 | 1 | | | | | | | |
| Croatia | 9 | 5 | 1 | | | 3 | | | | |
| France | 46 | 27 | 4 | 8 | 2 | | 1 | | 1 | 3 |
| Germany | 38 | 28 | 7 | 2 | | | | 1 | | |
| Italy | 177 | 131 | 27 | 9 | 6 | 1 | | | | 1 |
| the Netherlands | 4 | 2 | 1 | | | | 1 | | | |
| Norway | 203 | 107 | 45 | 21 | 9 | 9 | 6 | 3 | 1 | 2 |
| Russian Federation | 5 | 2 | 1 | 1 | 1 | | | | | |
| Spain | 25 | 16 | 3 | 2 | 1 | 2 | | | 1 | |
| Switzerland | 67 | 41 | 12 | 8 | 1 | 2 | 1 | | 1 | 1 |
| Turkey | 8 | 5 | 1 | 2 | | | | | | |
| UK | 7 | 5 | 1 | 1 | | | | | | |
Long road tunnels must guarantee the safety of the passengers, since tunnel accidents are potentially more dangerous than those occurring outside tunnels [
3]. Hence, the solution is to build infrastructures provided with every planning device to prevent dangerous situations and characterized by technologies able to minimize the consequences in case of accidents; what is important then is that the infrastructure is planned to ensure safety for all the people potentially involved, facilitating the stream outside the tunnel. Obviously guaranteeing high safety standards, for the managers of these road infrastructures, implies expenses that must be acceptable in a way that the management will be sustainable.
In the past few years, to ensure a higher safety level in road tunnels, single arch-tunnels (bidirectional) have been substituted by double-arch tunnels (unidirectional), which are safer. In Italy, 73% of road tunnels have a single-arched structure, but if we do not refer to the total number of existing tunnels, but rather to those already constructed in the last five years or currently under construction the percentage drops to 30% [
3]. This trend, due to the European legislation 2004/54/CE [
4], shows that there is a necessity to construct safer tunnels.
The realization of lay-bys, emergency passages, emergency exits, and safe pedestrian cross-passages affects about 22% of the bidirectional tunnels’ realization costs and 10% of the unidirectional tunnels’ costs, whereas installation costs of the safety systems constitute 7% [
5].
A proper lighting system is vital for tunnel safety: as a matter of fact, it can reduce the probability that the tunnel users panic in dangerous situations [
6]. Beside ordinary lighting, it is important to guarantee backup lighting creating visibility for the passengers in a way that they can leave the tunnel with their own vehicles in case of a power outage of the ordinary lighting system. Moreover, it is important to have a safety lighting system for those walking out of the tunnel, in case of an accident or fire; this system must also provide some proper information of the existing emergency exits [
7].
Both backup and safety lighting systems must be supplied by an energy source that is independent from the regular power grid supplying the ordinary lighting. Furthermore, backup and safety lighting systems must have an uninterrupted power supply formed by UPS devices (Uninterruptible Power Supply) with a maximum autonomy of at least 30 min, with technical characteristics able to sustain these systems [
8]; if there is a lack of power supply exceeding this time interval, it must be replaced by an electrical generator with a minimum autonomy of 24 h that is able to compensate for the requirements of all safety systems [
9,
10].
The systems laid down for security reasons are supplementary costs. The possibility of amortizing these expenses can facilitate the economic management of the road network and its costs for end users [
11].
2. Case Study
This paper examines the energy requirements of backup and safety lighting systems that, in case of a dangerous situation, must have an independent power source. Safety measures necessary to guarantee continuous service in case of a power outage of the primary power supply require devices (UPS systems, electrical generators, and plant engineering equipment) which are expensive and will weigh on the amortization of installation and management costs of the systems [
12,
13,
14,
15]. This case study focuses on the possibility of supplying these consumptions through photovoltaic panels, generating a cash flow able to pay back the extra investment in photovoltaic technology and amortizing the installation of the panels during the service life of the security systems. Beside the economic benefits, the electric energy production provided by a clean and sustainable source [
16] is part of good governance for what concerns the observation of sustainable environmental choices by road managers [
17].
To make the results as generic as possible, we examined the inner zone of the tunnel, whose length is 300 m (taking into consideration two sections, 150 m each, one preceding and the other following the corresponding emergency exit placed in the center line), of a double-arch unidirectional road tunnel respecting all security standards required by the current standards (lay-bys, emergency lanes, pedestrian cross-passages, emergency exits). Through the lighting software Dialux Evo, we reproduced a three-dimensional road tunnel with a lighting system planned that complied with the standards.
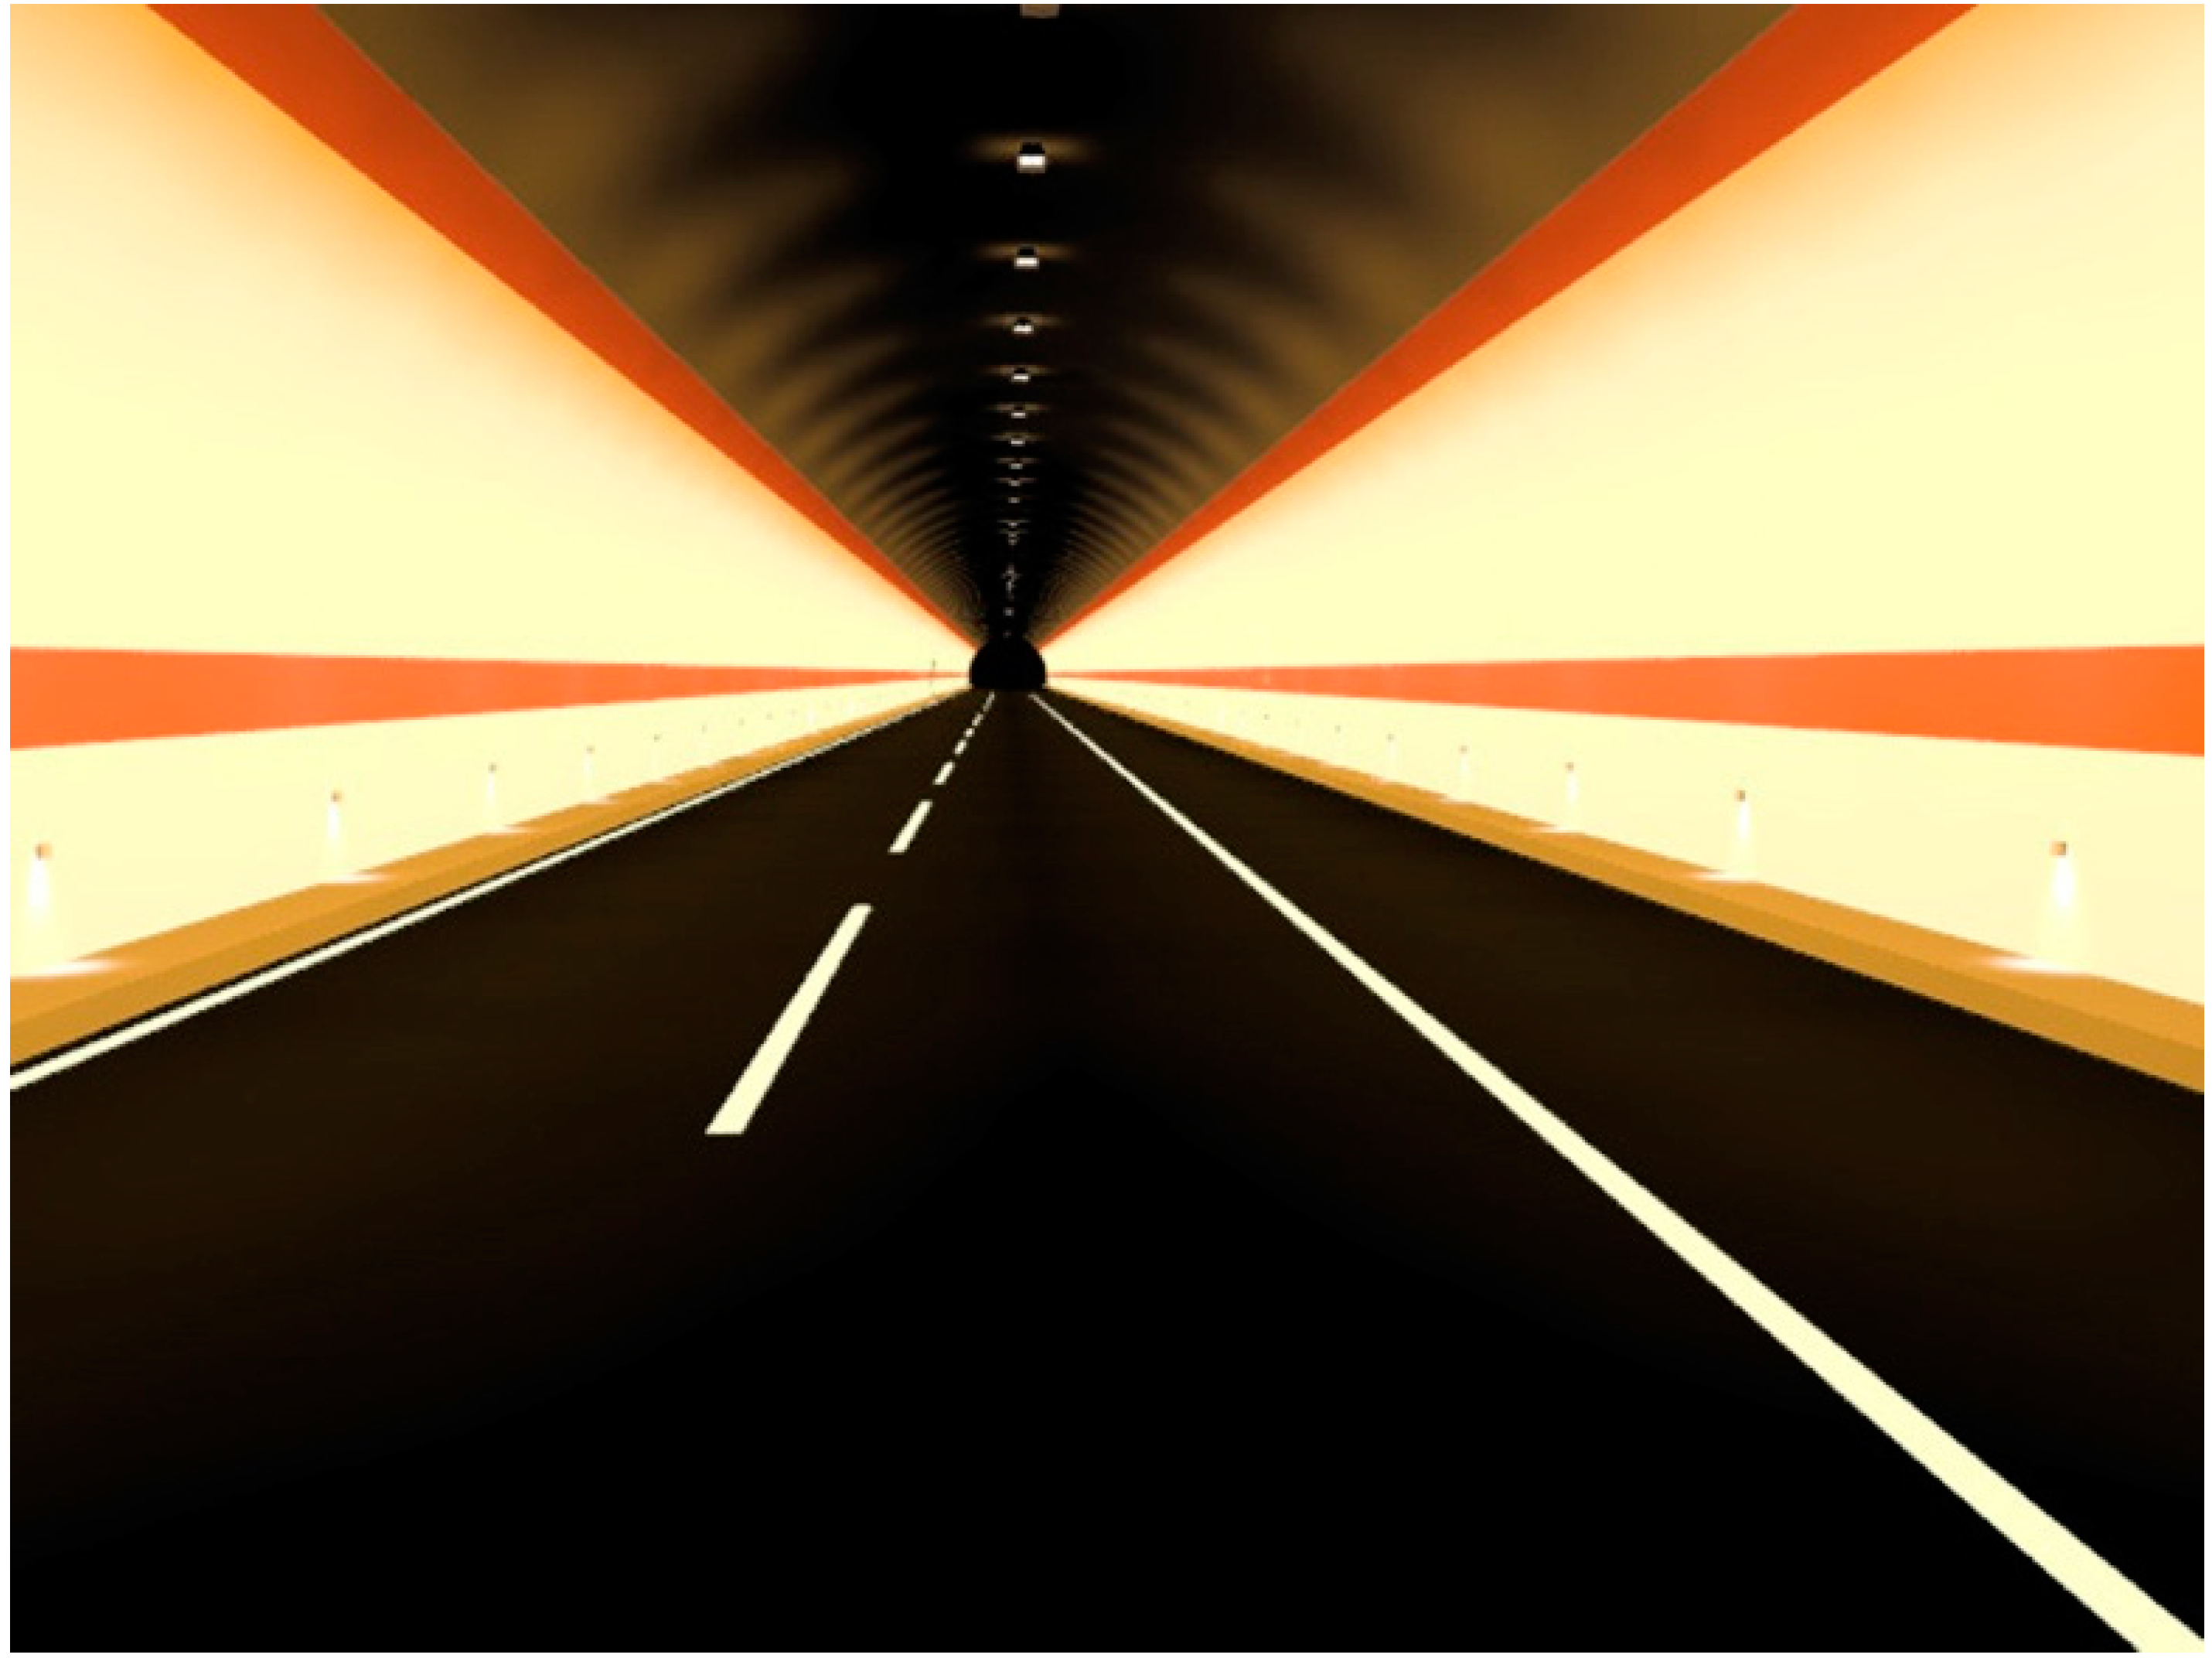
The backup lighting in the inner zone must guarantee, for a minimum time interval of 30 min, the permanent lighting level required during ordinary service. The inner zone must be lighted with a luminance of at least 3 cd/m
2 [
18] (
Figure 1). To obtain these results, HPS (High Pressure Sodium) lamps, with a luminous flux of 28,600 lumen, were used. Such devices are characterized by a power of 470 W.
Figure 1.
Rendering of the tunnel inner zone: backup lighting of the highway and lighting of the emergency exits along each side of the tunnel.
Figure 1.
Rendering of the tunnel inner zone: backup lighting of the highway and lighting of the emergency exits along each side of the tunnel.
The emergency lighting must show emergency exits to the passengers to leave the tunnel; the ordinary service lighting levels must function every day for 24 h, guaranteeing a proper visibility [
19] towards the emergency exits (5 lux at the entrances of the emergency exits, 2 lux through the rest of the emergency exits) [
20] based on a surface of calculation placed 1 m above the road level. Illuminance uniformity E
min/E
med must be higher than 0.7. Emergency exits, on each side of the tunnel, are lighted by LED (Light Emitting Diode) lamps placed on the side wall at a height of 1.25 m. These lamps generate 190 lm, employing 3.0 W.
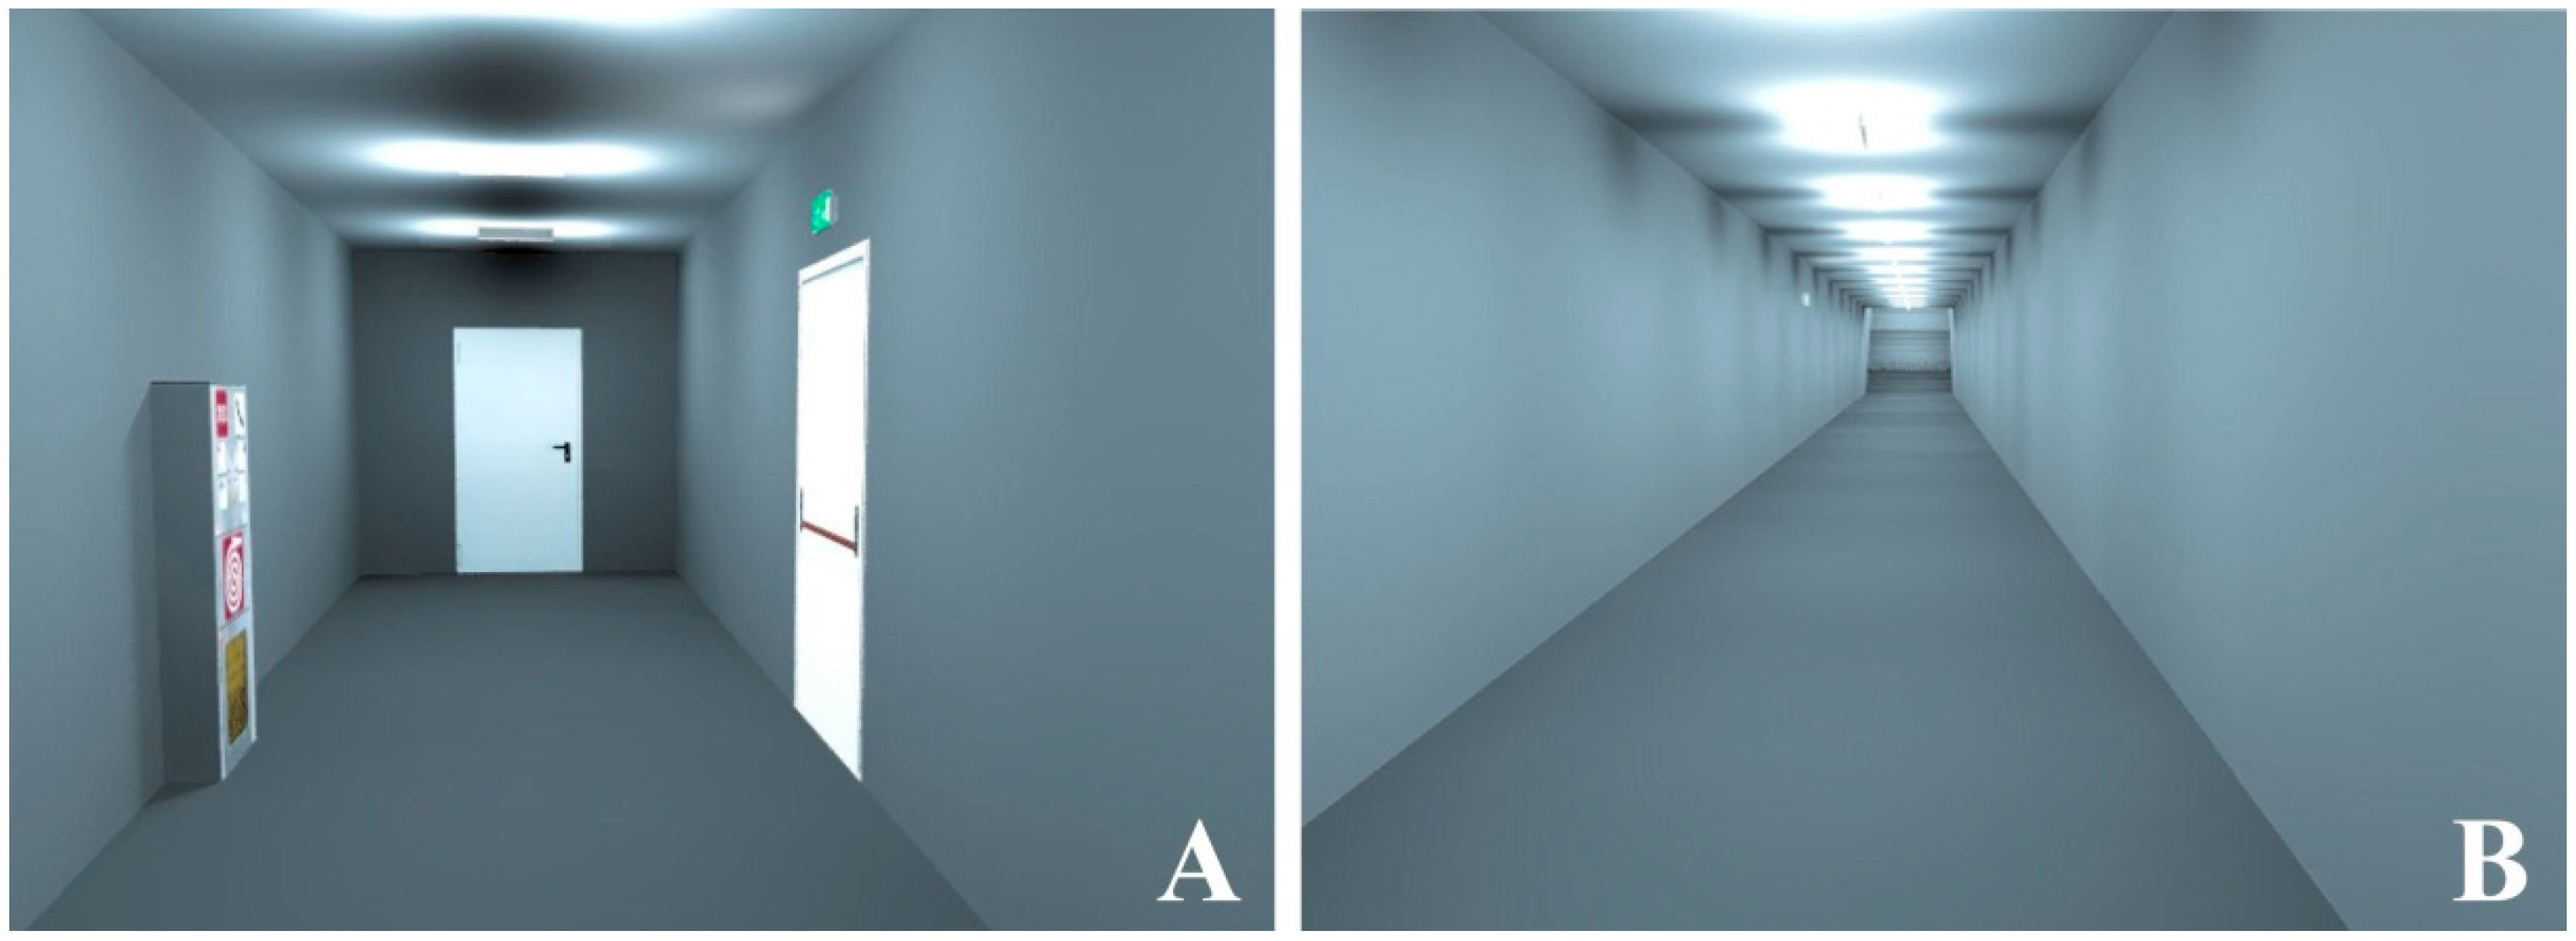
The emergency exits lead to a pedestrian cross-passage between the two barrels of the tunnel, and to the passage leading outside, above the tunnel. The lamps used are LED ceiling light fixtures with a 520 lm flux and a power of 8.1 W.
Figure 2 shows some renderings with the emergency lighting of the safety pedestrian cross-passage (
Figure 2A) and safety passage (
Figure 2B).
The passengers must cross along the road to evacuate the tunnel in dangerous situations and the right way is indicated by LED lamps in conformity with the emergency traffic sign system.
Table 2 reports a synthesis of the number of lamps used and the power (including the control systems [
21,
22]) necessary for the whole lighting system.
Figure 2.
Rendering with safety pedestrian cross-passage (A) and safety passage (B).
Figure 2.
Rendering with safety pedestrian cross-passage (A) and safety passage (B).
Table 2.
Number of lamps and electric power installed.
Table 2.
Number of lamps and electric power installed.
| Lighting | N° | Lamp Power (W) | Power (kW) |
|---|
- (1)
Emergency exits (LED)
| 225 | 3.0 | 0.7 |
- (2)
Pedestrian cross-passage and safety passage (LED)
| 31 | 8.1 | 0.3 |
- (3)
Traffic sign system (LED)
| 14 | 4.5 | 0.1 |
- (4)
Tunnel (HPS)
| 118 | 470.6 | 55.5 |
| Safety lighting (1 + 2 + 3) | 1.0 |
| Backup lighting (4) | 55.5 |
| Total (1 + 2 + 3 + 4) | 56.5 |
The lamps characterizing the lighting system in the zone examined are part of the permanent lighting system. Their installation cost is not considered in the cost estimated for safety systems or energy consumption during ordinary service. Their energy consumption, if a power outage occurs, is part of the requirements concerning the backup lighting.
The installation of the lamps lighting the emergency exits, pedestrian cross-passage, and safety passage is part of the safety lighting systems’ costs [
23] (
Table 3) together with their energy requirements.
Table 3.
Cost of lamps of safety lighting systems.
Table 3.
Cost of lamps of safety lighting systems.
| Lighting | N° | Lamp Cost (€) | Total Cost (€) |
|---|
- (1)
Emergency exits (LED)
| 225 | 26.57 | 5978.25 |
- (2)
Pedestrian cross-passage and safety passage (LED)
| 31 | 26.57 | 823.67 |
- (3)
Traffic sign system (LED)
| 14 | 215.42 | 3015.88 |
| Total (1 + 2 + 3) | 9817.80 |
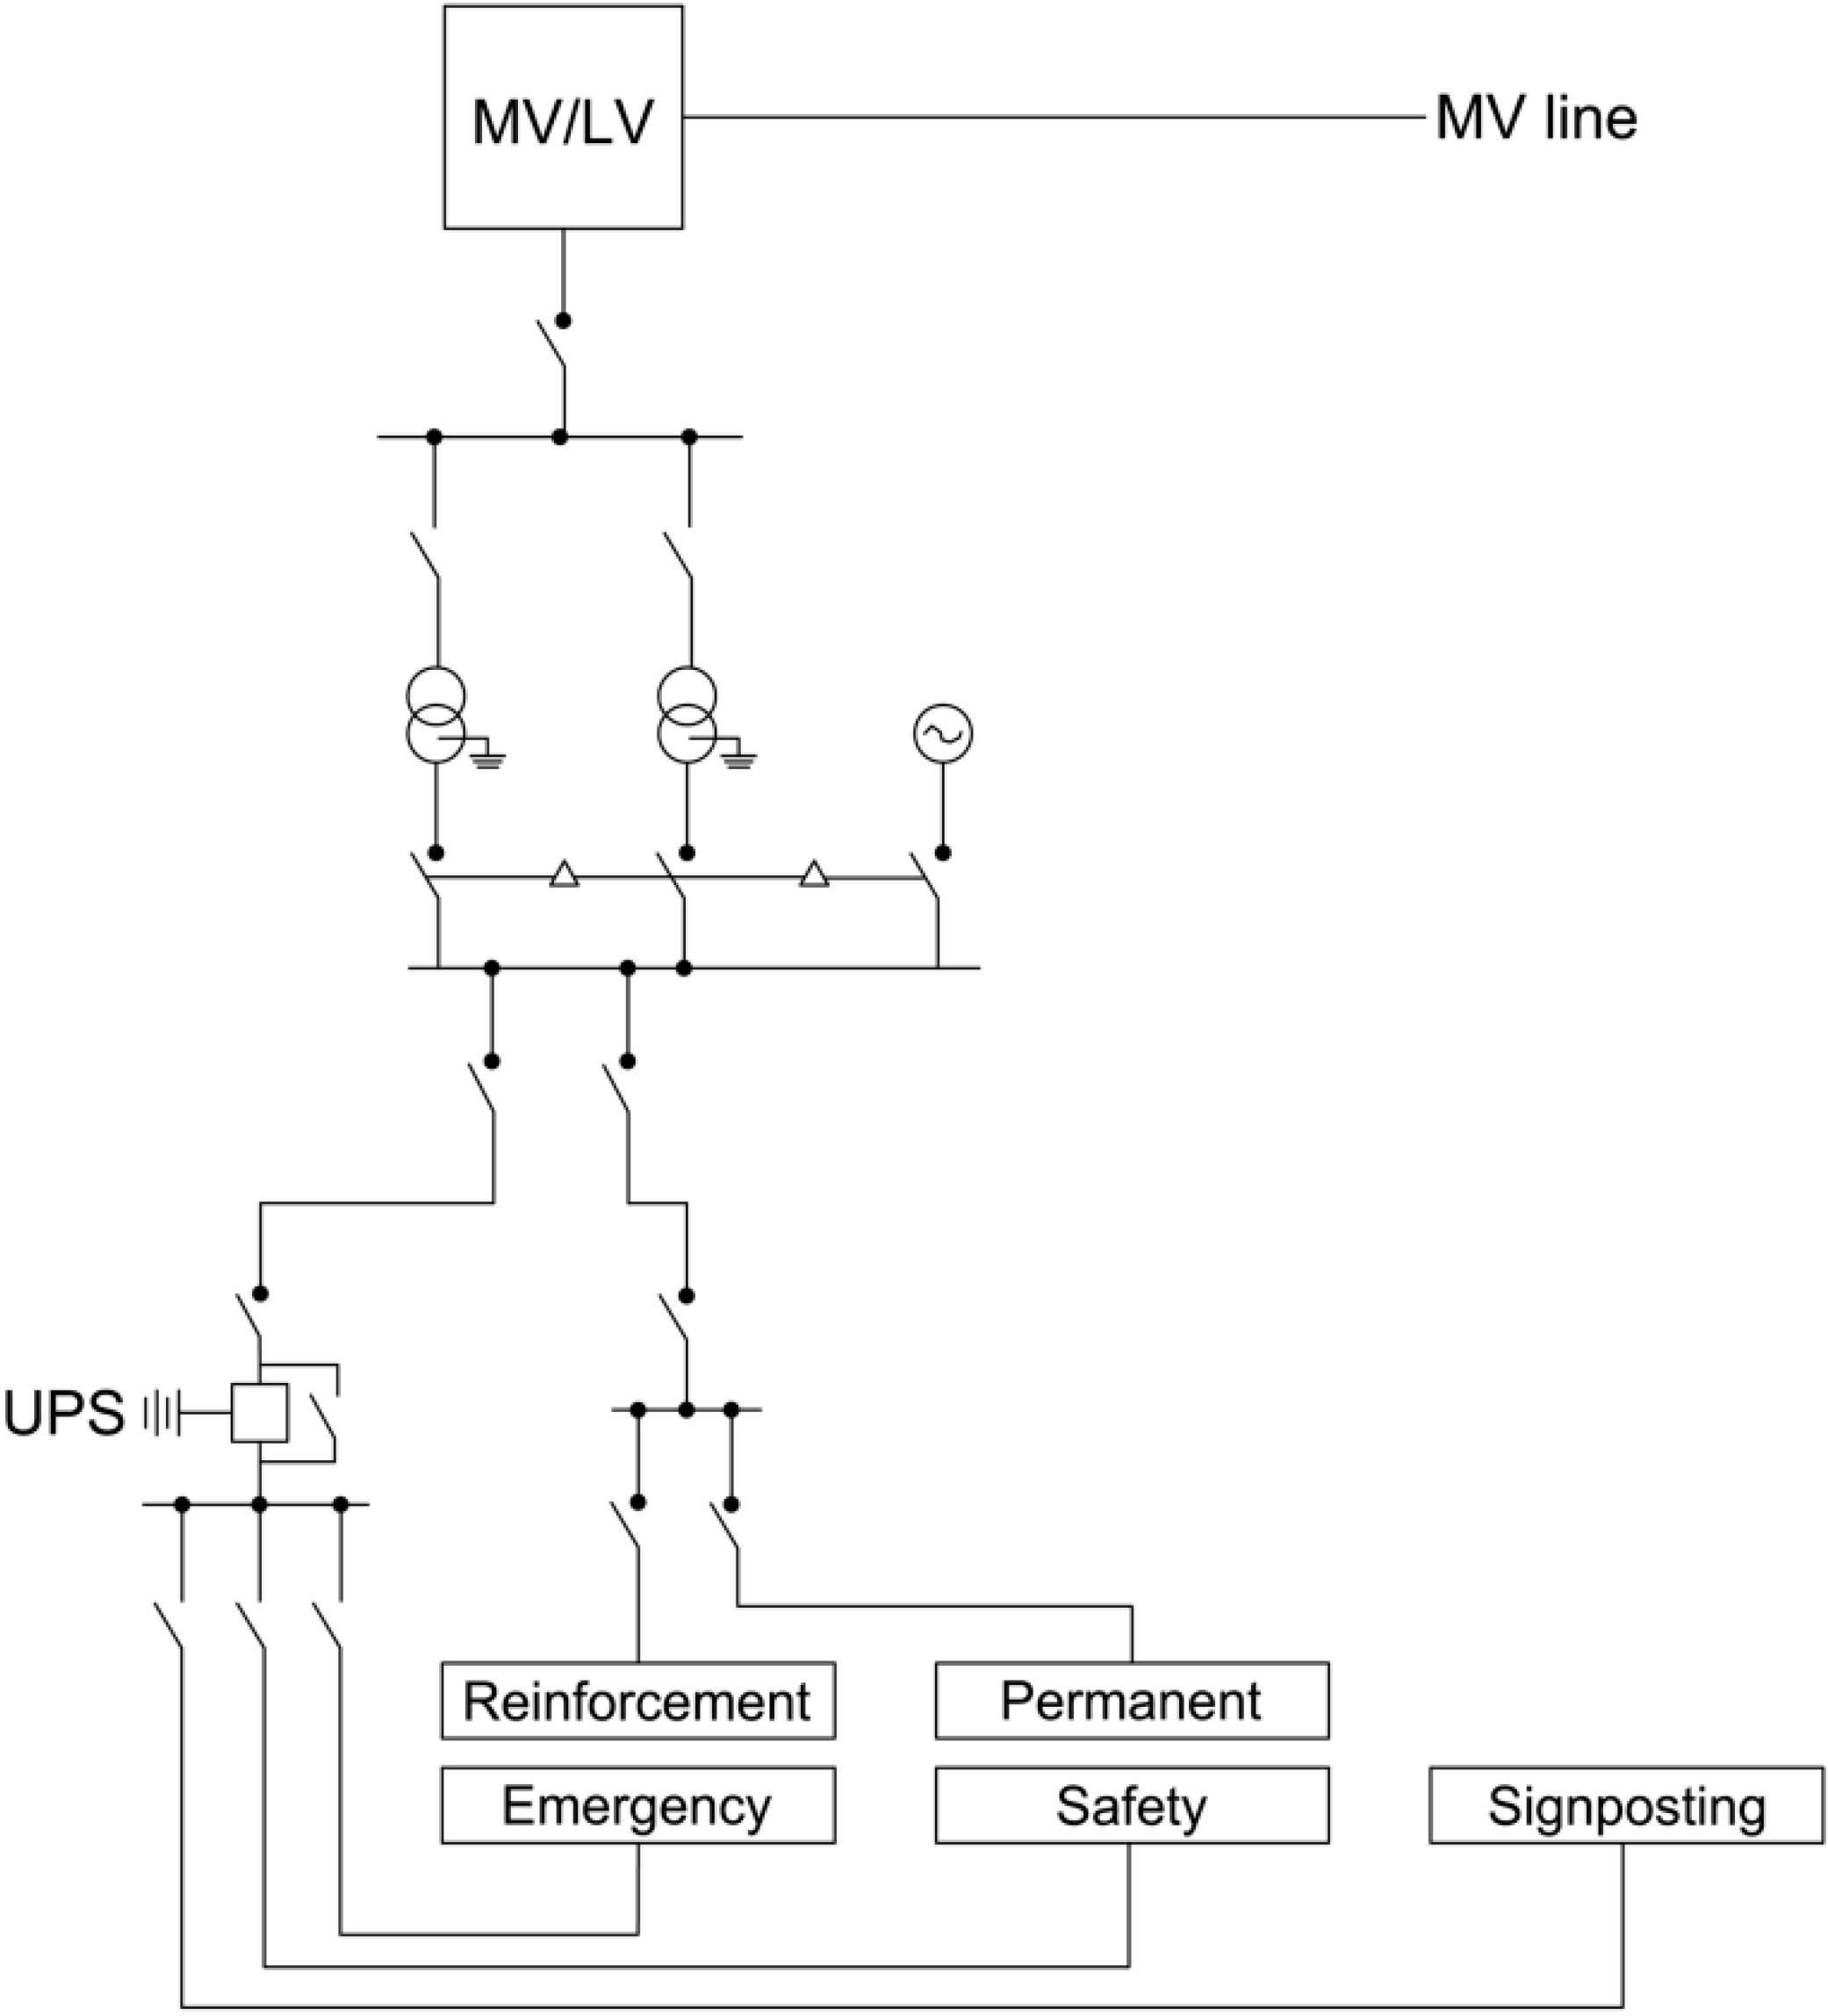
To be sure that lighting systems function in critical situations, due to safety issues in road tunnels, it must be ensured that electric power is present even when ordinary service is absent. It is important to take into consideration devices that guarantee uninterrupted service. The standards require the installation of a UPS system ensuring an autonomy of 30 min and an electrical generator providing the necessary power until the ordinary power supply is back (
Figure 3).
Figure 3.
Basic diagram of the typical power distribution for the elements of road tunnel lighting systems.
Figure 3.
Basic diagram of the typical power distribution for the elements of road tunnel lighting systems.
This case study wants to combine the systems required by the standards with a photovoltaic system for the production of electric energy. The purpose is to examine the possibility of generating a certain amount of energy through a solar source that is able to supply emergency lighting in the daytime and store energy in the UPS batteries pack. This will fulfill, in part, the requirements for nighttime as well (exploiting the presence of the UPS required by the safety standards) and be independent as much as possible from the national grid. Moreover, as was performed in a simulation, there is the possibility of selling electric energy provided by the PV (Photovoltaics) modules (which represent an extra to the requirements of the safety lighting system) to produce a cash flow able to entirely amortize both safety lighting system installation expenses and photovoltaic panels in a time interval of 25 years (that is the service life estimated of the whole technological system).
Photovoltaic system installation costs (based on the monocrystalline silicon modules with a conversion efficiency of 18% characterized by: inverter, equipment set, distribution board, and wiring) are determined by a scale factor;
Table 4 reports the costs according to the power installed [
24].
Table 4.
Systems cost for the PV production.
Table 4.
Systems cost for the PV production.
| Power (kWp) | Cost (€) |
|---|
| P < 5 | 2693.28 |
| 5 < P < 10 | 2207.49 |
| 10 < P < 20 | 1626.14 |
| 20 < P < 50 | 1618.43 |
| 50 < P < 100 | 1549.76 |
| 100 < P < 200 | 1411.15 |
| 200 < P < 500 | 1330.63 |
The UPS chosen is a three-phase modular system with a full load efficiency of 95% formed by 42 batteries, 12 V each, with a capacity of 200 Ah (2.4 kWh), able to supply a maximum of 100 kWh.
This UPS can supply the emergency lighting systems for 60 min if the primary power grid blacks out. A higher power of the UPS used than the one required by the regulations ensures the function of this device as a unit for the storage of electricity produced by the PV, thus the electricity can be sold to the grid when it is advantageous, economically speaking, not only when there is an overproduction. The cost also covering the electronics for the proper connection to the grid is 56,200 € [
23].
Then, it is presented as an electrical generator formed by a diesel generator connected to an electronic voltage regulator able to provide 100 kVA, including a fuel tank and control unit for a right grid connection. The cost is 27,500 € [
23].
3. Economic and Energetic Analysis
The economic and energetic analysis of this case study was carried out through H.O.M.E.R. (Hybrid Optimization of Multiple Energy Resources) Microgrid [
25]. The software can estimate the cash flow generated by the energy systems which, from a technical perspective, are able to fulfill the annual energy requirements of simulated consumption. In the case study, the electric energy necessary to fulfill the requirements of the backup and safety systems of the simulated zone was assumed to be produced by parallel solar PV panels (with net-metering) supplying the national electric grid. For the simulations the following data were implemented in the software.
Safety lighting has an installed power of 1 kW that must be supplied for 24 h per day and 365 days per year: the energy consumption is 8760 kWh/year. This energy requirement must be added to the backup lighting requirements (with an installed power of 55.5 kW). While examining the statistical data of the Italian power grid [
26], the annual blackout period, averaged in the last 10 years, is of 1.47 h. If there is a power outage, it can be estimated that there will be an energy demand of about 81.6 kWh/year to light the inside of the tunnel. Every year, the total amount of electric energy demanded for safety reasons in the tunnel zone examined is 8841.6 kWh/year.
For what concerns the energy cost for non-domestic medium voltage consumption for public lighting, we took national data into consideration [
27,
28,
29]. By adding every item to form the price, the cost of the energy bought by the grid is 11.40 c€/kWh, every hour of the day.
For what concerns the average price for selling the electric energy generated by the photovoltaic system, we took into consideration the simplified purchase and resale arrangements section of the GSE (Gestore Servizi Energetici), and during the second half of 2014 the price corresponded to 5.40 c€/kWh with a minimum price of 3.90 c€/kWh [
30]. For an estimation of the photovoltaic production, some irradiation data were taken into consideration for the area right in the middle of Italy, and it was assumed that panels would be installed with an inclination of the azimuthal angle, with respect to the North-South axis, of 0° (southward orientation) and a tilt angle (with respect to the horizontal plane) of 30°.
The ordinary maintenance of each system, for the proper functioning of the devices, in order to avoid accidental and unexpected damages, presents a hourly cost of 25.6 €/h [
31] for an assumed annual number of 200 h. Since breakdown maintenance (UPS and PV panels are static devices without moving components, hence they present high values for what concerns their reliability parameters as the MTBF (Mean Time Between Failures) and availability rates [
32]) is not part of the ordinary maintenance of the systems, for our hypothesis, it was not computed.
The main goal of this analysis was the evaluation of the sufficient number of PV panels able to guarantee both the generation of electric energy required by the safety lighting systems and the production of cash flow for the amortization of the safety lighting systems in 25 years. Moreover, a further examination was the annual interest rate (that is the one generated by inflationary effects) and how it can affect the amortization of the system. Hence, we estimated the maximum annual interest rate able to make the investment amortizable in a time interval of 25 years together with an examination of how the more the annual interest rate decreases, the more the time interval will diminish. We decided to end this study with an analysis of which area on the earth is occupied by the PV system necessary for the afore mentioned objective.
4. Discussions
During the analysis we noticed that the additional costs, in conformity with the standards concerning the safety systems in road tunnels, can be amortized during the service life of the systems (assumed to be of 25 years), thus generating a cash flow thanks to the energy produced by a solar source. This study shows that in order to reach such a goal, if we take into consideration a sample of 300 m of a road tunnel inner zone characterized by outward-leading pedestrian emergency exits, it is necessary to have a 235 kW
p PV system.
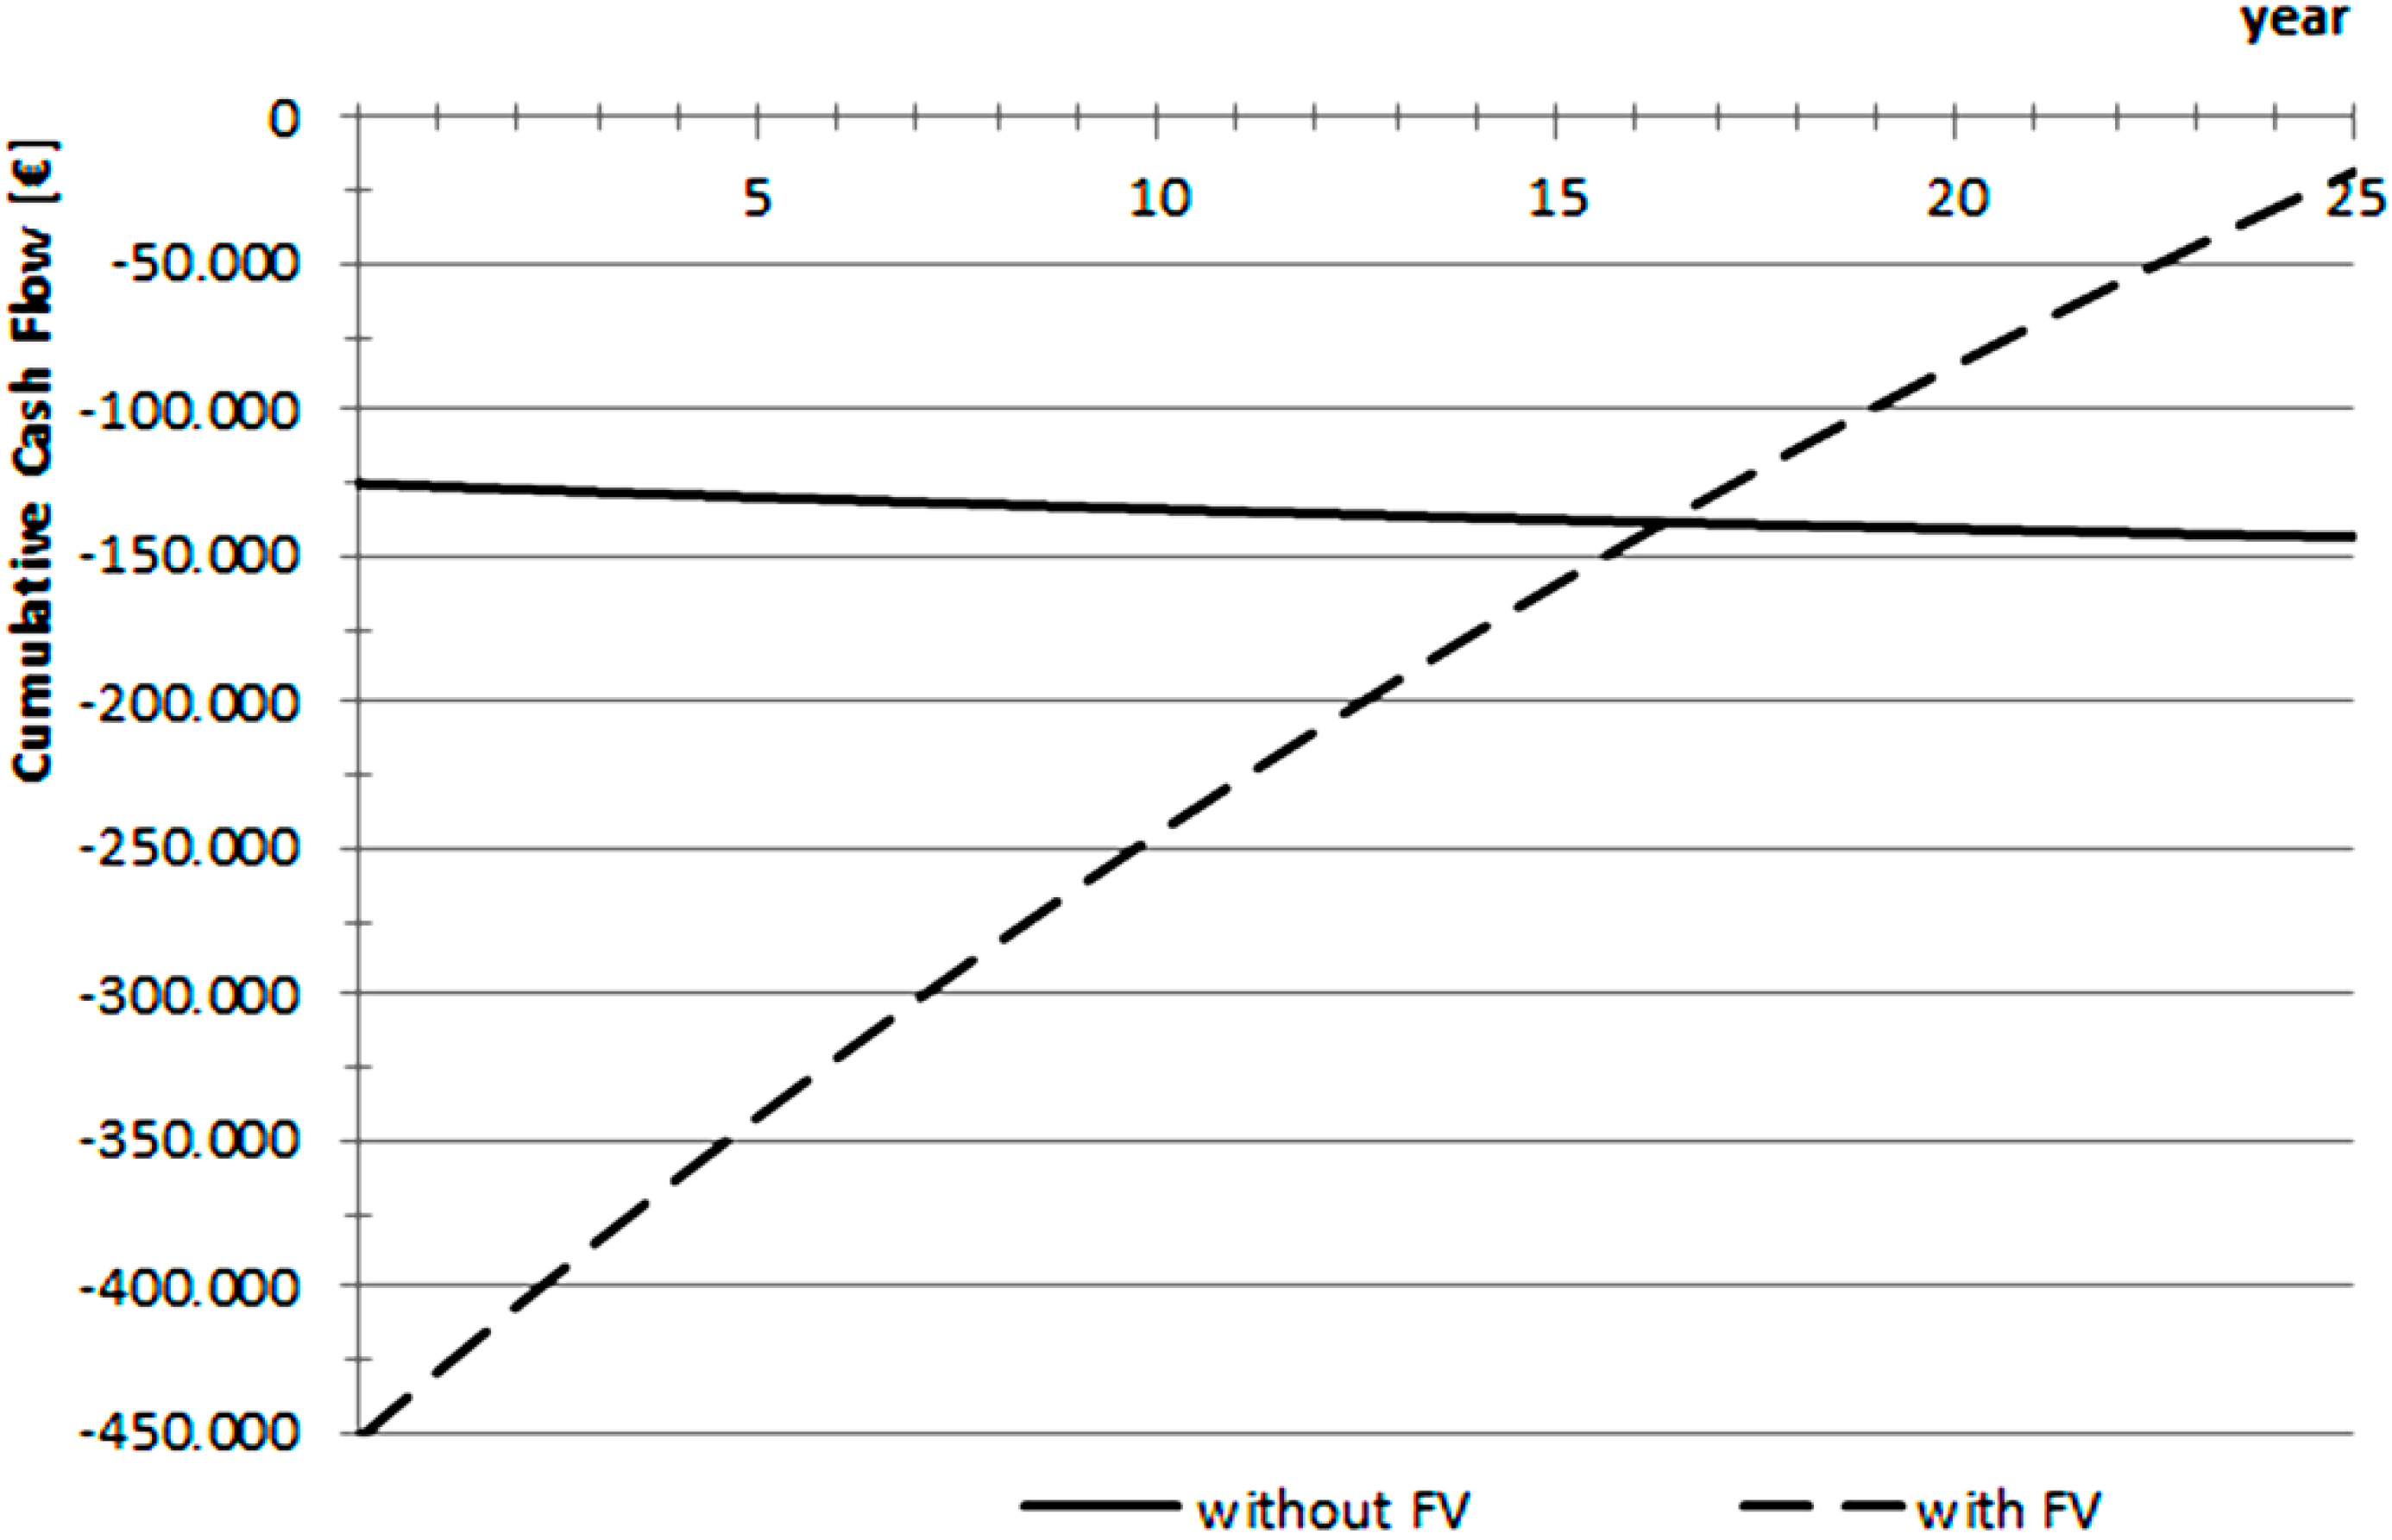
Figure 4 reports how the system with PV devices, even if at first it requires higher investments, ensures amortization (dotted line) during the service life of the systems, unlike the system without PV devices, which has initial costs (required by the standards in order to observe the safety precepts) that increase during this time due to annual energy costs that will be added to the installation expenses (continuous line).
Figure 4.
Amortization of energy and installation costs of safety systems.
Figure 4.
Amortization of energy and installation costs of safety systems.
Figure 4 shows the trends concerning a real annual interest rate of 2.58%. It represents the maximum value ensuring the amortization during the time interval examined. If this value exceeds the amortization during the assumed service life, this will not be possible.
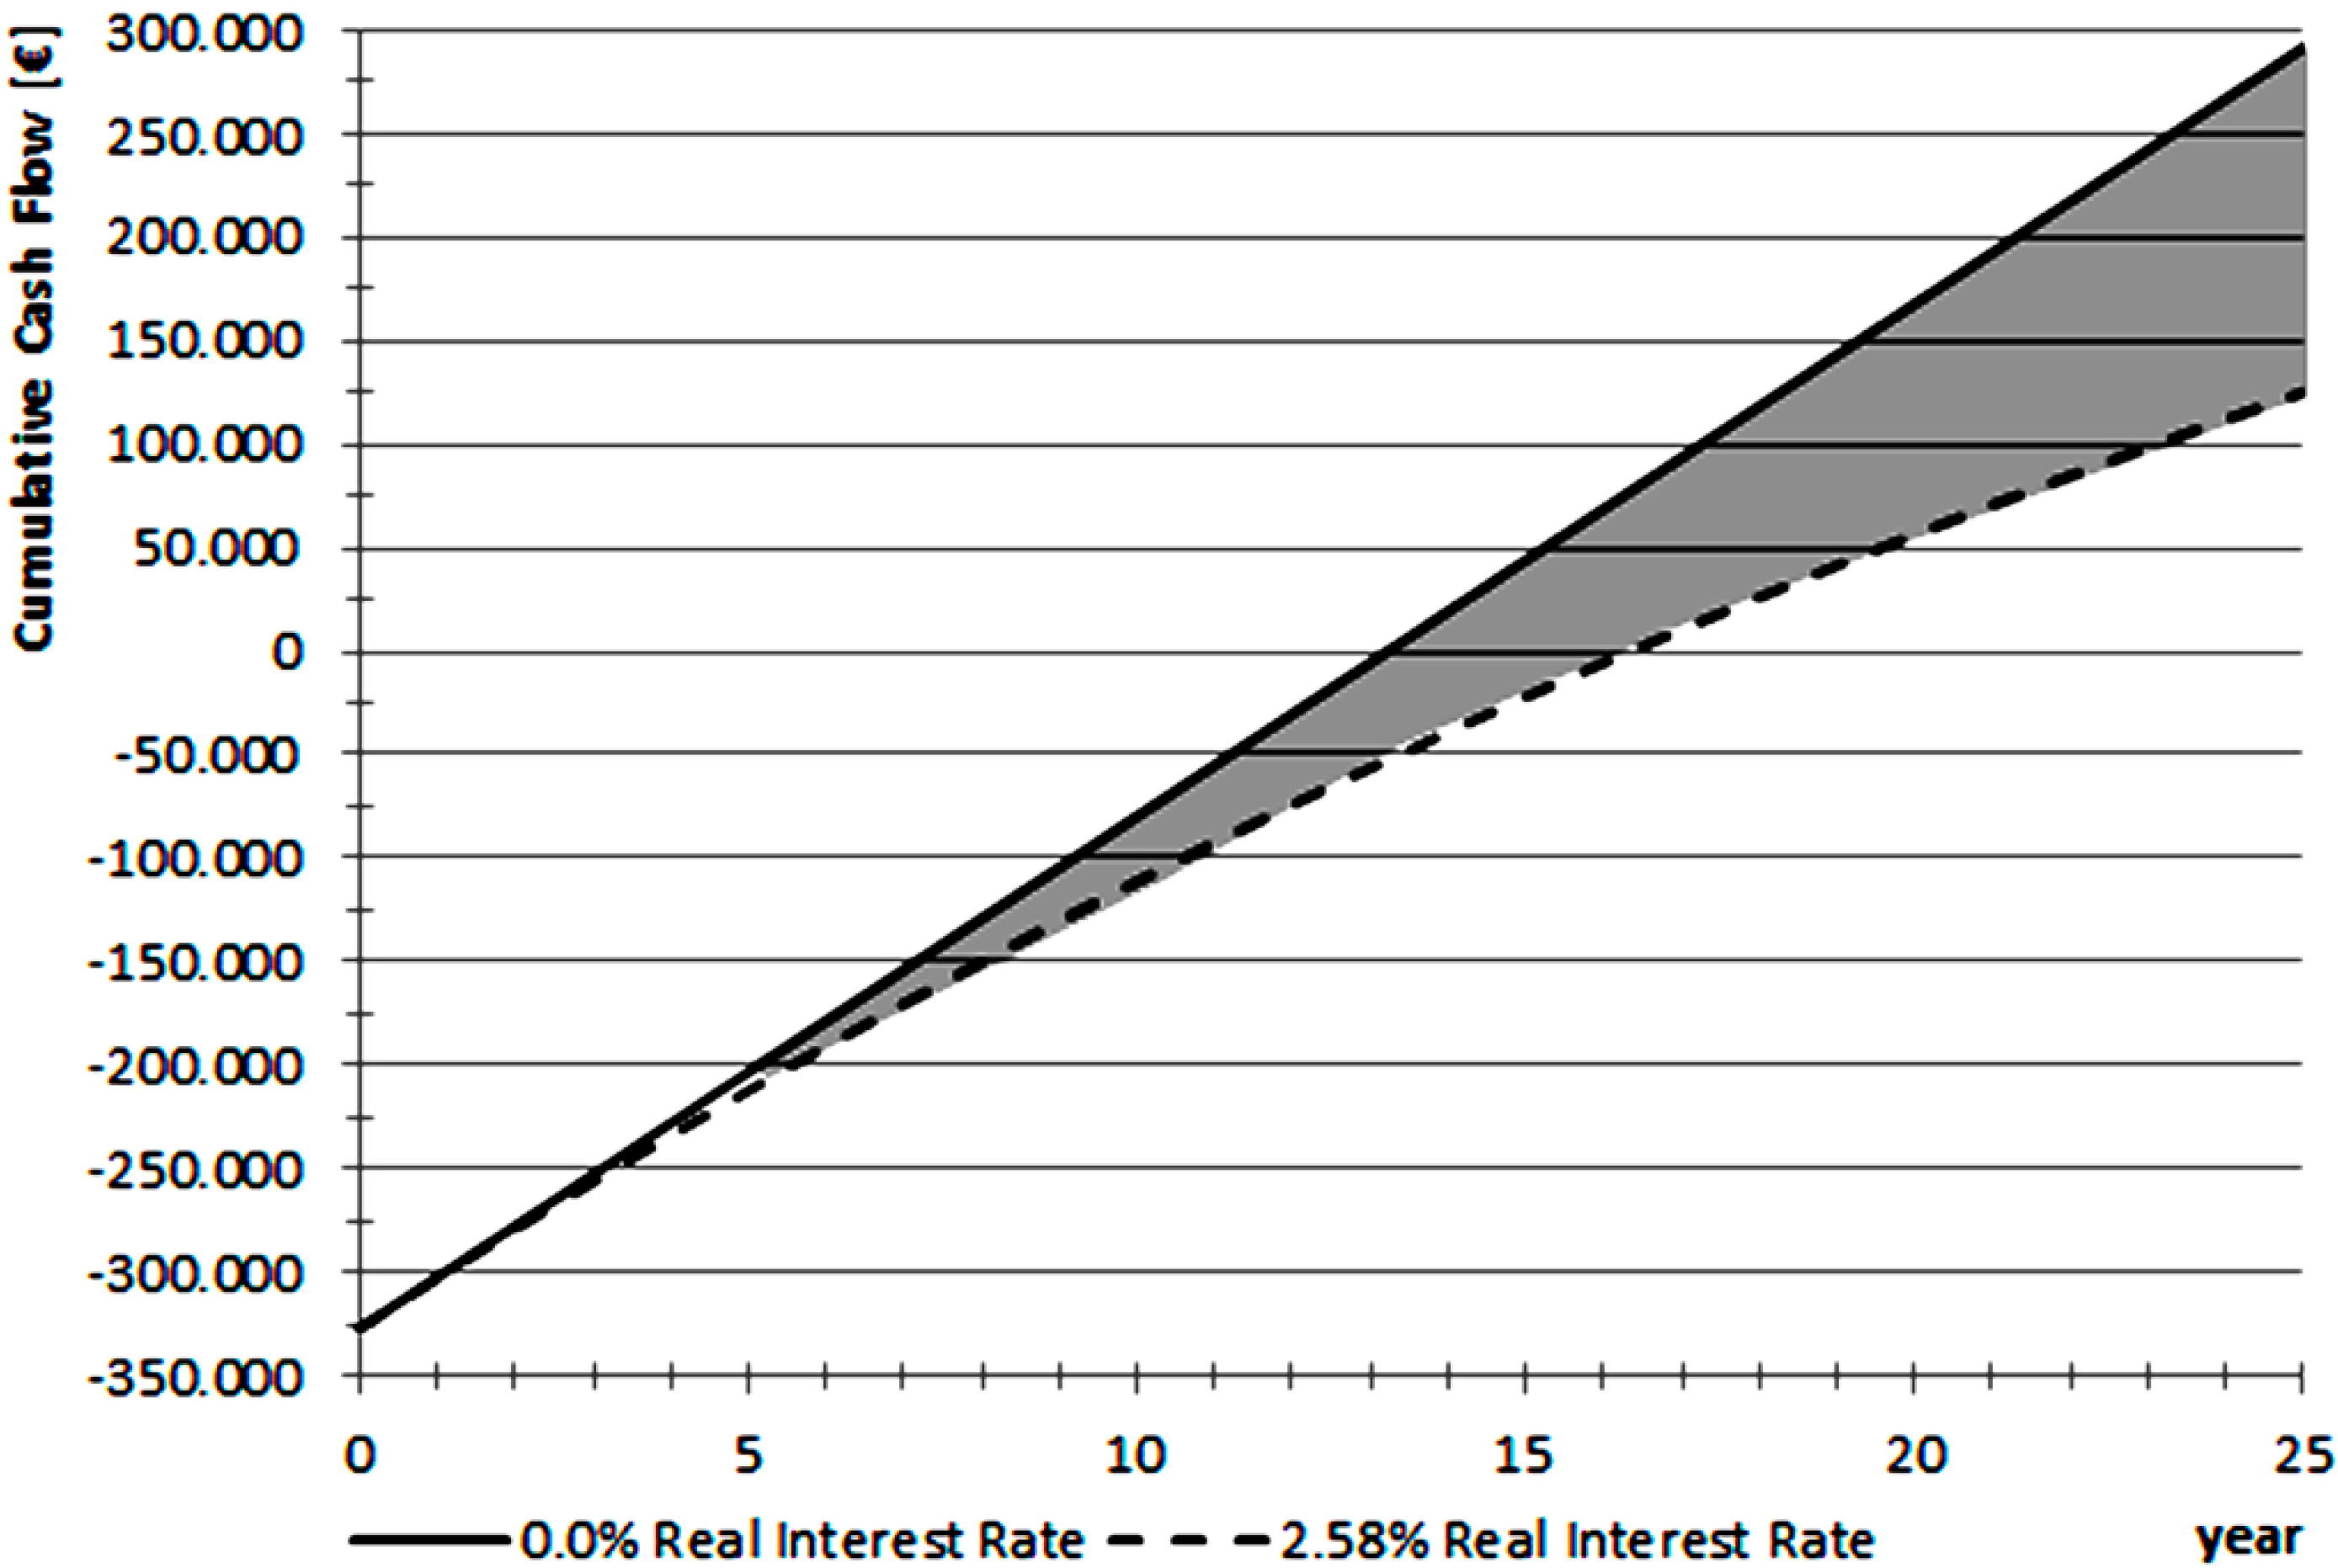
Figure 5 shows the difference of cumulative cash flow if the system presents a real interest rate of 2.58% (dotted line) together with the hypothesis that the same rate can decrease until reaching a null value (continuous line). At the beginning, such a difference is equal to the investment costs of the PV system. At the end of the amortization period, the dotted line reaches the value representing the safety system cost without considering the PV system. It can be noticed how diminishing the real annual interest rate, from the maximum (2.58%) to a hypothetic null value, make it possible to generate a cash flow that increases. Moreover, the time interval (16.3 years) during which this difference is zero (the costs of the system with and without PV devices is the same) decreases until 13.2 years, when the maximum real interest rate is taken into consideration, if a negotiation of a real null interest rate is possible.
From now on, the additional cost, due to the PV system, is paid back and the expenses for the safety lighting system will be amortized.
Figure 5.
How the real annual interest rate affects the amortization of installation and energy costs of safety systems.
Figure 5.
How the real annual interest rate affects the amortization of installation and energy costs of safety systems.
Using 235 W
p PV panels, each with a width × height of 1.675 m × 1.011 m, the number required is 1000 panels. Supposing the installation is done by 10 parallel rows, each with 100 panels, the distance between every one of them (to avoid a mutual shadow projection that would affect the functioning of the system) requires a s/h ratio of at least 1.6, where s is the minimum distance between the panel rows and h is the product of the panel height multiplied by the sine of the tilt angle. The installation described here occupies an area of 4170 m
2. All this, in the case of places suitable for the installation of PV panels near the tunnels, is for the possibility to connect them to the national grid and then sell the electricity produced to the main grid [
33,
34,
35,
36].
5. Conclusions
Road tunnels require high security standards and, if dangerous situations occur, the plant design is vital for the safety of the people present. In particular, the lighting system is needed to avoid situations where people panic and it must guarantee that the passengers coming out from the tunnel, through emergency exits, can properly reach the safety zones. In the past few years there has been the tendency to plan double-arched unidirectional road tunnels because they are considered safer.
These tunnels must present, at regular intervals, safety exits that can be reached by a safety pedestrian cross-passage connected to both tunnels. The entire way, a pedestrian in flight must walk to reach the exit zone, and it must be properly lighted and the lighting must be ensured even if a power outage of the primary power grid occurs [
37,
38]. In such circumstances the most important thing is ensuring backup lighting both for the lamps in the tunnel and the safety lighting (safety lay-bys, emergency exits beside the highway, the safety pedestrian cross-passage, and the safety passage). The current regulations require the installation of a UPS system with an autonomy of at least 30 min and electrical generator systems guaranteeing an extension of supplied electricity once the UPS batteries are exhausted. Every expense determined by the presence of the safety lighting that the managers of the road infrastructure must observe represents a cost which cannot be amortized during this time. This paper examines the possibility, thanks to a PV system generating electric energy from a solar source, of making installation expenses and their annual energy consumption amortizable in a time interval of 25 years (equal to the service life of the safety systems).
The starting point of the case study was a tunnel zone of 300 m, characterized in the middle by an emergency exit (with a pedestrian cross-passage and a safety passage), followed by a plan of every lighting system in conformity with the regulations, performed through the Dialux software.
We made an estimation of installation and annual energy costs. Moreover, we took into consideration the expenses for the realization of the system meant to ensure uninterrupted service, even in case of a power outage of the primary power grid. The result is that, thanks to the presence of a 235 kWp PV system (with the typical solar radiation characterizing the latitudes of the center of Italy), it is possible to produce a cash flow that is able to amortize, at the end of the assumed 25 years, every expense for the safety lighting systems. In particular, with a maximum real interest rate (that is the inflation-adjusted return) of 2.58%, after 16.3 years the additional costs determined by the PV system are amortized and, once this time interval is over, the costs of the security lighting systems will be paid back. If the interest rate exceeds these values it is impossible to carry out such a plan. If the interest rate presents lower values, then the time interval during which the expenses are amortized diminishes and, if the rate is equal to zero, it could take 13.2 years for the amortization of the PV system and 19 years for the amortization of every system.
For the installation of the PV system (assuming a southward orientation, an azimuthal angle of 0°, a tilt angle of 30° with respect to the horizontal plane, a conversion efficiency of 18%, and each row characterized by 100 panels for a total of 10 rows), it is fundamental to have at access to a ground surface of 4000 m2.


 ,
, 


