
Space-Time Characteristics of Vegetation Cover and Distribution: Case of the Henan Province in China


Abstract
:1. Introduction
2. Methods and Data
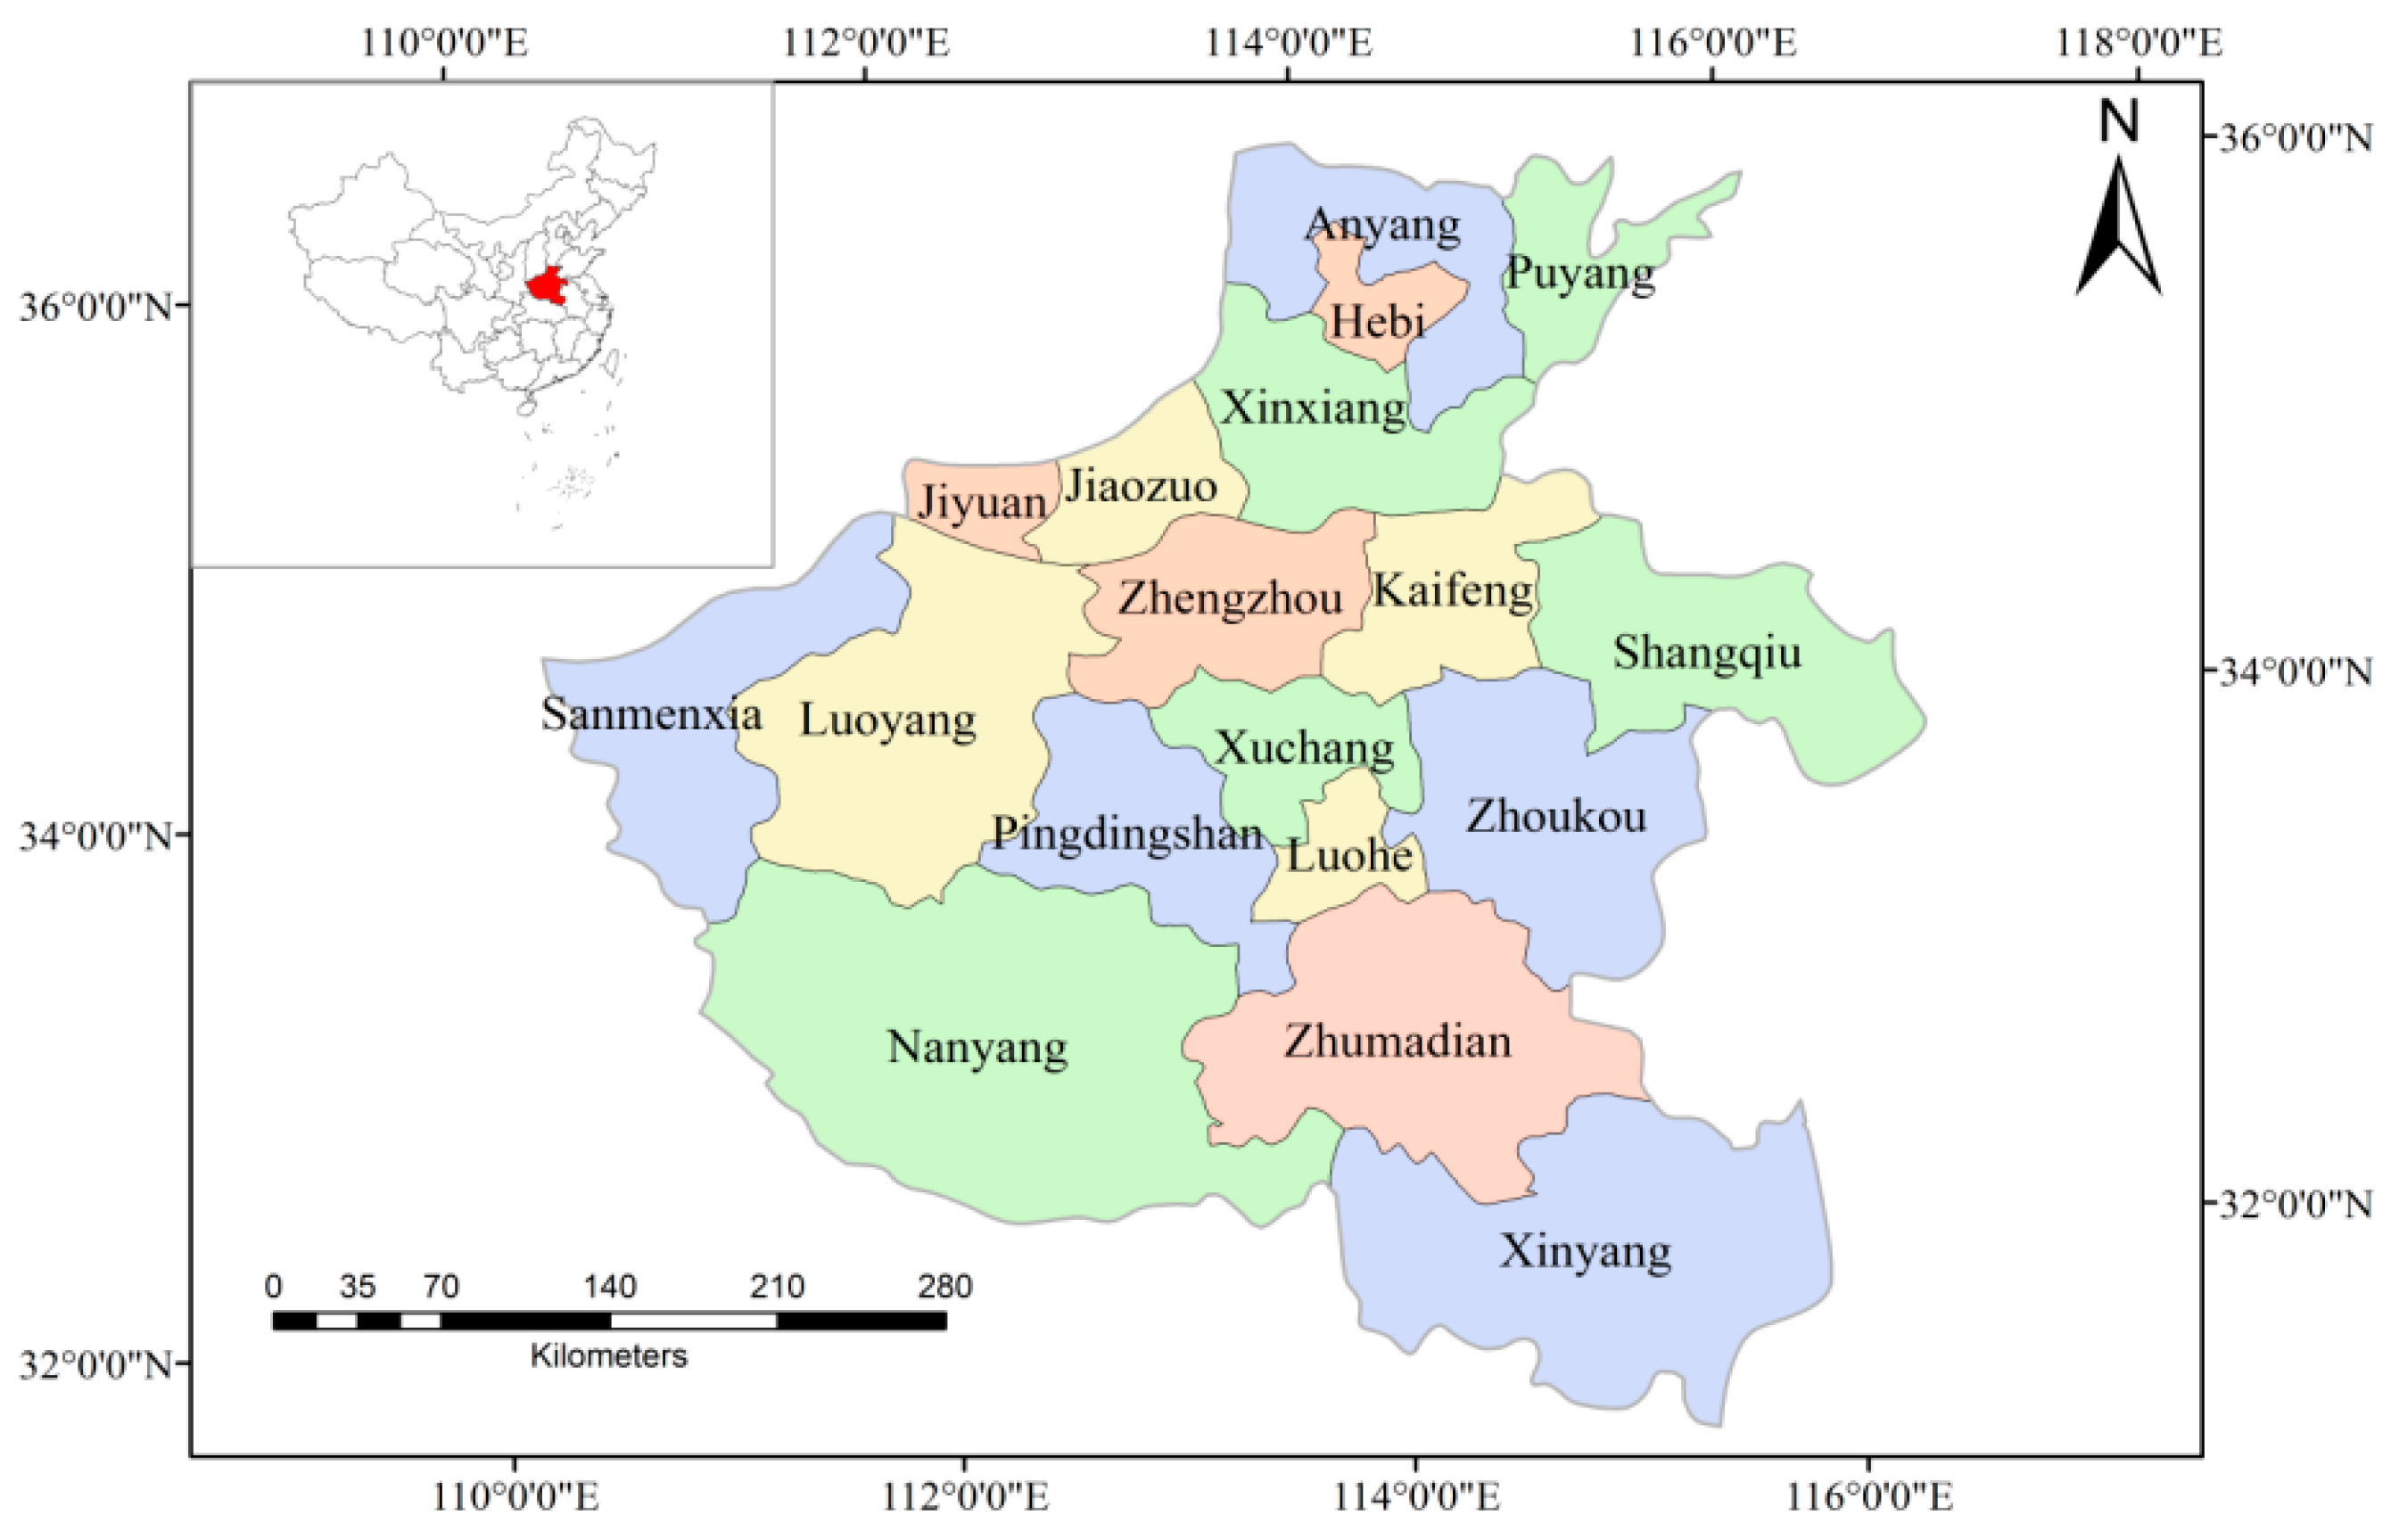
2.1. Study Area

2.2. Data Sources and Pre-Processing
2.3. Extraction of Vegetation Coverage
2.4. Grade Classification of Vegetation Coverage

| Vegetation Fractional Coverage/(%) | VFC < 20 | 20 ≤ VFC < 40 | 40 ≤ VFC < 60 | 60 ≤ VFC < 80 | 80 ≤ VFC |
|---|---|---|---|---|---|
| Grades | Extremely low | Low | Medium | Upper medium | High |
3. Results and Discussion
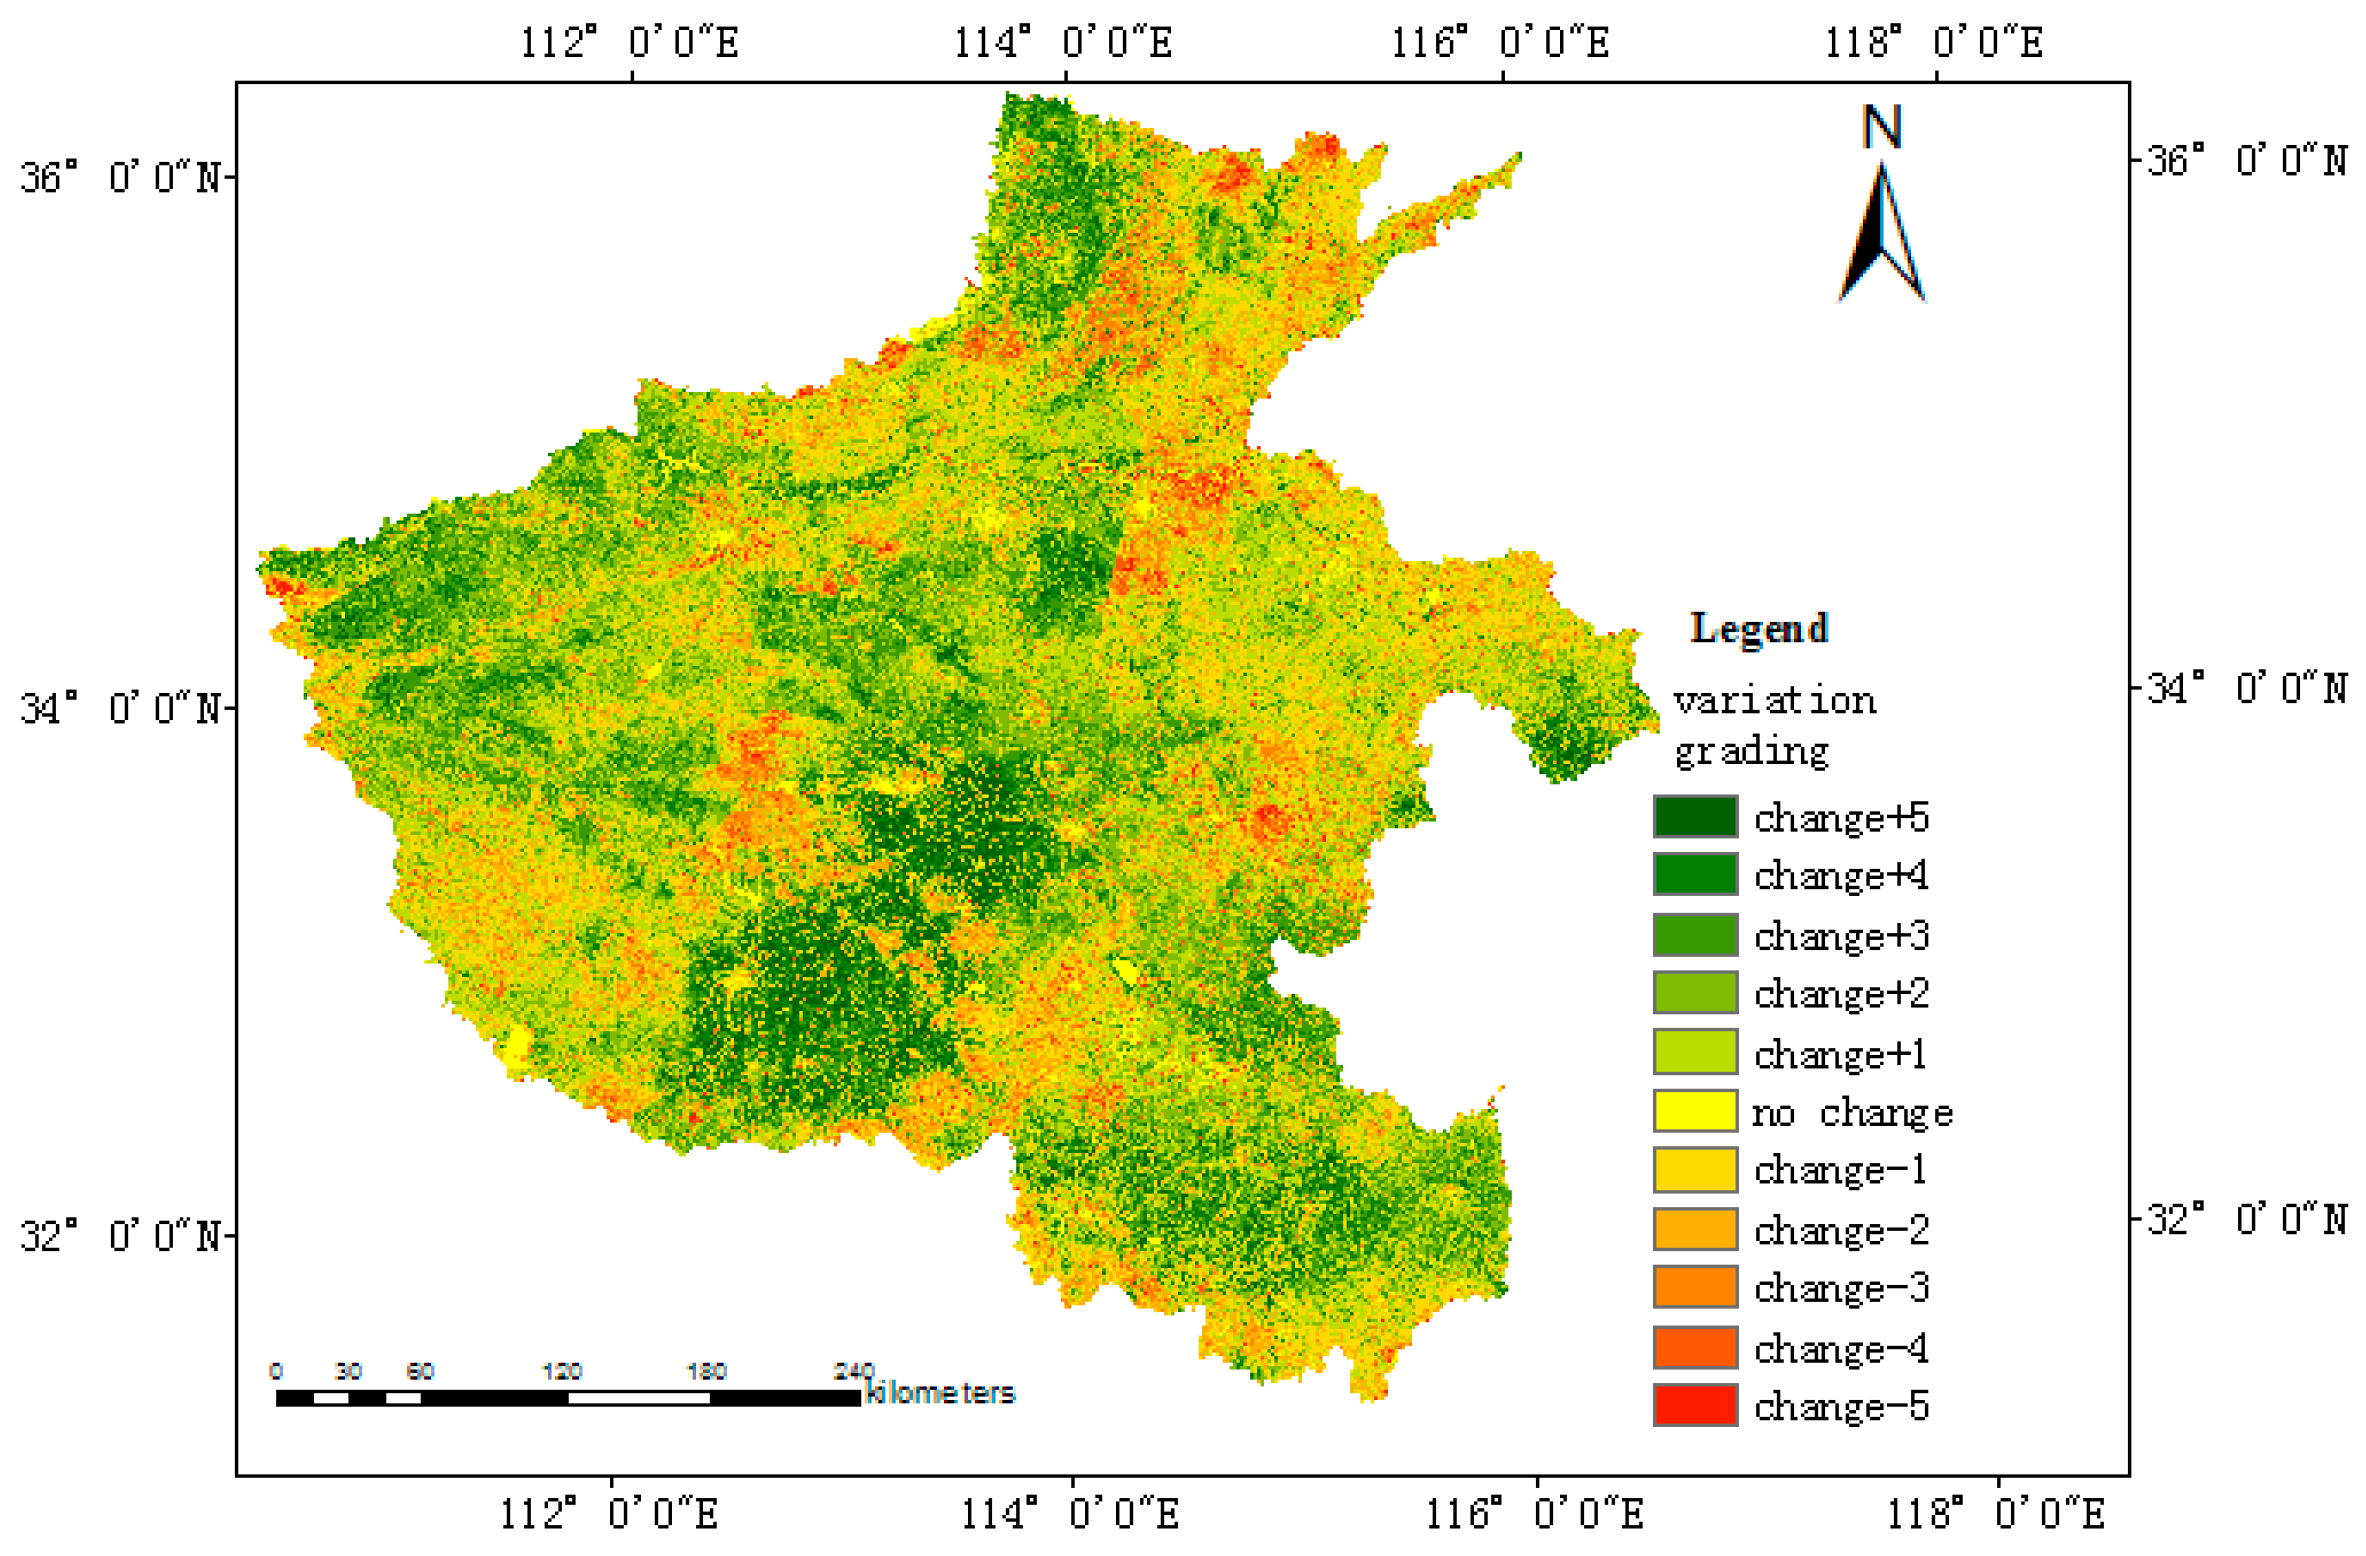
3.1. Inter-Annual Variation of Vegetation Coverage


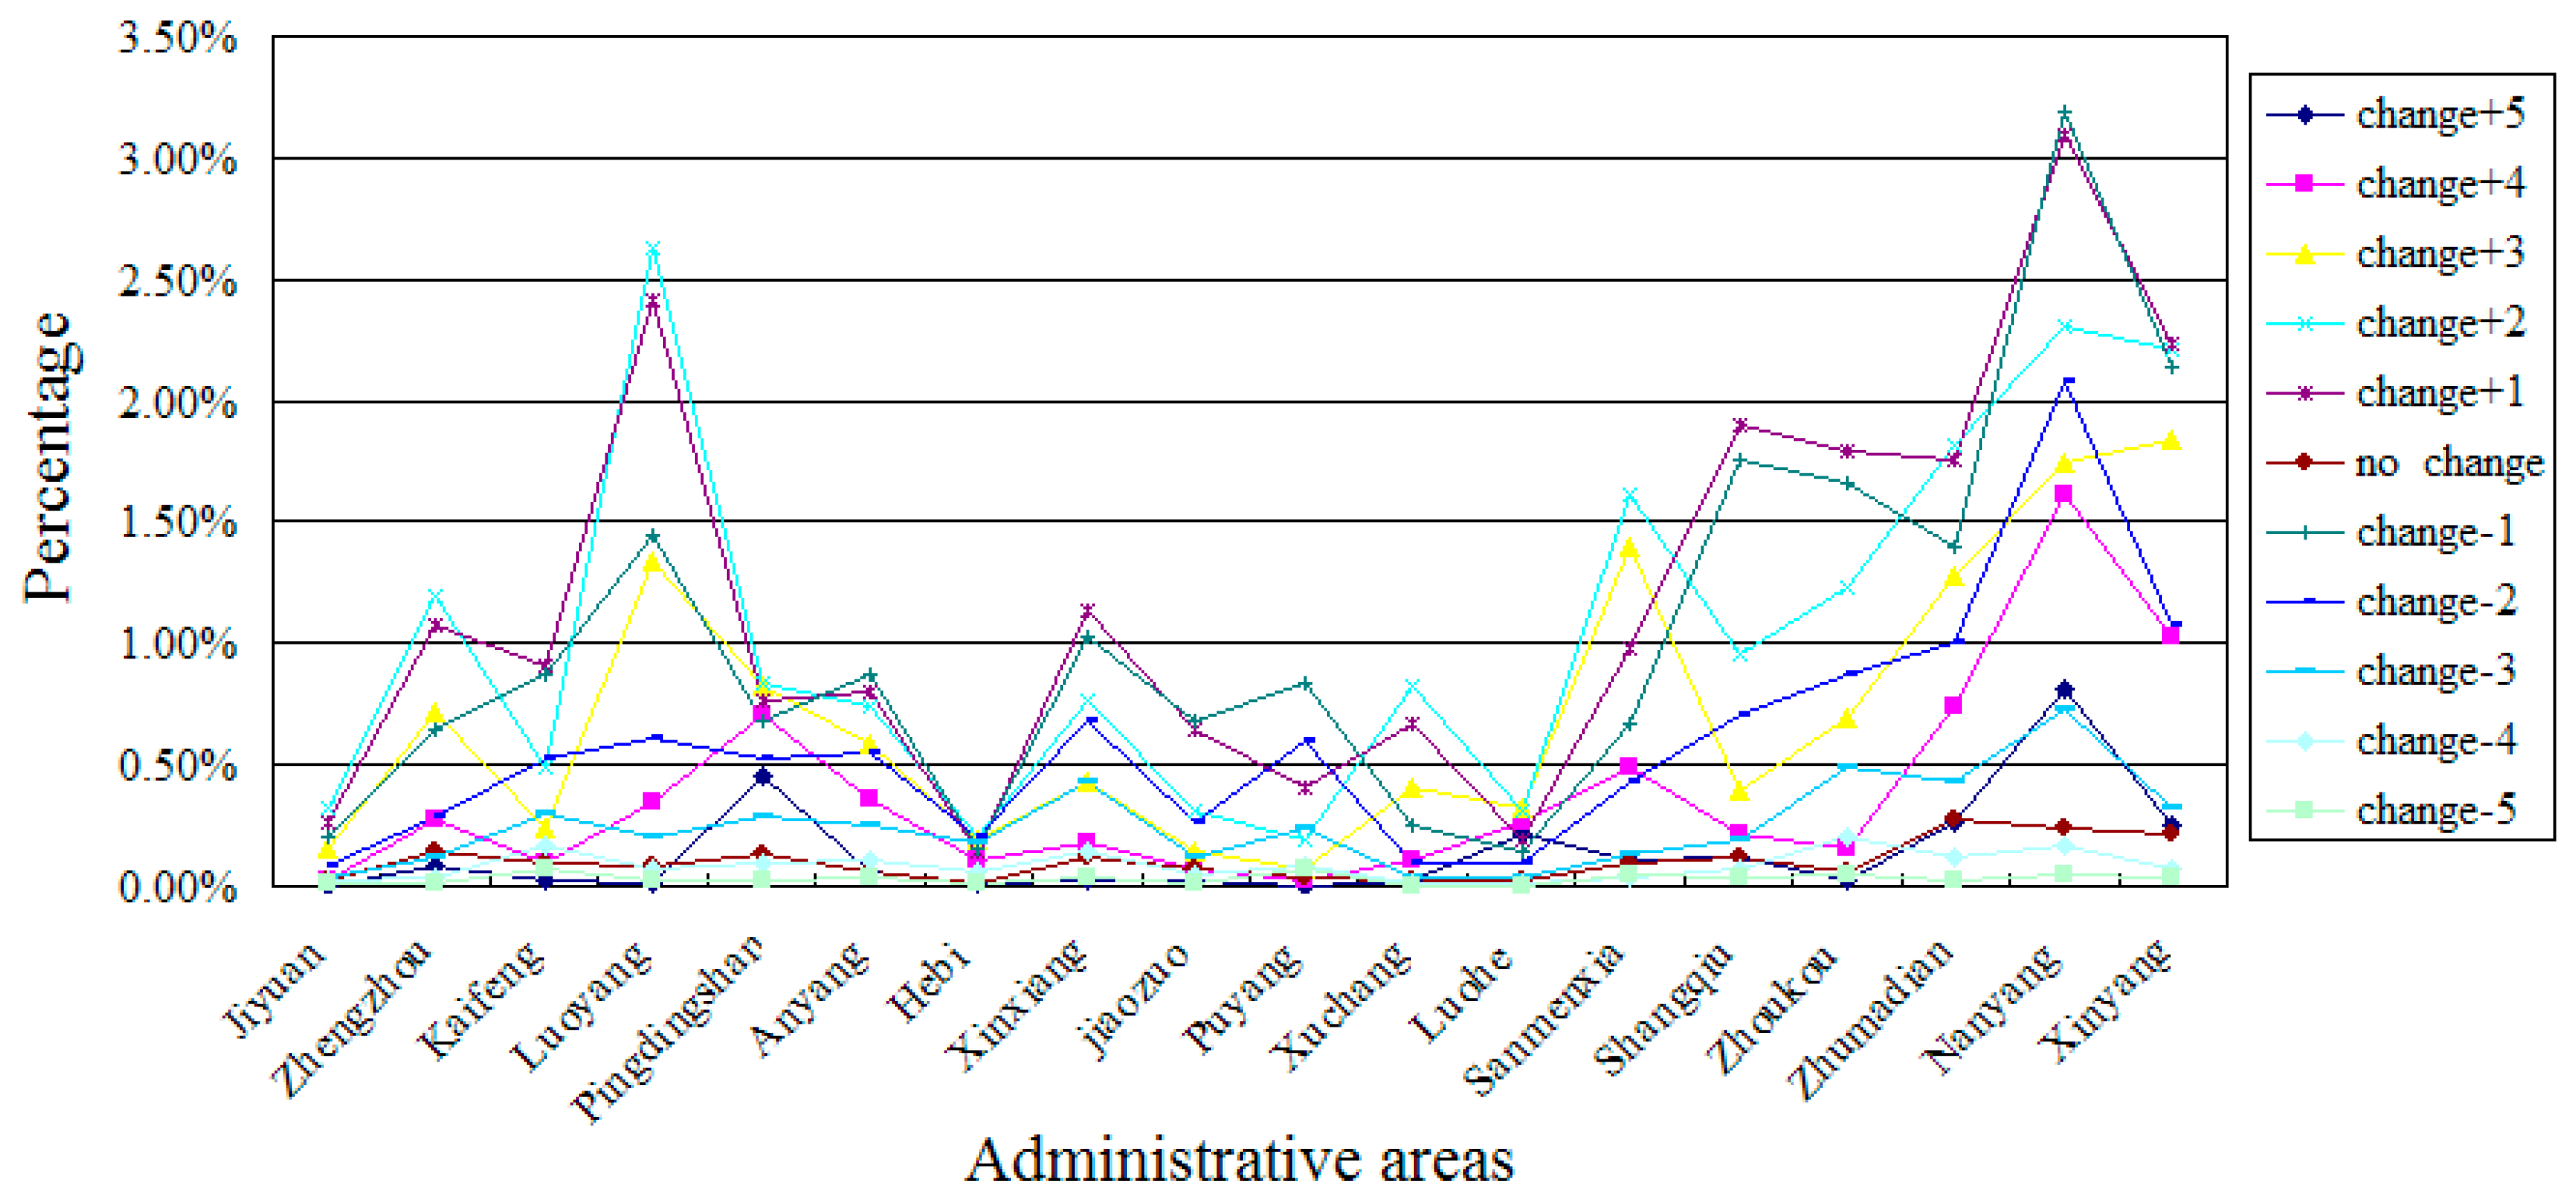
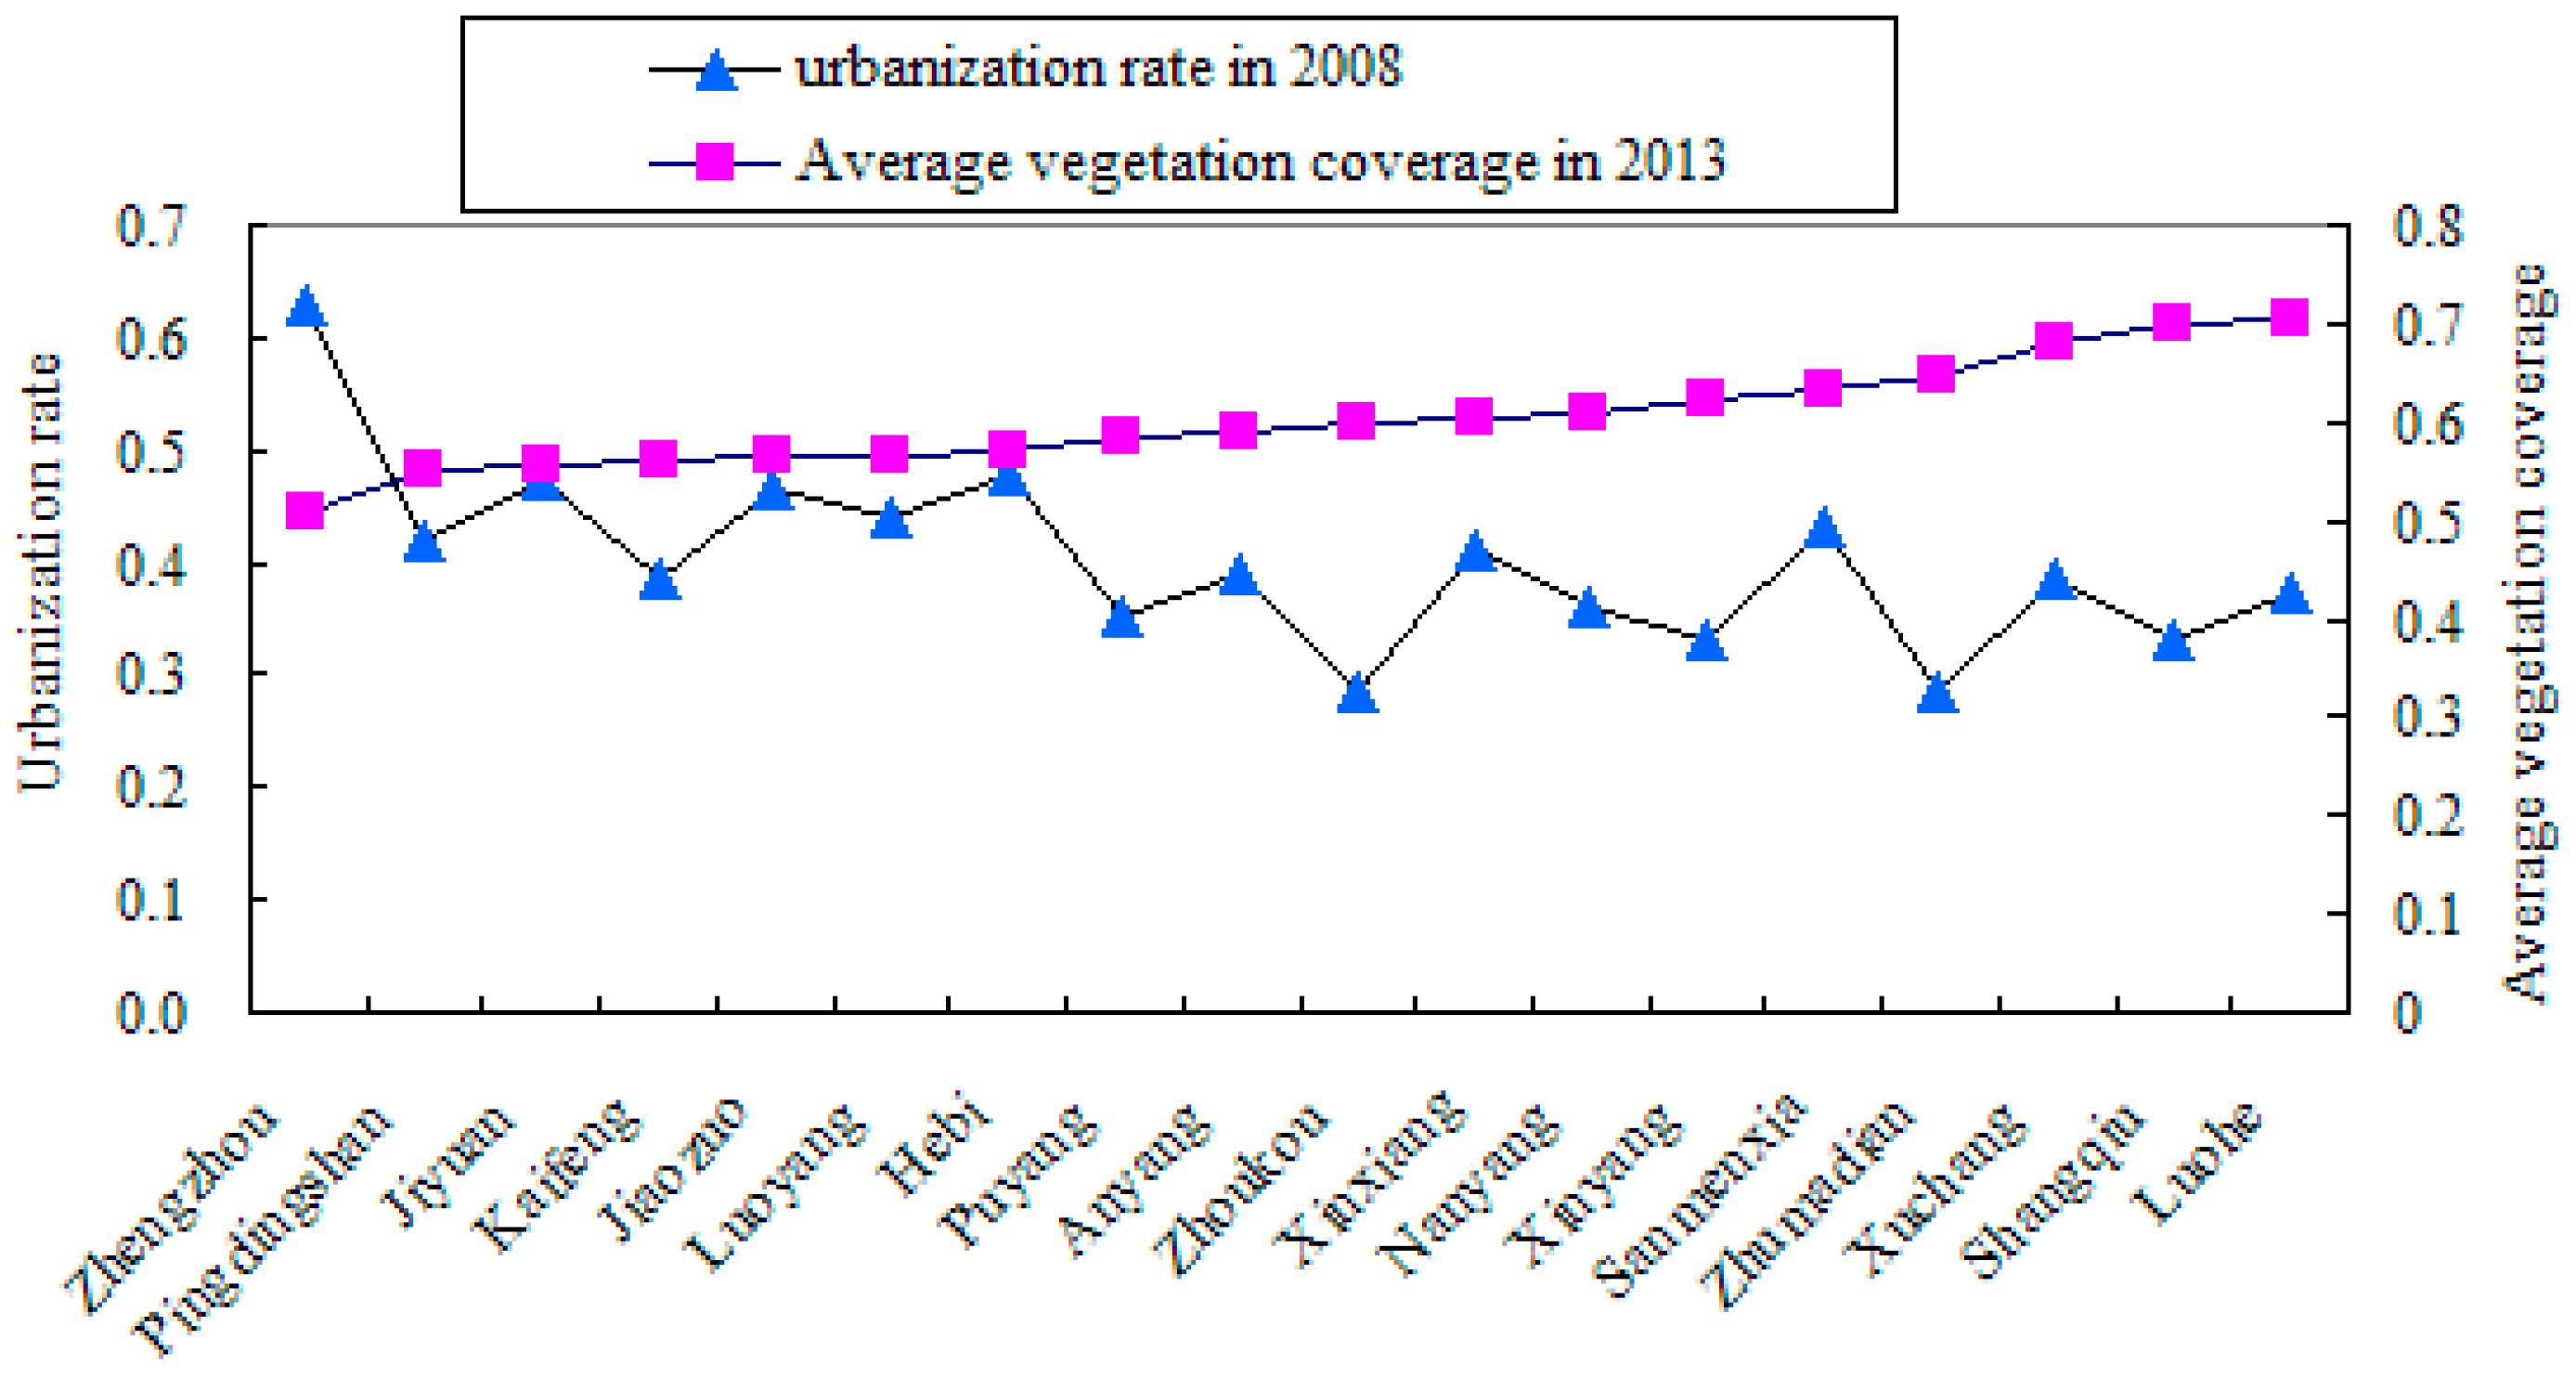
3.2. Spatial Variations of Vegetation Coverage in Different Cities in Henan Province

3.3. Vegetation Coverage Variations Caused by Terrain Factors
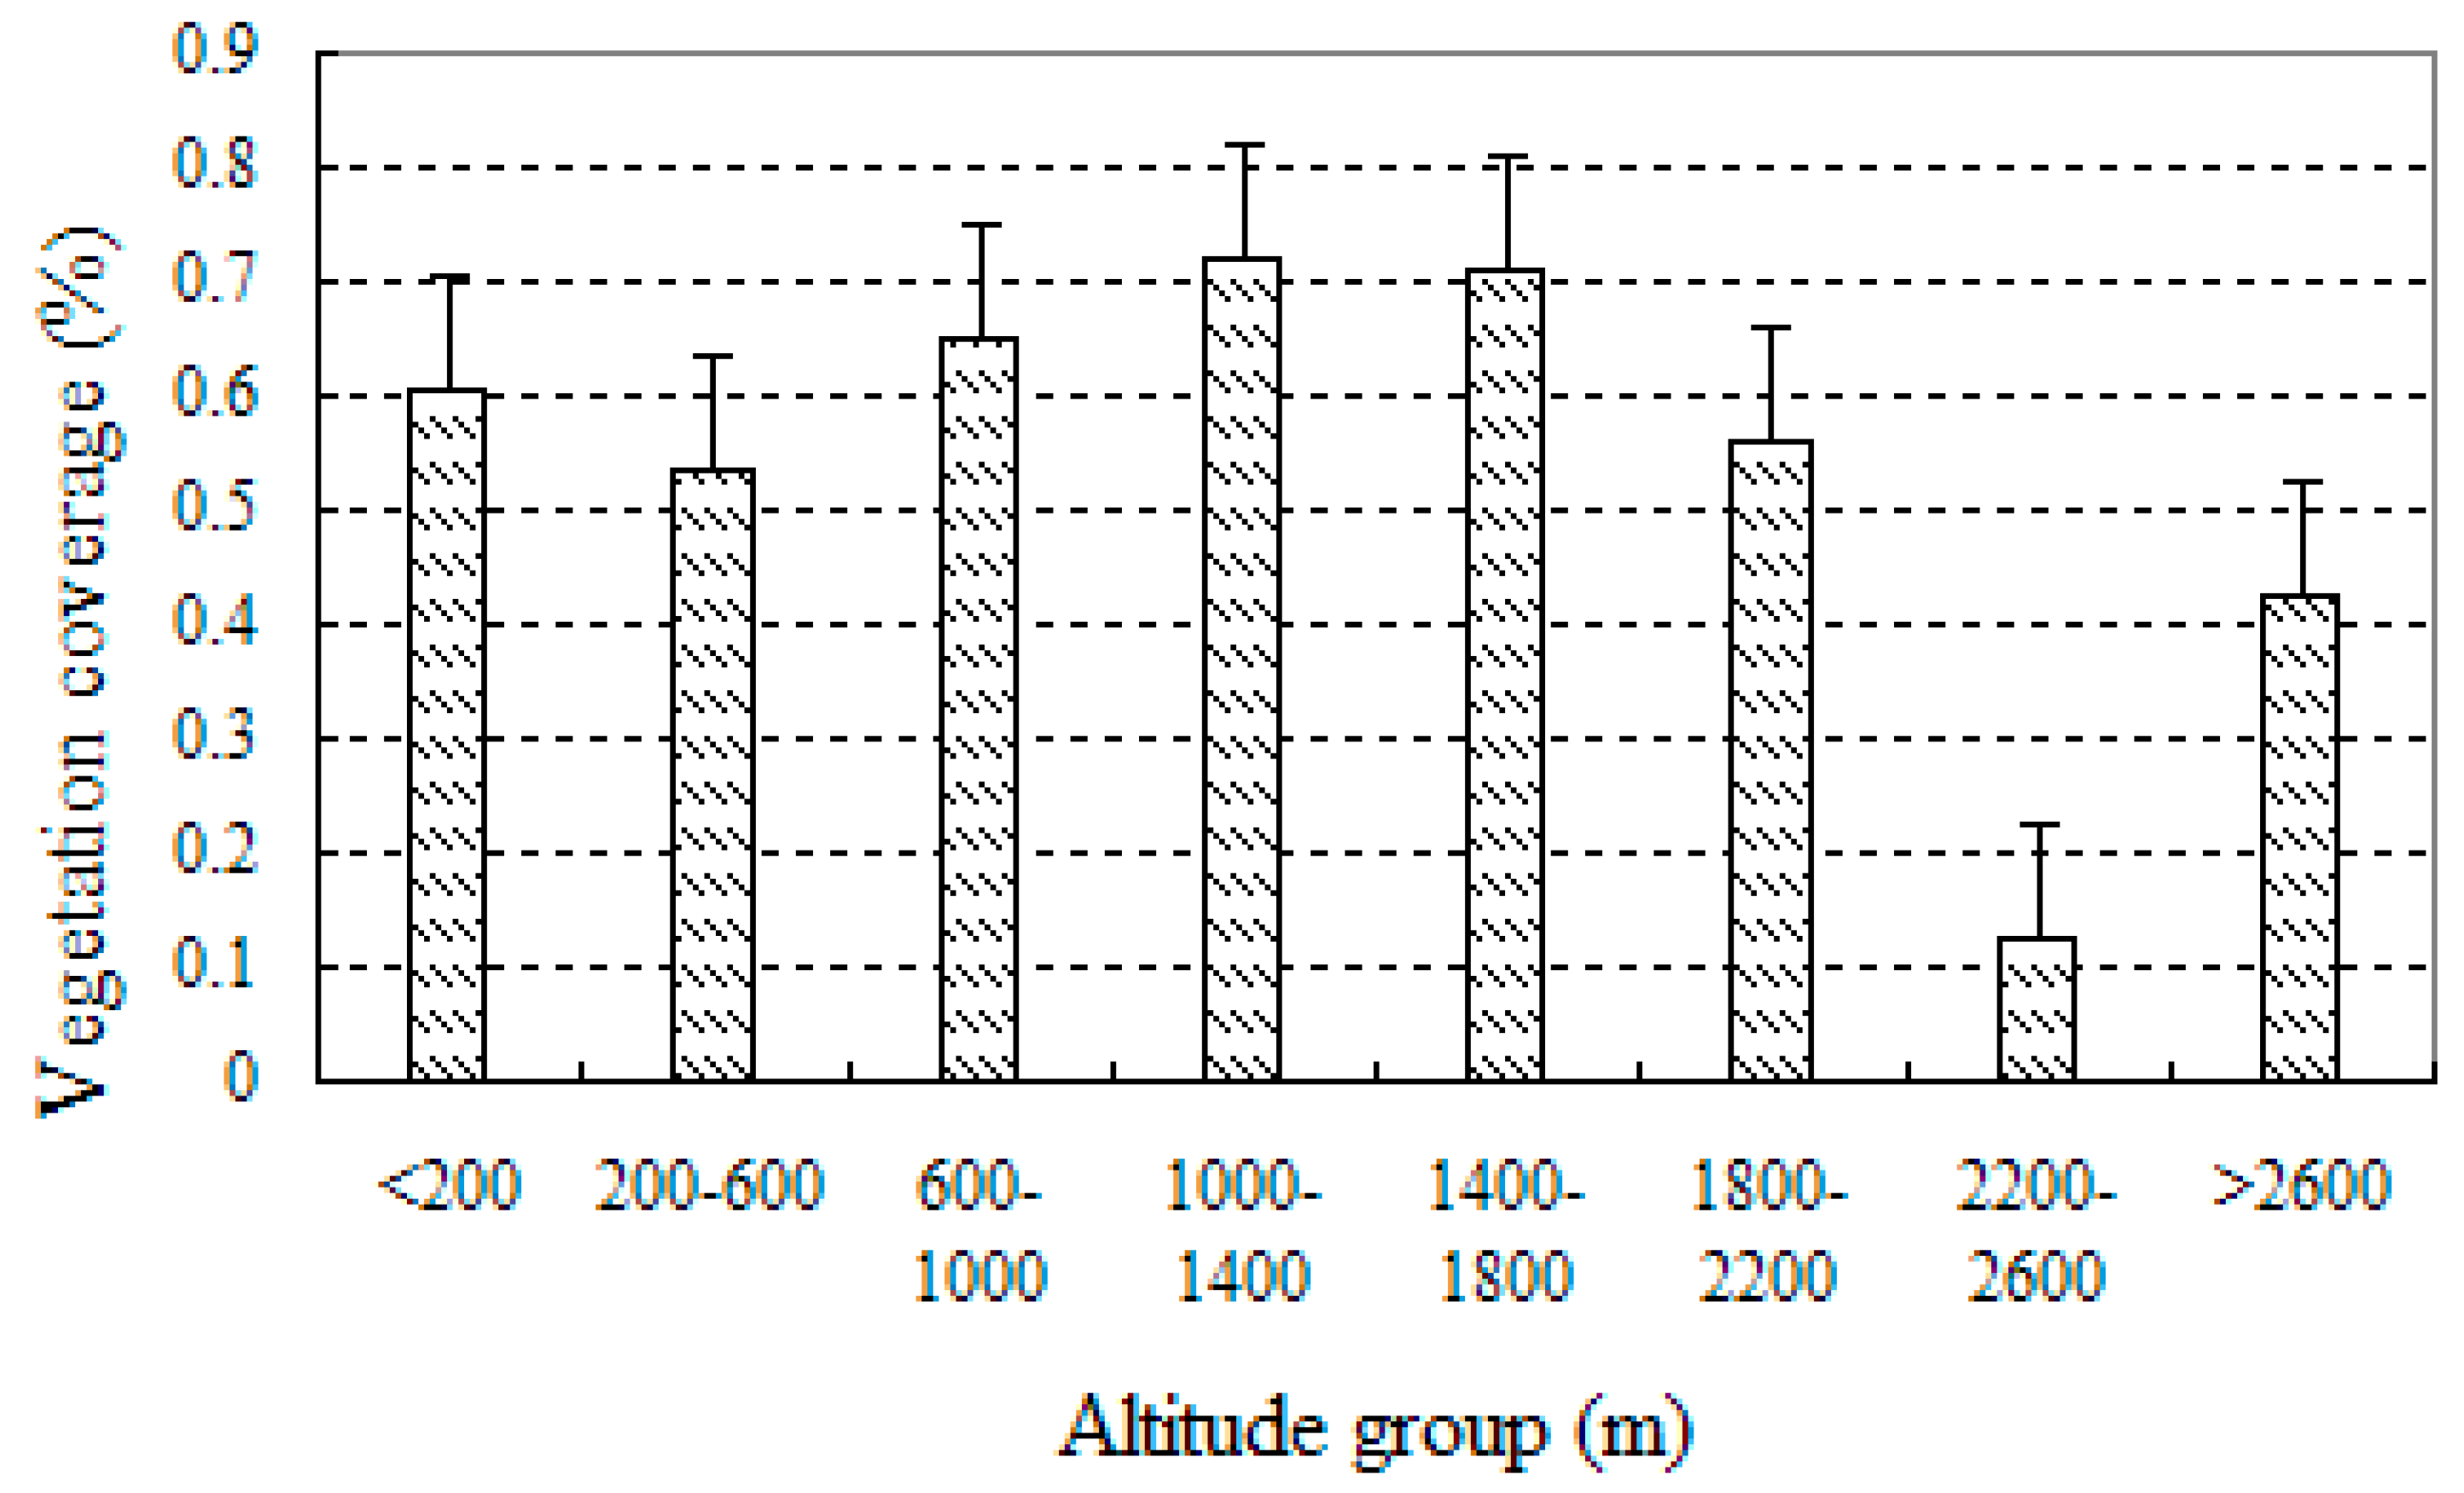
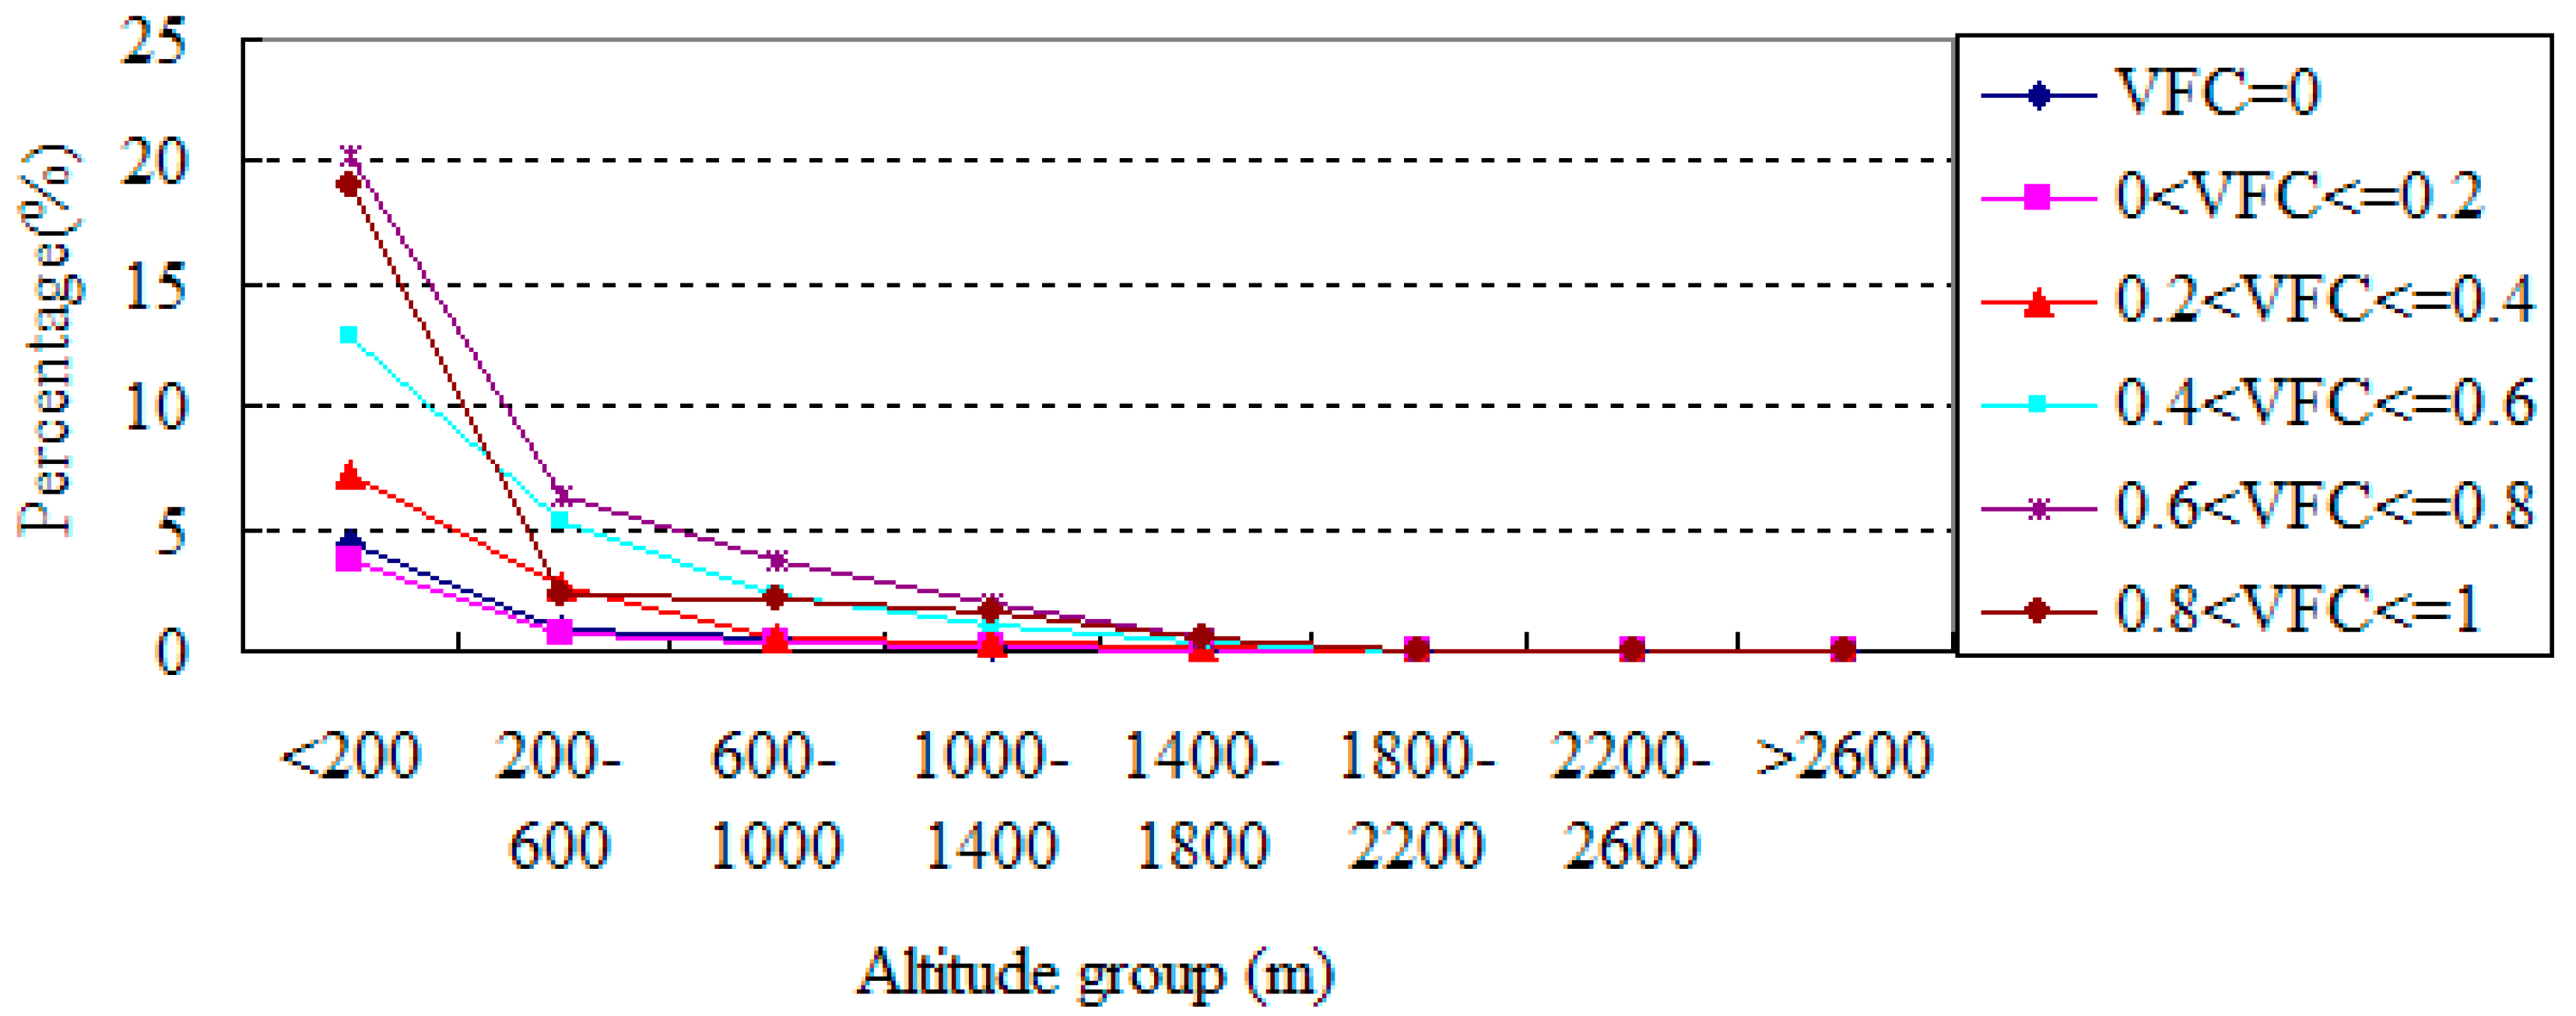
3.3.1. Spatial Variations of Vegetation Coverage in Different Altitudes


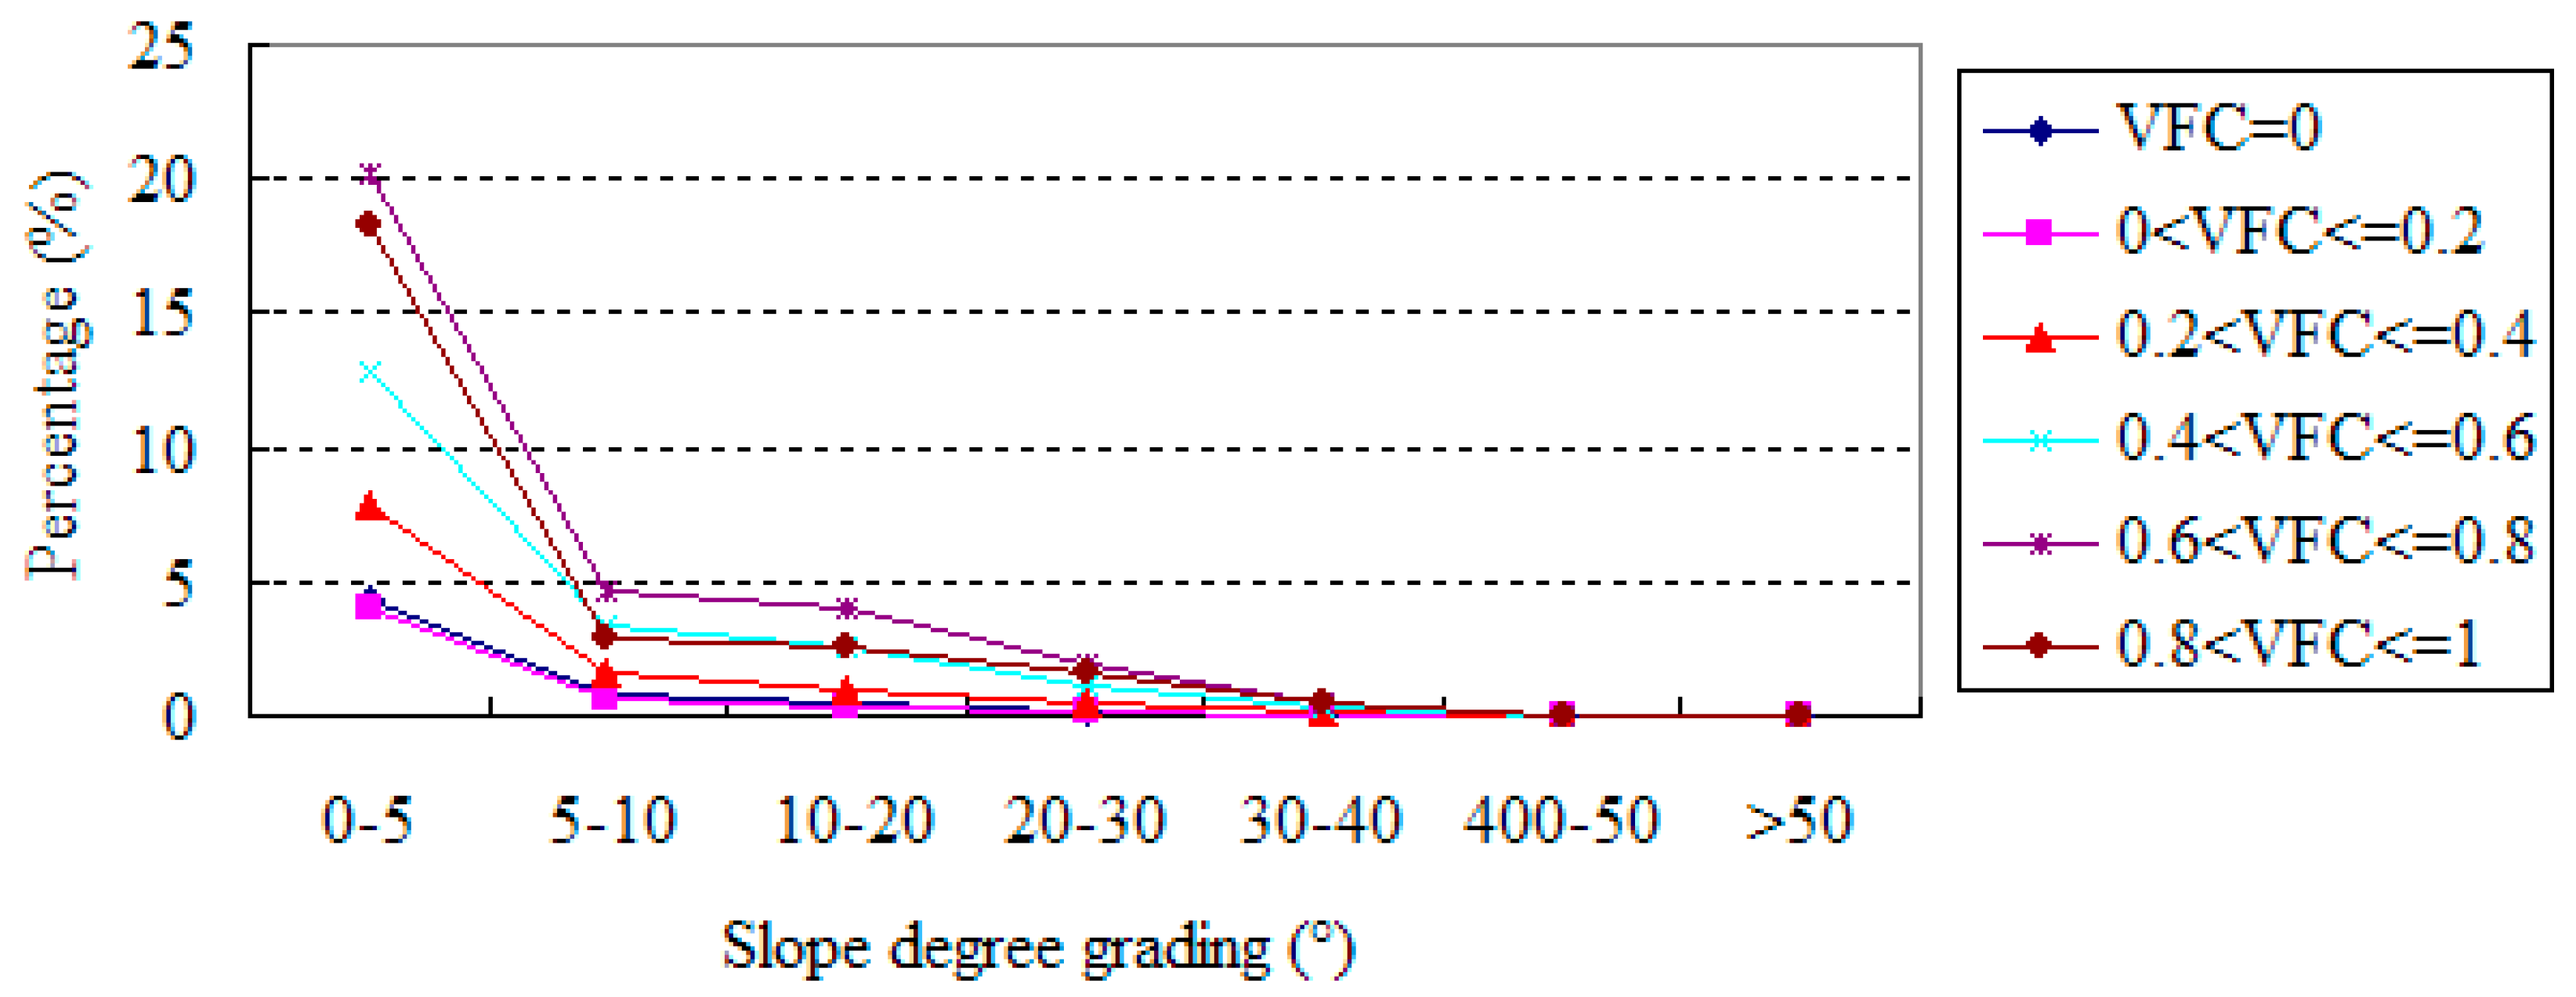
3.3.2. Spatial Variations of Vegetation Coverage in Different Slope Degrees
| Slope Degrees (°) | 0–5 | 5–10 | 10–20 | 20–30 | 30–40 | 40–50 | >50 | Total |
|---|---|---|---|---|---|---|---|---|
| FC = 0 | 4.37 | 0.86 | 0.53 | 0.21 | 0.07 | 0.01 | 0.00 | 6.06 |
| 0 < FC ≤ 0.2 | 3.95 | 0.67 | 0.30 | 0.10 | 0.03 | 0.01 | 0.00 | 5.07 |
| 0.2 < FC ≤ 0.4 | 7.87 | 1.66 | 1.04 | 0.41 | 0.13 | 0.02 | 0.00 | 11.13 |
| 0.4 < FC ≤ 0.6 | 12.83 | 3.29 | 2.62 | 1.12 | 0.33 | 0.04 | 0.00 | 20.25 |
| 0.6 < FC ≤ 0.8 | 20.19 | 4.66 | 4.07 | 1.95 | 0.53 | 0.06 | 0.01 | 31.48 |
| 0.8 < FC ≤ 1 | 18.20 | 2.92 | 2.58 | 1.67 | 0.55 | 0.08 | 0.01 | 26.01 |
| Total | 67.42 | 14.07 | 11.15 | 5.47 | 1.65 | 0.23 | 0.03 | 100.00 |

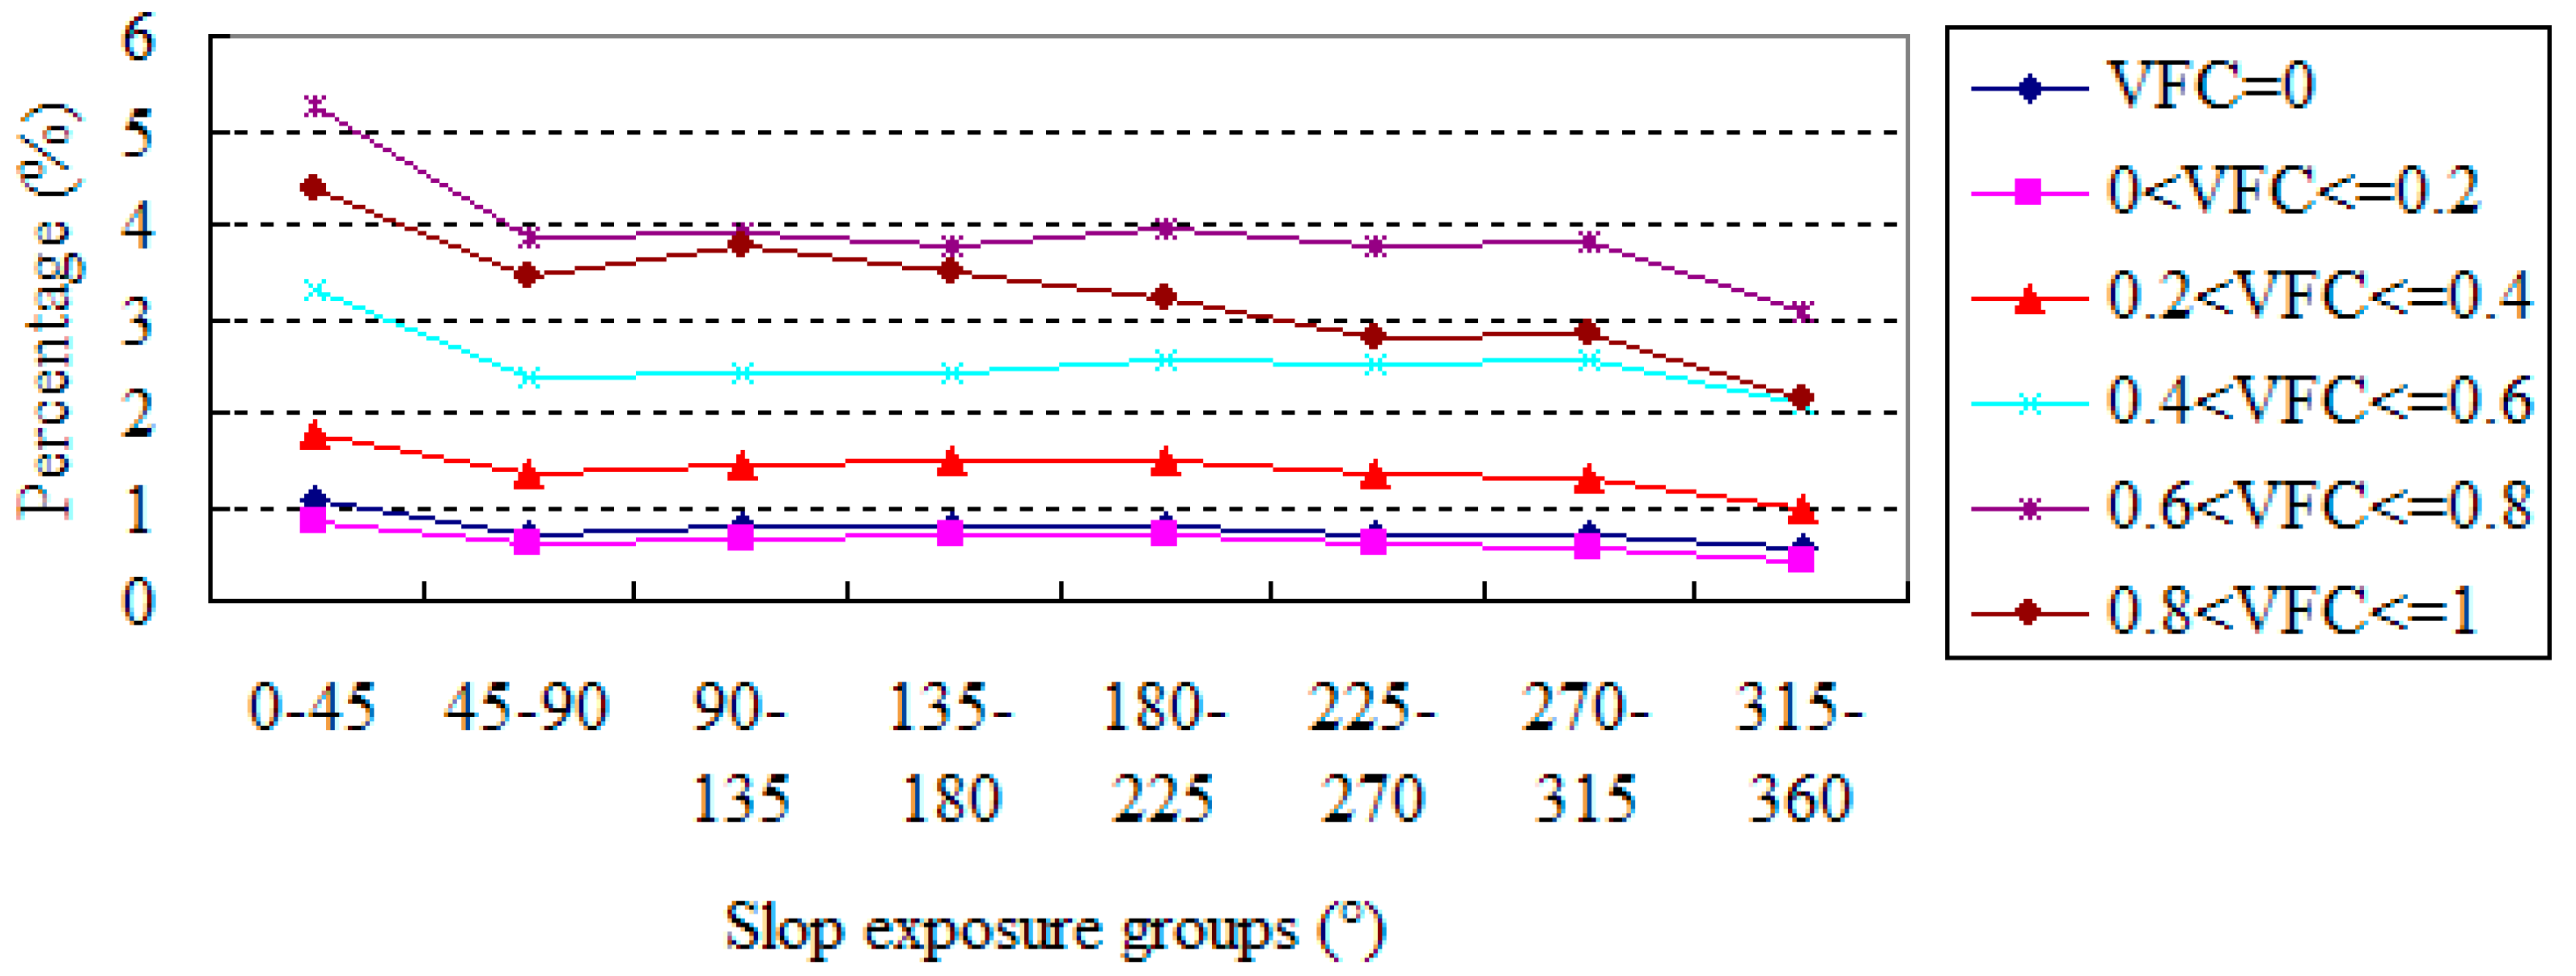
3.3.3. Spatial Variations of Vegetation Coverage in Different Slope Exposures
| Slope Exposure (°) | 0–45 | 45–90 | 90–135 | 135–180 | 180–225 | 225–270 | 270–315 | 315–360 | Total |
|---|---|---|---|---|---|---|---|---|---|
| VFC = 0 | 1.09 | 0.70 | 0.77 | 0.77 | 0.77 | 0.71 | 0.71 | 0.54 | 6.06 |
| 0 < VFC ≤ 0.2 | 0.82 | 0.60 | 0.66 | 0.69 | 0.70 | 0.60 | 0.57 | 0.42 | 5.07 |
| 0.2 < VFC ≤ 0.4 | 1.77 | 1.33 | 1.43 | 1.47 | 1.50 | 1.33 | 1.30 | 1.00 | 11.13 |
| 0.4 < VFC ≤ 0.6 | 3.29 | 2.37 | 2.43 | 2.44 | 2.58 | 2.50 | 2.57 | 2.07 | 20.25 |
| 0.6 < VFC ≤ 0.8 | 5.26 | 3.88 | 3.91 | 3.79 | 3.95 | 3.77 | 3.83 | 3.08 | 31.48 |
| 0.8 < VFC ≤ 1 | 4.36 | 3.44 | 3.76 | 3.48 | 3.20 | 2.81 | 2.82 | 2.16 | 26.01 |
| Total | 16.58 | 12.32 | 12.96 | 12.64 | 12.69 | 11.73 | 11.80 | 9.28 | 100.00 |

4. Conclusions
Acknowledgments
Author Contributions
Conflicts of Interest
References
- Chen, X.; Li, B.L. Effect of global climate change and human disturbances on tree diversity of the forest regenerating from clear-cuts of mixed broadleaved korean pine forest in Northeast China. Chemosphere 2003, 51, 215–226. [Google Scholar] [CrossRef]
- Bucała, A. The impact of human activities on land use and land cover changes and environmental processes in the Gorce Mountains in the past 50 years. J. Environ. Manag. 2014, 138, 4–14. [Google Scholar] [CrossRef] [PubMed]
- Hunt, C.O.; Premathilake, R. Early Holocene vegetation, human activity and climate from Sarawak Malaysian Borneo. Quat. Int. 2012, 249, 105–119. [Google Scholar] [CrossRef]
- Zhang, Y.; Yang, J.; Wu, H.; Shi, C.; Zhang, C.; Li, D.; Feng, M. Dynamic changes in soil and vegetation during varying ecological recovery conditions of abandoned mines in Beijing. Ecol. Eng. 2014, 73, 676–683. [Google Scholar] [CrossRef]
- Defnies, R.S.; Townshend, J.R.G. NDVI-derived land cover classifications at a global scale. Int. J. Remote Sens. 1994, 17, 3567–3586. [Google Scholar] [CrossRef]
- Perini, K.; Magliocco, A. Effects of vegetation, urban density, building height, and atmospheric conditions on local temperatures and thermal comfort. Urban For. Urban Green. 2014, 13, 495–506. [Google Scholar] [CrossRef]
- Fan, Z.M.; Li, J.; Yue, T.X. Changes of Climate-Vegetation Ecosystem in Loess Plateau of China. Procedia Environ. Sci. 2012, 13, 715–720. [Google Scholar] [CrossRef]
- Liu, X.; Zhang, W.; Yang, F.; Zhou, X.; Liu, Z.; Qu, F.; Lian, S.; Wang, C.; Tang, X. Changes in vegetation-environment relationships over long-term natural restoration process in Middle Taihang Mountain of North China. Ecol. Eng. 2012, 49, 193–200. [Google Scholar] [CrossRef]
- Zhou, Z.C.; Shangguan, Z.P.; Zhao, D. Modeling vegetation coverage and soil erosion in the Loess Plateau Area of China. Ecol. Model. 2006, 198, 263–268. [Google Scholar] [CrossRef]
- Purevdoij, T.; Tateishi, R.; Ishiyama, T.; Honda, Y. Relationships between percent vegetation cover and vegetation indices. Int. J. Remote Sens. 1998, 18, 3519–3535. [Google Scholar] [CrossRef]
- Gong, Z.; Cui, T.; Pu, R.; Lin, C.; Chen, Y. Dynamic simulation of vegetation abundance in a reservoir riparian zone using a sub-pixel Markov model. Int. J. Appl. Earth Obs. Geoinform. 2015, 35, 175–186. [Google Scholar] [CrossRef]
- Leprieur, C.; Mastorchio, S.; Meunier, J.C.; Kerr, Y.H. Monitoring vegetation cover across semi-arid regions: Comparison of remote observations from various scales. Int. J. Remote Sens. 2000, 2, 281–300. [Google Scholar] [CrossRef]
- Harris, A.; Carr, A.S.; Dash, J. Remote sensing of vegetation cover dynamics and resilience across southern Africa. Int. J. Appl. Earth Obs. Geoinform. 2014, 28, 131–139. [Google Scholar] [CrossRef]
- Jiapaer, G.; Chen, X.; Bao, A. A comparison of methods for estimating fractional vegetation cover in arid regions. Agric. For. Meteorol. 2011, 151, 1698–1710. [Google Scholar] [CrossRef]
- Jing, X.; Yao, W.Q.; Wang, J.H.; Song, X.Y. A study on the relationship between dynamic change of vegetation coverage and precipitation in Beijing’s mountainous areas during the last 20 years. Math. Comput. Model. 2011, 54, 1079–1085. [Google Scholar] [CrossRef]
- Adams, M.P.; Smith, P.L. A systematic approach to model the influence of the type and density of vegetation cover on urban heat using remote sensing. Landsc. Urban Plan. 2014, 132, 47–54. [Google Scholar] [CrossRef]
- Yang, J.; Weishberg, P.J.; Bristow, N.A. Landsat remote sensing approaches for monitoring long-term tree cover dynamics in semi-arid woodlands: Comparison of vegetation indices and spectral mixture analysis. Remote Sens. Environ. 2012, 119, 62–71. [Google Scholar] [CrossRef]
- Jia, K.; Liang, S.; Zhang, L.; Wei, X.; Yao, Y.; Xie, X. Forest cover classification using landsat ETM+ data and time series MODIS NDVI data. Int. J. Appl. Earth Obs. Geoinform. 2014, 33, 32–38. [Google Scholar] [CrossRef]
- Salovaara, K.J.; Thessler, S.; Malik, R.N.; Tuomisto, H. Classification of Amazonian primary rain forest vegetation using Landsat ETM+ satellite imagery. Remote Sens. Environ. 2005, 97, 39–51. [Google Scholar] [CrossRef]
- Hais, M.; Jonasova, M.; Langhammer, J.; Kucera, T. Comparison of two types of forest disturbance using multitemporal landsat TM/ETM+ imagery and field vegetation data. Remote Sens. Environ. 2009, 113, 835–845. [Google Scholar] [CrossRef]
- Eckert, S.; Engesser, M. Assessing vegetation cover and biomass in restored erosion areas in Iceland using SPOT satellite data. Appl. Geogr. 2013, 40, 179–190. [Google Scholar] [CrossRef]
- Jarlan, L.; Mangiarotti, S.; Mougin, E.; Mazzega, P.; Hiernaux, P.; Dantec, V.L. Assimilation of SPOT/VEGETATION NDVI data into a sahelian vegetation dynamics model. Remote Sens. Environ. 2008, 112, 1381–1394. [Google Scholar] [CrossRef]
- Dymond, J.R.; Stephens, P.R.; Newsome, P.F.; Wilde, R.H. Percentage vegetation cover of a degrading rangeland from SPOT. Int. J. Remote Sens. 1992, 11, 1999–2007. [Google Scholar] [CrossRef]
- Wardlow, B.D.; Egbert, S.L.; Kastens, J.H. Analysis of time-series MODIS 250 m vegetation index data for crop classification in the U.S. Central Great Plains. Remote Sens. Environ. 2007, 108, 290–310. [Google Scholar] [CrossRef]
- Li, Z.; Li, X.; Wei, D.; Xu, X.; Wang, H. An assessment of correlation on MODIS-NDVI and EVI with natural vegetation coverage in Northern Hebei Province China. Procedia Environ. Sci. 2010, 2, 946–969. [Google Scholar] [CrossRef]
- Bajocco, S.; Angelis, A.D.; Salvati, L. A satellite-based green index as a proxy for vegetation cover quality in a Mediterranean region. Ecol. Indic. 2012, 23, 578–587. [Google Scholar] [CrossRef]
- Zhang, J.; Liu, Z.; Sun, X. Changing landscape in the Three Gorges Reservoir Area of Yangtze River from 1977 to 2005: Land use/land cover, vegetation cover changes estimated using mult-source satellite data. Int. J. Appl. Earth Obs. Geoinform. 2009, 11, 403–412. [Google Scholar] [CrossRef]
- Xin, Z.; Xu, J.; Zheng, W. Impact of climatic changes and human activities on vegetation coverage changes in the Loess Plateau. Sci. China (Ser. D) Earth Sci. 2007, 11, 1504–1514. (In Chinese) [Google Scholar]
- Baret, F.; Guyot, G.; Major, D.J. TSAVI: A vegetation index which minimizes soil brightness effects on LAI and APPR estimation. In Proceedings of the 12th Canadian Symposium on Remote Sensing, Vancouver, BC, Canada, 10–14 July 1989; pp. 1355–1358.
- Deng, S.; Chen, Q. Overview of vegetation spectral characteristics and vegetation index. In Proceedings of the 17th China Symposium on Remote Sensing, Hangzhou, China, 27–31 August 2010. (In Chinese)
- Paruelo, J.M.; Epstein, H.E.; Lauenroth, W.K.; Burke, I.C. ANPP estimates from NDVI for the central grassland region of the United States. Ecology 1997, 3, 953–958. [Google Scholar] [CrossRef]
- Fensholt, R.; Proud, S.R. Evaluation of Earth Observation based global long term vegetation trends-Comparing GIMMS and MODIS global NDVI time series. Remote Sens. Environ. 2012, 119, 131–147. [Google Scholar] [CrossRef]
- Raynolds, M.K.; Comiso, J.C.; Walker, D.A.; Verbyla, D. Relationship between satellite-derived land surface temperatures, arctic vegetation types, and NDVI. Remote Sens. Environ. 2008, 112, 1884–1894. [Google Scholar] [CrossRef]
- Jiang, Z.; Huete, A.R.; Chen, J.; Chen, Y.; Li, J.; Yan, G.; Zhang, X. Analysis of NDVI and scaled difference vegetation index retrievals of vegetation fraction. Remote Sens. Environ. 2006, 101, 366–378. [Google Scholar] [CrossRef]
- Gutman, G.; Ignatov, A. The derivation of the green vegetation fraction from NOAA/AVHRR data for use in numerical weather prediction models. Int. J. Remote Sens. 1998, 8, 1533–1543. [Google Scholar] [CrossRef]
- Chen, X.; Wang, H. Spatial and temporal variations in vegetation zone in Inner Mongolia and vegetation coverage from 1982 to 2003. Scientia Geographica Sinica 2009, 1, 84–94. (In Chinese) [Google Scholar]
- Ma, Z.; Shen, T.; Zhang, J.; Li, C. Analysis of vegetation coverage. Bull. Surv. Mapp. 2007, 3, 45–48. (In Chinese) [Google Scholar]
- Rong, Y.; Lu, J.; Duan, B.; Yang, Z. Research on urbanization and farmland protection in Henan province based on farmland pressure index. J. Henan Agric. Univ. 2014, 2, 219–223. (In Chinese) [Google Scholar]
- Fang, J.; Chen, A.; Peng, C.; Zhao, S.; Ci, L. Changes in Forest Biomass Carbon Storage in China between 1949 and 1998. Science 2001, 292, 2320–2322. [Google Scholar] [CrossRef] [PubMed]
- Ren, J.; Chen, L. Landform Characters Analysis and Classifying of Henan Province Based on Digital Elevation Model in Shuttle Radar Topography Mission Data Format. Henan Sci. 2011, 9, 1113–1116. (In Chinese) [Google Scholar]
© 2015 by the authors; licensee MDPI, Basel, Switzerland. This article is an open access article distributed under the terms and conditions of the Creative Commons Attribution license (http://creativecommons.org/licenses/by/4.0/).
Share and Cite
Li, J.; Liu, Y.; Cao, M.; Xue, B. Space-Time Characteristics of Vegetation Cover and Distribution: Case of the Henan Province in China. Sustainability 2015, 7, 11967-11979. https://doi.org/10.3390/su70911967
Li J, Liu Y, Cao M, Xue B. Space-Time Characteristics of Vegetation Cover and Distribution: Case of the Henan Province in China. Sustainability. 2015; 7(9):11967-11979. https://doi.org/10.3390/su70911967
Chicago/Turabian StyleLi, Jingzhong, Yongmei Liu, Mingming Cao, and Bing Xue. 2015. "Space-Time Characteristics of Vegetation Cover and Distribution: Case of the Henan Province in China" Sustainability 7, no. 9: 11967-11979. https://doi.org/10.3390/su70911967