1. Introduction
In the twenty-first century, urban sustainability has become a very important factor in urban policy discussions, urban development sustainability policy decisions, and environmental planning [
1,
2,
3]. Rapid urban development in China has led to the expansion of urban spaces, the enlargement of city scales, and changes to resident lifestyles, and has had wide ranging effects, all of which have led to increased attention being paid to sustainable city development, especially on reasonable methods for measuring sustainable urban development [
4]. Sustainable urban development emphasizes a coordinated development of the city’s economy, society, and ecology, and its core purpose is, through regional co-ordination, resource conservation, and other means, to promote harmony between the urban economy, the residents’ lives, and the ecological resources [
5].
Cities are generally the center of a country’s human activities and social resources, and, as urban populations have grown in the last few decades, research into sustainable urban development has gradually become a key research field. Research has begun to focus on those factors that ensure successful sustainable urban development with the aim of changing traditional policy-oriented town planning so as to provide a new urbanization path. Berry and Portney examined two original databases to explore the behavior of fifty large U.S. cities with respect to sustainability and economic development policies, the results from which showed that a high number of programs aimed at achieving sustainability were linked to the inclusion of environmental advocacy groups, that this relationship was not compromised by business advocacy, and that the inclusion of environmental groups in policymaking seemed to be supported, rather than impeded, by the high economic growth rates in the cities [
6,
7]. Fang, Ma, Wang, and Li examined the sustainable development of innovative cities and argued that this necessary transition was being constrained by bottlenecks in investment, income, techniques, contributions, and talent [
8]. Zhang, Uwasu, Hara, and Yabar studied the effects of infrastructure development, land use change, industrial structure, and income on sustainable urban development, the results from which suggested that with steady economic growth, a moderate change in land use was key to sustainable urban development [
9]. Through extensive research, Tweed and Sutherland examined the link between sustainable urban development and cultural heritage and found that the development and promotion of culture could play an important role [
10]. All of these studies have provided valuable information to enhance the sustainable development capacity of cities.
Ecological problems have grown along with urbanization. To address this issue, Zhao, Zhou, and Su introduced an urban eco-security evaluation methodology and used a fuzzy comprehensive evaluation (FCE) method in the research calculations Mianyang City statistical data from 2005–2012 showed that criticality, security, and slight insecurity were the main influences on ecological urban environments [
11]. However, developing a potential index proved to be difficult because of insufficient spatial-temporal analysis. Shen, Kyllo, and Guo established an integrated model based on a hierarchical index system to monitor and evaluate urban sustainability, which provided a theoretical basis for a comprehensive assessment of urban sustainability from a spatial-temporal perspective [
12]. Yin, Wang, An, Yao, and Liang used eco-efficiency as an indicator to measure sustainable urban development and applied a data envelopment analysis model to describe the eco-efficiency in thirty Chinese provincial capital cities, which found that almost half of the cities were fairly eco-efficient [
4]. In recent years, scholars have used several methods to establish sustainable urban development evaluation index systems. Javadian, Shamskooshki, and Momeni focused on the environmental dimension of sustainable urban development and conducted an environmental suitability analysis for educational land use in Tehran using AHP and GIS. Through the use of these two models, they were better able to determine which locations were environmentally suitable for educational purposes, thereby providing a reference for sustainable urban development [
13]. Yigitcanlar and Dur, by highlighting the emerging issues or problems, demonstrated that sustainable urban development (SUD) levels could provide valuable information for the assessment of the performance of existing economic, social, and environmental policies and plans. Yin-feng Yang, using twelve cities in Gansu province as the study object, established a coordination evaluation index system for an urban sustainable development system from five aspects; population, resources, environment, economy, and society. Factor analyses and coordinated development degree methods were used to develop a sustainable development system evaluation coordination model, and a range of evaluation standards were outlined.
Previous research has highlighted many factors that can directly or indirectly affect sustainable urban development levels, indicating that the potential index system scale is large. If an integrated and comprehensive index system were to be used, however, traditional processing would require a long time, and would still be prone to errors. Further, most traditional models offer only a simple index calculation analysis measure, which cannot fully reflect the differences in the actual measurement values in comparison with the best or worst standards, meaning that the real sustainable urban development capacity levels cannot be elucidated. In view of this, on the premise of the previous research evaluation indices, this paper establishes a more comprehensive index system which includes environmental urban construction, government support, cultural entertainment, social security, and economic development indicators. Further, under the principle of a comprehensive and integrated index system, a PCA-Grey TOPSIS measurement model is established, which has the ability to extract those elements that have the strongest influence on sustainable urban development capacity and which can reduce the amount of work needed to build a grey correlation matrix to determine the best and worst measurement values. The model then calculates the distance between the sustainable urban development capacity of the actual measured value and best measured value, the results of which are an important basis from which to judge the sustainable development capacity of a city.
2. Sustainable Urban Development Capacity Measurement Index System
When measuring the sustainable development capacity of a city, it is necessary to consider economic sustainable development, social sustainable development, and ecological sustainable development [
14]. In view of this, based on the principles of availability, operability, and representativeness, and combined with data from the Chinese City Statistical Yearbook 2013, a sustainable urban development capacity measure index system was constructed, as shown in
Table 1.
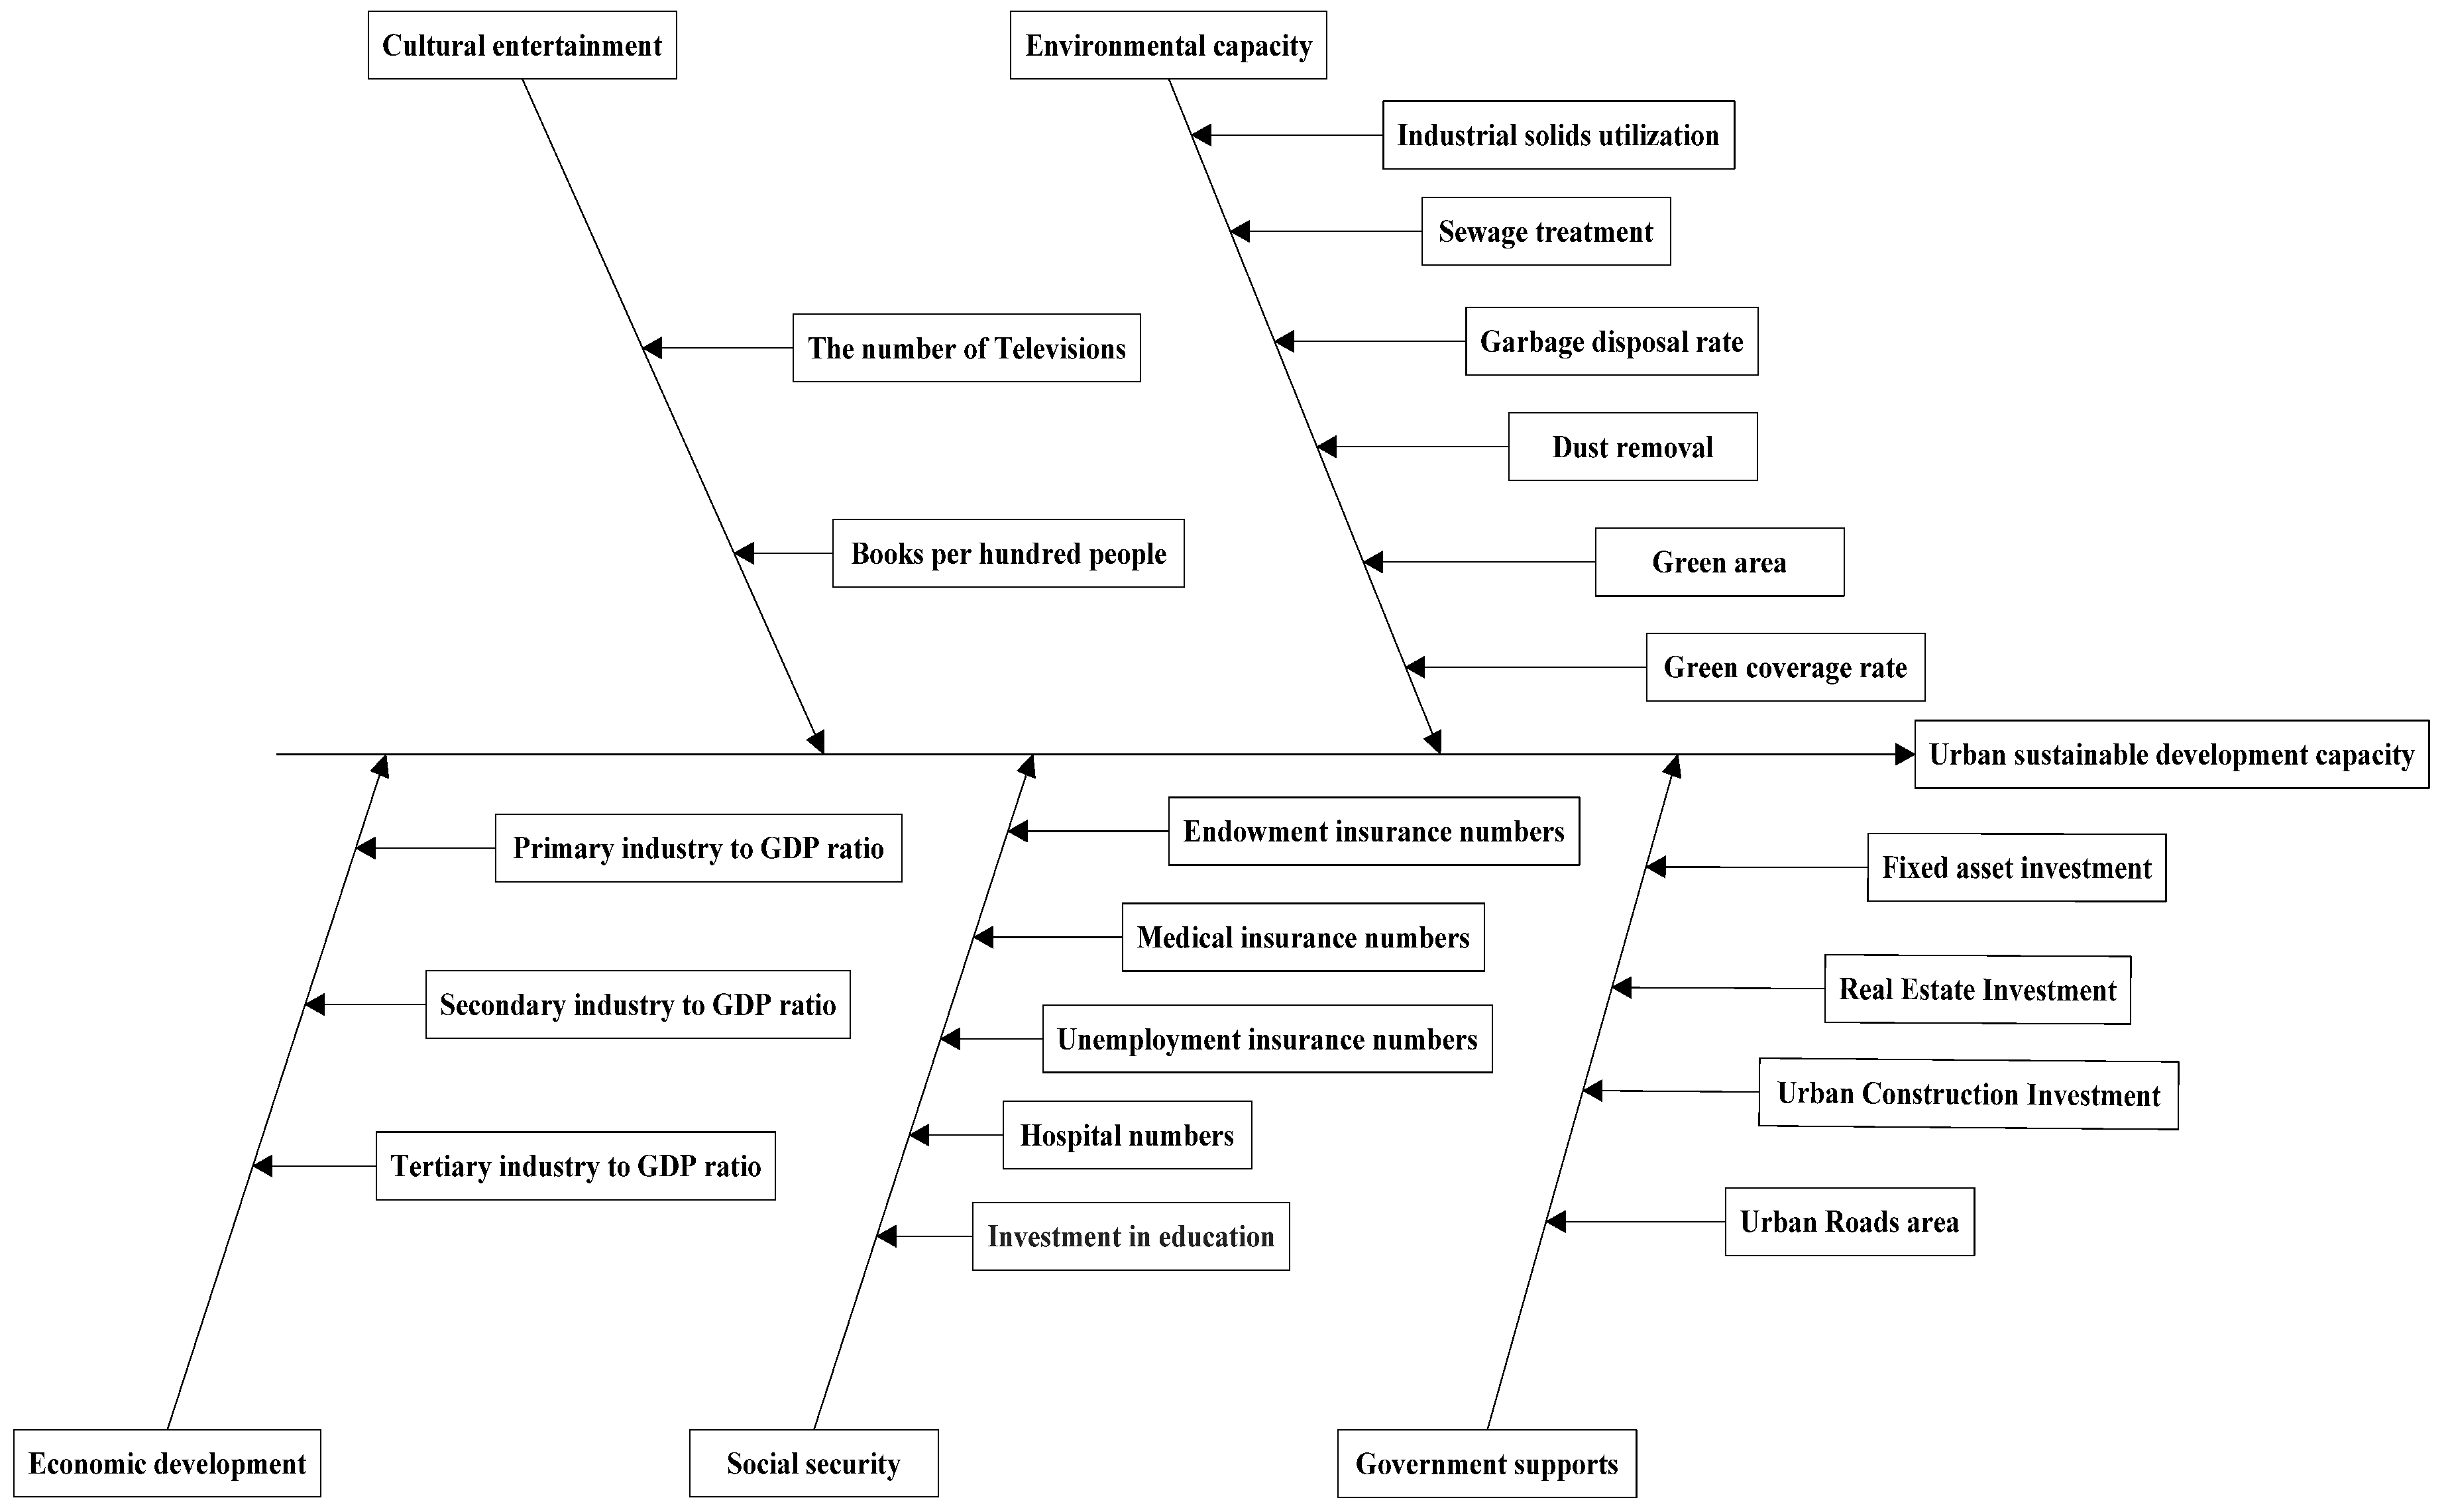
From the comprehensive literature review, and combined with the statistical data, this paper selected environmental capacity, government support, cultural entertainment, social security, and economic development as the first level indicators, which were then further subdivided to derive the secondary indicators. The environmental capacity index reflects the harmonious development of the relationship between the urban and natural environments as having a healthy environment and rich resources are considered the basis for sustainable urban development. With this in mind, to measure the sustainable development capacity of a city, we selected city pollutant processing capacity and green coverage as the secondary indicators. The government support index refers mainly to government urban construction investment aimed at improving municipal infrastructure construction, which is an important foundation for the harmonious development of the city and is closely related to sustainable city development. The cultural entertainment and social security indicator index is able to reflect the urban development harmony degree by considering how cultural entertainment and social mechanisms influence various aspects of the residents’ lives. For these indicators, we selected the number of televisions and books per hundred people as indicators for the secondary indices for cultural entertainment, and social care and educational investment as the secondary indicators for social security. For the economic development indicators, a city’s overall economic development level is the foundation for sustainable urban development ability evaluation factors, so we selected the GDP industrial share for the primary, secondary, and tertiary industries as the secondary indicators. As shown in
Figure 1, these indicators mutually influence each other and, together, provide decision support for the determination of the sustainable urban development capacity measurement. When considering the sustainable development inspection capacity, the five indicator levels need to be comprehensively and individually analyzed.
3. Sustainable Urban Development Capacity Measurement Methods
3.1. Measurement Model
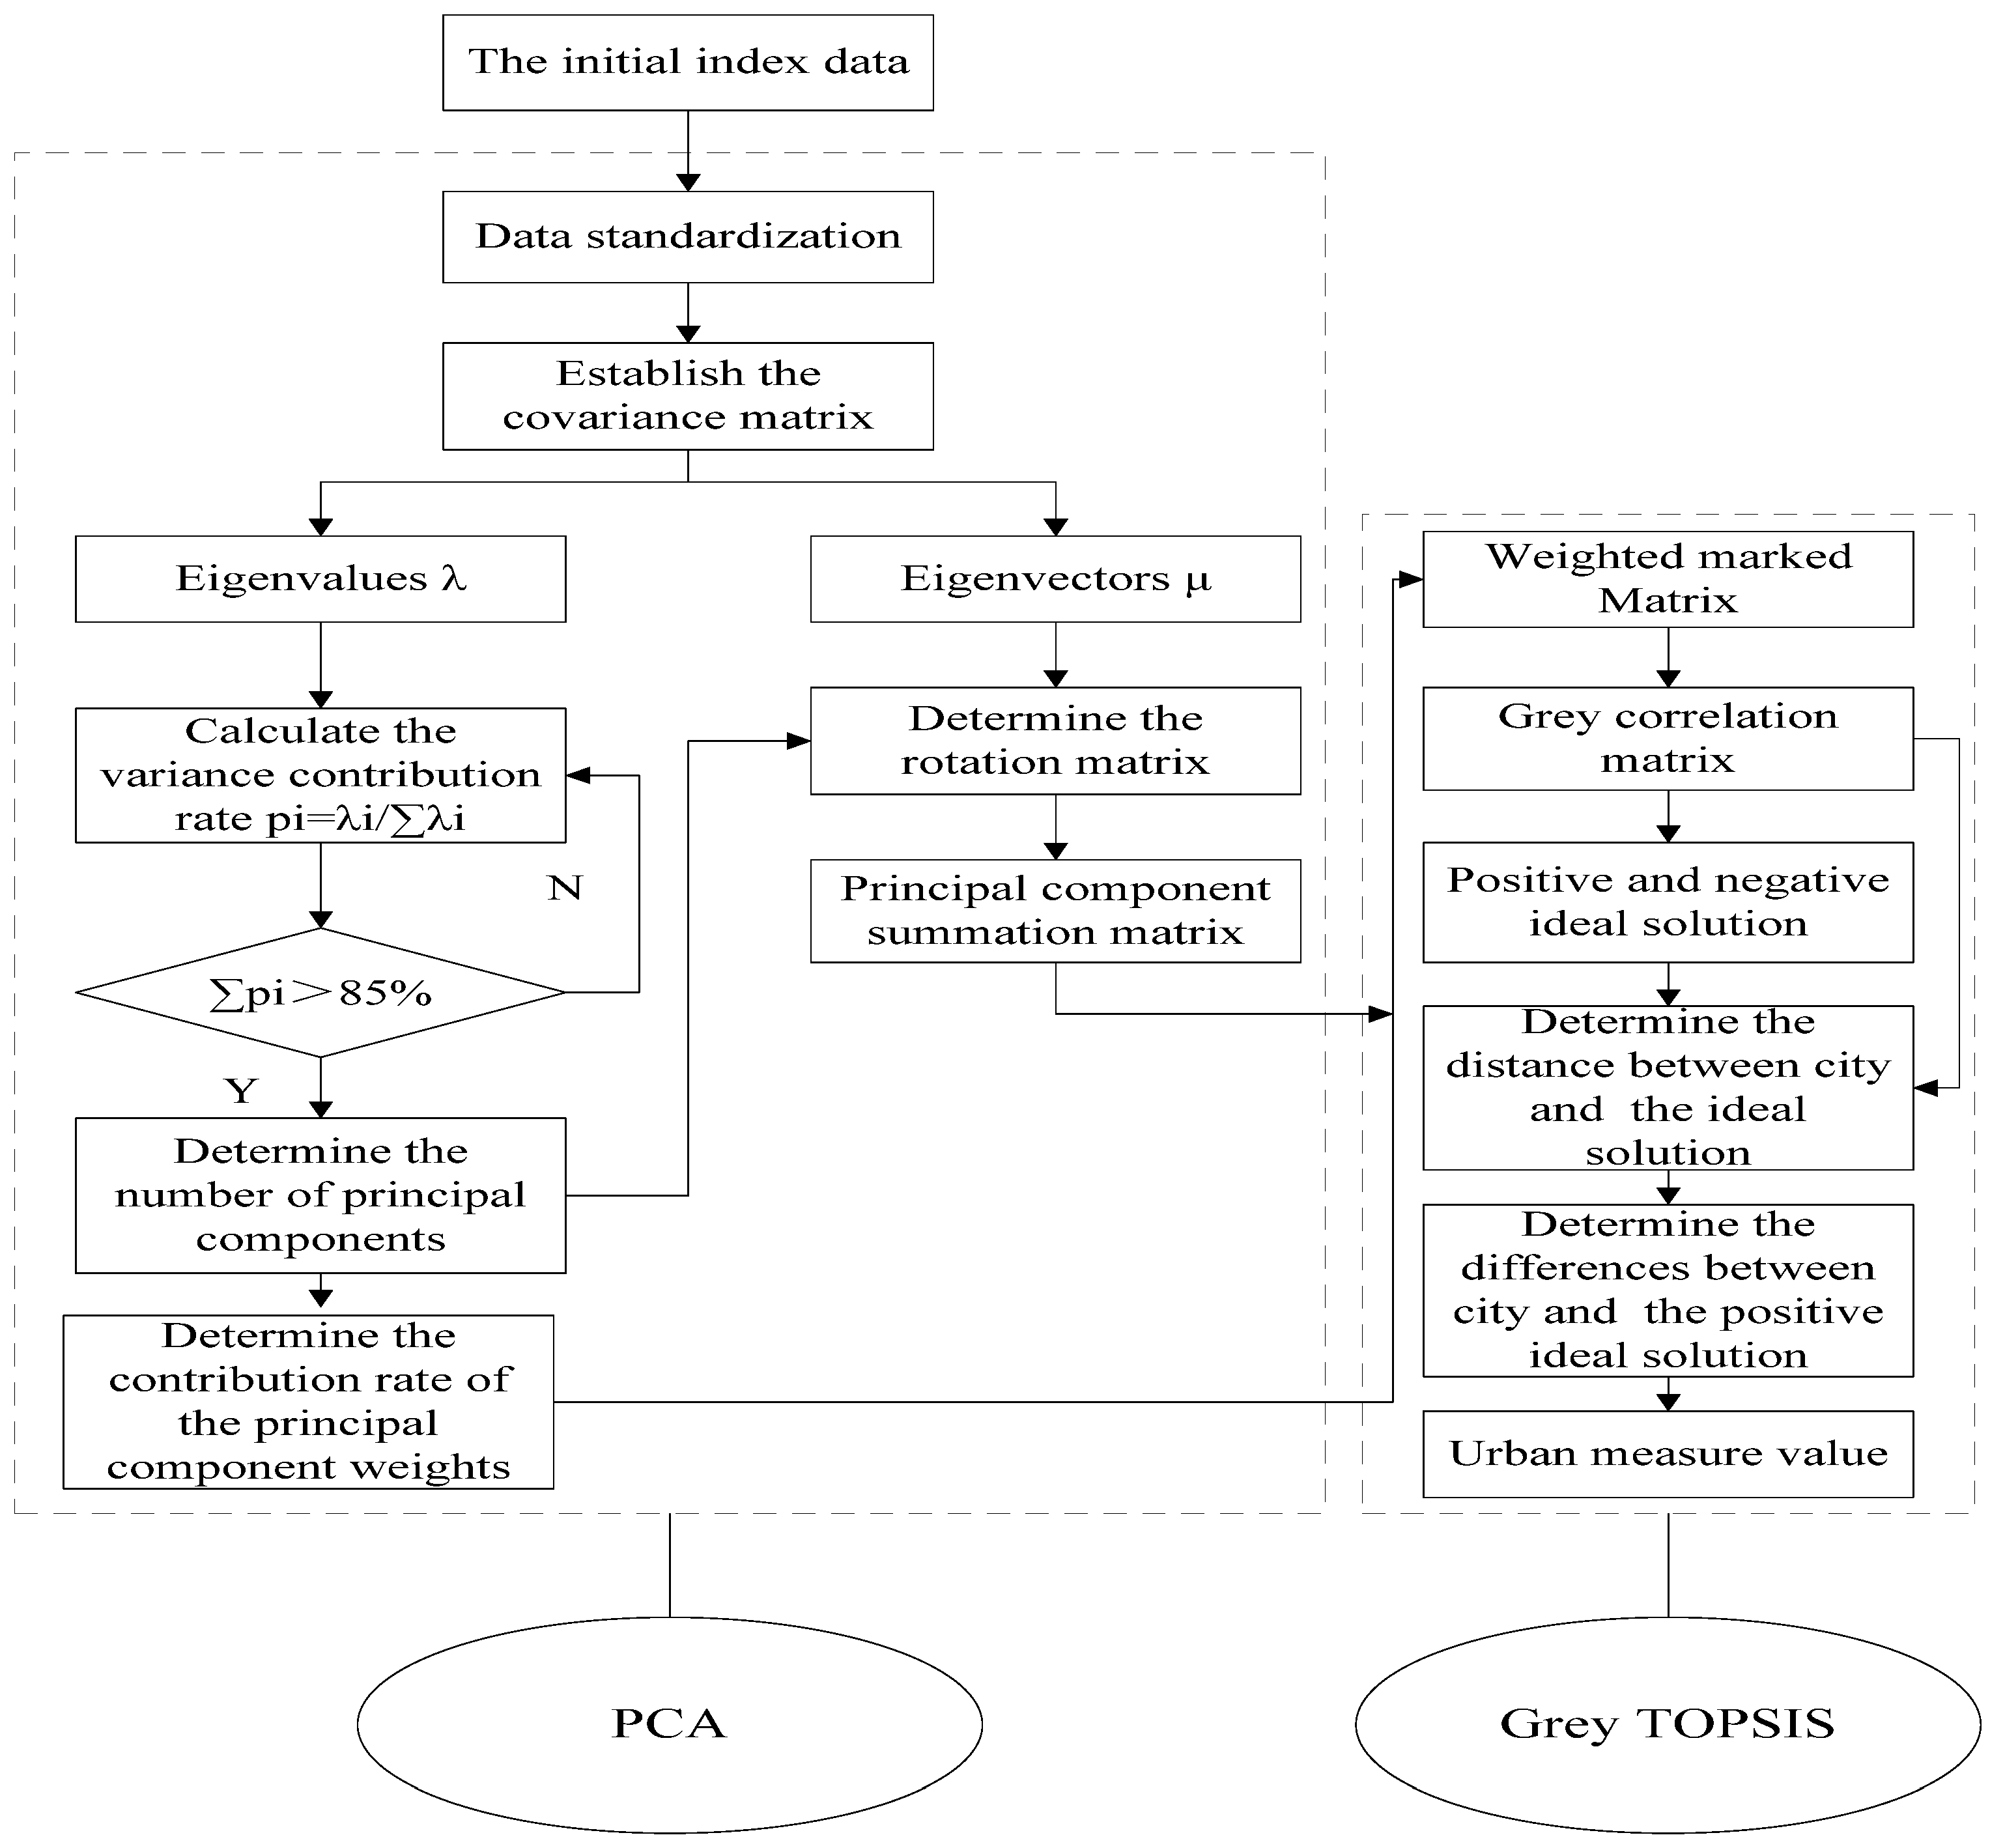
To complete the index system construction, an appropriate measurement method is required to measure sustainable city development capacity. Given the size of the index system, this article uses PCA to process the indicator data in advance, as PCA has the ability to effectively rearrange and recombine the initial indicators and generate a new set of comprehensive indices which reflect the original information [
15,
16]. When seeking to measure the sustainable urban development capacity, PCA can effectively determine the index weight, which contains the information and the evaluation score based on the correlation between the indices, therefore objectively reflecting the relationship between the samples. In addition, by transforming the PCA function to extract the key indicators, the sustainable urban development capacity calculation workload can be effectively reduced and can ensure objectivity and comprehensiveness in the evaluation of results.
After preprocessing the data, the TOPSIS method is then used to measure the sustainable urban development capacity. TOPSIS is one of the multi-criteria decision-making (MCDM) methods which have been successfully applied to many different ranking problems [
17,
18,
19]. TOPSIS, an abbreviation of “technique for order preference by similarity to ideal solution”, was first developed by Hwang and Yoon in 1980 [
20]. The basic idea is that the selected decision scheme is closest to the optimal decision scheme and far from the worst decision scheme [
21,
22]. As TOPSIS has been developed and applied, it has become a commonly used method in many fields, such as the economy, management, and technology, and has played an important role in decision-making management [
23,
24,
25]. The main advantage of TOPSIS is that it can be used to generate an efficient evaluation of different problems with multiple properties [
26,
27,
28,
29]. The TOPSIS method makes full use of the index data information analyses of the differences between the cities and calculates the distance between the measurement targets for the optimal solution and the worst solution. From this final analysis, the relative degree between the city’s development level and the optimal solution can be determined [
30,
31,
32]. This method has the advantage of being real, intuitive, and reliable as there are special requirements for the samples. Therefore, for sustainable urban development capacity measurement, it has certain advantages. However, in the measurement process, the reverse problem can be produced with an increase in the measured object.
To solve this reverse problem, it is necessary to use grey correlation theory. Grey correlation analysis (GRA) is an important part of grey system theory, and plays an indispensable role in analyzing the relationship between the system factors [
33,
34]. Grey correlation analysis is a multifactor statistical analysis method based on the sample data factors, for which the grey correlation degree is used to describe the strength, size, and order of the relationship between the factors. Grey correlation’s overall comparison mechanism allows for the various complex relationships to be studied and, therefore, offers a stronger resolution. This method overcomes the lack of regression analysis and stochastic process theory, has a low data demand, and has fewer calculations, thereby providing more comprehensive and objective calculation results [
35,
36]. The combination of the TOPSIS method and the grey correlation analysis method measures sustainable urban development capacity more accurately, as it considers the best and worst from two angles and improves the appropriate degrees for the evaluation system [
37].
To improve the TOPSIS method and solve the reverse problem, grey correlation analysis gives a grey correlation between the ideal solution and the actual situation through the development of a grey correlation coefficient matrix which eliminates the effects of the reverse problem [
38,
39]. Then, the TOPSIS method is applied again to measure the sustainable urban development capacity. This sustainable urban development capacity measurement model is shown in
Figure 2.
To deal with the large-scale index system, first, the model uses PCA to transform the initial indicator data and the main components so that the contribution weight, which has a critical influence on the sustainable urban development capacity, can be determined. Then, using grey TOPSIS theory, the principal component matrix and the sum of the weighted index weights, the grey correlation matrix for the city can be determined. From these results, the distance between the actual city’s condition and the ideal solution can be determined, which indicates the current sustainable development capacity of the city.
3.2. Measurement Steps
The specific steps for the determination of sustainable urban development capacity measurement are as follows:
Step 1: Process the initial data. First, the inverse index is converted to positive indicators so that it can be easily compared. Then, the conduct indicators are ”standardized” to eliminate any dimension and magnitude differences between the indicators.
Step 2: Calculate the eigenvalues, the variance contribution rate, and the cumulative variance contribution rate of the main indicators that affect the sustainable development capacity. The greater the variance contribution for the common factors, the more important the variable’s contribution.
Step 3: Determine the main components and construct the main component for the summation matrix
. Generally, a cumulative variance contribution rate of more than 85% in the m-th components indicates that these contain most of the information, so the m-th component can be determined to be the main component. This main component is calculated as follows:
Step 4: Build the weighted standardized matrix
, and determine the positive ideal solution
:
where
is the contribution rate weight vector for the main component, and
is the main component summation matrix.
Step 5: Calculate the grey correlation coefficient
between the urban indicators and the positive ideal solution. The grey correlation coefficient matrix
is then determined, where
indicates a positive solution and
indicates a negative ideal solution in the grey correlation coefficient matrix:
In the formula, ρ is the resolved coefficient, the general value for which is 0.5.
In the formula: represents the j-th indicator, which is the efficiency index, and represents the j-th indicator, which is the cost index.
Step 6: Determine the distance between the sustainable urban development capacity, the positive ideal solution , and the negative ideal point .
The larger the value of , the stronger the sustainable urban development capacity; on the contrary, the smaller the value of , the weaker the sustainable urban development capacity.
4. Case Analysis
From the established index system, we selected thirteen cities in Jiangsu province, China, as the research objectives and use the PCA-Grey TOPSIS model to measure the sustainable urban development capacity of these cities, the index data for which were taken from the 2013 Chinese City Yearbook. The Jiangsu cities index data used were as shown in
Table 2.
Using SPSS software for data preprocessing and the principal component analysis, the results are shown in
Table 3.
Table 3 shows that the contribution rate of the first five components reached more than 85%, and it can be seen that the eigenvalues for these components were all greater than 1. Therefore, it can be surmised from these results that these five components are the key indicators for the sustainable development urban measures (Named
). From a rotation of these five principal components’ variance contribution rates, the contribution rate for the main component index weights can be determined as:
In addition, the rotation matrix composition for the five main component indices can be determined (
Table 4).
In
Table 4, fixed asset investment, real estate investment, urban construction investment, endowment insurance numbers, medical insurance numbers, unemployment insurance numbers, and education investment can be seen to have a major influence on the main component
, which represents social construction and security work. Sewage treatment, garbage disposal rate, dust removal, green area, green coverage rate and urban road area, can be seen to have a major influence on the main component
, so
can be classified as urban environmental construction work.
,
, and
have only small contribution rate differences, and so can be collectively referred to as the economic development in the city.
The weighted sum of the contribution weight vector and the main components rotation matrix are calculated using Equations (2)–(4) to find the grey correlation coefficient matrix (
) for the sustainable city development index system, as shown in
Table 5.
From Equation (5), the positive ideal solution and the negative ideal solution for the grey correlation coefficient matrix were determined.
Equation (6) was used to calculate the distance
between the positive ideal point and the various cities under test, and the distance
between the negative ideal point and the various cities under test. Equation (7) was then used to calculate the relative proximity (
) between the city and the positive ideal solution, the results for which are shown in
Table 6.
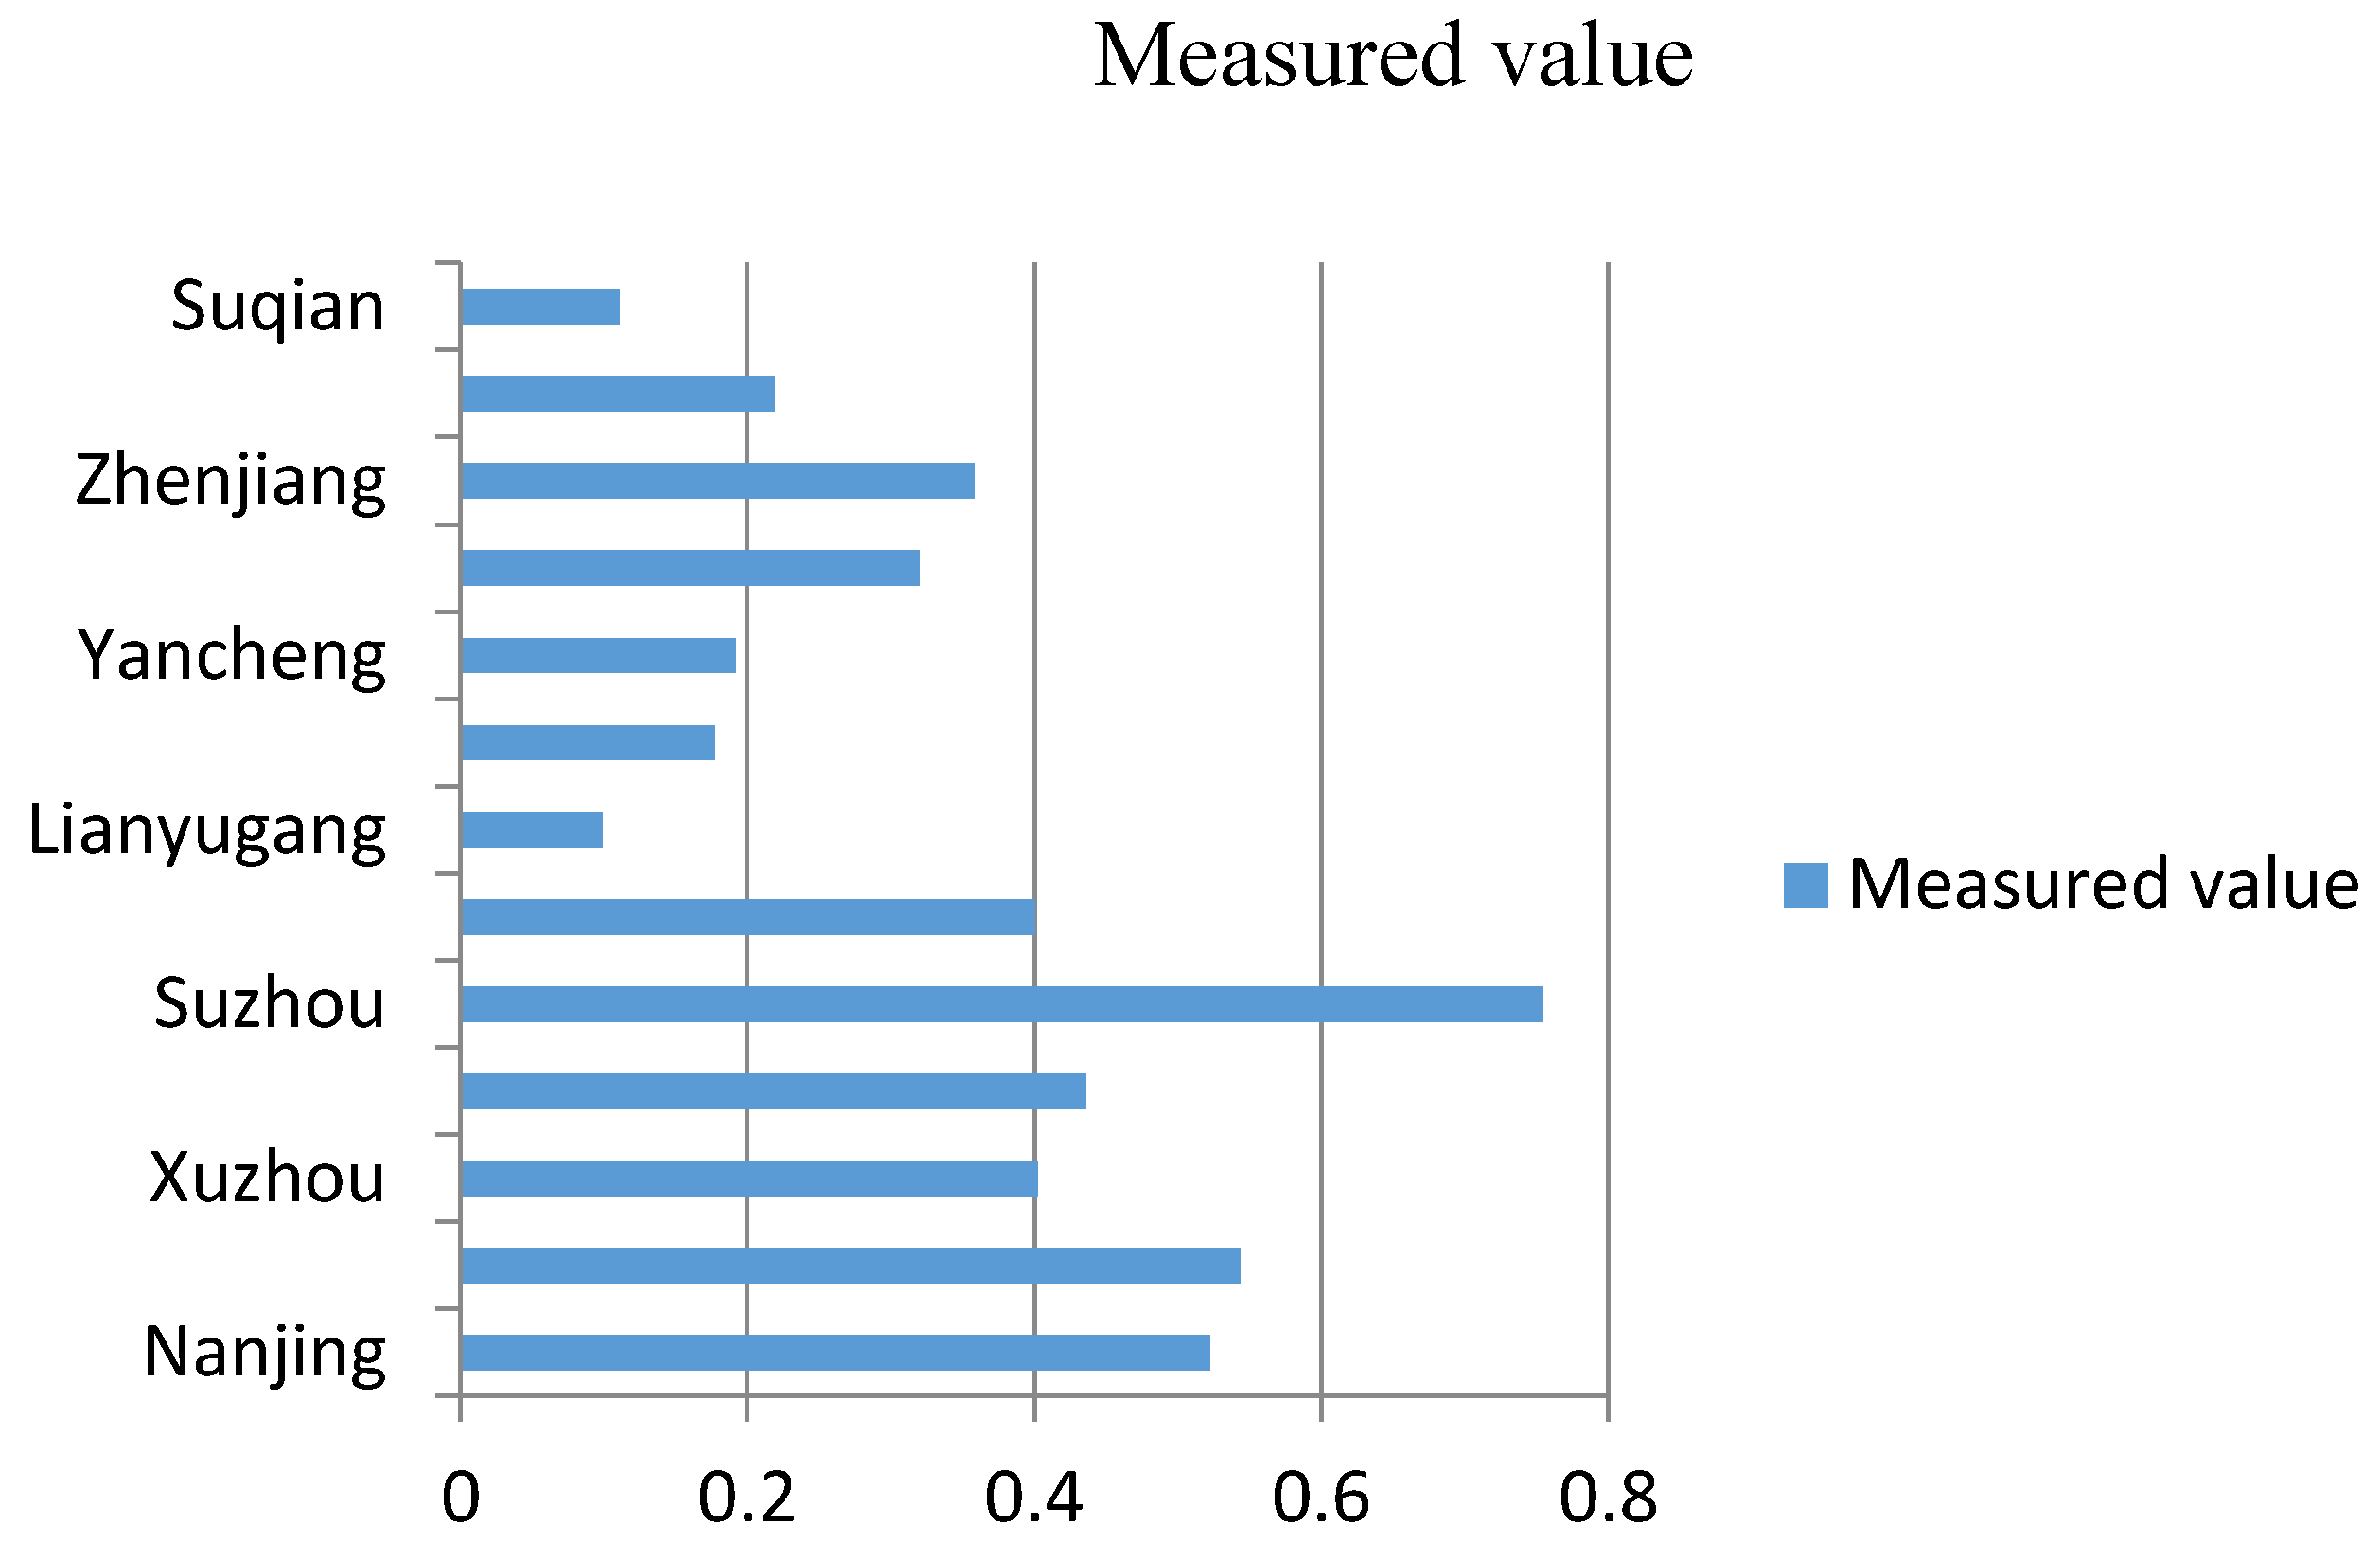
Observation of the actual measurement value for the sustainable urban development capacity and the differences between the renewable development capacities between the cities was more intuitive (
Figure 3), as follows:
From
Table 6 and
Figure 3, we can directly see that Suzhou’s sustainable development capacity was the strongest in Jiangsu province, with a measured value of 0.754. The sustainable development capacity for Wuxi and Nanjing were 0.543 and 0.522. Lianyungang’s sustainable development capacity was the weakest, with a measured value of only 0.099. When Suzhou’s indicator data were further analyzed, we can see that highest index data in Suzhou were environmental construction, social security, and economic development, ranking the sustainable urban development capacity in Suzhou the highest. However, of the 13 cities, Lianyungang’s indicator data were not competitive and the sustainable urban development capacity in Lianyungang was the lowest.
Through our investigation of the contribution rate weight of the five main sustainable urban development capacity components, here we propose some suggested measures to promote sustainable urban development capacity.
(1) Urban harmony is the basis for urban sustainable development. When seeking to ensure the sustainable development of a city, it is imperative to focus on social security and increase funding to social programs to enable a strengthening of the social security system and urban infrastructure construction. In addition, urban development structure needs to be rationalized to ensure that good social order in the city is established to provide a good living environment for residents.
(2) A good ecological environment is a prerequisite for sustainable urban development. Therefore, urban infrastructure development efforts, such as green development, resource recycling, energy conservation, and related areas must be improved. This can be done by developing new energy sources, promoting a comprehensive utilization of resources, protecting ecological resources, and developing a circular economy.
(3) Economic development is a driving force for sustainable urban development. To maintain sustainable economic development, urban economic structures need to be scientifically investigated to enable improvements in the bearing capacity of the city and to develop the suitable infrastructure to promote potential urban industries. Further, depending on each city’s comparative advantages, the city’s weak industries need to be strengthened to encourage harmonious development.


