1. Introduction
The rapid urbanization associated with explosive population growth has brought great challenges to the environment and intensified pressures on land demand. During the process of land resource exploitation in mountainous terrain, fragile ecosystem and complex terrain conditions make these areas more susceptible to severe environmental disasters [
1]. Landslides are especially prevalent in mountainous terrains [
2], which always induce serious economic, human and environmental losses throughout the world. From 1900 to 2014, landslides accounted for nearly 40% of global natural hazards according to the International Disaster Database [
3] Landslide susceptibility is the likelihood of a certain region favorable to landslides on the basis of given geological and terrain conditions. Identifying the region’s susceptibility is very important to avoid landslide damage or to reduce losses caused. It is difficult to accurately predict the time and location of landslides over a large region. However, it is possible to evaluate a certain region’s potential for landslides through landslide susceptibility mapping (LSM). In the past two decades, LSM has become a very important and effective way to assess landslide disasters [
4]. The results of LSM can be used for land management and landslide hazards mitigation.
During the past two decades, many studies on LSM were carried out on geographic information systems (GIS), which are efficient tools for integrating and analyzing a large quantity of geographical data [
4,
5]. General reviews of LSM were conducted by [
2,
4,
5,
6,
7]. Generally speaking, methods of LSM can be grouped into qualitative methods and quantitative methods. Both of the qualitative and quantitative methods for LSM incorporate the idea of ranking and weighting the predictive factors involved. In these approaches, weights were assigned to landslide predictive factors and were then combined to produce the landslide susceptibility index (LSI). The biggest difference between qualitative methods and quantitative methods is the degree of objectivity. The qualitative approaches usually involve a high degree of subjectivity, because these approaches are built on the experts’ knowledge and experience for ranking and weighting the landslide predictive factors. Typical examples of qualitative methods include inventory mapping, expert evaluation and the analytical hierarchy process (AHP) method [
8,
9,
10,
11]. Some semi-quantitative approaches also incorporate geomorphologic analysis and objectively ranked weights of predictive factors [
8,
12].
As a comparison, the quantitative methods are based on statistical analysis to give some numerical expressions of the relationship between controlling factors and landslide occurrence using statistical or geotechnical analysis based on the physical model [
13]. These statistical analyses are built on the basic assumption that areas with critical factors contributing to the past landslides will also be favorable to future landslides [
6,
7]. Some of the quantitative methods are bivariate and some of them are multivariate. Typical examples of quantitative methods are frequency ratio (FR) [
14,
15], information value model [
16], weight of evidence (WoE) [
17] and logistic regression (LR). In addition, some machine learning methods, such as support vector machines (SVM) [
18,
19], artificial neural network (ANN) [
20] and backpropagation artificial neural networks (BPANN), have become increasingly popular in recent years. Many comparative studies of these methods have been conducted, such as [
11,
21,
22,
23]. In bivariate analysis (BA), each landslide-predictive factor is overlaid with a historical landslide inventory map, and the weight based on landslide densities is calculated for each corresponding categories within the factor. The relative contribution of different factors is not assessed in BA. One the other hand, the interactions between the landslide predictive factors are encountered in multivariate analysis (MA). The weights of the factors indicate the relative contribution of each of these factors to the degree of landslide occurrence.
The main purpose of the present study is as follows: (1) to propose an integrated method that synthesizes the expert evaluations method and statistical method to assess the landslide susceptibility and; (2) to produce a susceptibility map of the study area using the proposed integrated method in order to evaluate its performance. Two frequently used and already tested LSM methods, AHP and FR, are employed as the representative subjective and objective methods. The AHP is a multi-criteria methodology designed for hierarchical representation of a decision-making problem [
24] and has gained wide application in LSM [
9,
11]. The AHP can be easily adopted in a GIS to facilitate the production of landslide susceptibility maps with powerful visualization and mapping capabilities [
25]. The FR method is one of the most common methods used in the statistical analysis of landslides, which is based on the relationship between the spatial distribution of landslides and each conditioning parameter. The proposed integrated method was tested at Tsushima Island, Japan. This main part of paper is organized as follows: In
Section 2, a historical landslide inventory of the study area and seven landslide predictive factors were introduced; In
Section 3, an integrated method of AHP and FR was proposed and applied in the study area following the three main procedures. In Subsection 3.1, each predictive factor maps were overlaid with the landslide inventory map, and the objective FR method was employed to assess the subclasses’ weights within each factor; In Subsection 3.2, the subjective AHP method was used to weight the relative contributions of each predictive factor. In Subsection 3.3, a weighted linear combination of the normalized subclasses’ weights and factors’ weights were used to produce the landslide susceptibility index (LSI). Furthermore, the conventional AHP and FR methods were also performed on the study case. In
Section 4, the landslide susceptibility maps were produced and a validation analysis was implemented to evaluate the performance of the proposed method as well as a comparison with the conventional AHP and FR methods. Finally, some conclusions were drawn in
Section 5.
2. Study Area and Datasets
In this study, Tsushima Island was taken as the study area. Tsushima Island is located in the Korea Strait between the Japanese mainland and the Korean Peninsula. The entire island covers an area of 710 km
2, extending about 82 km from north to south and about 18 km from east to west (
Figure 1). Tsushima is naturally divided into south and north parts, connected by a long and narrow strait. Forest, grassland and cropland dominate the study area. Eighty-nine percent of the entire island is the covered by forests and grassland. Tsushima Island has a typical island landform with hills and a mountainous inland and plains along the coast. The elevation of the study area ranges from 0 to 649 meters sea level. The terrain of the island varies from gentle to steep slopes and the drainage network is well developed. The island belongs to an active tectonic zone manifested by faults, thrust zones and folds. The main geological units in the study area are (a) marine and non-marine sediment rocks (81%); and (b) Felsic plutonic rocks (15%). In these two types of rock units, the majority of landslides took place in the marine and non-marine sedimentary rock units. Tsushima has a subtropical marine climate strongly influenced by monsoon winds from June to October. The mean annual precipitation could reach as high as 2000 mm. Heavy rainfall during the typhoon seasons was the primary triggers of landslides in the study area. Landslides mainly occur in western parts of this island. Numerous serious landslide events are related to heavy rainfall and to unstable zones located on steep slopes [
26,
27].
Based on the basic assumption that areas with critical conditions contributing to the past landslides will also be favorable to the future landslides, a database was designed and developed within the GIS environment to facilitate LSM. This database consists of two main parts: (1) the background conditions, representing the geographic and topographic factors (slope, lithology, land cover, etc.), which contribute to the past landslide occurrence; and (2) the historical landslide inventory dataset. A dataset that represents previous landslides, which is the most critical information layer to carry out quantitative statistical analysis of LSM.
2.1. Historical Landslide Inventory
The landslide inventory of Tsushima Island was extracted from the Japan landslide database provided by National Research Institute for Earth Science and Disaster Prevention (NIED) of Japan covering a time period of 1950–2013 [
28]. Following the classification presented by [
29], in this study, only translational landslide and rotational earth slides were examined, while rock slides (such as rockfalls and rock avalanches) and debris flow events are excluded. This landslide inventory dataset consists of 534 landslides presented in a shapefile of polygon features. About 70% of the landslides were randomly selected for the implementation of statistical analysis, the other 30% of the landslides were used for the verification of the results (
Figure 1).
2.2. Landslide Predictive Factor
Landslide occurrence may be a consequence of topographic, geologic or geomorphological, and triggering factors. Numerous landslide predictive factors have been used in producing spatial hazard maps in previous studies [
8,
9,
14,
19,
20,
30]. According to [
31], these factors can be grouped into two types: (1) controlling factors that contribute to landslides potential, such as slope, lithology, topography, geology and hydrology; and (2) triggering factors, such as rainfall, earthquakes and human activities (e.g., excavation at the foot of slope, mining,
etc.). Although there are no standard guidelines for selecting landslide predictive factors for LSM, the nature of the study area, the scale of the analysis, and data availability should be taken into account while performing LSM.
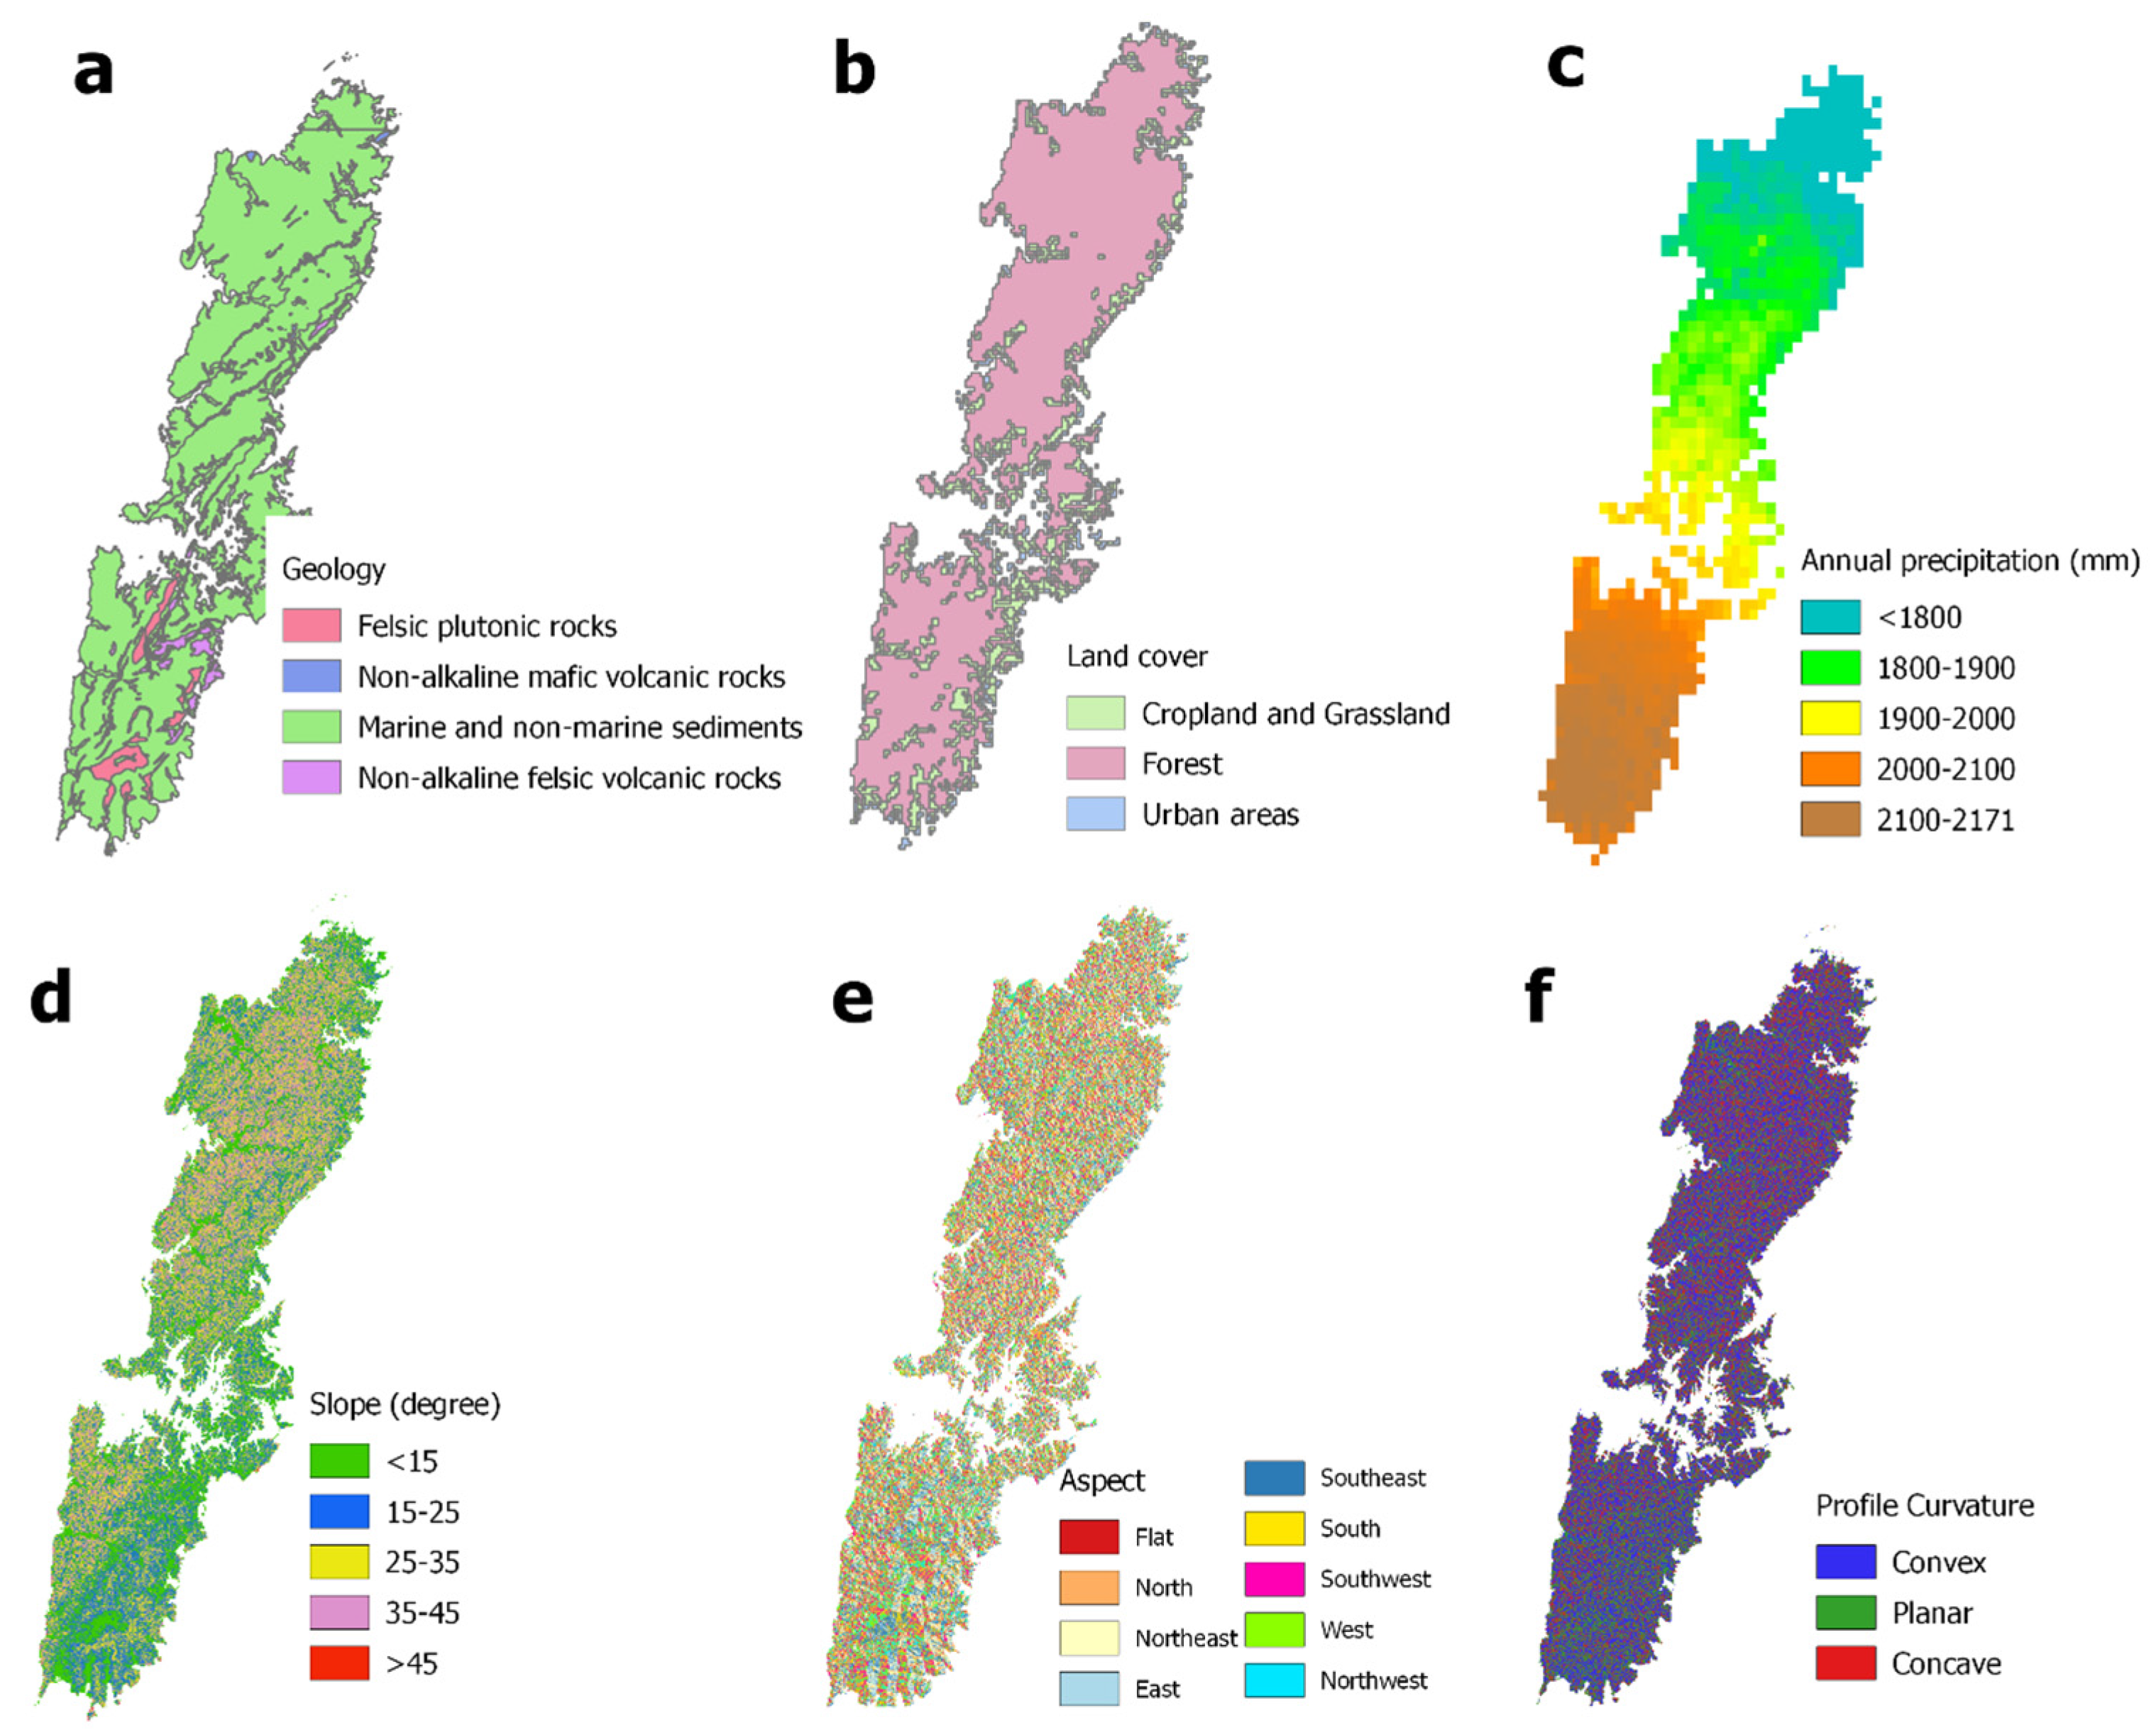
Topography conditions, by controlling surface flow sources, flow direction and soil moisture concentration, play the primary role in limiting the density and spatial extent of landslides. Therefore, significant topography attributes such as elevation, slope, aspect, curvature were extracted from the digital elevation model (DEM) of the study area (
Figure 2). The DEM obtained from Geospatial Information Authority of Japan [
32] with a 10 m × 10 m cell size was used in this study.
The lithological layer of the study area extracted from the Seamless Digital Geological Map of Japan with a scale of 1:50,000 was provided by the Geological Survey of Japan [
33]. The lithology of the study area can be grouped into four categories: felsic plutonic rocks; non-alkaline mafic volcanic rocks; marine and non-marine sedimentary; and non-alkaline felsic volcanic rocks. The marine and non-marine sediment rocks mainly consist of loose deposits formed from clay, gravel soil and pebble soil. The felsic plutonic rocks contain medium-weathered and bedded claystone, slate, shale, marl, and siltstone. The volcanic rocks mainly consist of heavy-bedded sandstone, conglomerate, limestone, shale, silicalite, argillite and intrusive formation. The land cover layer in the region of Tsushima Island was based on European Space Agency Climate Change Initiative (ESA CCI) Land Cover project (2014). The final lithological map and land cover map were transformed into raster value domain in the GIS environment (
Figure 2).
Previous studies have emphasized the need for incorporating dynamic factors with other “static” factors in LSM since these factors are playing a vital role not only in the development of new landslides, but also in the reactivation of old ones. The precipitation data used in this study refers to the mean annual precipitation (MAP) during the period from 1950 through 2000 [
34] (
Figure 2).
3. Methodology
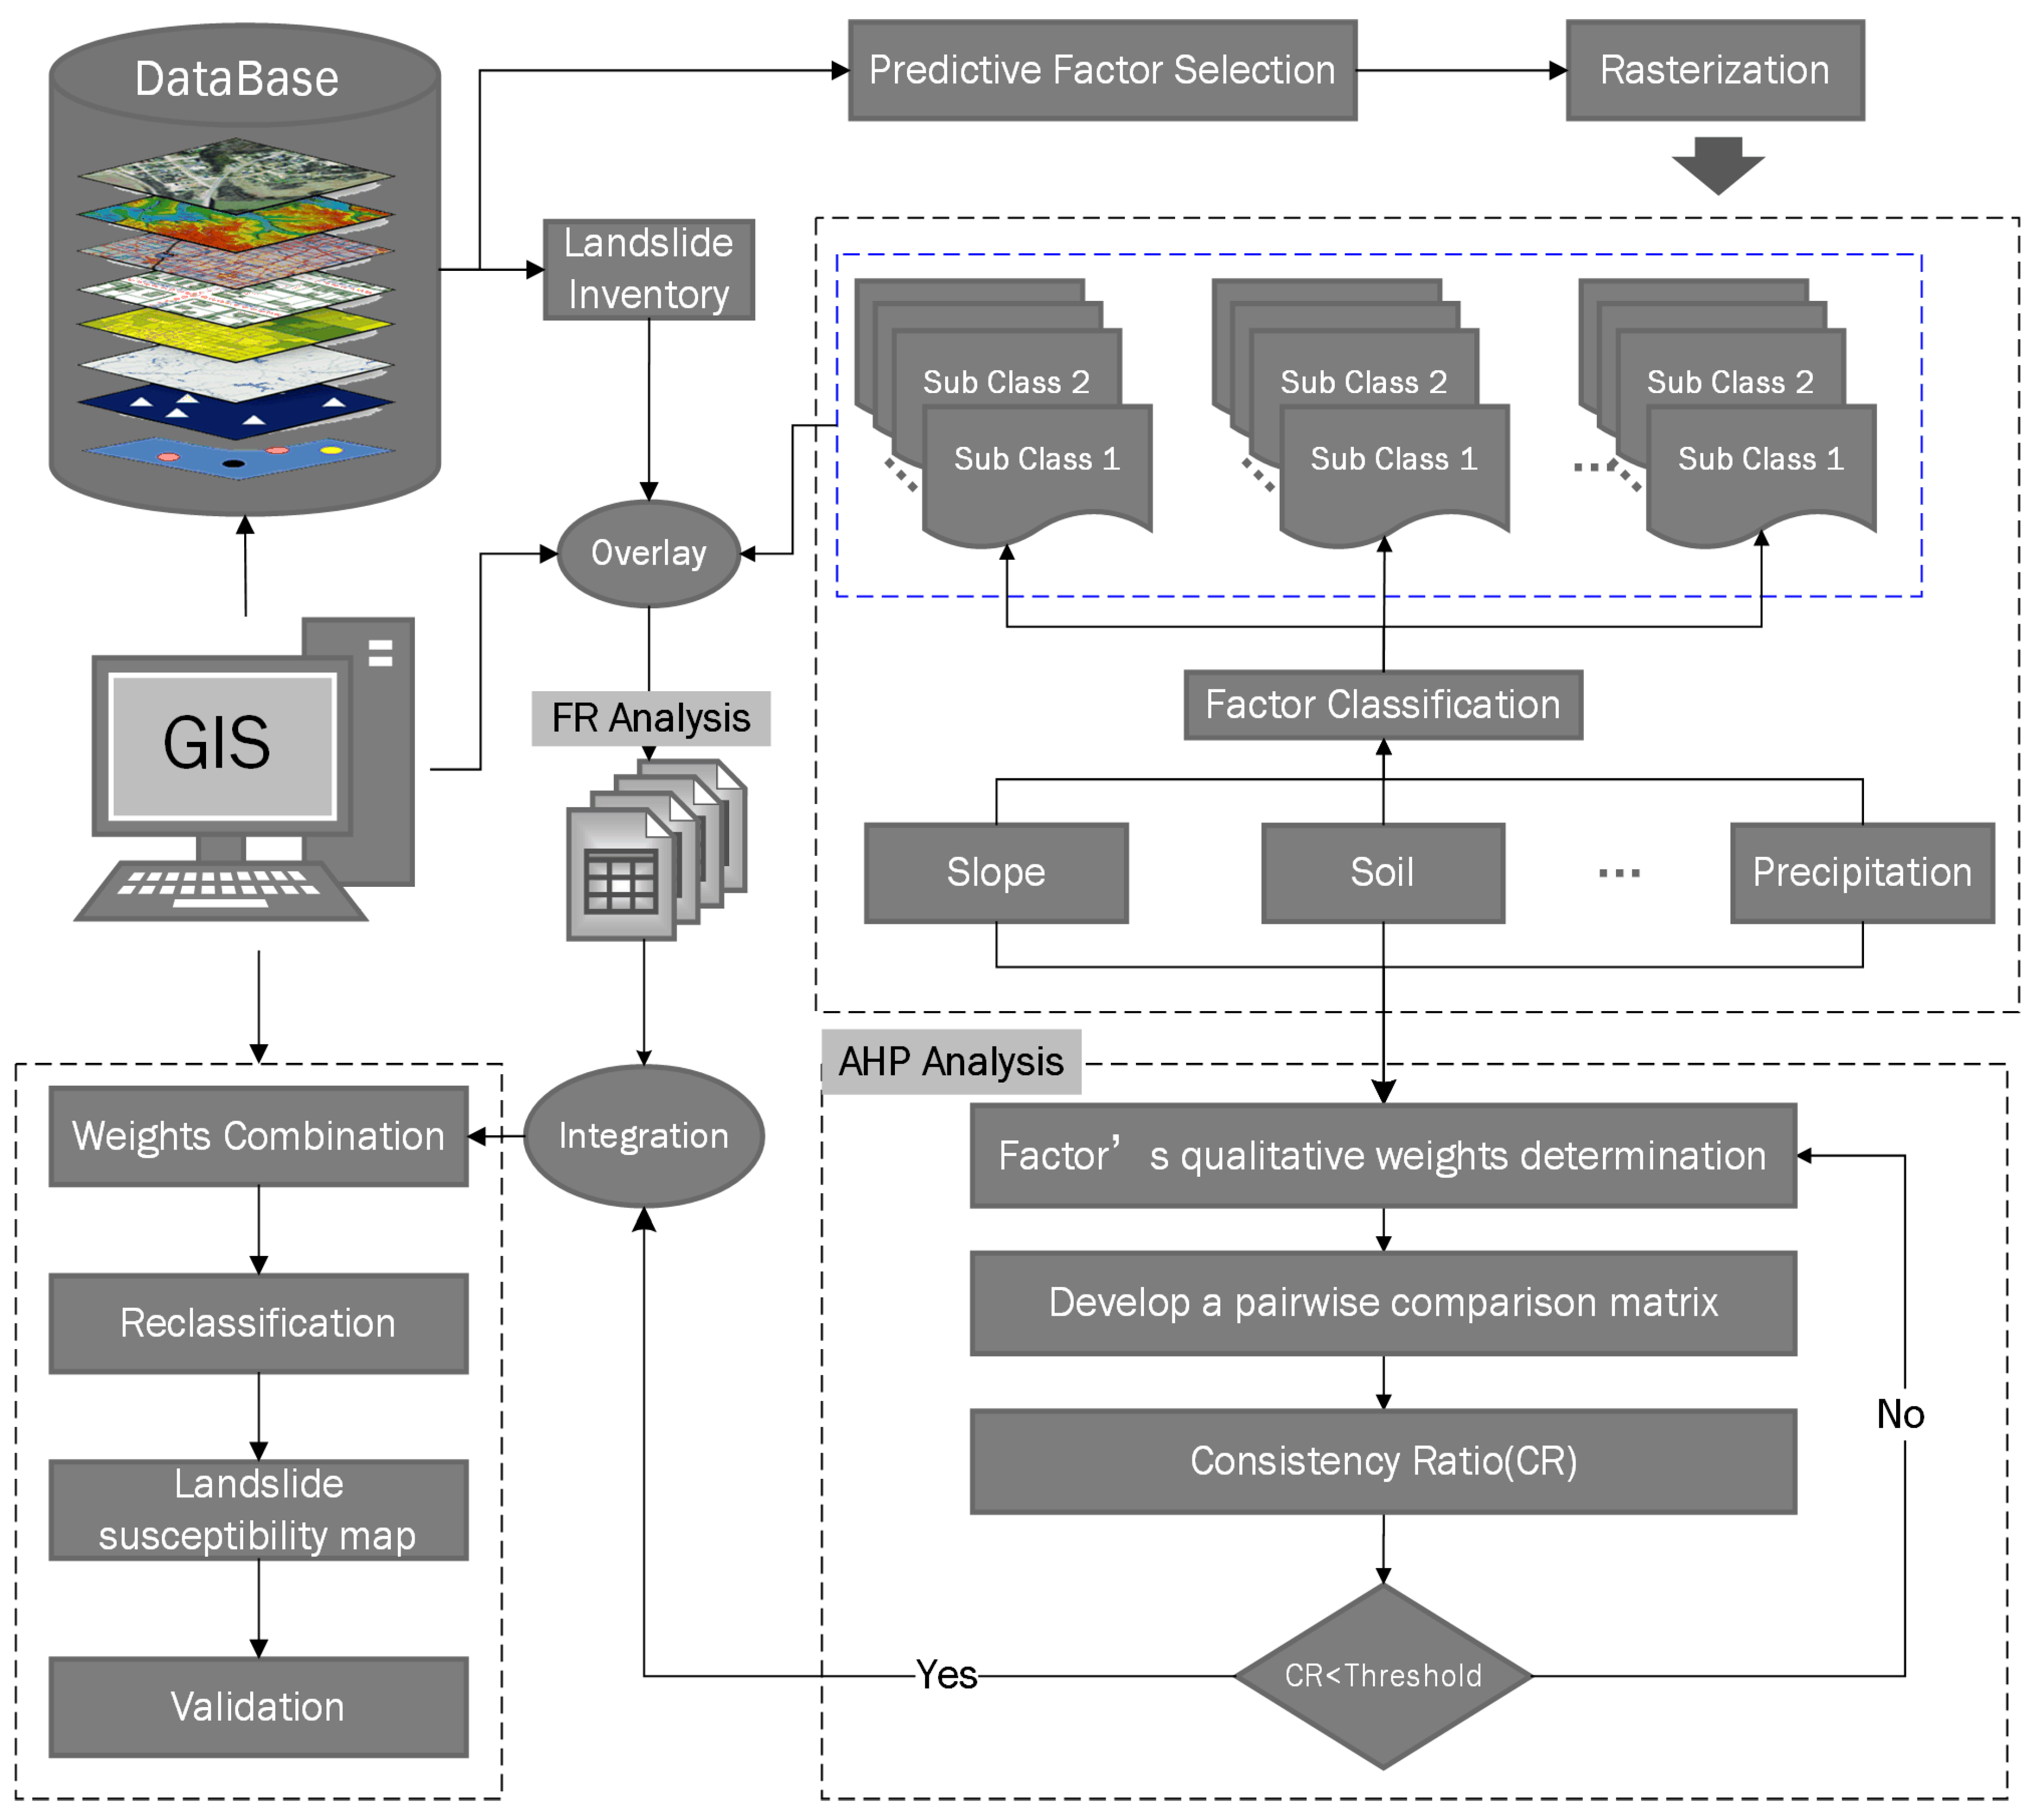
In this study, thematic data layers of all the selected landslide predictive factors were integrated to prepare a landslide susceptibility map using an integrated FR-AHP method on the ArcGIS9.3 platform. Such integration aims at reducing the subjectivity and uncertainty resulting from the conventional use of each single method. The FR method was proposed by [
35] and is based on the relationship between the spatial distribution of landslides and various categories within each conditioning factor. Here, in order to quantify the impact of each factor, the AHP method was used. Five main steps were involved in the proposed method. In the first, classification of the landslide-predictive factors. In the second, the FR method was applied to rate the subclasses’ weight (SCW) within each of all the landslide predictive factors. In the third, the AHP method was used to rate each factor’s weight (FW) in prediction landslide. In the fourth, a weighted linear combination of SCW and FW was made using the raster calculation function in ArcGIS to calculate the landslide susceptibility index (LSI) for each pixel (Equation (1)). It should be noted that all the SCW values within each factor should be normalized before the linear combination. In the fifth, the produced LSI values were reclassified into five classes with respect to five susceptibility zones. The whole process of the integrated FR-AHP method was illustrated in
Figure 3.
where
is the weight of factor i,
is the normalized weight of j
th subclass within factor i, n is the number of factors.
Many classification methods, such as equal intervals, manually defined interval, and natural breaks, can be implemented in a GIS to distinguish the subclasses of landslide predictive factors. Equal intervals classification was not useful for its emphasis on the amount of one class value relative to other classes. Using a manually defined interval classification method, a series of specified interval sizes can be used to define the classes with different ranges based on a comprehensive consideration of the data distribution. The Jenks natural breaks classification method was useful for comparing multiple maps created from different underlying information, giving the best group similar values and maximize the differences between classes. In this study, manual classification with discrete classes was implemented for the factors with continuous values (elevation, MAP, slope, and curvature). For the nominal scale factors (land cover, lithology, and aspect), all categories were preserved (
Table 1).
3.1. Objectively Weighting of Subclasses Using FR
The FR method requires the selection of landslide predictive factors and the classification of these factors. In LSM, the frequency ratio of an area is the likelihood of a landslide occurrence to a non-occurrence for a given attribute [
36]. The frequency ratio of each class within a certain factor can be expressed as the ratio of percent domain of the class and percentage of the total landslide in that class (Equation (2)). The landslide inventory is repeatedly overlaid with each predictive factor, and frequency ratio values of each class get calculated. The FR method follows the principle of conditional probability, in which if the ratio is greater, the stronger the relationship between landslides and factor classes and vice versa. The frequency ratio was then summed to produce the final landslide susceptibility index (LSI) (Equation (3)).
where
is the number of landslides in jth subclass of the factor i,
is the area of the corresponding subclass,
the total number of landslides and
is the total area under investigation.
where
is the calculated frequency ratio for each factors’ class, n is the number of factors.
The LSM using the conventional FR method mainly involved the following three steps:
- (1)
Classification of the landslide-predictive factors.
- (2)
FR calculation for each class of landslide predictive factors. The landslide inventory is overlaid with each predictive factor map, and frequency ratio values of each class get calculated using Equation (2). This step was implemented on every landslide-predictive factor repeatedly.
- (3)
Finally, the LSI was created by summing the FR values (Equation (3)) in the conventional FR method.
3.2. Subjectively Weighting of Factors Using AHP
The analytical hierarchy process (AHP) method first introduced by [
24] is a powerful and comprehensive methodology to reduce a complex decision-making process to a series of pairwise comparisons between alternatives. The AHP method is designed to facilitate sound decision-making by capturing objective data as well as subjective judgments of the decision maker. The AHP method can be implemented for LSM in following consecutive four steps:
- (1)
Dividing the problem into a hierarchy tree analysis. Generally, for LSM, two-stage hierarchies should be developed. The first one is at the factor hierarchy, which is used to rate the factor’s contribution in landslide occurrence (WF). The other is the subclasses hierarchy, which is used to rate the relative contribution of subclasses within each factor in landslide contribution. In order to distinguish the subclasses’ weights here from that derived from the FR method, we name it subjectively determined subclasses’ weights (SSCW).
- (2)
Creating a pairwise comparison matrix of the factors (or subclasses). In the comparison matrix, each factor (or subclass) was weighted subjectively against every other by assigning a series of discrete values between 1 and 9 (
Table 2) based on the relative contribution of factors (or subclasses) to landslide occurrence. The matrix element value “1” means the two factors (subclasses) contribute equally to the landslides occurrence, and ”9” indicates that one factor was significantly more important than the other ones. The reciprocals values (between 1/2 and 1/9) indicate the inverse comparison results.
- (3)
Checking the overall consistency of the pair-wise evaluations to reduce the bias in the decision-making process. The overall consistency was quantified using the eigenvalues of the matrix, which is an indicator of the inconsistencies in a set of pairwise ratings. It was suggested by [
37] that for a consistent reciprocal matrix, the largest eigenvalue λmax is equal to the number of comparisons n. An index of consistency, known as the CR (Consistency Ratio), was thus employed to indicate the probability that the matrix judgments were randomly generated (Equation (4)).
where RI is the average of the resulting consistency index, depending on the order of the matrix given by [
38] (
Table 3). CI is the consistency index that is expressed in Equation (5). This CR is used in order to avoid the creation of any incidental judgment in the matrix and when CR is less than 0.1, as an acceptable level of consistency has been achieved, which indicates an overall acceptable consistency of the pair-wise comparison matrix. Otherwise, the matrix should be revised [
37].
The consistency of the judgment matrix was examined with calculation of the consistency index (CI), which is defined as:
where λmax is the largest or principal eigenvalue of the matrix and could be easily calculated from the matrix, and n is the order of the pair-wise comparison matrix. In the AHP, a measure of consistency ratio (CR) was calculated according to the methodology proposed by [
24].
- (4)
Combining the subjectively determined weights using Equation (6) to produce the LSI.
where
is the weight of factor i (
Table 4),
is the subjectively determined weight of j
th subclass within factor i using the AHP (see
Table 1), n is the number of factors. The checking result of the consistency ratio of shown in
Table 5.
3.3. Weighting Linear Combination Using the Integrated FR-AHP Method
Despite their wide range of applications, the conventional FR and AHP may not fully reflect the full aspects in weighting the predictive factors for landslide occurrence. In the conventional FR method, the factors’ relative contributions were neglected or considered as equal (Equation (3)). However, through bivariate statistics, the weights of subclasses within each factor can be well rated. Furthermore, in the conventional AHP method, the pair-wise comparison matrix brings two much subjectivities and vague problems during the judgment process.
Therefore, in the integrated FR-AHP method, the LSI is a weighting linear combination of subclasses’ and factors’ weights (Equation (1)). The FR values for each subclass with every factor (SCW) (
Table 1) and factor’s weight determined using the AHP (FW) (
Table 4) were taken into consideration. All thematic maps of landslide predictive factors were converted to the raster format for overlaying since overlay analysis can be more powerful with raster data in the GIS.
4. Results and Discussion
4.1. Landslide Susceptibility Maps and Validation
As mentioned previously, we proposed an integrated LSM method according to the FR and AHP approach. This approach allowed for the assessment of landslide susceptibility by integrating expert-based and bivariate statistical modeling methods. The calculated LSI values varied from 3.43 to 11.61, 0.056 to 0.479 and 0.436 to 1.588 for FR, AHP and FR-AHP, respectively (
Table 1 and
Table 4). In each method, the higher the value of LSI, the greater the propensity of landslide occurrence and vice versa.
As indicated in
Table 1 and
Table 4, the most important landslide predictive factors were slope gradient, MAP and land cover with weight values 0.4536, 0.2298 and 0.1135, respectively. Within these factors, the categories “moderate slope (25°–35°)”, “richest precipitation (2100–2171 mm)”, “and “forest land” have the highest importance values (FR values of 1.59, 1.72 and 1.14, respectively). On the contrary, the categories “steep slopes: >45°”, “low precipitation (<1800 mm)” and “urban areas” have the lowest importance values relating to LSM (FR values of 0.41, 0.36 and 0.25, respectively). TRI was the weakest factor in predicting landslides (weight value = 0.0241). For the rest factors, significant high weight values were calculated for the following categories: (a) “high elevation (150–250 m)” (FR value = 1.18); (b) “southeast facing slopes” (FR value = 1.92); and (c) “felsic plutonic rocks” (FR value = 2.69).
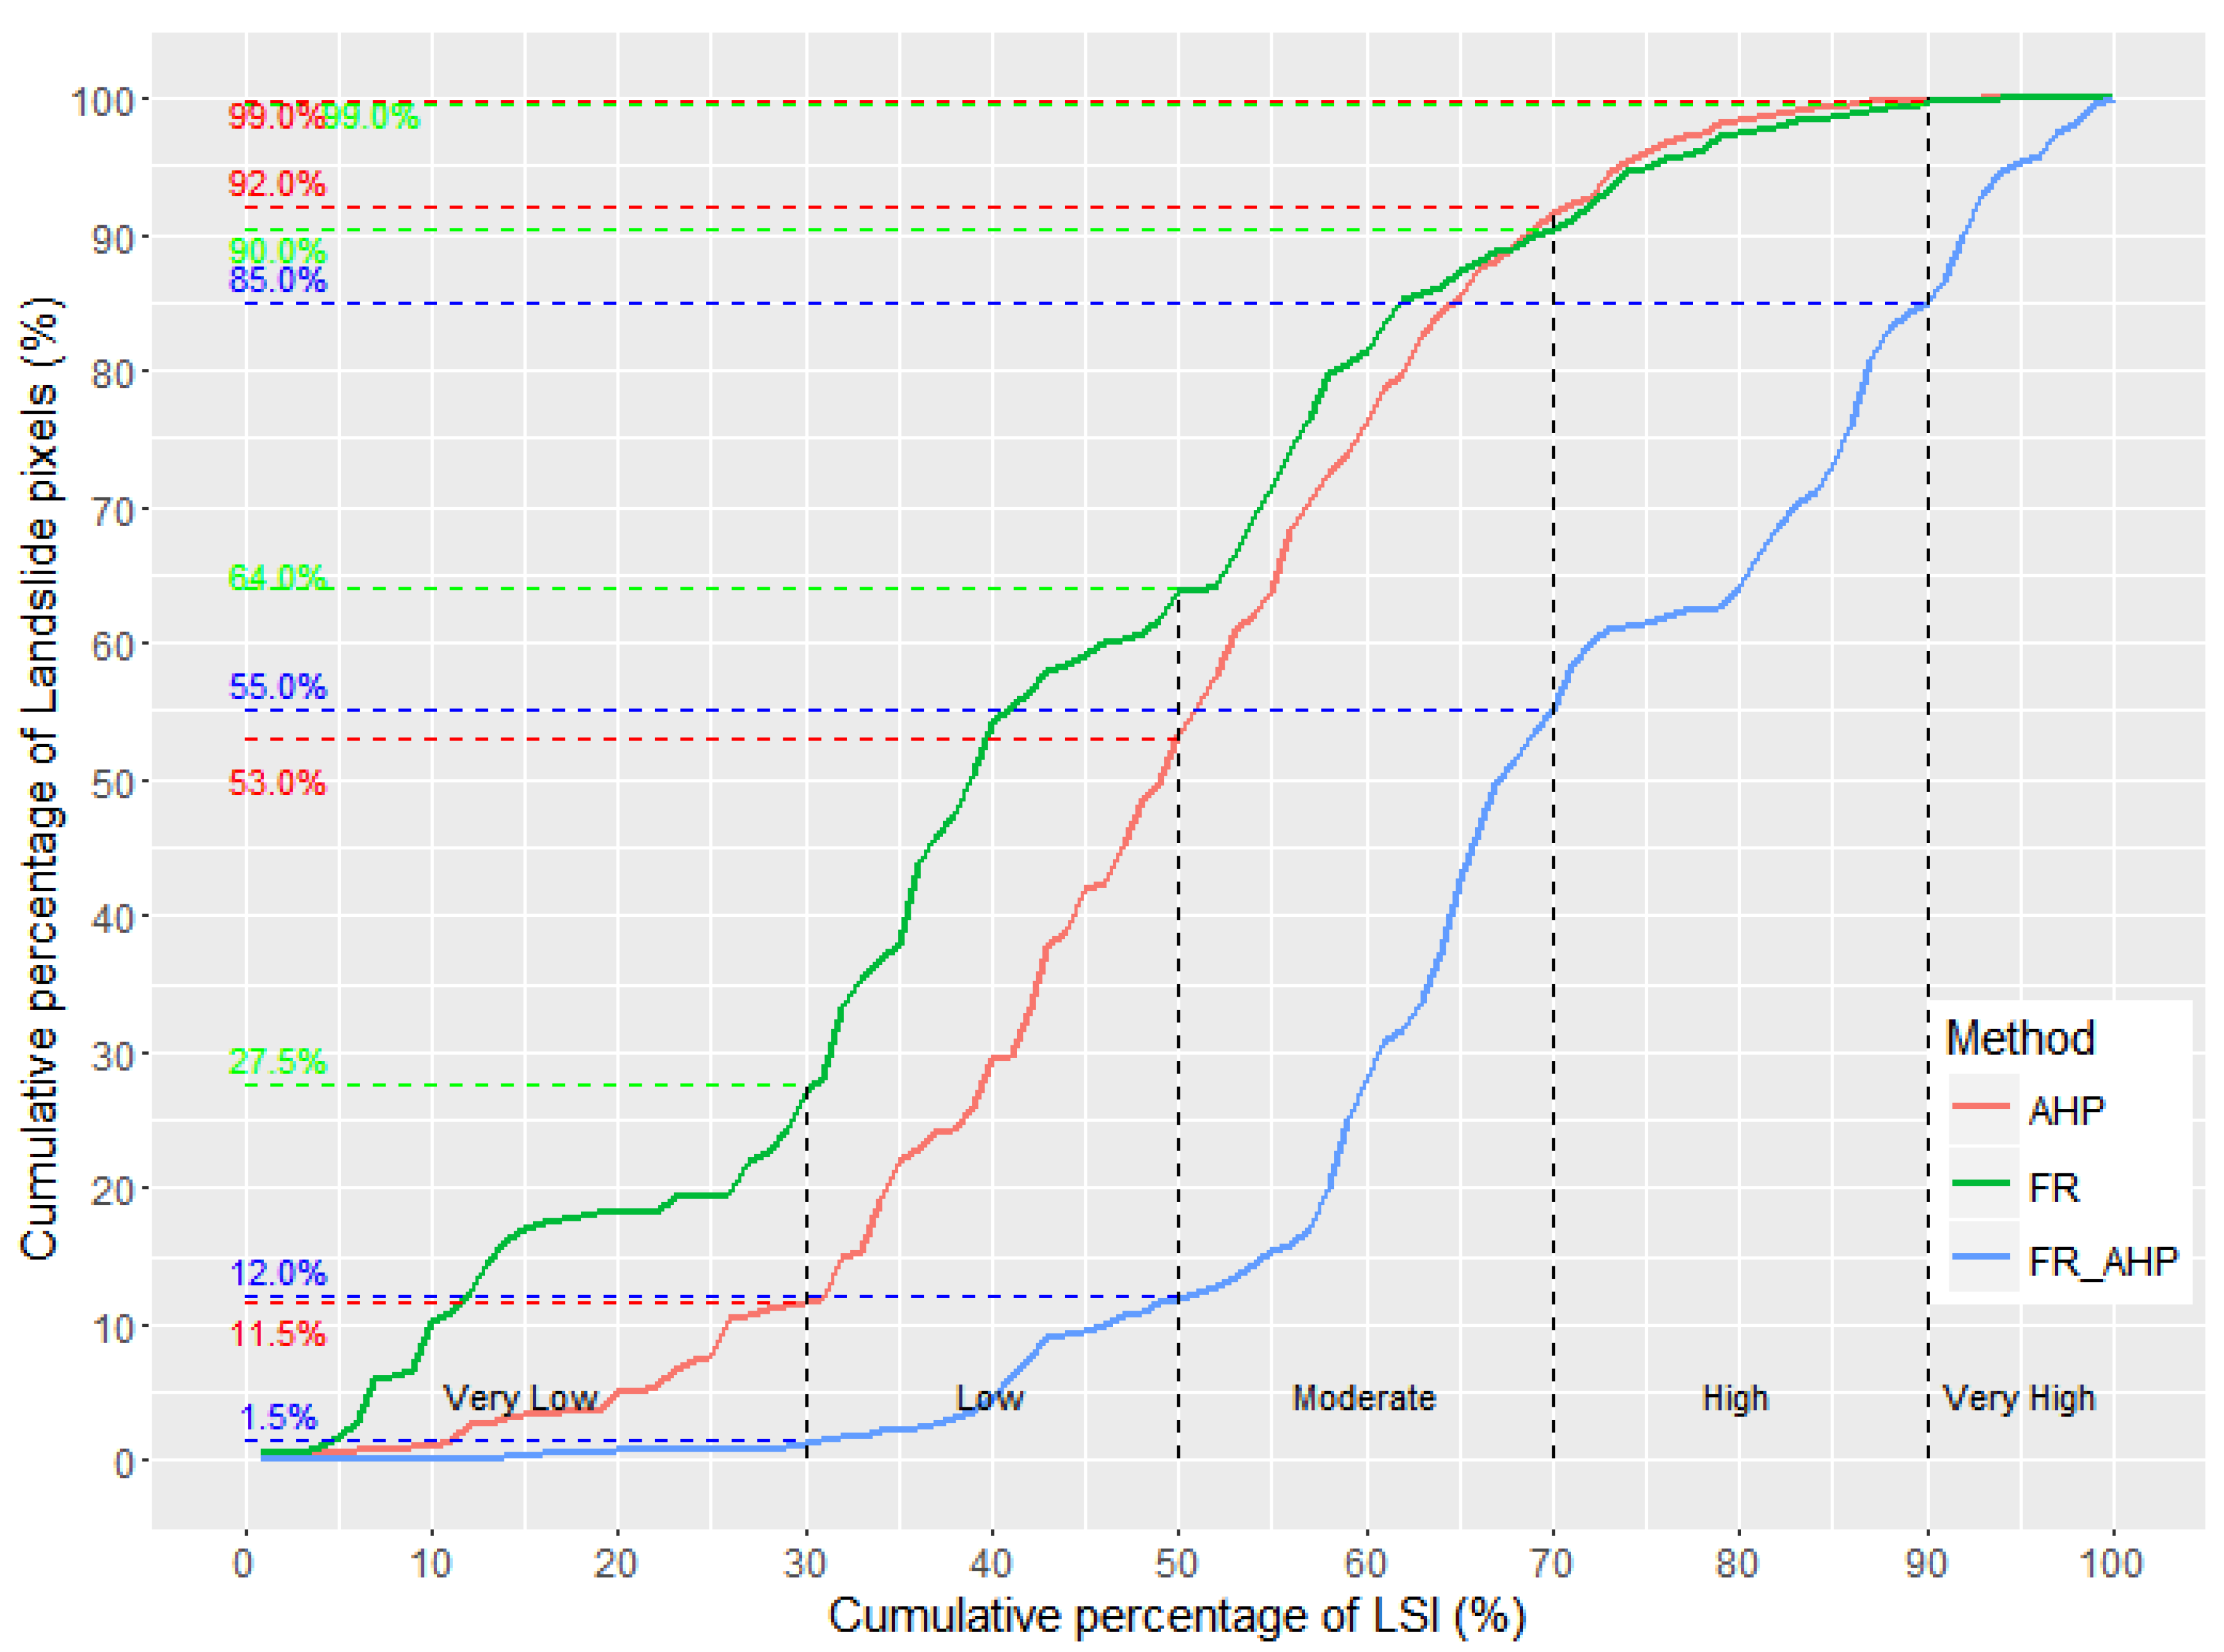
In the last step of LSM, the calculated LSI values were manually categorized into five susceptible classes, namely, very low (VL), low (L), moderate (M), high (H) and very high (VH). As mentioned before, in order to compare the different landslide susceptibility maps, 30%, 50%, 70% and 90% of the highest LSI value were manually selected as breaks to classify the study area into five susceptible zones. The resulting landslide susceptibility maps were shown in
Figure 4.
Various methods have been proposed to validate the accuracy of landslide susceptibility map. The best way is to validate physically in the field. However, it is rather a difficult and impossible job on a regional scale. Therefore, the most popular way to validate the maps is the mathematical and statistical tools such as the computation of relative landslide density (RLD), the receiver operating characteristics (ROC) curve, the chi-square test,
etc. In this study, RLD was used as an index to validate and compare the results. The RLD of each susceptibility class, defined a ratio of landslide area percentage and class area percentage, gives the overall quality of the landslide susceptibility map.
Figure 5 shows the relationship between the LSI and affected pixels. For the FR-AHP method, the overlay of the final landslide susceptibility maps with the landslide validation dataset showed that 15% and 30% (total of 45%) of the landslide events fall within “very high” and “high” susceptibility zones (15.87% of the study area in total), respectively. About 68% of the total area was classified as moderately susceptible to landslides, containing 43% of the landslide events. As a comparison, 20.14% and 1.93% of the total area had a susceptibility classified as “very high” and ”high”, containing 8% and 10% of the landslides.
4.2. Discussions
This study combined a data-driven bivariate method with a subjective method to prepare a landslide susceptibility map on a regional scale (Tsushima Island, Japan). The main goal of this study is to propose an integration model that preserves and integrates the advantages of the combined models at the specific scale of analysis. To achieve this objective, seven conditioning factors (elevation, slope, aspect, TRI, MAP, lithology and land cover) were taken into consideration.
The FR method is a data-driven bivariate-statistical approach built on the basic assumption that “the past will predict the future”. The bivariate statistical technique is one of the preferable methods for regional scale LSM due to its GIS adaptability and mathematical meanings. In this FR method, any imperfections of landslide inventory maps will automatically be inherited by the final statistical results. A complete and qualified landslide inventory was thus a necessary prerequisite in data-driven methods.
On the other hand, in the subjective weighting method, AHP, the historic landslide datasets are no longer essential. A common step in the subjective LSM methods was to invite several experts to evaluate the importance of the landslide predictive factors based on their experience and knowledge. Results from the AHP method may vary while performed by different experts and, thus, may be subjected to subjectivity. This kind of weighting method is purely subjective. However, methods that depend on expert opinions are still useful, especially for large-scale assessments or for areas with no available landslide inventory. The main issue is not to invite as many experts as possible but to invite experts with detailed knowledge of the landslide events in the area under investigation and to ensure an overall consensus of their evaluation about the importance of the factors involved. One of the most important limits for of the AHP method lies in its inability to determine the uncertainty produced by changes in factor ranking [
25]. Because the factor ranking process was subjective in the AHP method, uncertainties associated with this process would thus affect the final produced landslide susceptibility maps. Several studies have focused on the uncertainty of AHP from different aspects, such as the variation of the weighting criteria, uncertainties of spatial and quantitative impacts in the evaluation results and the uncertainty of factor ranking [
25,
39]. In the proposed integrated method, the uncertainty of factor ranking for the subclasses within each classes can be minimized by replacing the subjective ranking values with objective frequency ratio value.
In an ideal LSM model, the RLD should be very high in the most susceptible class and decrease sharply with the reduction of susceptibility level. Generally speaking, with every model used in this study, it can be seen that the distribution of landslides observed in these classes was consistent with the landslide susceptibility level. However, as indicated in
Table 6, when it comes to the very high susceptibility class, the FR-AHP method performed better than FR and AHP methods. The highest RLD value for the very high susceptibility class was 8.20 in the FR-AHP method, while the lowest RLI of that was 0.5 and 0.98 in FR and AHP respectively. Therefore, based on the overall assessment of all classes, the proposed FR-AHP method offered a more accurate result than other the conventional FR and AHP methods.
The results of the FR-AHP method indicated that there are some parts of the study area which seem to configure landslide concentration. The “high” susceptibility areas are concentrated in the southern segment of Tsushima Island. According to the final landslide susceptibility map, the “very high” susceptibility zone only covers a little part of the study area (1.83% of the total area) and most of the island is classified as having a “moderate” susceptibility to landslides. The results also indicate that the most important landslide predictive factors in the study area were slope gradient, MAP and land cover, according to the experts’ weighting. The results also indicated that the triggering factor MAP was more favorable in predicting the landslide occurrence in this regional analysis. The categories with highest mean annual precipitation (2100–2171 mm) have the high weights in predicting landslides.
Additionally, some limitations still exist in the proposed FR-AHP method that should be pointed out. Firstly, we performed a linear combination of the statistical and subjective methods’ results. Although this is a reasonable starting point, alternative non-linear combination ways should be further tested. Secondly, the proposed method was not suitable for detailed site-oriented analysis, since the analysis is performed based on a regional scale. Also, the results’ accuracy highly depended on the quality of the historic landslide inventory. Finally, the mutual relationships between factors (such as conditional independent) with respect to landslide occurrence were not taken into consideration.
5. Conclusions
Statistical analysis and subjective methods are often used in LSM. In this study, an integrated method of a subjective method and a statistical method for estimating the susceptible areas of the landslide was proposed and tested in the study area of Tsushima Island, Japan, on a GIS. Three landslide susceptibility maps of the investigated area have been produced using the new proposed method as well as the conventional FR and AHP methods. The results obtained show that it is possible to produce satisfactory landslide susceptibility maps with the proposed model. The obtained three LSMs were validated and compared using RLI. The validation results showed that the proposed FR-AHP method performs better than the conventional FR and AHP methods. In addition, the subjective weights of factors’ contribution to landslide occurrence ranked by the experts efficiently incorporate the factors and historical landslides in the study area. Thus, to some extent, the expertise of specialists can contribute to the enhancement of the standard statistical methods’ performance.
Even though some limitations exist, the proposed method can produce reliable landslide susceptibility maps on a regional scale. The results from this study can be used as a preliminary reference for regional landslide hazard assessment. Also, the results of this study may provide useful information for decision-makers in future land management and hazard mitigations.


