
Analysis of CO2 Emission Performance and Abatement Potential for Municipal Industrial Sectors in Jiangsu, China


Abstract
:1. Introduction
2. Methodology
2.1. Environmental Production Technology
2.2. SBM-Undesirable Model
2.3. Kernel Density Estimation
2.4. Industrial Abatement Model
3. Empirical Study
3.1. Variable Selection
3.2. Data Collection and Treatment
3.3. Comprehensive Analysis of TFICEE
3.3.1. Evaluation of TFICEE
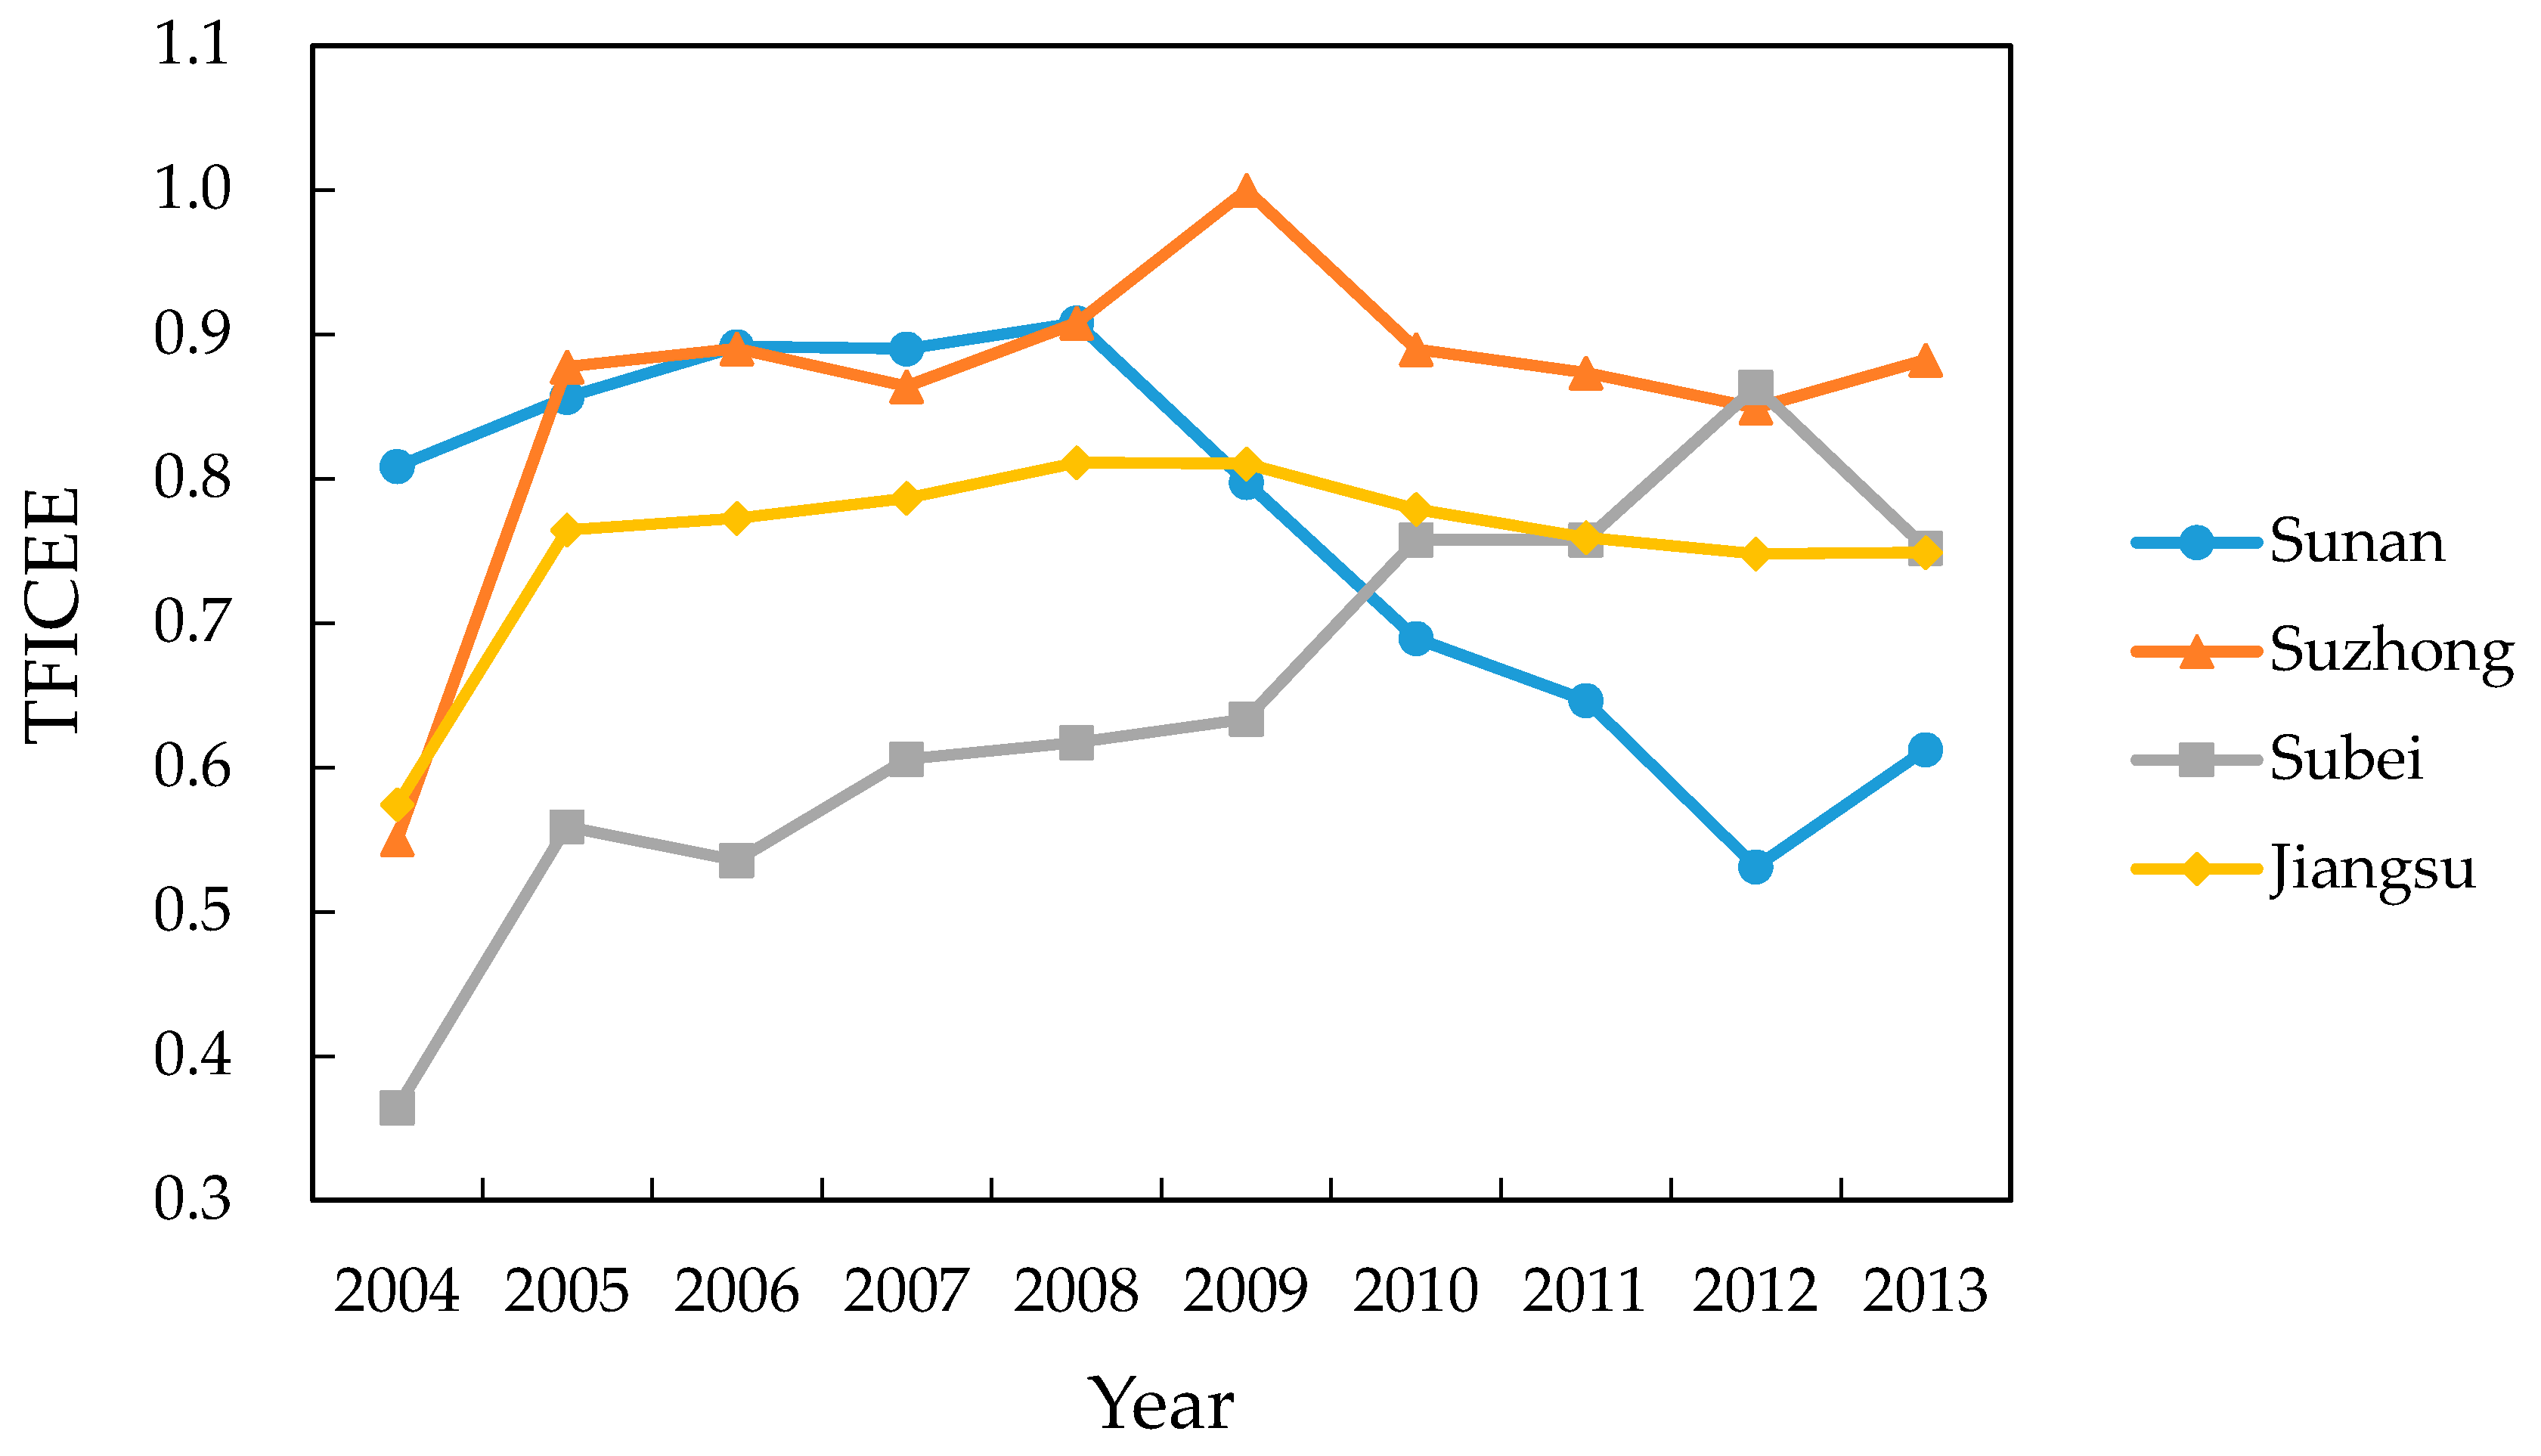
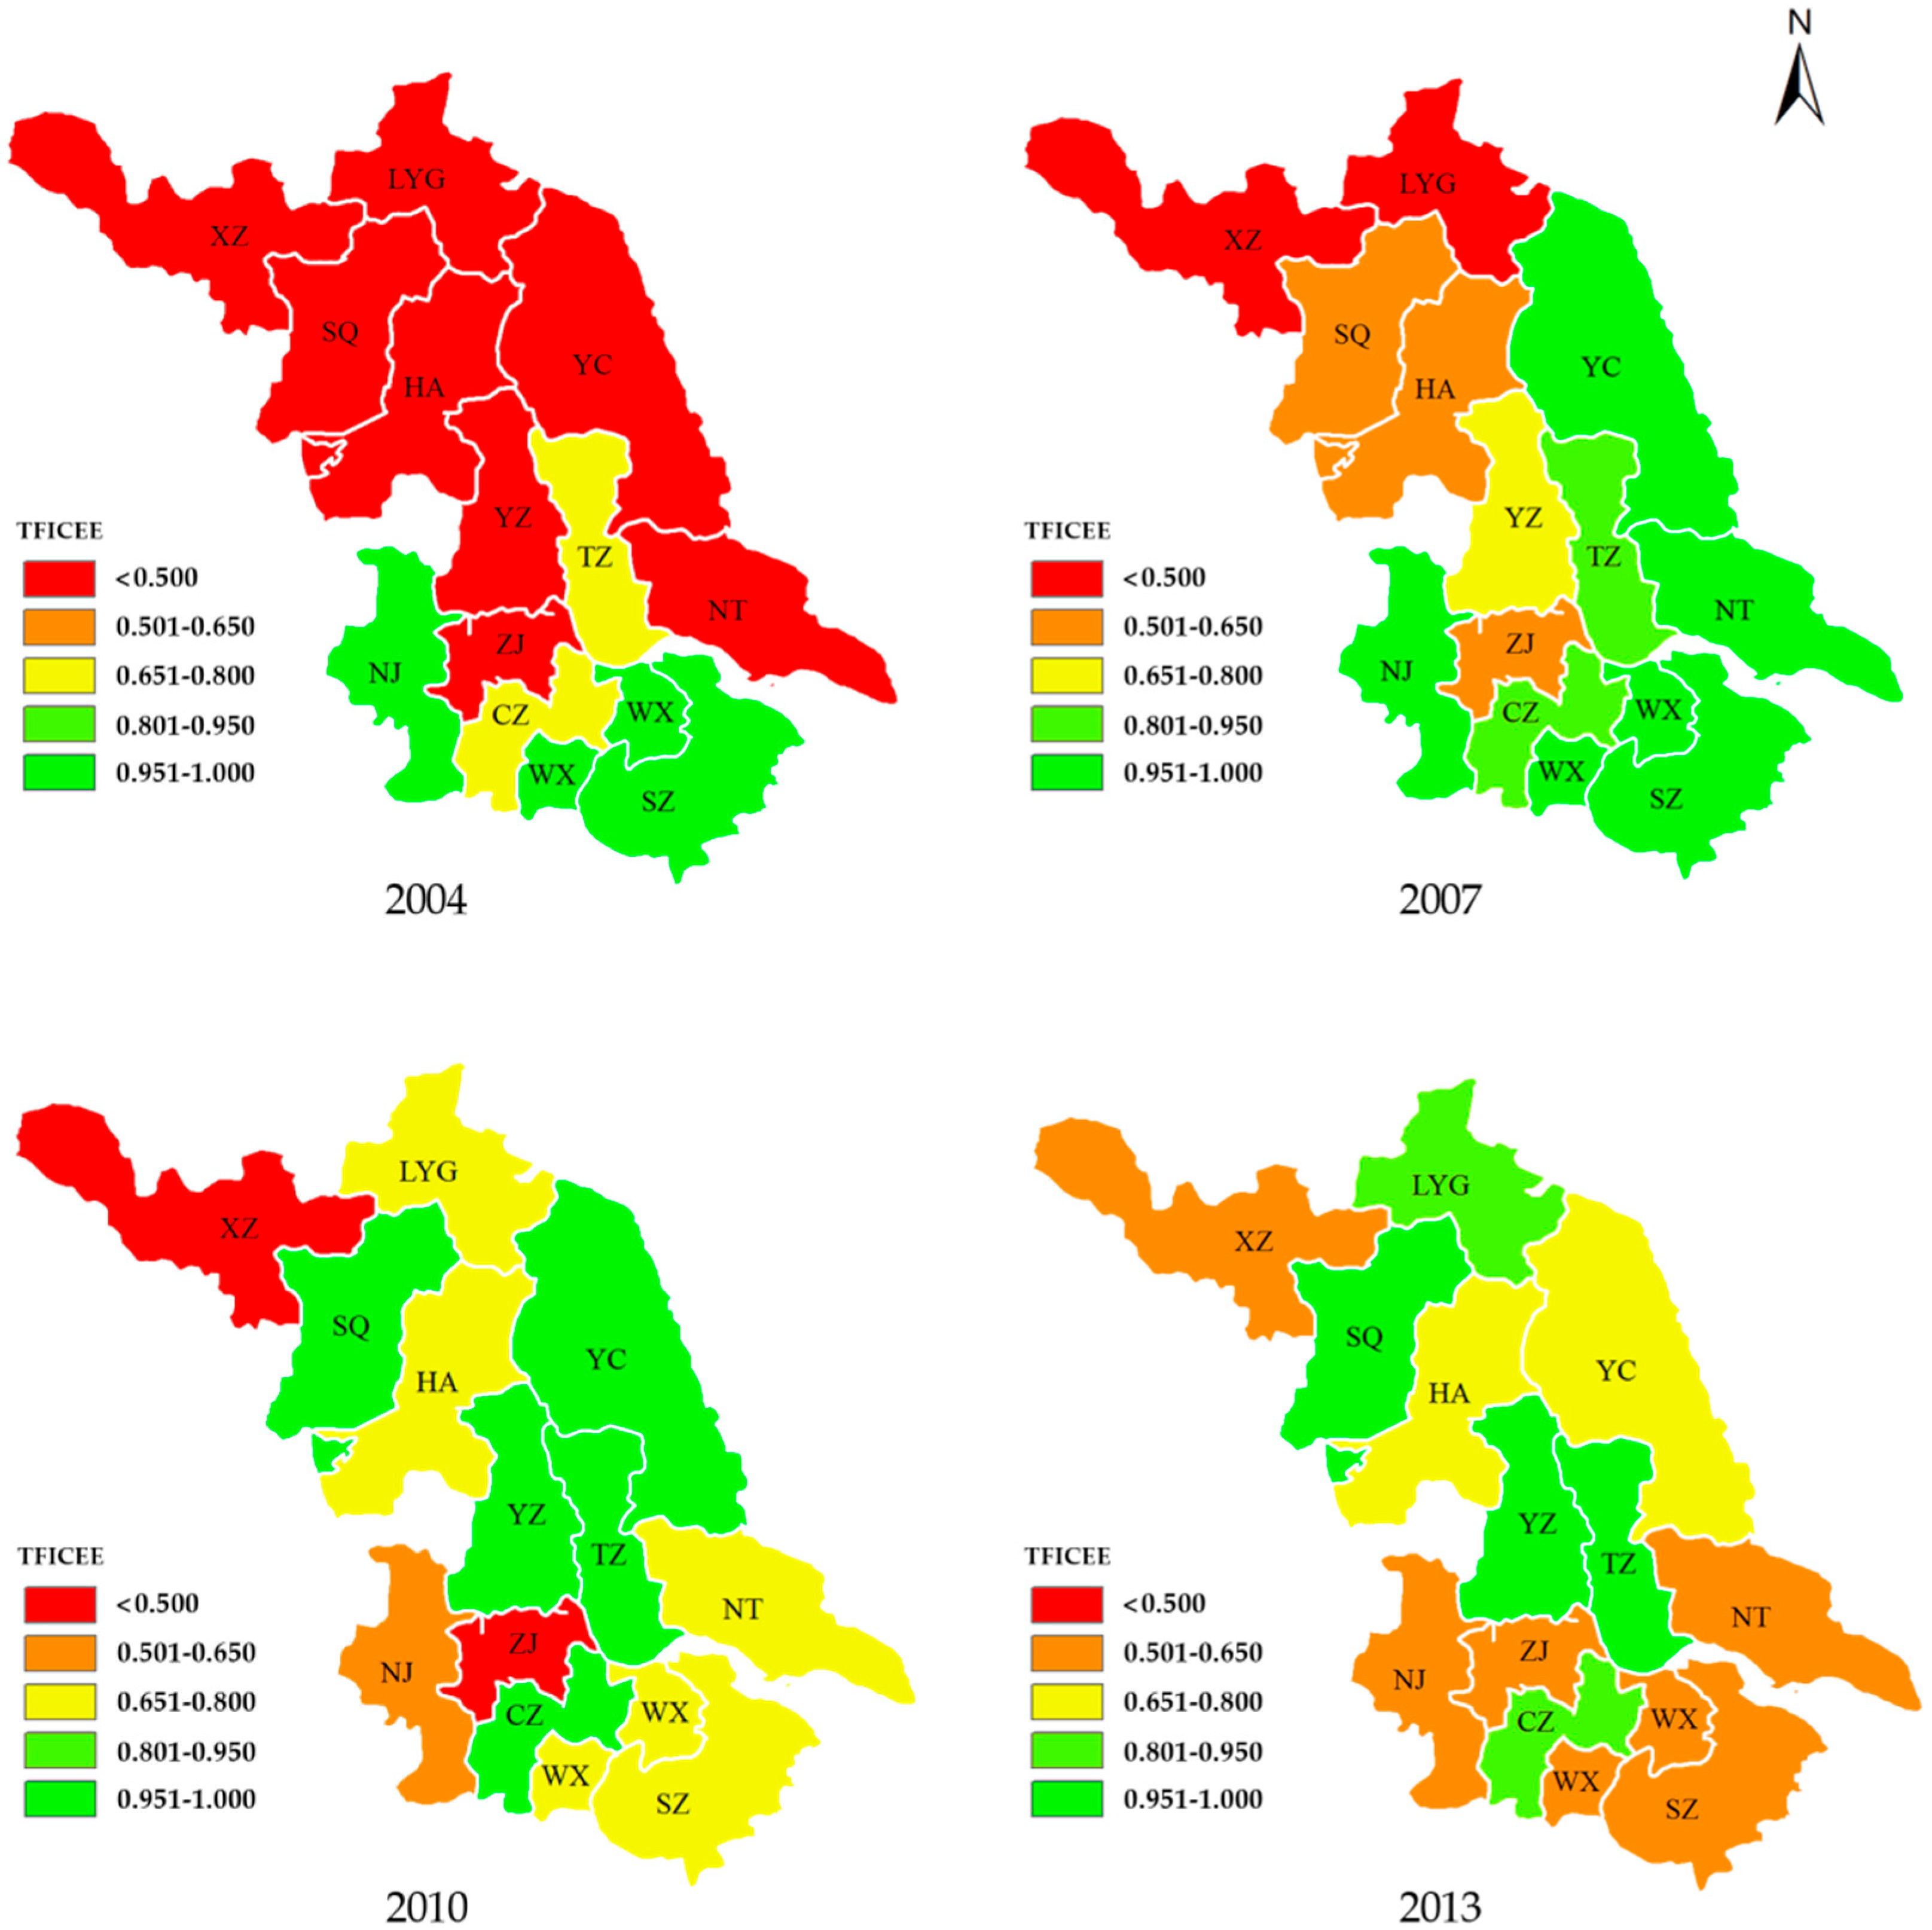
3.3.2. Space-Time Distribution of TFICEE
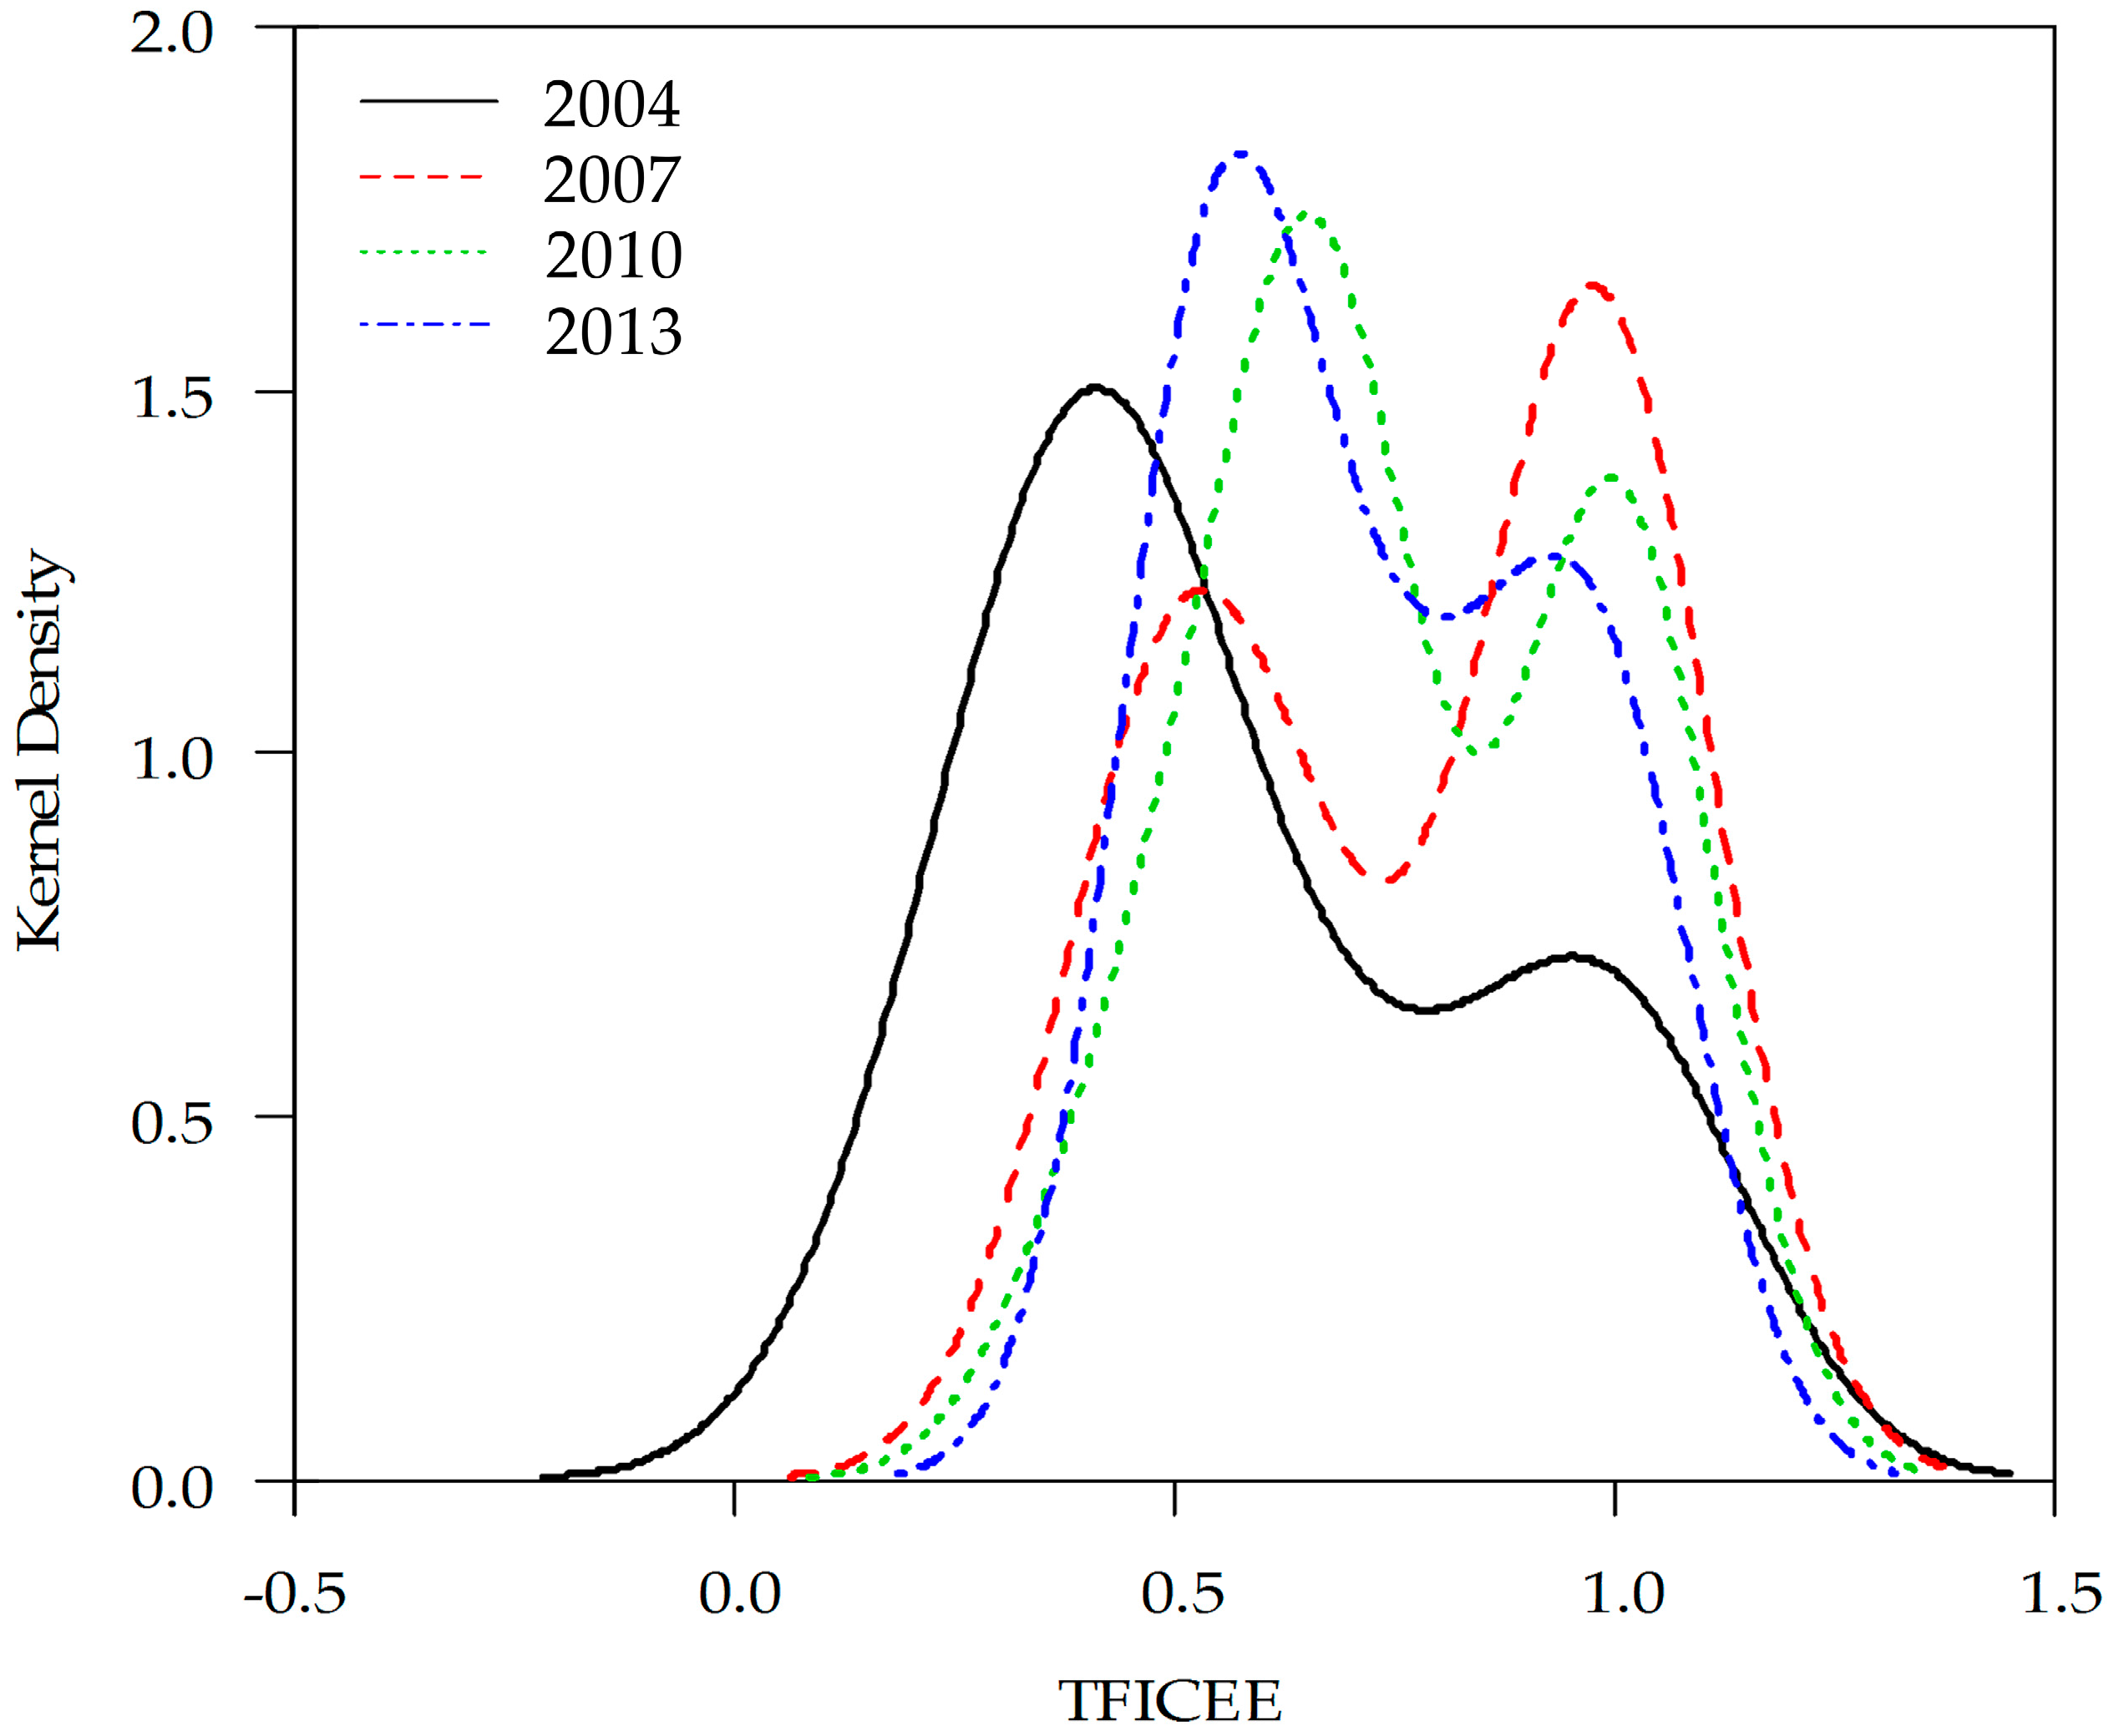
3.3.3. Distributional Evolution Tendency of TFICEE
3.4. Estimation of Industrial Abatement Potential
4. Conclusions
Acknowledgments
Author Contributions
Conflicts of Interest
Abbreviations
| ICE | Industrial CO2 Emission |
| TICE | Target Industrial CO2 Emission |
| LICE | Loss Industrial CO2 Emission |
| TFICEE | Industrial CO2 Emission Efficiency under Total Factor Frame |
| APICE | Abatement Potential of Industrial CO2 Emission |
| NCV | Net Caloric Value |
| CEF | CO2 Emission Factor |
| COF | CO2 Oxidation Factor |
References
- International Energy Agency (IEA). CO2 Emissions from Fuel Combustion Highlights 2015; International Energy Agency: Paris, France, 2015. [Google Scholar]
- Ren, S.; Fu, X.; Chen, X. Regional variation of energy-related industrial CO2 emissions mitigation in China. China Econ. Rev. 2012, 23, 1134–1145. [Google Scholar] [CrossRef]
- Tian, X.; Chang, M.; Shi, F.; Tanikawa, H. How does industrial structure change impact carbon dioxide emissions? A comparative analysis focusing on nine provincial regions in China. Environ. Sci. Policy 2014, 37, 243–254. [Google Scholar] [CrossRef]
- National Development and Reform Commission (NDRC). National Climate Change Plan for 2014–2020; National Development and Reform Commission, 2014. Available online: http://www.sdpc.gov.cn/gzdt/201411/t20141104_643314.html (accessed on 19 September 2014). (In Chinese)
- Kanada, M.; Dong, L.; Fujita, T.; Fujii, M.; Inoue, T.; Hirano, Y.; Togawa, T.; Geng, Y. Regional disparity and cost-effective SO2 pollution control in China: A case study in 5 mega-cities. Energy Policy 2013, 61, 1322–1331. [Google Scholar] [CrossRef]
- Dong, L.; Liang, H. Spatial analysis on China’s regional air pollutants and CO2 emissions: Emission pattern and regional disparity. Atmos. Environ. 2014, 92, 280–291. [Google Scholar] [CrossRef]
- Dong, L.; Dong, H.; Fujita, T.; Geng, Y.; Fujii, M. Cost-effectiveness analysis of China’s sulfur dioxide control strategy at the regional level: Regional disparity, inequity and future challenges. J. Clean. Prod. 2015, 90, 345–359. [Google Scholar] [CrossRef]
- Sun, J.W. The decrease of CO2 emission intensity is decarbonization at national and global levels. Energy Policy 2005, 33, 975–978. [Google Scholar] [CrossRef]
- Tol, R.S.J.; Pacala, S.W.; Socolow, R.H. Understanding long-term energy use and carbon emissions in the USA. J. Policy Model. 2009, 31, 425–445. [Google Scholar] [CrossRef]
- Davidsdottir, B.; Fisher, M. The odd couple: The relationship between state economic performance and carbon emissions economic intensity. Energy Policy 2011, 39, 4551–4562. [Google Scholar] [CrossRef]
- Wang, K.; Wei, Y.M.; Zhang, X. Energy and emissions efficiency patterns of Chinese regions: A multi-directional efficiency analysis. Appl. Energy 2013, 104, 105–116. [Google Scholar] [CrossRef]
- Zhang, N.; Zhou, P.; Kung, C. Total-factor carbon emission performance of the Chinese. Renew. Sustain. Energy Rev. 2015, 41, 584–593. [Google Scholar] [CrossRef]
- Zhang, N.; Wei, X. Dynamic total factor carbon emissions performance changes in the Chinese transportation industry. Appl. Energy 2015, 146, 409–420. [Google Scholar] [CrossRef]
- Wang, S.F.; Chu, C.; Chen, G.Z.; Peng, Z.L.; Li, F.Y. Efficiency and reduction cost of carbon emissions in China: A non-radial directional distance function method. J. Clean. Prod. 2016, 113, 624–634. [Google Scholar] [CrossRef]
- Wang, W.; Xie, H.L.; Jiang, T.; Zhang, D.B.; Xie, X. Measuring the Total-Factor Carbon Emission Performance of Industrial Land Use in China Based on the Global Directional Distance Function and Non-Radial Luenberger Productivity Index. Sustainability 2016, 8, 336. [Google Scholar] [CrossRef]
- Tone, K. Dealing with undesirable outputs in DEA: A slacks-based measure (SBM) approach. In Proceedings of the North American Productivity Workshop (NAPW) III, Toronto, ON, Canada, 15–18 June 2004.
- Zhou, W.Q.; Nie, M. Regional differences in the efficiencies of industrial carbon emissions in China. J. Quant. Tech. Econ. 2012, 9, 58–71. (In Chinese) [Google Scholar]
- Choi, Y.; Zhang, N.; Zhou, P. Efficiency and abatement costs of energy-related CO2 emissions in China: A slacks-based efficiency measure. Appl. Energy 2012, 98, 198–208. [Google Scholar] [CrossRef]
- Li, H.; Shi, J.F. Energy efficiency analysis on Chinese industrial sectors: An improved Super-SBM model with undesirable outputs. J. Clean. Prod. 2014, 65, 97–107. [Google Scholar] [CrossRef]
- Zhang, F.; Fang, H.; Wu, J.; Ward, D. Environmental Efficiency Analysis of Listed Cement Enterprises in China. Sustainability 2016, 8, 453. [Google Scholar] [CrossRef]
- Yu, S.W.; Agbemabiese, L.; Zhang, J.J. Estimating the carbon abatement potential of economic sectors in China. Appl. Energy 2016, 165, 107–118. [Google Scholar] [CrossRef]
- Yu, S.W.; Zhang, J.J.; Zheng, S.H.; Sun, H. Provincial carbon intensity abatement potential estimation in China: A PSO–GA-optimized multi-factor environmental learning curve method. Energy Policy 2015, 77, 46–55. [Google Scholar] [CrossRef]
- Wang, T.; Richard Teague, W.; Park, S.C.; Bevers, S. GHG Mitigation Potential of Different Grazing Strategies in the United States Southern Great Plains. Sustainability 2015, 7, 13500–13521. [Google Scholar] [CrossRef]
- Xing, R.; Hanaoka, T.; Kanamori, Y.; Dai, H.C.; Masui, T. Energy Service Demand Projections and CO2 Reduction Potentials in Rural Households in 31 Chinese Provinces. Sustainability 2015, 7, 15833–15846. [Google Scholar] [CrossRef]
- Guo, X.D.; Zhu, L.; Fan, Y.; Xie, B.C. Evaluation of potential reductions in carbon emissions in Chinese provinces based on environmental DEA. Energy Policy 2011, 39, 2352–2360. [Google Scholar] [CrossRef]
- Yu, X.-H.; Zhang, C. Analysis of energy efficiency and emissions reduction potential in China’s industrial sector. Ind. Econ. Rev. 2012, 3, 5–15. (In Chinese) [Google Scholar]
- Fan, D.; Wang, W.-G. Analysis of total factor energy efficiency and potential of the energy-saving and emission-abating in regional of China—Based on SBM Model of undesired output. Math. Pract. Theory 2013, 43, 12–21. (In Chinese) [Google Scholar]
- Bi, G.B.; Wang, P.C.; Yang, F.; Liang, L. Energy and Environmental Efficiency of China’s Transportation Sector: A Multidirectional Analysis Approach. Math. Probl. Eng. 2014, 2014, 1–12. [Google Scholar] [CrossRef]
- Du, J.M. China’s Regional Energy Efficiency Evaluation Based on Super DEA. Ecol. Econ. 2015, 31, 51–56. [Google Scholar]
- Zhou, Y.; Liang, D.P.; Xing, X.P. Environmental efficiency of industrial sectors in China: An improved weighted SBM model. Math. Comput. Model. 2013, 58, 990–999. [Google Scholar] [CrossRef]
- Xiang, N.; Xu, F.; Sha, J.H. Simulation Analysis of China’s Energy and Industrial Structure Adjustment Potential to Achieve a Low-carbon Economy by 2020. Sustainability 2013, 5, 5081–5099. [Google Scholar] [CrossRef]
- Zhao, X.L.; Yang, R.; Ma, Q. China’s total factor energy efficiency of provincial industrial sectors. Energy 2014, 65, 52–61. [Google Scholar]
- Wang, K.; Wei, Y.M. China’s regional industrial energy efficiency and carbon emissions abatement costs. Appl. Energy 2014, 130, 617–631. [Google Scholar] [CrossRef]
- Ouyang, X.L.; Lin, B.Q. An analysis of the driving forces of energy-related carbon dioxide emissions in China’s industrial sector. Renew. Sust. Energy Rev. 2015, 45, 838–849. [Google Scholar] [CrossRef]
- Liu, Y.; Xiao, H.W.; Zhang, N. Industrial Carbon Emissions of China’s Regions: A Spatial Econometric Analysis. Sustainability 2016, 8, 210. [Google Scholar] [CrossRef]
- Zhang, N.; Wang, B.; Liu, Z. Carbon emissions dynamics, efficiency gains, and technological innovation in China’s industrial sectors. Energy 2016, 99, 10–19. [Google Scholar] [CrossRef]
- Lu, Q.L.; Yang, H.; Huang, X.J.; Chuai, X.W.; Wu, C.Y. Multi-sectoral decomposition in decoupling industrial growth from carbon emissions in the developed Jiangsu Province, China. Energy 2015, 82, 414–425. [Google Scholar] [CrossRef]
- Zhang, M.Y.; Huang, X.J. Effects of industrial restructuring on carbon reduction: An analysis of Jiangsu Province, China. Energy 2012, 44, 515–526. [Google Scholar] [CrossRef]
- Wang, W.W.; Liu, R.; Zhang, M.; Li, H.N. Decomposing the decoupling of energy-related CO2 emissions and economic growth in Jiangsu Province. Energy Sustain. Dev. 2013, 17, 62–71. [Google Scholar] [CrossRef]
- Zhou, P.; Ang, B.W.; Wang, H. Energy and CO2 emission performance in electricity generation: A non-radial directional distance function approach. Eur. J. Oper. Res. 2012, 221, 625–635. [Google Scholar] [CrossRef]
- Zhou, P.; Ang, B.W.; Han, J.Y. Total factor carbon emission performance: A Malmquist index analysis. Energy Econ. 2010, 32, 194–201. [Google Scholar] [CrossRef]
- Charnes, A.; Cooper, W.W.; Rhodes, E. Measuring the efficiency of decision making units. Eur. J. Oper. Res. 1978, 2, 429–444. [Google Scholar] [CrossRef]
- Banker, R.D.; Charnes, A.W.; Cooper, W.W. Some models for estimating technical and scale efficiency in data envelopment analysis. Manag. Sci. 1984, 30, 1078–1092. [Google Scholar] [CrossRef]
- Tone, K. A slacks-based measure of efficiency in data envelopment analysis. Eur. J. Oper. Res. 2001, 130, 498–509. [Google Scholar] [CrossRef]
- Gómez-Calvet, R.; Conesa, D.; Gómez-Calvet, A.R.; Tortosa-Ausina, E. On the dynamics of eco-efficiency performance in the European Union. Comput. Oper. Res. 2016, 66, 336–350. [Google Scholar] [CrossRef]
- Wang, B.; Yang, Y.S.; Lai, P.H.; Yu, L.J. The Research of Energy Efficiency and Potential of the Energy-saving and Emission-abating in Regions of China Considering the Difference of Natural Environment. Ind. Econ. Rev. 2016, 1, 82–100. (In Chinese) [Google Scholar]
- Rao, X.; Wu, J.; Zhang, Z.Y.; Liu, B. Energy efficiency and energy saving potential in China: An analysis based on slacks-based measure model. Comput. Ind. Eng. 2012, 63, 578–584. [Google Scholar] [CrossRef]
- National Bureau of Statistical of China. China Energy Statistical Yearbook, 2005–2014; China Statistics Press: Beijing, China, 2005–2014. (In Chinese)
- National Bureau of Statistical of China. China City Statistical Yearbook, 2005–2014; China Statistics Press: Beijing, China, 2005–2014. (In Chinese)
- Provincial Bureau of Statistical of Jiangsu. Jiangsu Economic Census Yearbook, 2004; China Statistics Press: Beijing, China, 2004. (In Chinese)
- Provincial Bureau of Statistical of Jiangsu. Jiangsu Economic Census Yearbook, 2008; China Statistics Press: Beijing, China, 2008. (In Chinese)
- Provincial Bureau of Statistical of Jiangsu. Jiangsu Economic Census Yearbook, 2013; China Statistics Press: Beijing, China, 2013. (In Chinese)
- Zhang, J.R.; Guo, Y.H. The relationship between the number of factors and dea efficiency. Syst. Eng. Theory Methodol. Appl. 2004, 13, 520–523. (In Chinese) [Google Scholar]
- Ross, I.; Robert, G. R: A language for data analysis and graphics. J. Comput. Graph. Stat. 1996, 5, 299–314. [Google Scholar]
- Wand, M.P.; Jones, M.C. Kernel Smoothing; Chapman and Hall: London, UK, 1995. [Google Scholar]


| Variable | Units | |
|---|---|---|
| Input | Capital | 100 million RMB |
| Labor | 10 thousand persons | |
| Energy | 10 thousand tons of coal equivalent (10,000 tce) | |
| Desirable output | Output | 100 million RMB |
| Undesirable output | CO2 | 10 thousand tons |
| Year | Inputs | Desirable Output | Undesirable Output | |||
|---|---|---|---|---|---|---|
| Capital | Labor | Energy | Gross Output | CO2 | ||
| 2004 | Mean | 1166.19 | 70.56 | 756.68 | 1998.87 | 2764.05 |
| Std. dev. | 1286.59 | 68.42 | 568.43 | 2391.31 | 2077.53 | |
| Max | 4888.87 | 214.55 | 1715.06 | 8668.20 | 6442.85 | |
| Min | 89.03 | 9.47 | 64.50 | 141.26 | 225.17 | |
| 2007 | Mean | 2223.64 | 79.08 | 1094.03 | 3744.13 | 3968.61 |
| Std. dev. | 2604.51 | 84.80 | 860.35 | 3987.14 | 3082.64 | |
| Max | 9648.09 | 339.62 | 3206.62 | 14,868.15 | 11,393.35 | |
| Min | 258.43 | 18.93 | 112.79 | 402.23 | 412.91 | |
| 2010 | Mean | 3429.63 | 93.54 | 1312.49 | 6102.25 | 4746.79 |
| Std. dev. | 3388.69 | 104.40 | 1077.06 | 5417.12 | 3865.00 | |
| Max | 12,752.27 | 419.87 | 3827.07 | 21,624.27 | 13,506.92 | |
| Min | 691.38 | 24.69 | 119.41 | 997.69 | 436.33 | |
| 2013 | Mean | 4397.08 | 88.06 | 1552.22 | 8816.90 | 5574.30 |
| Std. dev. | 3852.19 | 75.28 | 1226.26 | 6056.60 | 4392.70 | |
| Max | 15,241.85 | 319.60 | 4298.04 | 26,327.21 | 15,028.32 | |
| Min | 1339.08 | 25.17 | 180.77 | 2598.40 | 653.84 | |
| Region | 2004 | 2005 | 2006 | 2007 | 2008 | 2009 | 2010 | 2011 | 2012 | 2013 | Mean |
|---|---|---|---|---|---|---|---|---|---|---|---|
| NJ | 1.000 | 1.000 | 1.000 | 1.000 | 1.000 | 0.843 | 0.621 | 0.552 | 0.492 | 0.584 | 0.809 |
| SZ | 1.000 | 1.000 | 1.000 | 1.000 | 0.925 | 0.799 | 0.663 | 0.607 | 0.500 | 0.537 | 0.803 |
| WX | 1.000 | 1.000 | 1.000 | 1.000 | 1.000 | 0.791 | 0.667 | 0.608 | 0.484 | 0.526 | 0.808 |
| CZ | 0.656 | 0.828 | 1.000 | 0.926 | 1.000 | 1.000 | 1.000 | 1.000 | 0.767 | 0.894 | 0.907 |
| ZJ | 0.387 | 0.454 | 0.458 | 0.524 | 0.615 | 0.554 | 0.496 | 0.465 | 0.413 | 0.520 | 0.489 |
| YZ | 0.473 | 0.766 | 0.764 | 0.679 | 0.797 | 1.000 | 1.000 | 1.000 | 1.000 | 1.000 | 0.848 |
| TZ | 0.777 | 0.867 | 0.907 | 0.913 | 0.927 | 1.000 | 1.000 | 1.000 | 1.000 | 1.000 | 0.939 |
| NT | 0.401 | 1.000 | 1.000 | 1.000 | 1.000 | 1.000 | 0.669 | 0.620 | 0.547 | 0.647 | 0.788 |
| YC | 0.461 | 1.000 | 0.797 | 1.000 | 1.000 | 1.000 | 1.000 | 1.000 | 1.000 | 0.652 | 0.891 |
| HA | 0.404 | 0.474 | 0.517 | 0.519 | 0.532 | 0.552 | 0.692 | 0.592 | 1.000 | 0.774 | 0.606 |
| SQ | 0.439 | 0.487 | 0.525 | 0.597 | 0.602 | 0.625 | 1.000 | 1.000 | 1.000 | 1.000 | 0.728 |
| XZ | 0.288 | 0.432 | 0.426 | 0.471 | 0.459 | 0.433 | 0.423 | 0.429 | 0.417 | 0.504 | 0.428 |
| LYG | 0.229 | 0.402 | 0.413 | 0.442 | 0.494 | 0.558 | 0.673 | 0.768 | 0.900 | 0.829 | 0.571 |
| Sunan | 0.809 | 0.856 | 0.892 | 0.890 | 0.908 | 0.797 | 0.689 | 0.646 | 0.531 | 0.612 | 0.763 |
| Suzhong | 0.550 | 0.878 | 0.890 | 0.864 | 0.908 | 1.000 | 0.890 | 0.873 | 0.849 | 0.882 | 0.858 |
| Subei | 0.364 | 0.559 | 0.536 | 0.606 | 0.617 | 0.634 | 0.758 | 0.758 | 0.863 | 0.752 | 0.645 |
| Jiangsu | 0.574 | 0.764 | 0.773 | 0.787 | 0.811 | 0.810 | 0.779 | 0.759 | 0.748 | 0.749 | 0.755 |
| Region | Abatement Potential | R1 | Average Annual Actual Emission (104 tons) | Potential Emission Reduction (104 tons) | Abatement Contribution | R2 |
|---|---|---|---|---|---|---|
| NJ | 0.191 | 9 | 5691.17 | 1085.87 | 6.94% | 5 |
| SZ | 0.197 | 7 | 11,637.25 | 2291.37 | 14.64% | 2 |
| WX | 0.192 | 8 | 6770.49 | 1302.64 | 8.32% | 4 |
| CZ | 0.093 | 12 | 2919.47 | 271.22 | 1.73% | 10 |
| ZJ | 0.511 | 2 | 4078.71 | 2085.85 | 13.32% | 3 |
| YZ | 0.152 | 10 | 3189.58 | 485.13 | 3.10% | 9 |
| TZ | 0.061 | 13 | 2020.65 | 123.06 | 0.79% | 12 |
| NT | 0.212 | 6 | 3978.74 | 841.90 | 5.38% | 6 |
| YC | 0.109 | 11 | 1812.20 | 197.53 | 1.26% | 11 |
| HA | 0.394 | 4 | 2040.33 | 804.70 | 5.14% | 7 |
| SQ | 0.273 | 5 | 411.17 | 112.04 | 0.72% | 13 |
| XZ | 0.572 | 1 | 9688.79 | 5540.05 | 35.39% | 1 |
| LYG | 0.429 | 3 | 1194.37 | 512.62 | 3.27% | 8 |
| Sunan | 0.226 | 31,097.09 | 7036.96 | 44.95% | ||
| Suzhong | 0.158 | 9188.97 | 1450.09 | 9.26% | ||
| Subei | 0.473 | 15,146.85 | 7166.95 | 45.78% | ||
| Jiangsu | 0.282 | 55,432.91 | 15,654.00 | 100.00% |
© 2016 by the authors; licensee MDPI, Basel, Switzerland. This article is an open access article distributed under the terms and conditions of the Creative Commons Attribution (CC-BY) license (http://creativecommons.org/licenses/by/4.0/).
Share and Cite
Zhang, J.; Xing, Z.; Wang, J. Analysis of CO2 Emission Performance and Abatement Potential for Municipal Industrial Sectors in Jiangsu, China. Sustainability 2016, 8, 697. https://doi.org/10.3390/su8070697
Zhang J, Xing Z, Wang J. Analysis of CO2 Emission Performance and Abatement Potential for Municipal Industrial Sectors in Jiangsu, China. Sustainability. 2016; 8(7):697. https://doi.org/10.3390/su8070697
Chicago/Turabian StyleZhang, Jie, Zhencheng Xing, and Jigan Wang. 2016. "Analysis of CO2 Emission Performance and Abatement Potential for Municipal Industrial Sectors in Jiangsu, China" Sustainability 8, no. 7: 697. https://doi.org/10.3390/su8070697