
The Milk Supply Chain in Italy’s Umbria Region: Environmental and Economic Sustainability

Abstract
:1. Introduction
2. Materials and Methods
2.1. Environmental Sustainability
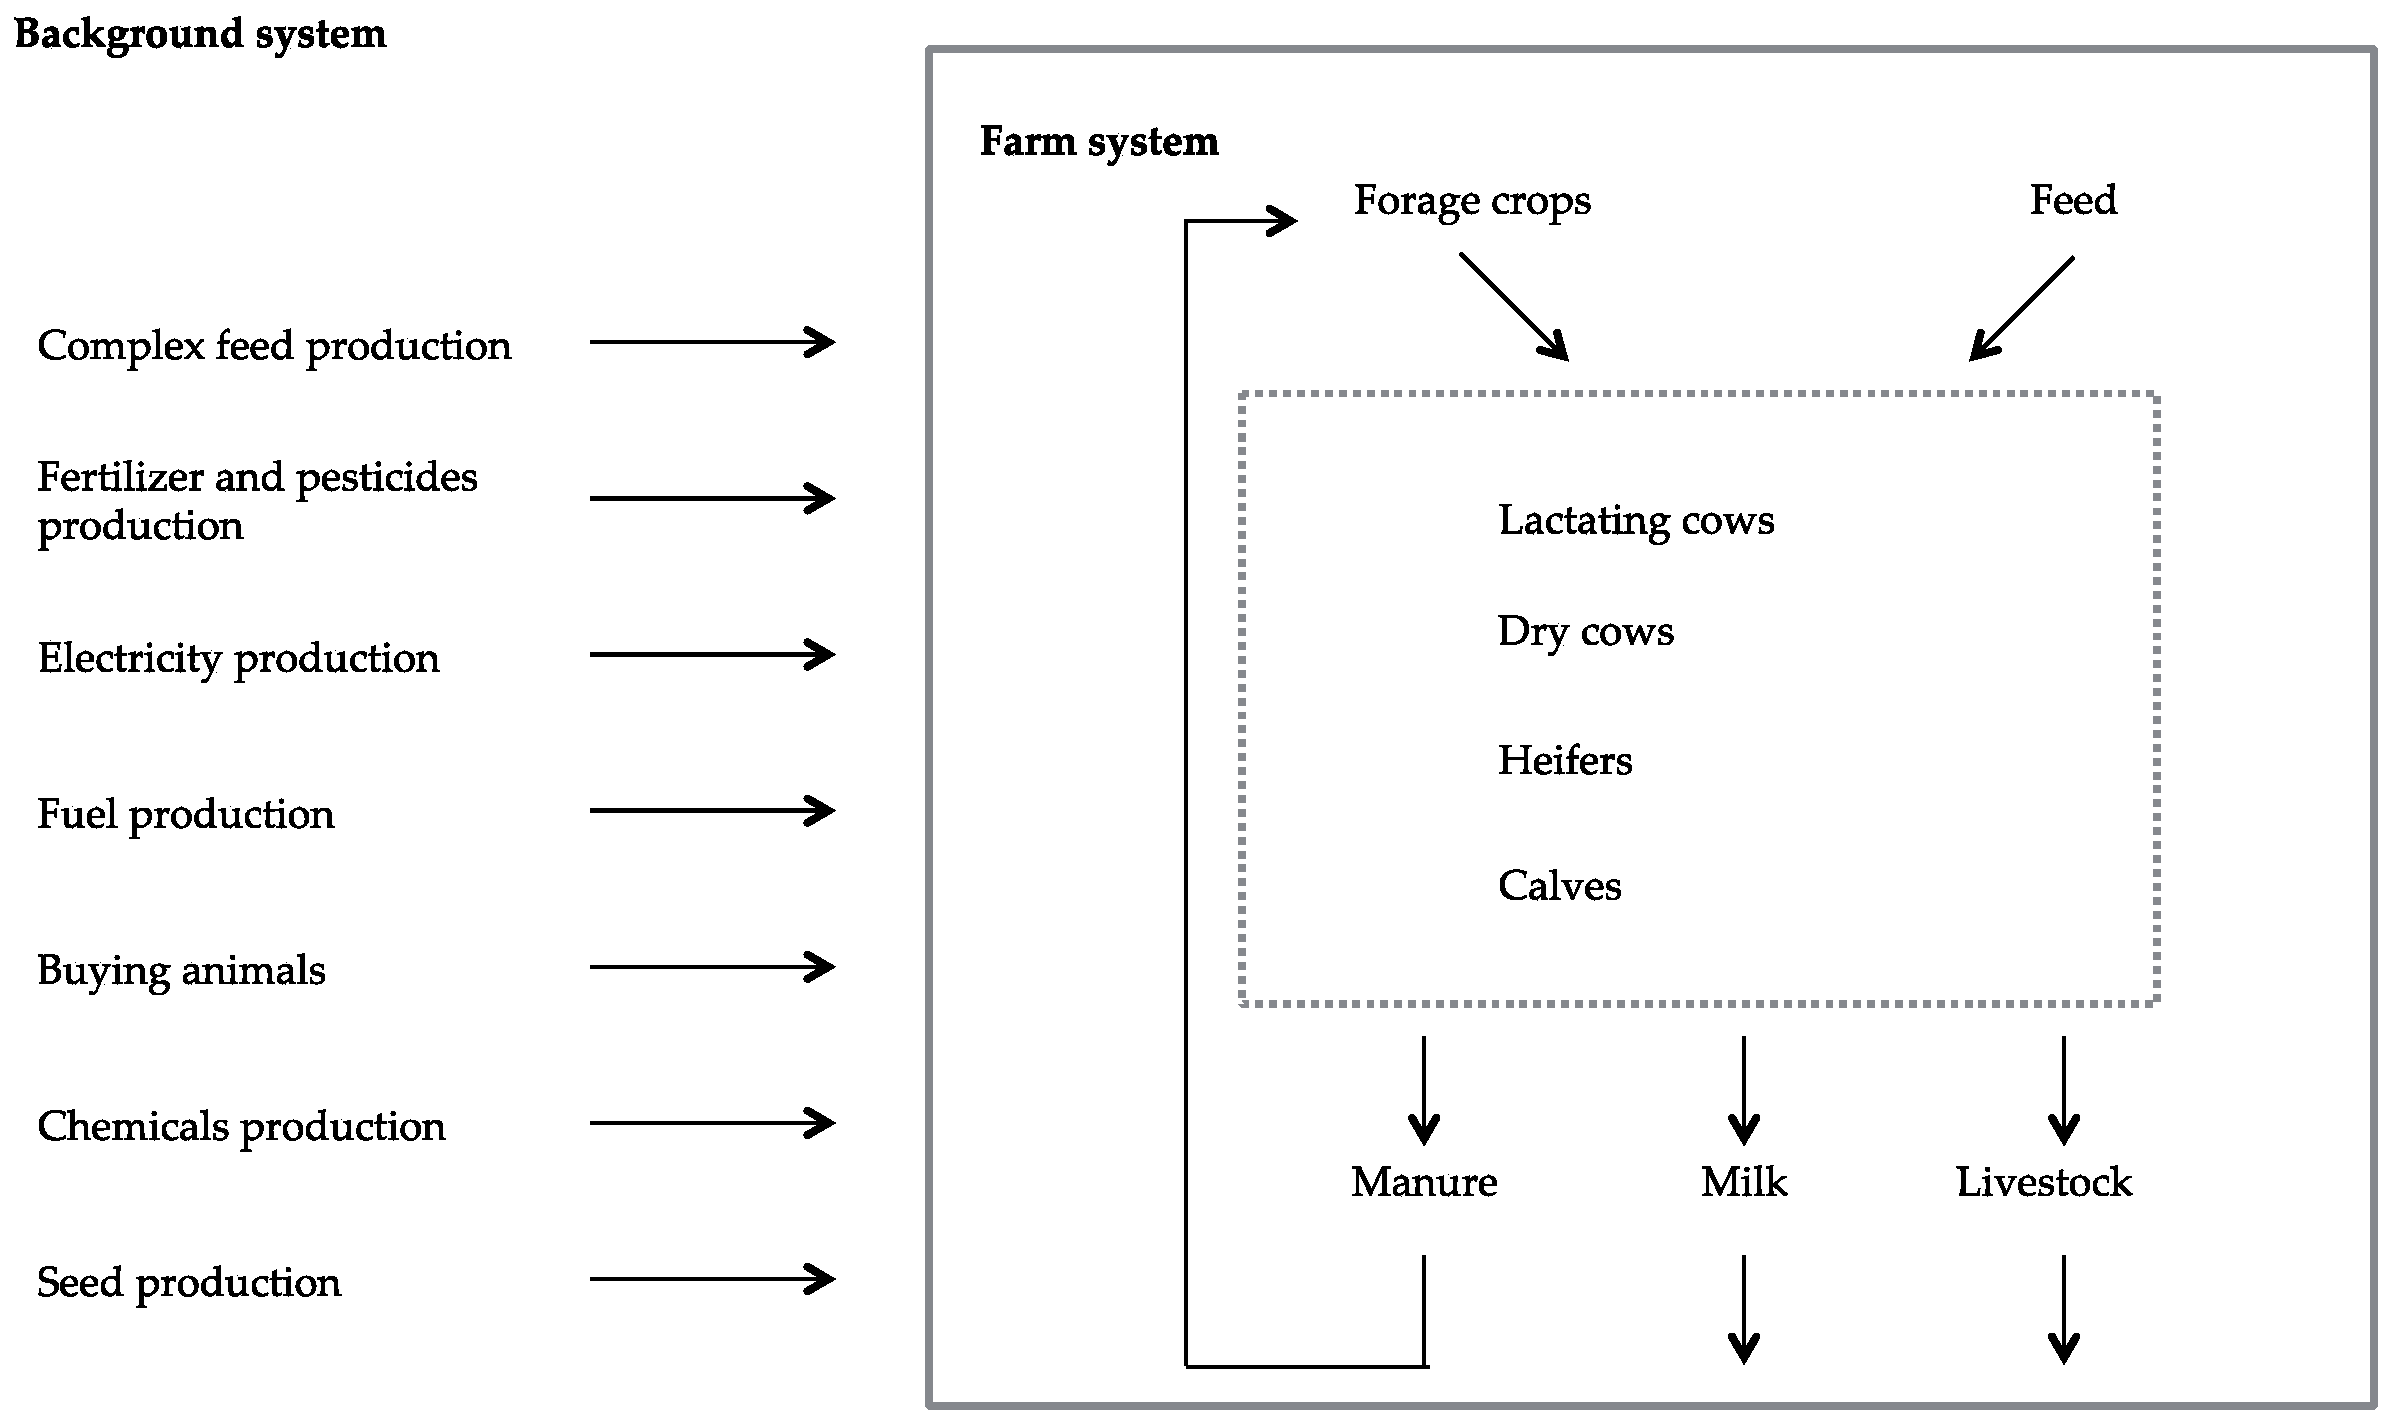
2.1.1. Functional Unit and System Boundaries
- the production of agricultural machinery and construction of buildings;
- the production of veterinary medicines;
- the transportation and disposal of carcasses;
- emissions associated with the combustion of methane produced by biodigesters;
- the production and disposal of the packaging of seeds and synthetic chemical products, due to lack of information;
- change in land use: it was not possible to collect data on the last 20 years;
- food processing within feed mills; and
- the disposal of waste water involved in the washing of premises.
2.1.2. Allocation of By-Products
2.1.3. Data Quality
2.1.4. Inventory Analysis
- calves;
- heifers;
- lactating cows; and
- dry cows.
Feed
Animal Breeding and Milking
Manure management
2.2. Economic Sustainability
- the classification of primary costs based on the physical nature of the direct factors used in the production process;
- the allocation of the indirect costs in the milk production process; and
- the determination of the net margin.
2.2.1. The Classification of Primary Costs Based on the Physical Nature of the Direct Factors Used in the Production Process
2.2.2. The Allocation of Indirect Costs to the Individual Production Process
2.2.3. The Determination of The Gross Saleable Production and Operating Income (Net of Interest and Taxes)
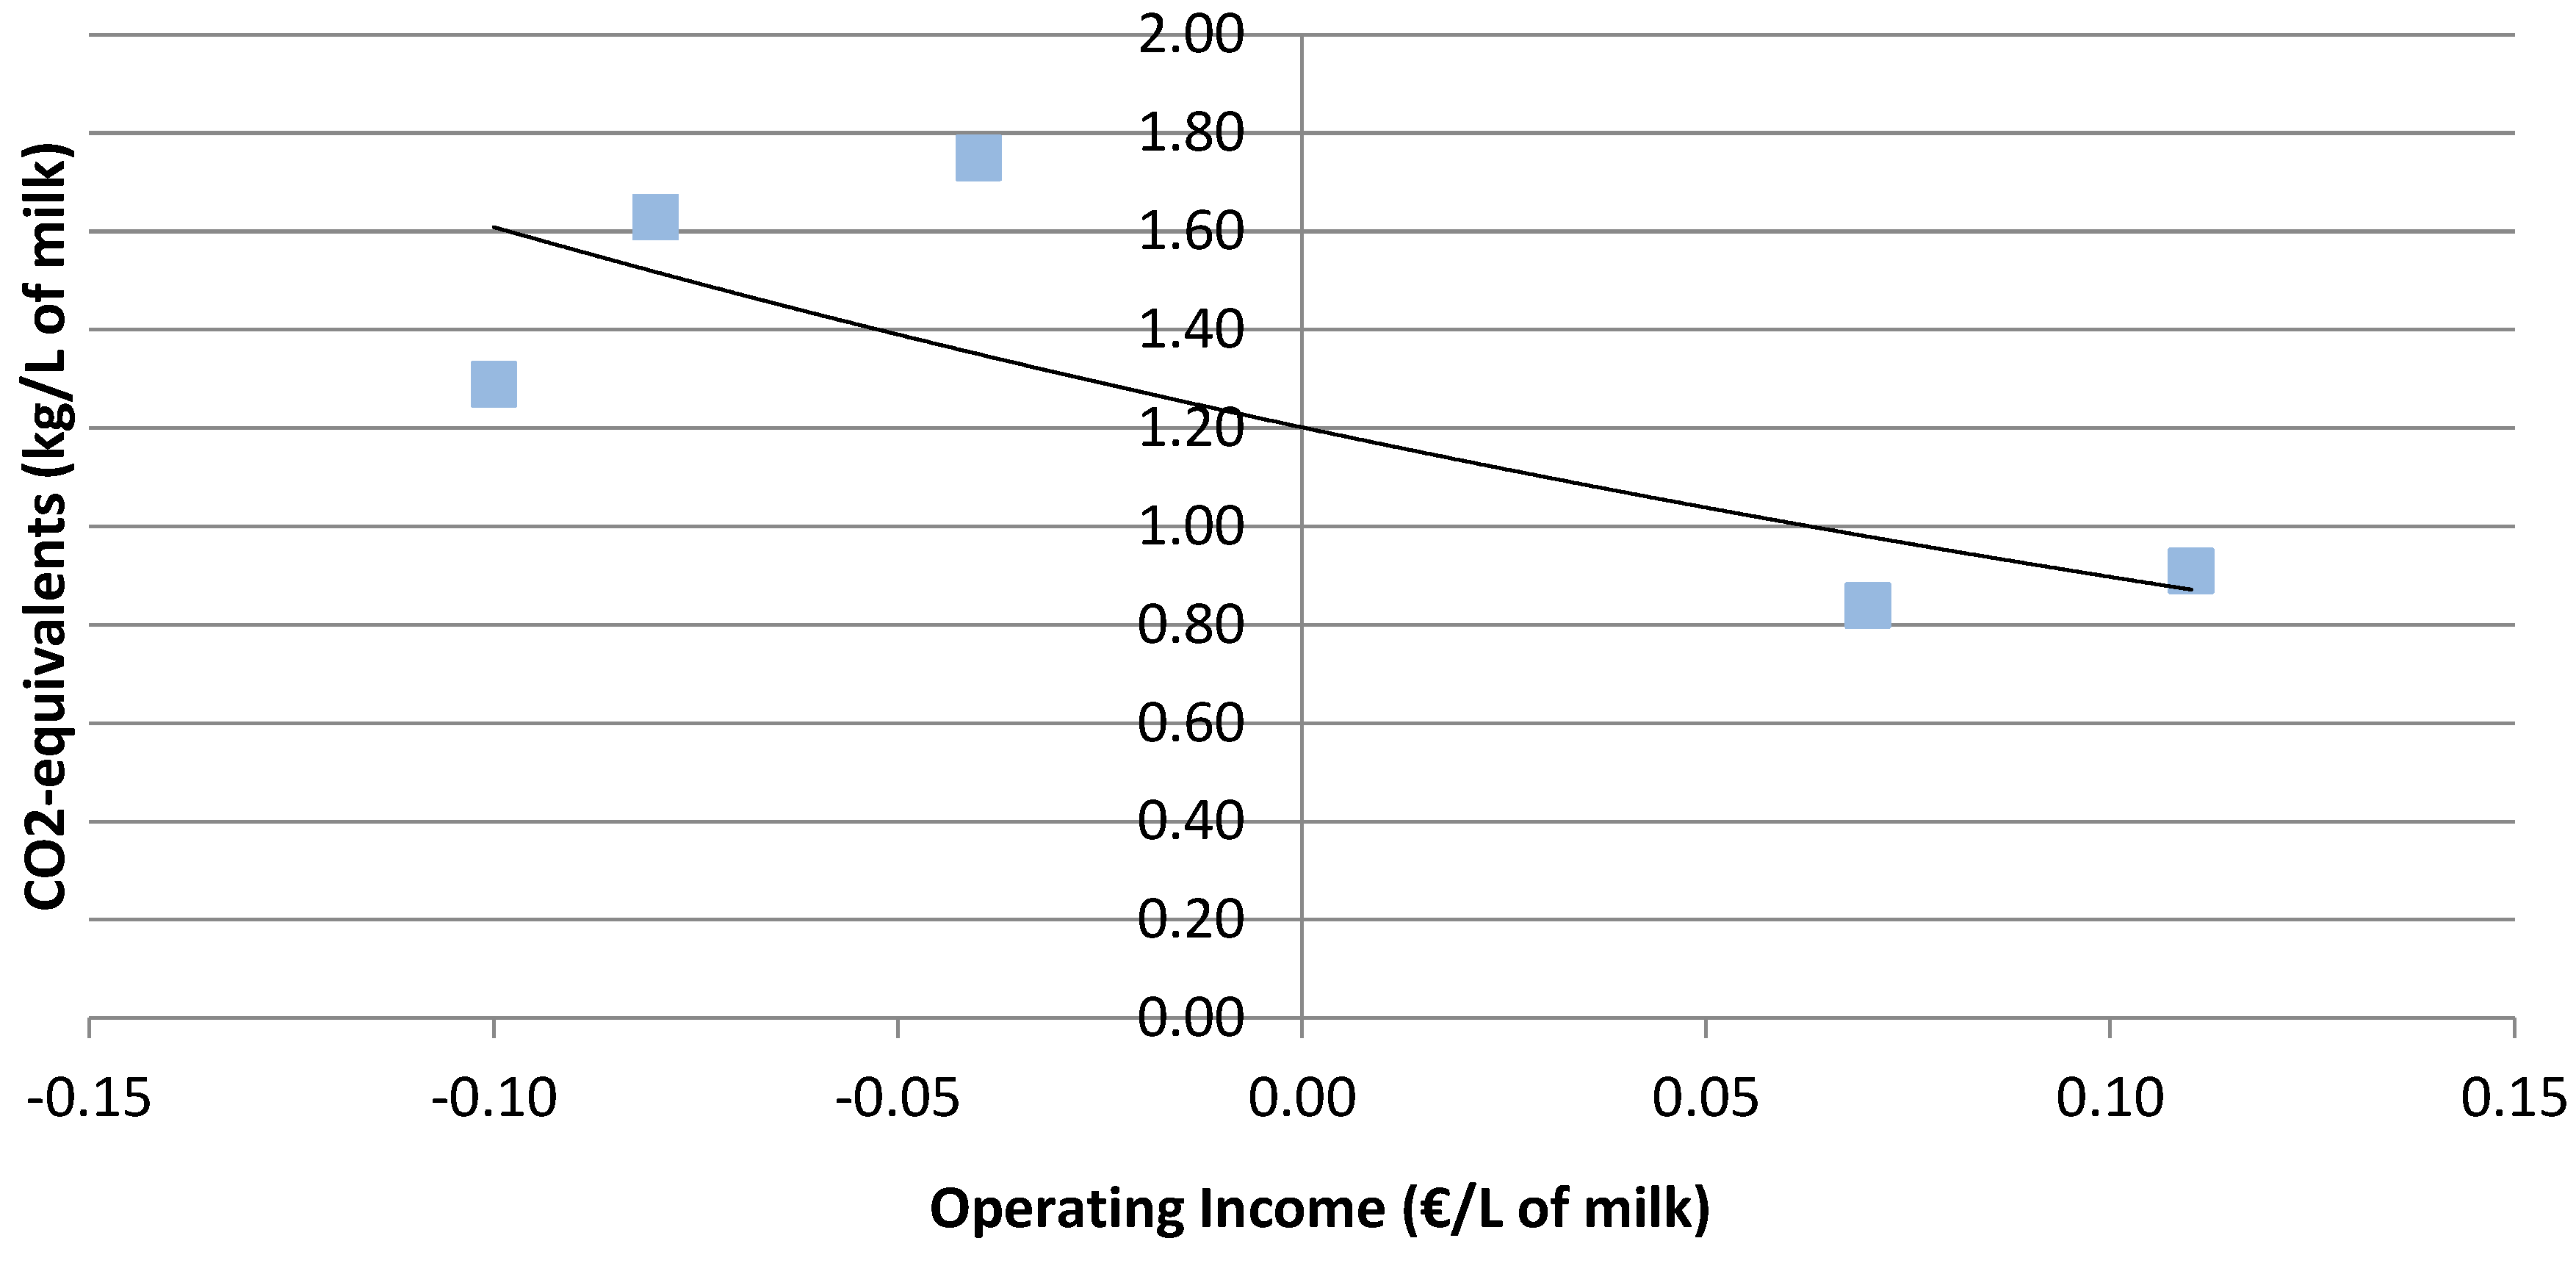
2.3. The Relationship between Environmental and Economic Sustainability
- CFi = CF of the milk from the i-th dairy farm;
- ROi = Operating income of the i-th dairy farm;
- A, B = parameters of the model; and
- e = Euler number
3. Results
3.1. Economic Performance
3.2. Environmental Performance
- Enteric fermentation of animals;
- Consumption for animal feeding; and
- Consumption for the management of the barn.
3.3. The Relationship between Environmental and Economic Sustainability
4. Conclusions
Author Contributions
Conflicts of Interest
Abbreviations
| CAP | Common Agricultural Policy |
| CF | Carbon Footprint |
| CO2 eq | Carbon Dioxide Emission equivalent |
| FPCM | Fat and Protein Corrected Milk standardized |
| GHG | Greenhouse gas emission |
| LCA | Life Cycle Assessment |
| PCR | Product Category Rule |
| RO | Operating income |
References
- Communication From the Commission (CE). Europe 2020 A Strategy for Smart, Sustainable and Inclusive Growth. 2010. Available online: http://ec.europa.eu/eu2020/pdf/COMPLET%20EN%20BARROSO%20%20%20007%20-%20Europe%202020%20-%20EN%20version.pdf (accessed on 17 May 2016).
- European Parliament and Council (EU). Regulation EU No 1307/2013 Establishing Rules for Direct Payments to Farmers under Support Schemes within the Framework of the Common Agricultural Policy and Repealing Council Regulation (EC) No 637/2008 and Council Regulation (EC) No 73/2009. 2013. Available online: http://eur-lex.europa.eu/legal-content/EN/TXT/?uri=CELEX:32013R1307 (accessed on 15 May 2016).
- Food and Agriculture Organization of the United Nations (FAO). Greenhouse Gas Emissions from the Dairy Sector: A Life Cycle Assessment; FAO: Italy, Rome, 2010; Available online: http://www.fao.org/docrep/012/k7930e/k7930e00.pdf (accessed on 13 May 2016).
- Hambly, J. Environmental—Ecological Impact of the Dairy Sector (Literature Review on Dairy Products for an Inventory of Key Issues—List of Environmental Initiatives and Influences on the Dairy Sector); International Dairy Federation: Brussels, Belgium, 2011; pp. 145–146. [Google Scholar]
- Hagemann, M.; Hemme, T.; Ndambi, A.; Alqaisi, O.; Sultana, M.N. Benchmarking of greenhouse gas emissions of bovine milk production systems for 38 countries. Anim. Feed Sci. Technol. 2011, 166, 46–58. [Google Scholar] [CrossRef]
- Thomassen, M.A.; van Calker, K.J.; Smits, M.C.; Iepema, G.L.; de Boer, I.J. Life cycle assessment of conventional and organic milk production in the Netherlands. Agric. Syst. 2008, 96, 95–107. [Google Scholar] [CrossRef]
- Van der Werf, H.M.; Kanyarushoki, C.; Corson, M.S. An operational method for the evaluation of resource use and environmental impacts of dairy farms by life cycle assessment. J. Environ. Manag. 2009, 90, 3643–3652. [Google Scholar] [CrossRef] [PubMed]
- De Vries, M.; De Boer, I.J.M. Comparing environmental impacts for livestock products: A review of life cycle assessments. Livest. Sci. 2009, 128, 1–11. [Google Scholar] [CrossRef]
- Flysjö, A.; Henriksson, M.; Cederberg, C.; Ledgard, S.; Englund, J.E. The impact of various parameters on the carbon footprint of milk production in New Zealand and Sweden. Agric. Syst. 2011, 104, 459–469. [Google Scholar] [CrossRef]
- Thoma, G.; Popp, J.; Shonnard, D.; Darin, N.; Marty, M.; Richard, U.; Wayne, K.; Dae Soo, K.; Zara, N.; Nathan, K.; et al. Regional analysis of greenhouse gas emissions from USA dairy farms: A cradle to farm-gate assessment of the American dairy industry circa 2008. Int. Dairy J. 2013, 31, S29–S40. [Google Scholar] [CrossRef]
- Gollnow, S.; Lundie, S.; Moore, A.D.; McLaren, J.; van Buuren, N.; Stahle, P.; Christie, K.; Thylmann, D.; Rehl, T. Carbon footprint of milk production from dairy cows in Australia. Int. Dairy J. 2014, 37, 31–38. [Google Scholar] [CrossRef]
- Thomassen, M.A.; De Boer, I.J.M. Evaluation of indicators to assess the environmental impact of dairy production systems. Agric. Ecosyst. Environ. 2005, 111, 185–199. [Google Scholar] [CrossRef]
- International Standard Organization (ISO). Greenhouse Gases—Carbon Footprint of Products—Requirements and Guidelines for Quantification and Communication; ISO/TS 14067:2013; ISO: Geneva, Switzerland, 2013. [Google Scholar]
- United Nations General Assembly. Resolution adopted by the General Assembly, 2005 World Summit Outcome. Available online: http://www.ifrc.org/docs/idrl/I520EN.pdf (accessed on 27 July 2016).
- Van Calker, K.J.; Berentsen, P.B.; Giesen, G.W.; Huirne, R.B. Identifying and ranking attributes that determine sustainability. Agric. Hum. Values 2005, 22, 53–63. [Google Scholar] [CrossRef]
- O’Brien, D.; Hennessy, T.; Moran, B.; Shalloo, L. Relating the carbon footprint of milk from Irish dairy farms to economic performance. J. Dairy Sci. 2015, 98, 7394–7407. [Google Scholar] [CrossRef] [PubMed]
- European Commission. Agriculture and Rural Development, Analysis of the EU Dairy Sector EU Production and Exports to Russia (2011–2013) Recent Market Trends and Measures Taken to Address Market Disruptions Following the Russian Import Ban 2014. Available online: http://ec.europa.eu/agriculture/russian-import-ban/pdf/dairy-production_en.pdf (accessed on 24 May 2016).
- National Institute of Statistics. Statistical Yearbook Italian; National Institute of Statistics: Rome, Italy, 2014.
- Thomassen, M.A.; Dolman, M.A.; van Calker, K.J.; de Boer, I.J.M. Relating life cycle assessment indicators to gross value added for Dutch dairy farms. Ecol. Econ. 2009, 68, 2278–2284. [Google Scholar] [CrossRef]
- National Institute of Statistics. 6th General Agricultural Census. 2012. Available online: http://www.istat.it/it/files/2011/03/1425-12_Vol_VI_Cens_Agricoltura_INT_CD_1_Trimboxes_ipp.pdf (accessed on 24 May 2016).
- International Standard Organization (ISO). Environmental Management—Life Cycle Assessment—Principles and Framework; ISO 14040:2006; ISO: Geneva, Switzerland, 2006. [Google Scholar]
- International Standard Organization (ISO). Environmental Management—Life Cycle Assessment—Requirements and Guidelines; ISO 14044:2006; ISO: Geneva, Switzerland, 2006. [Google Scholar]
- EPD (International Environmental Product Declaration System). General Programme Instructions for the International EPD® System 2.01. 2013. Available online: http://www.environdec.com/Documents/GPI/General%20Programme%20Instructions%20version%202.5.pdf (accessed on 28 July 2016).
- International Standard Organization (ISO). Environmental Labels and Declarations—Type III Environmental Declarations—Principles and Procedures—Product Category Rules according to: Arable Crops; ISO 14025:2006; ISO: Geneva, Switzerland, 2013. [Google Scholar]
- International Standard Organization (ISO). Environmental Labels and Declarations—Type III Environmental Declarations—Principles and Procedures—Product Category Rules according to: Raw Milk; ISO 14025:2006; ISO: Geneva, Switzerland, 2013. [Google Scholar]
- Intergovernmental Panel on Climate Change (IPCC). Guidelines for National Greenhouse Gas Inventories; IGES: Hayama, Japan, 2006; Volume 4, Chapter 10; pp. 7–69. [Google Scholar]
- Torquati, B.M. Economia e Gestione Dell’impresa Agraria; Edagricole: Bologna, Italy, 2003; pp. 245–286. [Google Scholar]
- Bates, D.M.; Watts, D.G. Nonlinear Regression Analysis and its Applications; John Wiley and Sons, Inc.: New York, NY, USA, 1988; p. 365. [Google Scholar]
- Dillon, E.; Hennessy, T.; Hynes, S. Assessing the sustainability of Irish agriculture. Int. J. Agric. Sustain. 2010, 8, 1–17. [Google Scholar] [CrossRef]
- Dillon, P.; Crosse, S.; O’Brien, B. Effect of concentrate supplementation of grazing dairy cows in early lactation on milk production and milk processing quality. Ir. J. Agric. Food Res. 1997, 36, 145–159. [Google Scholar]
- Benchaar, C.; Pomar, C.; Chiquette, J. Evaluation of dietary strategies to reduce methane production in ruminants: A modeling approach. Can. J. Anim. Sci. 2001, 81, 563–574. [Google Scholar] [CrossRef]
- Lovett, D.K.; Stack, L.J.; Lovell, S.; Callan, J.; Flynn, B.; Hawkins, M.; O’Mara, F.P. Manipulating enteric methane emissions and animal performance of late-lactation dairy cows through concentrate supplementation at pasture. J. Dairy Sci. 2005, 88, 2836–2842. [Google Scholar] [CrossRef]
- Tuomisto, H.L.; Hodge, I.D.; Riordan, P.; Macdonald, D.W. Does organic farming reduce environmental impacts?–A meta-analysis of European research. J. Environ. Manag. 2012, 112, 309–320. [Google Scholar] [CrossRef] [PubMed]
- Tuomisto, H.L.; Hodge, I.D.; Riordan, P.; Macdonald, D.W. Comparing energy balances, greenhouse gas balances and biodiversity impacts of contrasting farming systems with alternative land uses. Agric. Syst. 2012, 108, 42–49. [Google Scholar] [CrossRef]
- Tuomisto, H.L.; Hodge, I.D.; Riordan, P.; Macdonald, D.W. Comparing global warming potential, energy use and land use of organic, conventional and integrated winter wheat production. Ann. Appl. Biol. 2012, 161, 116–126. [Google Scholar] [CrossRef]
- Lovett, D.K.; Shalloo, L.; Dillon, P.; O’Mara, F.P. Greenhouse gas emissions from pastoral based dairying systems: The effect of uncertainty and management change under two contrasting production systems. Livest. Sci. 2008, 116, 260–274. [Google Scholar] [CrossRef]
- Beukes, P.C.; Gregorini, P.; Romera, A.J.; Levy, G.; Waghorn, G.C. Improving production efficiency as a strategy to mitigate greenhouse gas emissions on pastoral dairy farms in New Zealand. Agric. Ecosyst. Environ. 2010, 136, 358–365. [Google Scholar] [CrossRef]
- O’Brien, D.; Shalloo, L.; Grainger, C.; Buckley, F.; Horan, B.; Wallace, M. The influence of strain of Holstein-Friesian cow and feeding system on greenhouse gas emissions from pastoral dairy farms. J. Dairy Sci. 2010, 93, 3390–3402. [Google Scholar] [CrossRef] [PubMed]
- Van Passel, S.; Nevens, F.; Mathijs, E.; van Huylenbroeck, G. Measuring farm sustainability and explaining differences in sustainable efficiency. Ecol. Econ. 2007, 62, 149–161. [Google Scholar] [CrossRef]
- Cappelletti, G.M.; Ioppolo, G.; Nicoletti, G.M.; Russo, C. Energy Requirement of Extra Virgin Olive Oil Production. Sustainability 2014, 6, 4966–4974. [Google Scholar] [CrossRef]


| Variables | Farm 1 | Farm 2 | Farm 3 | Farm 4 | Farm 5 | Weighted Average | Standard Deviation |
|---|---|---|---|---|---|---|---|
| Income | |||||||
| Income from Milk Sales | 0.43 | 0.56 | 0.43 | 0.42 | 0.43 | 0.43 | 0.057 |
| Income from Meat Sales | 0.02 | 0.04 | 0.02 | 0.02 | 0.02 | 0.02 | 0.009 |
| Total income | 0.45 | 0.60 | 0.45 | 0.44 | 0.45 | 0.45 | 0.066 |
| Variable costs | |||||||
| Animal feeds and concentrates costs | 0.16 | 0.11 | 0.18 | 0.27 | 0.16 | 0.18 | 0.053 |
| Fodder costs | 0.08 | 0.03 | 0.07 | 0.02 | 0.06 | 0.06 | 0.023 |
| Other direct costs | 0.03 | 0.07 | 0.01 | 0.04 | 0.02 | 0.03 | 0.022 |
| Fuels, lubricants and energy costs | 0.018 | 0.03 | 0.045 | 0.06 | 0.025 | 0.03 | 0.015 |
| Total variable costs | 0.288 | 0.24 | 0.305 | 0.39 | 0.265 | 0.30 | 0.051 |
| Fixed costs | |||||||
| Cost of labour | 0.10 | 0.17 | 0.19 | 0.07 | 0.04 | 0.07 | 0.070 |
| Fixed costs for facilities and machinery | 0.002 | 0.01 | 0.015 | 0.01 | 0.005 | 0.01 | 0.005 |
| Total fixed costs | 0.102 | 0.18 | 0.205 | 0.08 | 0.045 | 0.08 | 0.074 |
| Indirect costs | |||||||
| Administrative and management costs | 0.07 | 0.04 | 0.06 | 0.04 | 0.04 | 0.05 | 0.013 |
| Indirect costs | 0.07 | 0.04 | 0.06 | 0.04 | 0.04 | 0.05 | 0.013 |
| Total costs | 0.46 | 0.46 | 0.57 | 0.51 | 0.35 | 0.42 | 0.086 |
| Operating revenue | −0.01 | 0.14 | −0.11 | −0.07 | 0.09 | 0.03 | 0.096 |
| Variables | Farm 1 | Farm 2 | Farm 3 | Farm 4 | Farm 5 | Weighted Average | Standard Deviation |
|---|---|---|---|---|---|---|---|
| Income | |||||||
| Income from Milk Sales | 95.6% | 93.3% | 95.6% | 95.5% | 95.6% | 95.5% | 1.0% |
| Income from Meat Sales | 4.4% | 6.7% | 4.4% | 4.5% | 4.4% | 4.6% | 0.9% |
| Variable costs | |||||||
| Animal feeds and concentrates costs | 34.8% | 23.9% | 31.6% | 52.9% | 45.7% | 43.0% | 11.6% |
| Fodder costs | 17.4% | 6.5% | 12.3% | 3.9% | 17.1% | 13.8% | 6.0% |
| Other direct costs | 6.5% | 15.2% | 1.8% | 7.8% | 5.7% | 6.4% | 4.5% |
| Fuels, lubricants and energy costs | 3.9% | 6.5% | 7.9% | 11.8% | 7.1% | 7.4% | 2.5% |
| Total variable costs | 62.6% | 52.2% | 53.5% | 76.5% | 75.7% | 70.6% | 12.3% |
| Fixed costs | |||||||
| Cost of labor | 21.7% | 37.0% | 33.3% | 13.7% | 11.4% | 16.6% | 12.3% |
| Fixed costs for facilities and machinery | 0.4% | 2.2% | 2.6% | 2.0% | 1.4% | 1.4% | 0.8% |
| Total fixed costs | 22.2% | 39.1% | 36.0% | 15.7% | 12.9% | 18.0% | 12.8% |
| Administrative and management costs | |||||||
| Indirect costs | 15.2% | 8.7% | 10.5% | 7.8% | 11.4% | 11.3% | 2.6% |
| Total indirect costs | 15.2% | 8.7% | 10.5% | 7.8% | 11.4% | 11.3% | 2.6% |
| Farm | Feed | Animal Breeding | Milking | Manure Management | CF Milk | |||
|---|---|---|---|---|---|---|---|---|
| Feeding Consumption | Enteric Fermentation | Barn Consumption | Consumption | Storage Emissions | ||||
| 1 | 0.614 | 0.065 | 0.779 | 0.114 | 0.078 | 0.105 | - | 1.76 |
| 2 | 0.359 | 0.069 | 0.414 | 0.015 | 0.045 | 0.002 | 0.0002 | 0.90 |
| 3 | 0.599 | 0.006 | 0.668 | 0.024 | 0.14 | 0.034 | 0.0006 | 1.47 |
| 4 | 0.654 | 0.066 | 0.737 | 0.057 | 0.115 | 0.005 | 0.0007 | 1.63 |
| 5 | 0.419 | 0.046 | 0.479 | 0.018 | 0.023 | 0.019 | - | 1.00 |
| R | R2 | R2 Adapted | Standard Error | F |
|---|---|---|---|---|
| 0.818 | 0.668 | 0.558 | 0.06190 | 6.050 * |
| Independent Variable | Coefficients | t test | Confidence Interval for B 90.0% | |
|---|---|---|---|---|
| Lower Limit | Upper Limit | |||
| (Constant) | 0.039 | 1.167 | ||
| ln(CFi) | −2.919 | −2.460 * | −0.448 | −0.010 |
© 2016 by the authors; licensee MDPI, Basel, Switzerland. This article is an open access article distributed under the terms and conditions of the Creative Commons Attribution (CC-BY) license (http://creativecommons.org/licenses/by/4.0/).
Share and Cite
Cecchini, L.; Torquati, B.; Paffarini, C.; Barbanera, M.; Foschini, D.; Chiorri, M. The Milk Supply Chain in Italy’s Umbria Region: Environmental and Economic Sustainability. Sustainability 2016, 8, 728. https://doi.org/10.3390/su8080728
Cecchini L, Torquati B, Paffarini C, Barbanera M, Foschini D, Chiorri M. The Milk Supply Chain in Italy’s Umbria Region: Environmental and Economic Sustainability. Sustainability. 2016; 8(8):728. https://doi.org/10.3390/su8080728
Chicago/Turabian StyleCecchini, Lucio, Biancamaria Torquati, Chiara Paffarini, Marco Barbanera, Daniele Foschini, and Massimo Chiorri. 2016. "The Milk Supply Chain in Italy’s Umbria Region: Environmental and Economic Sustainability" Sustainability 8, no. 8: 728. https://doi.org/10.3390/su8080728
APA StyleCecchini, L., Torquati, B., Paffarini, C., Barbanera, M., Foschini, D., & Chiorri, M. (2016). The Milk Supply Chain in Italy’s Umbria Region: Environmental and Economic Sustainability. Sustainability, 8(8), 728. https://doi.org/10.3390/su8080728