1. Introduction
Nowadays, in the context of globalization and international integration, the competition in the marketplace becomes more and more severe; and winners are usually the ones with critical advantages. In such a business environment, every company needs innovative differentiation for its survival and sustainable thriving [
1] because customers prefer high value added and risk-free quality products/services. Hence, focusing on improving the quality of a product/service with high speed and low wastage production has been highly appreciated over the last few years. Companies also well recognize that they must distinguish themselves from their rivals by standing high in their quality standards of their manufactured products/catering services. With a good quality scheme, a company can sustain its development by gaining its critical competitive advantages over its competitors, high yield and low wastage. Montgomery [
2] considers several approaches for ongoing quality improvement. Among them, the failure mode and effects analysis (
) is a systematic technique initially employed to define, identify, and prevent known and/or potential failures from the process before the final products reach the customer; thus, it can effectively enhance the quality of a system by minimizing the losses in manufacturing time due to the problems that arise in the machining process, thereby increasing customers’ safety and satisfaction [
3]. Literally, the
can also be sufficiently implemented as a system or process design tool. It possesses notable capabilities of disclosing insidious failure modes, quantifying the causes and effects of failure modes from varying chunks of the system and components, and determining a list of prevention priorities that could reduce chance of failures. Over the design stage of the system and processes, our focus is on warding off the failure modes in advance as the analytical results of
yield significant benefits for the company in terms of time and cost [
4].
was first introduced in the 1960s by the aerospace industry [
5]. It has been well regarded as a beneficial and prominent tool in assessing potential failures and preventing their occurrence [
6], rendering both qualitative and quantitative measures to prioritize the prohibition order of failures and their effects towards the quality of products/service [
7]. Consequently, the execution of
has been long deployed in diverse industries, such as automotive [
8,
9,
10,
11], nuclear, electronics [
12,
13], chemistry [
14,
15], lead-free solder control plan [
16], sugar mill boiler [
17], fuel cells [
18], paper [
19], metal forming [
4], tanker equipment [
20], waste [
21,
22], Hazard Analysis and Critical Control Points audition [
23], households [
24], engineering systems [
25], energy plants [
26,
27,
28], medical devices [
29], pharmacy [
30,
31,
32], health care services [
33,
34,
35,
36,
37,
38], e-commerce [
39], management [
40,
41,
42,
43], software [
44], electronic paper display [
45], and product design [
46,
47].
Traditionally, in
, the metric of the criticality and risk assessment is the evaluation index, which is called risk priority number (
). It is established by consideration of three key ratings on a scale of ten based on the guidelines in
Table 1, namely Severity rating
, Occurrence rating
, and Detection rating
[
2].
From the above ratings, the
for a certain failure mode is determined by Equation (
1). The failure modes with a larger
are more prioritized in taking corrective actions to either eradicate or diminish failures. As such, Sawhney et al. [
48] and Daily [
49] pointed that
is a potent tool in determining the order for dealing with a series of failures according to their relative importance that requires corrective actions to improve product quality:
Despite the traditional
being deliberated as one of the upmost tools for preemptive avoidance of failures in the system and processes design, on the basis of the
measure, it has been stressed over lacking the required quality for ranking preventive failure orders [
50]. Emphatically, the
measure fails to deliver an ample discrimination power in some circumstances due to its allocation of the identical weight for
S,
O, and
D ratings [
48,
51,
52], indicating that this weighting scheme places three ratings with an indistinguishable amount on the
. However, literally, the
S and
O are two major affecting factors that should be more prioritized [
53]. We consider three failure modes
A,
B, and
C, for example, whose ratings are respectively given as (
,
,
), (
,
,
), and (
,
,
). Obviously, the
for three failure modes is all equal to 160. Regardless of the ratings of severity, occurrence, and detection in this case, where the
metric is the only decision index, three modes are equally emphasized, leading to dispersion and ineffectual utilization of accessible resources as certain modes have more negative impact than others [
48]. Hence, if each of the rating components is prudently scrutinized, a more rational decision can be offered. For instance, although
A occurs more frequently than
B,
B should be probed before
A because
B has shown to be more severe than
A. Likewise,
B and
C have the same occurrence rating of four and the detection of
C is really low, say 8 in 10, but
B still requires more priority in practice because
C has exhibited less severity than
B. Based on the analyses, we conclude that corrective actions should be foremost allotted for
B.
To conquer the above shortcomings, a number of scholars have proposed alternatives or modifications of the
index; for example, Xiao et al. [
54] borrowed the minimum cut sets (MCS) theory to establish their index by combining multiple failure modes into a single one and incorporating the importance of failures and assessing their impact on system reliability; Liu et al. [
50] contributed a certain measure dealing with lean manufacturing systems; Gargama and Chaturvedi [
55] proposed a fuzzy
model for prioritizing failure modes based on the degree of match and fuzzy rule-base to tackle the limitation of traditional
. However, their strategies still left some room for amelioration. Sawhney et al. [
48] proposed a substitute index named Risk Assessment Value
, which is determined by Equation (
2). In their method, they believed that effectual detection and control of failures play a salient role in minimizing failure occurrence as well as severity [
56]. Furthermore, according to bench-marking the performance between
and
, Kirthik et al. [
56] found that
provides a better list of priority order. Nonetheless, with the aforementioned case, their
of
A,
B, and
C are respectively obtained as
,
, and
. That is, which one of
A and
B is of importance is still undecided. In short, although the
scheme performs better than the
one, in certain cases, it still demonstrates insufficiently in the submission of a justifiable determination:
Moreover, Gilchrist [
57] and Kmenta and Ishii [
58] suggested constructing a so-called “expected cost” to present
S, whereas probability of severity is embedded to the
O and
D measurements. Nonetheless, for the practical viewpoint, their definition of the expected cost neglects three costs pertaining to technical issues. The first one is the failure costs incurred from the faulty products; especially when they are not fully detected before being delivered to consumers, the accompanied warranty and compensation costs due to customers’ possession of the defectives would inundate. Likewise, the intangible cost rises from losing business reputation that seriously sabotages the comparative advantage of the whole organization. Finally, the varying maintenance costs emerge from heterogeneous failure modes such as repairable or irreparable ones. Consequently, to remedy the above drawbacks and enhance the discrimination power of
, in this paper, we redefine the cost in a more general term called “quality cost”; that is, we recognize the quality cost as a crucial factor and integrate it into the conventional
formula. Our proposed scheme is called an “Extended Risk Priority Number” measure, denoted as
.
The rest of this paper is organized as the following.
Section 2 presents our extended
approach with the construction procedure of
, while an empirical case study at a non-woven fabrics manufacturer is discussed in
Section 3 in demonstration of the applicability of our proposed
index. Some managerial implications and concluding remarks assemble the last section.
2. Our Extended FMEA Approach
This section presents the development of our proposed extended risk priority number . Assume that there are n identified failure modes existing in a production process. For jth mode (), the following denotations are used.
: occurrence probability of the mode;
: detection probability of the mode;
: severity level of the mode from a technical perspective (in service industry, is actually the timing of the process), evaluated on a traditional scale of 10;
: severity level from an economic perspective in internally dealing with the mode; thus, it closely relates to so-called “internal failure costs”;
: severity level from an economic perspective in externally dealing with the mode; i.e., the level of external costs occurred after non-detected faulty product/service is delivered to external customers; thus, it is actually a part of so-called “external failure costs”;
: the probability of a casualty caused by the mode if the faulty item fails to be detected before delivery;
: severity level from economic perspective for a casualty caused by the mode. If the failure mode may lead to fatal losses, the is assigned with an extreme value so that it can be carefully considered in the manufacturing and quality controlling processes. Hence, it is actually another part of so-called “external failure costs”.
Kremer [
59] stated that a failure rated with
can be 100% detected, whereas
means no chance for the detection. Thus, based on the reviews by Chang and Wen [
60], Chang et al. [
61], General Motor Corp [
62], and Liu et al. [
63], and
Table 1, we formulate the relationships between
and
, or between
and
, are as in Equations (
3) and (4):
Then, the modified index
of the
jth failure mode is determined by
Equation (
5) with the quantity of
obviously considers the effects of a failure when it is not detected by the control system. In addition,
and the conventional
have some similar characteristics; for example, the lower detection probability in
(i.e., smaller) is respectively to the higher of
D in
, as shown in Equation (4). Moreover,
also reflects the impacts of external failure costs on the amplitude of
; specifically, if the probability of detecting failures is low, the chance of a faulty product/service delivered to customers is certainly high, resulting in higher
, implying that the
jth failure mode would be more prioritized. The values of
,
,
, and
are evaluated as the following.
2.1. Evaluation of Severity of Failures from Technical Perspective
The severity level of technical failures
is determined based on key requirements about technology, aesthetics, fundamental characteristics and specified standards. Basically, the failures may result from input materials, production process, control methods, labor, facilities, and even from the impacts of working environment. Hence, for each failure (potential or detected), vigilant identification of its major causes is required so that we can assess the remedial possibilities in terms of technology, process, facilities, control methods and labor forces. It is also critical to gauge its inferior disturbance on the next stages in the production process, product quality and customer perception. Thus, the severity
in
is actually the severity level
S in the traditional
.
Table 2 illustrates an example of evaluation of the technical severity
used for non-woven fabrics manufactured in Company P, which is mentioned in
Section 3.
2.2. Evaluation of Severity of Failures from an Economic Perspective
As mentioned above, quality cost closely related to quality assurance of semi-products and finished products in all stages of production process from inputs to outputs and using period by customers. The quality cost can be divided into four groups: (1) prevention costs; (2) appraisal costs; (3) internal failure costs; and (4) external failure costs [
2]. Among them, the first two groups are controllable while the last two ones directly relate to production process, which accounts for a significant part of the total cost of an organization. Thus, this paper investigates the last two groups as a key component in our proposed
.
Internal Failure Cost (IFC) are actually the costs that occur due to the quality of incompliance of any component, part, material, product, and/or related service provided that defective products are detected before being delivered to the customer. takes a value of 0 if no defective product is found prior to delivery. Particularly, it consists of the following components: scrap; rework; retest; failure analysis; downtime; and yield losses, etc.
External Failure Cost (EFC) includes all costs occurred due to the failures detected after products are delivered to customers. It takes a value of 0 when all products meet specified requirements. consists of the following components: (1) without-casualty costs : field servicing and handling complaints; recalls, returns, replacements; warranty; other indirect costs because defective products/services lead to the dissatisfaction of customers and their negative impression about the products/services and the manufacturers/providers; consequently, damage customer good-will, lose sales due to bad reputation, etc.; and (2) casualty costs : costs for compensating any possible casualty to customers due to the faulty item, or . Therefore, for every failure mode, we need to fully identify associated and so that proper solutions for quality improvement can be achieved.
Additionally,
and
can be respectively converted into
and
with the following procedure. Assume that we have
n failure modes in the production process of a product. Let
,
, and
individually denote the internal, without-casualty, and casualty costs of the
mode.
,
and
are then determined by:
where
.
The determination of
,
and
shown in Equation (
6) obviously not only combat the shortcomings of the
in a conventional
approach and the
proposed by Sawhney et al. [
48], but also contemplates the severity level of two prominent quality costs, namely
and
of the same failure mode; i.e., for a failure whose
is higher than
, we can conclude that the inspection for defects should be especially concerned in the final stage of quality control to minimize defective products delivered to customers because its external cost is higher than that if internally detected; or, if
is higher than
, we need to carefully investigate and eliminate the causes for the failures in each stage of the production process. Precisely, our proposed index is disparate from that of Nguyen et al. [
64] with respect to the detailed distinction of the external costs, especially the cost for casualty.
3. Practical Application
In order to evaluate the applicability of the proposed for sustainable manufacturing, we conduct a practical study of a manufacturer of non-woven fabrics.
3.1. Overview of the Non-Woven Fabrics Industry
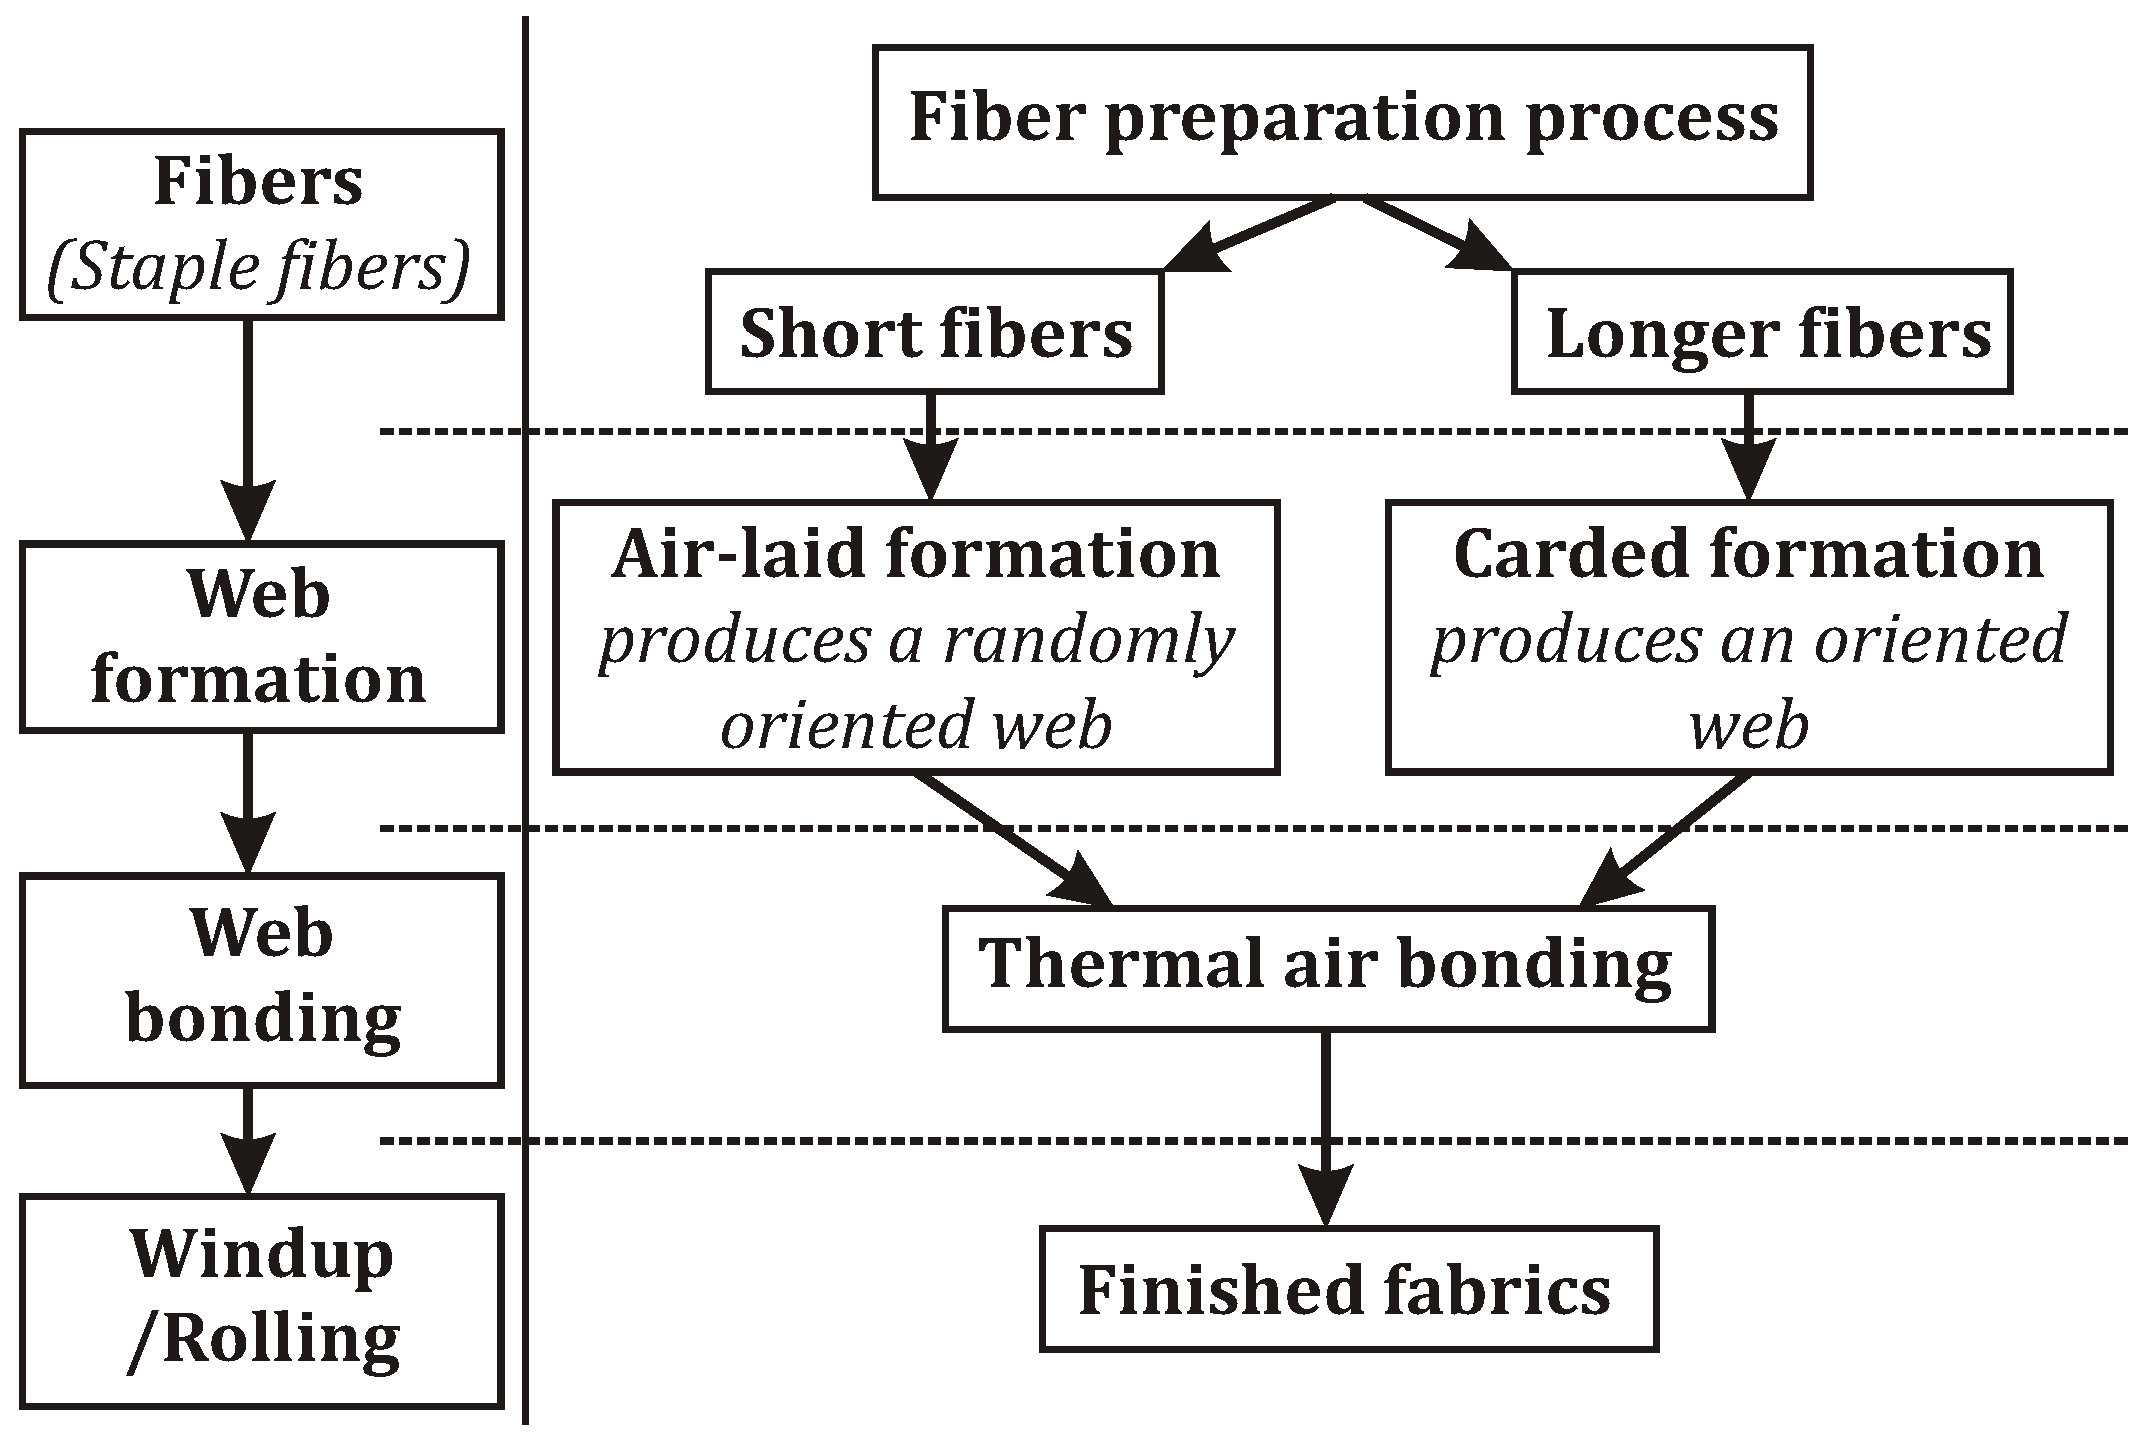
In the non-woven fabrics industry, all non-woven fabrics are based on fibrous webs and so the characteristic of the web determines the physical properties of the final product. The manufacturing of non-woven fabrics customarily consists of two discrete phases: forming of webs and bonding of webs. A satisfactory web for non-woven fabric production of a specific weight is produced with minimum weight variation along its length or across its width. In the bonding process, the sheet’s characteristic can be controlled by a number of parameters that depends on the type of entanglement used in the process.
The general manufacturing process is briefly presented in
Figure 1. After being unloaded, staple fibers are fed into an opener machine in which a series of sharp hinges separate the fibers from the bundle into small pieces suitable to be conveyed by the air blowers. Then, a cotton-mixer blends the fibers and breaks them into clusters. After that, the fibers are transported to a store cotton machine that is resorted to store the fibers and send them to the carding machine when needed. Whenever the carding machine needs the fiber input, it automatically sends a signal to the cotton storage machine and other ones. To minimize manual intervention and thereby maintain a flawless production environment, qualified sensors and relays are usually used in the automatic processes.
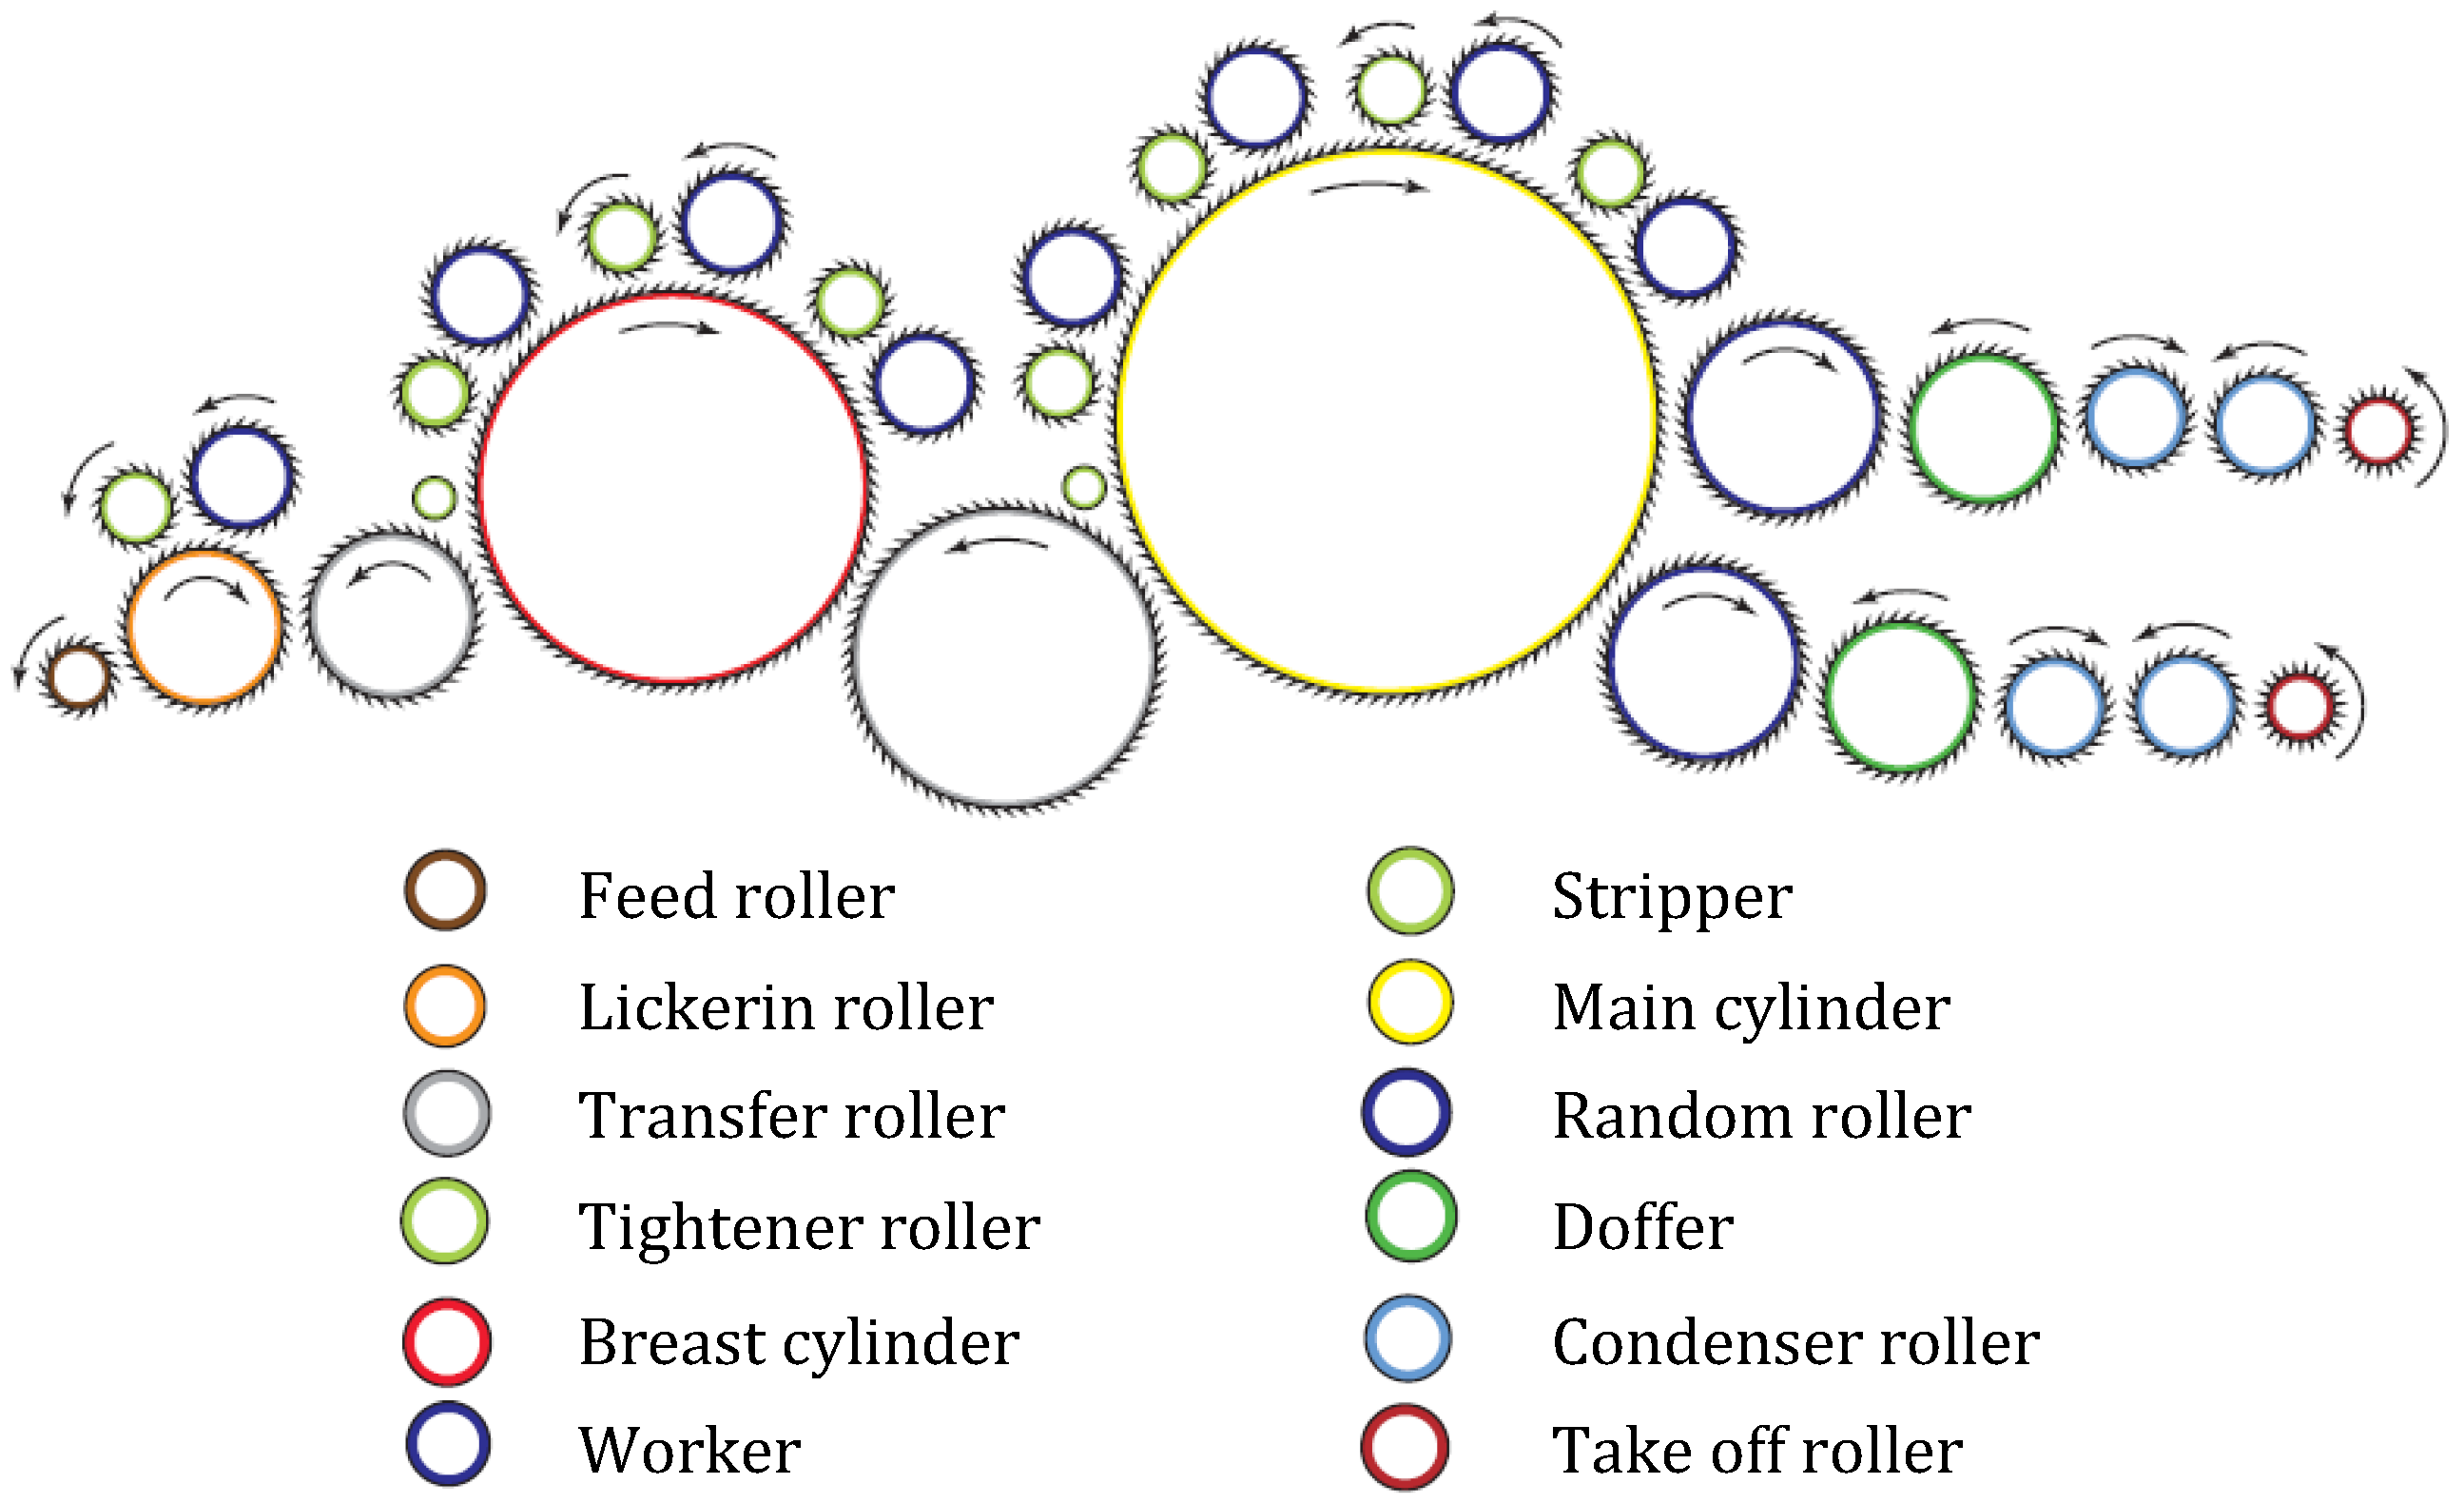
In the fiber preparation and web formation, the fibers are straightened and separated into individual fibers with minimum or low fiber breakage and distributed in a parallel manner before being transformed into the form of a web. The principal mechanism in these processes are shown in
Figure 2, where the rollers are positioned, colored, and named accordingly.
The rollers presented in
Figure 2 handle various types of actions including: combing, carding, stripping and doffing. Specifically, the combing action is the first process in the web formation where the fibers are arranged in a straight and parallel manner; thus, short fibers and longer ones are accordingly separated along with the impurities by combs that are structured similarly to the rollers and brushes. After that, the fibers are carded, i.e., fibers are blended and oriented by the flat roll and cylinder to get uniformly arranged fibers. With different speed of rollers rotating in opposite directions, a parallelized fiber web is obtained. In the stripping and doffing actions, strippers move the fibers from the cylinder to the doffer wheel by means of speed differentiation maintained between the two rollers. The doffer rotates at a lower speed than that of the cylinder so that the doffer can collect the fibers and make them into a web. Traditionally, for a multilayered web, more than one carding machine is required. However, this can be done with a random carding technique by operating two doffer rollers in the same machine. The number of machines demanded in the non-woven line for the production of multi-layered webs can be minimized by the manipulation of the random card.
Finally, a web consisting of two or more layers needs to be bonded by either mechanical or chemical or thermal methods. Among which, the thermal air bonding is preferably deployed because it is environmentally-friendly without any latex binder, and it also consumes less energy compared to foam bonding or hydro entanglement bonding. In this type of bonding, it is in charge of controlled and heated air inside a chamber with varying temperature zones to allow the thermoplastic fibers to be melted and softened before they are cooled down to become a bonded sheet with a smooth surface and high strength that can be applied in various applications. Typically, the temperature is responsible for the texture and the strength if the final fabric, i.e., a low temperature produces an uneven bonded soft sheet or a weak tensile, while a high temperature leads to a hard texture and a plastic-like sheet. In the case of more complicated fabrics, patterns/textures and colors can be created and embedded on two sides of the sheet by using hot patterned rollers with suitable pressure and temperature.
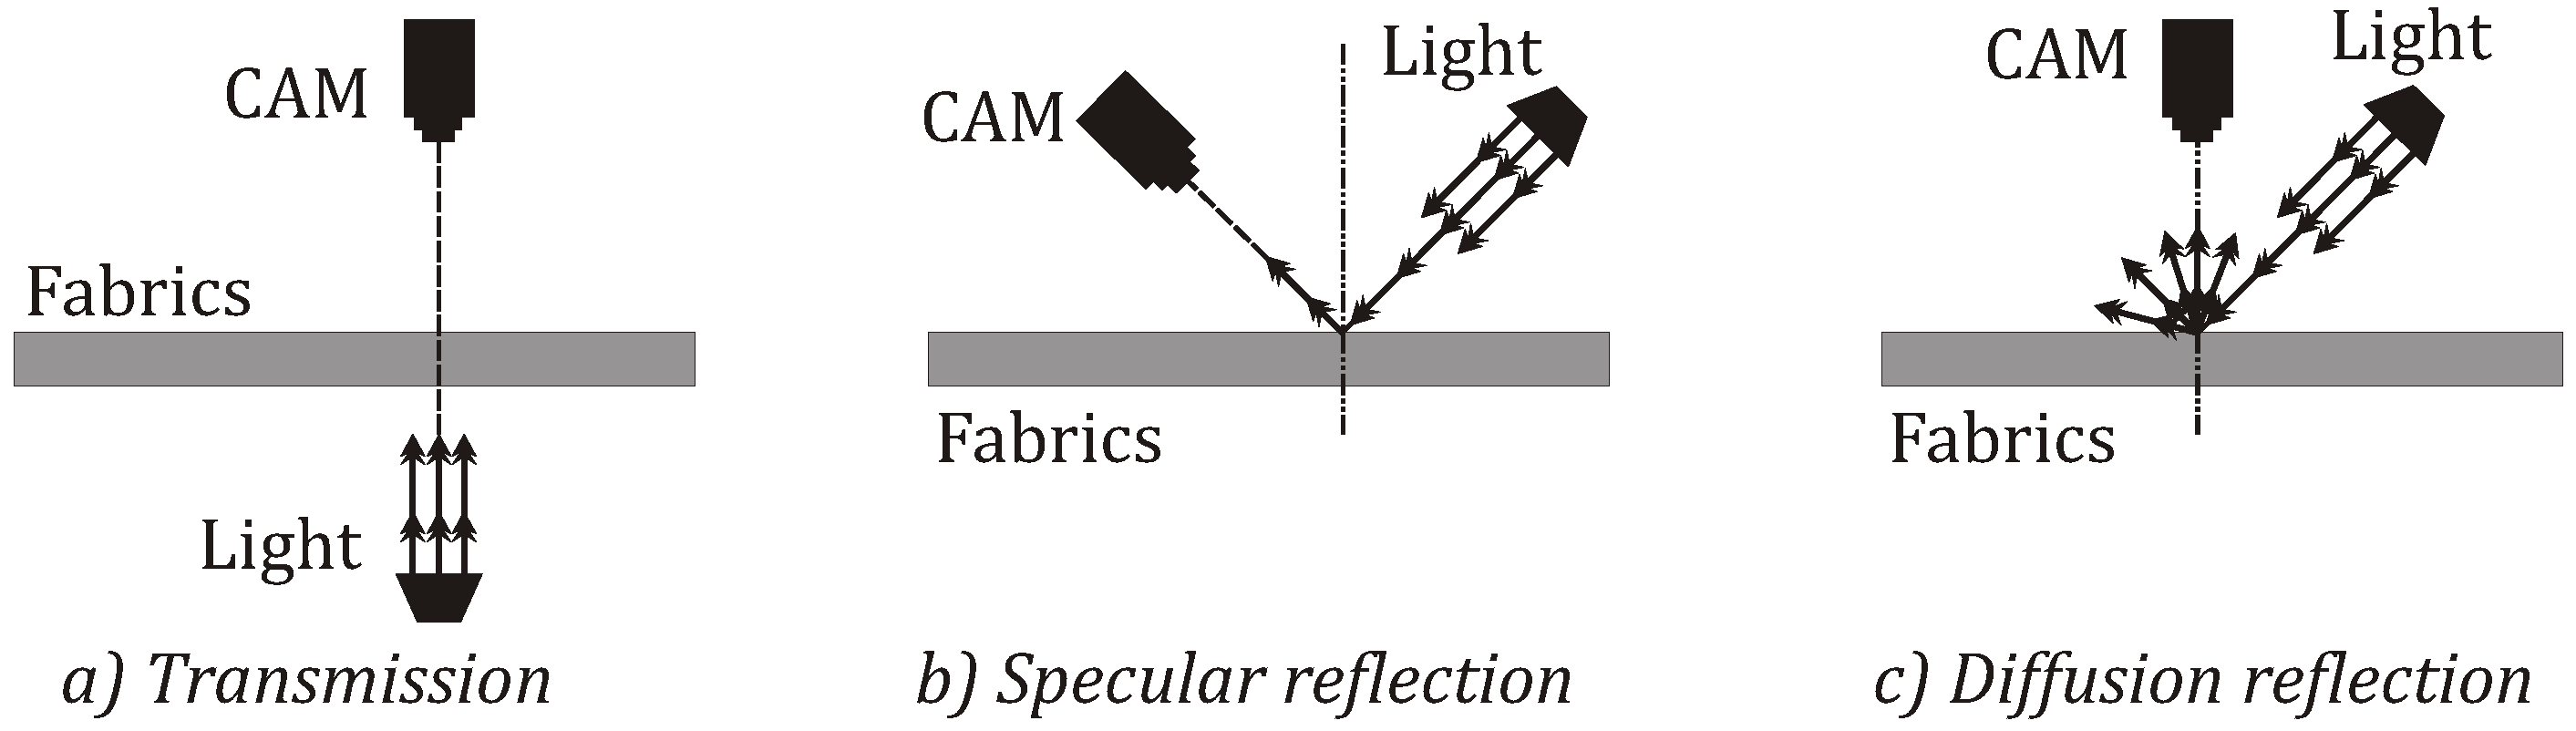
Importantly, before delivered, the sheets deserve to be attentively inspected to assure they meet certain customers’ standards/specifications. Thus, an acceptable quality inspection system is mandatory. It should consist of multiple CCD (charge-coupled device) high speed cameras to detect any contamination, flaws and impurities like dust or insects present on the sheet. Practically, common defects in the non-woven manufacturing include wrinkles, stains, tears, holes, insects, and different colored fibers. Thus, the system can effectively help its manufacturer satisfy its customers with flawless products.
There are three common approaches for the system setup including light transmission, specular reflection and diffusion reflection as shown in
Figure 3. The first approach works based on the fact that the presence of foreign materials or impurities leads to the change in the intensity of the light while the second one works based on the fact that uneven surfaces or impurities can affect the amount of light reflected to the camera due to the light diffusion. Moreover, in the diffusion approach, the change in the level of the light reflected from the sheet can of great help to identify defects by the diffusion properties of light; thus, it is usually employed in the non-woven fabrics industry.
3.2. EFMEA at Company P
This study examines the feasibility of the proposed approach at Company P, which is a non-woven fabrics manufacturer located in Ho Chi Minh City, Vietnam. Basically, the company usually has unfavorable problems in terms of delay of delivery schedules and wastes of materials due to their defective fabrics that account for about 2.41% of total manufacturing. Such a high percentage of defectives certainly reduce the annual performance of the company. To deal with this problem and minimize the volume of noncomforming products, an team is formed that consists of 12 members who are administrators, top engineers, group leaders, and quality engineers responsible for distinct processes.
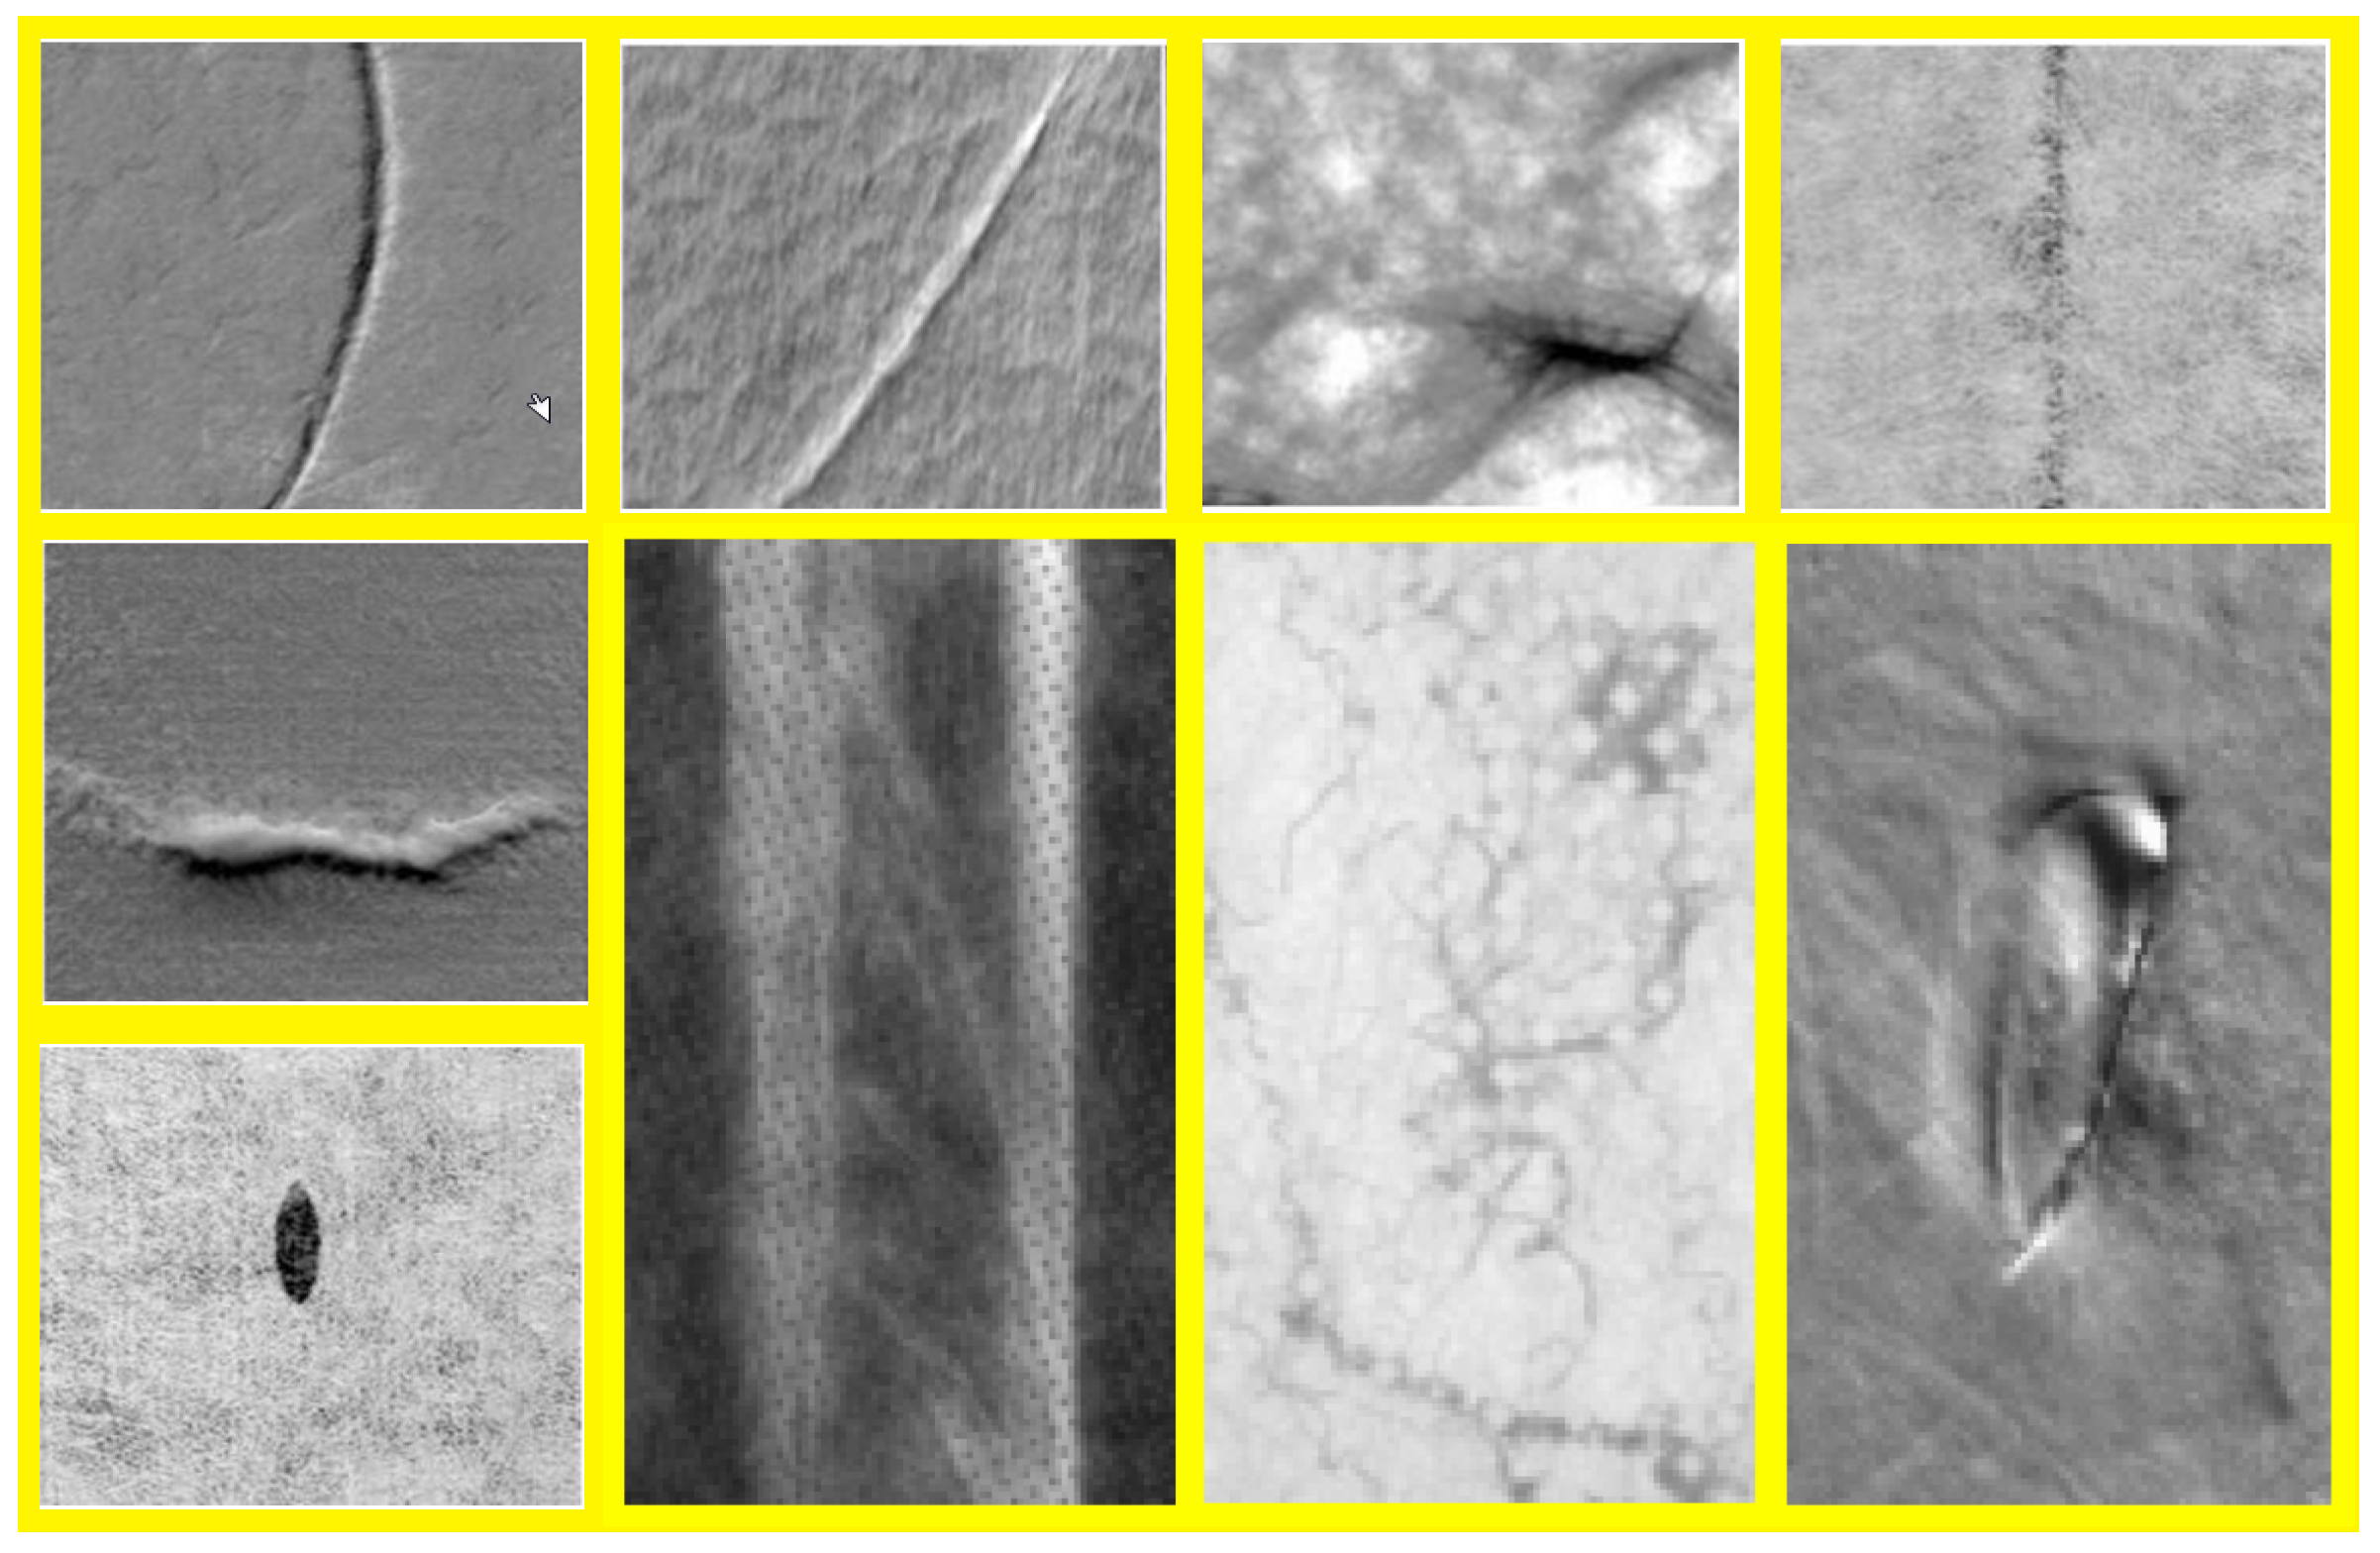
Through the inspection system, the
team has identified the following major 18 failure modes: Holes; Eyebrows; Polymer Drips; Broken Filaments; Dirt; Wrinkles; Bond Points; Fusions; Light Spots; Dark Spots; Thin Spots; Thick Spots; Calendar Cuts; Meltblown Filament Drops; Scratches; Streaks; Clumps; and Contamination. Some of their typical images are shown in
Figure 4.
Related costs,
and
, of the failures were deliberated by the
team as shown in
Table 3. Notably, the
team believed that there is no chance of a casualty caused by these failure modes; therefore, for
,
always gets a value of 0 and the external failure costs for casualty were disregarded in this empirical study. Consequently, only external without-casualty costs
were considered in
. With these costs, the values of
, and
in Equation (
6) were easily obtained as illustrated in
Table 4.
With the conventional
approach and the extended one, the team determine the relevant values for the specified parameters in Equations (
1) and (
5) as shown in
Table 4 from which the risk priorities based on the traditional
and
are accordingly obtained as illustrated in the columns “Pri-F” and “Pri-E”.
Table 4 clearly shows that each approach identifies eight key failure modes with the highest values of either
or
. However, the two approaches may lead to different failure modes detected; thus, the risks are differently prioritized as ranked in the two columns. To have a fair comparison, eight failure modes with the highest values of
and
were selected and carefully investigated for root causes. Consequently, actual corrective actions between the two approaches can be different and may lead to different results.
By observing the results in
Table 4, the
team investigated 11 failures in total for causes and then proposed feasible solutions to rectify the problems. Moreover, to evaluate the performance of our proposed
in comparison with the traditional
, the
team chose two production lines with the homogeneous production conditions (facilities and worker’s ability). Each line focused on their most prioritized solutions; specifically, the first line (Line 1) works with the solutions for failure modes selected under the traditional
approach, and the second line (Line 2) works under the extended one as briefly presented in
Table 5. After corrective actions and adjustments have been properly implemented, the two investigated lines concurrently produced trial lots in five consecutive working days. We then checked all of the produced fabrics sheets of each line separately, and found that the defective products in the line are, respectively, 1.49% and 1.13% of the total manufactured sheets. These figures indicate that the priority order obtained from our extended approach outperforms that from the conventional
.


