2.1. The Study Area
The study site was located in the Inner Mongolia Grassland Ecosystem Research Station (IMGERS; Chinese Academy of Sciences) in the Xilin River Basin, Inner Mongolia, China. The Xilin River Basin is the major base of livestock husbandry in China. There was practically no human activity in this region before the 1950s, and the first extensive cultivation started in 1953 [
14]. Meanwhile, the grazing intensity was at a very low level until the grasslands were thrown open to private use in 1978. In past decades, the grassland in this region was exposed to over-grazing and irrational reclamation, which has resulted in pasture degradation and desertification, with the area even becoming an important sand source for the sandstorm of Beijing. In this study, four vegetation sites, an enclosed
Leymus chinensis and its neighborhood free-grazing field, a
Stipa baicalensis steppe, and a spring wheat field, were selected. The habitat characteristics of the four sampling sites are listed in
Table 1.
2.2. Plot Description and Soil Sampling
The L. chinensis steppe lies in the middle of the Xilin River, used for raising sheep and goats. The constructive species of the steppe is L. chinensis and the dominant species are Stipa grandis and Cleistogenes squarrosa. The steppe has 86 species of flowering plant, with coverage of about 40%–50% and a height of 40–50 cm in July and August. Meanwhile, it has a 20–30 cm organic soil layer with a texture comprised of 60% sand, 21% clay, and 19% silt. The ungrazing treatment plot, with an area of 24 ha, was fenced and excluded from grazing in 1979. The grazing treatment plot was about 200 m outside of the fenced plot. The grazing pressure was at 2–3.7 sheep·ha−1, according to the native herders, which was regarded as moderate grazing intensity, although the stocking rate given by the local government was 1 sheep·ha−1. The ungrazing plot and the grazing plot were formerly floristically and topographically similar.
The S. baicalensis steppe lies in the upper Xilin River. It is utlilized as a mowing pasture and the frequency of mowing is once a year, always in mid- or late August. The indicator of the steppe is S. baicalensis; the density of plant is 29–39 species·m−2, with coverage of about 50%–90% and a 50 cm humus layer. The cultivation treatment plot of the spring wheat field was adjacent to the S. baicalensis grassland treatment area and had been established as part of the S. baicalensis steppe in 1972. It has similar topography, precipitation, and temperature conditions to the S. baicalensis steppe. The tillage system was spring wheat-fallow rotation, and spring wheat is usually sown in early April and harvested in late August. A fertilizer with 150 kg·ha−1 diammonium phosphate, and 60 kg·ha−1 special fertilizer for wheat containing 18% N, 16% P2O5, and 6% K2O, and 37.5 kg·ha−1 urea was applied as the base fertilizer before sowing in each cropping year, and there was no irrigation applied during the period of the study.
Before the growing season in 2010, three random plots (100 m × 100 m) within each (240,000 m2) of the 4 sampling sites were selected to serve as replicates. The plots were at least 50 m apart from each other and from the edge of the sampling sites to avoid edge effects. We established 1 quadrat with 1 m × 1 m at each sampling plot and investigated aboveground and belowground plant biomass. The aboveground plant biomass was clipped at ground level by hand with all of the plant species in a quadrat combined. The belowground biomass from 0–20 cm was measured by soil auger (9.7 cm in diameter), with 9 auger cores in each quadrat for one composite sample. The plant biomass was measured 7 times during the growing season; once in May, June, and September, and twice in July and August.
The soil samples were collected during the growing season (from May to September) of 2010 from the four sites, with a sampling frequency of four times and about 50 days for one sampling. Within each quadrat, three soil cores (5 cm in diameter), comprising one complete sample, were randomly collected at depths of 0–10 or 10–20 cm in an S-shaped pattern; from the same layer of each plot, a total of nine samples were collected for three composite samples, which were designated as duplicates, considering that the sampling size was large (240,000 m2) and the heterogenetic nature of soil characteristics. After removing the plant roots and large stones by sieving (2 mm), all the composite samples were stored in an icebox and transferred to the laboratory. Each composite sample was then divided into three subsamples. One of them was stored at 4 °C prior to the analysis for microbial community carbon sources utilization, microbial biomass, plate counts of culturable microorganisms, and activities of urease and invertase; another one was air-dried and ground prior to the determination of SOC, total N (TN), and soil pH; and the last one was stored at −20 °C for mineral N concentration analysis and the soil water content determination. Results are presented in the per unit weight of oven-dry soil (105 °C).
2.4. Soil Microbial Community Carbon Sources Utilization Pattern
Soil microbial community carbon source utilization was constructed using Biolog EcoPlates (Biolog Inc., Hayward, CA, USA). Briefly, 10 g soil was suspended in 100 mL 0.145 M NaCl, and then the soil suspension was shaken at 200 rpm for 20 min on a reciprocal shaker. After setting for 30 min, the soil suspensions were diluted to 10
−3, and a 150 μL aliquot of the soil solution was dispensed into each well of the Biolog EcoPlate using an 8-Channel Repeating Pipette. The plates were then incubated at 25 °C in the dark for 10 days. The color development was measured as absorbance at 590 nm every 24 h using the Microlog Rel 4.20 software (Biolog Inc., Hayward, CA, USA). Microbial community carbon utilization activity was expressed as average well-color development (AWCD), calculated using the 96 h incubated data as follows [
16]:
where
xi is the optical density value measured at 590 nm in substrate
i in the Ecoplates,
c is the value measured in the control well, and 31 is the number of carbon sources.
The functional diversity as measured by the Shannon index (
H), defining the species richness, was calculated as follows [
17]:
where
pi is the ratio of the corrected absorbance value of each well to the sum of the absorbance value of all wells and
n is the total number of carbon sources.
2.6. Soil Properties Analysis
Soil pH was measured by glass electrode using a soil to water ratio of 1:2.5. The soil samples were oven dried for 24 h at 105 °C to determine soil water content. The NO
3−-N and NH
4+-N content was measured by a continuous-flow ion auto-analyzer (AA3 Bran + Luebbe, Germany). The SOC and the total N contents were determined by wet oxidation with K
2Cr
2O
7 and the Semi-micro Kjeldahl methods using air-dried soil samples [
19]. Soil bulk density was determined by the core method (100 cm
3 volume). The carbon stock (Mg·ha
−1) in the top 20 cm was calculated by the following equation:
where
BD is the soil bulk density (g·cm
−3) and
H is the depth of the sampling soil (m).
The aboveground plant biomass was measured by hand clipping, and the belowground biomass was measured by wet sieving soil cores collected using a soil auger (9.7 cm diameter).
2.7. Statistical Analyses
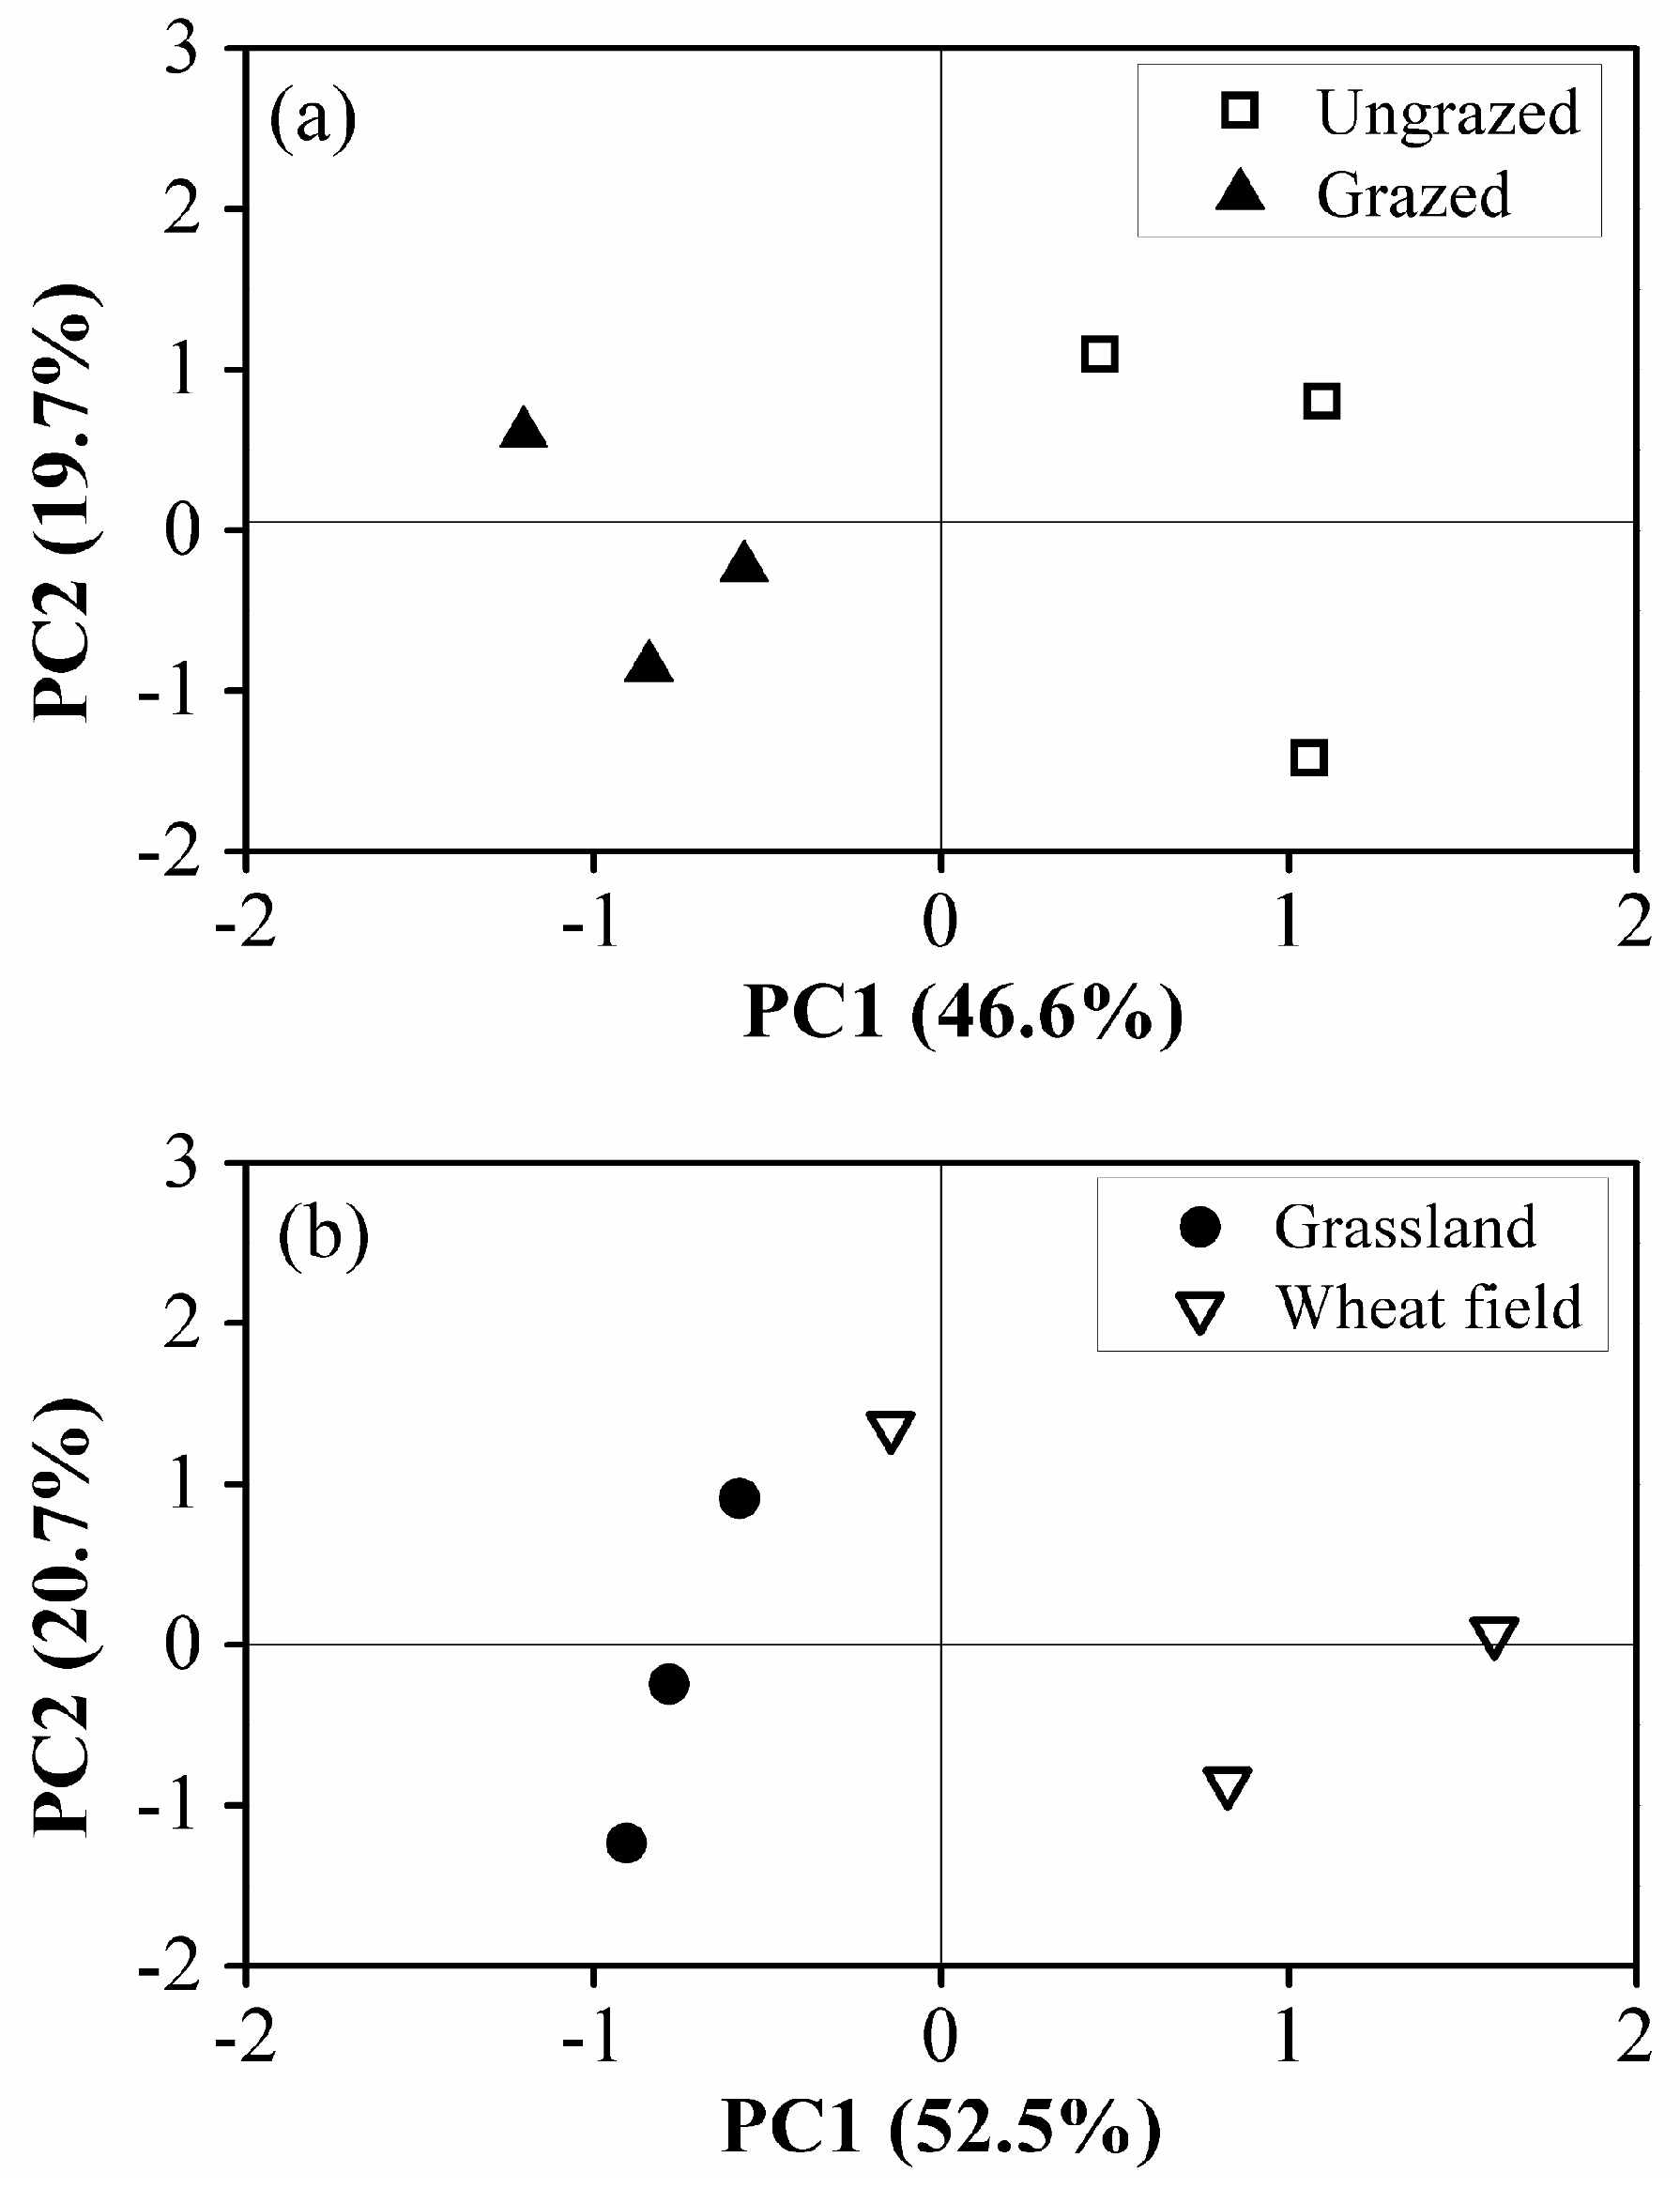
The treatment effects on soil, microbial properties and plant biomass were tested by the paired samples t-test, and a one-way ANOVA was performed on the data from different soil depths. Multivariation analysis was used to indicate the interaction among treatments, sampling time, and soil depth. Stepwise multiple regression analysis was applied to determine the key factors affecting microbial parameters. The absorbance data in the Biolog eco analysis were normalized and principal components analysis (PCA) was undertaken to identify the principal patterns between the treatments. Statistically significant differences were judged using p < 0.05. Graphs were prepared using Origin 8.0 (OriginLab Inc., Northampton, MA, USA). All the statistical analyses were conducted using SPSS Statistics 17.0 (Spss Inc., Chicago, IL, USA).


 ,
, 


