Towards Smarter Urban Mobility: Willingness to Pay for an Advanced Traveller Information System in Lyon


Abstract
:1. Introduction
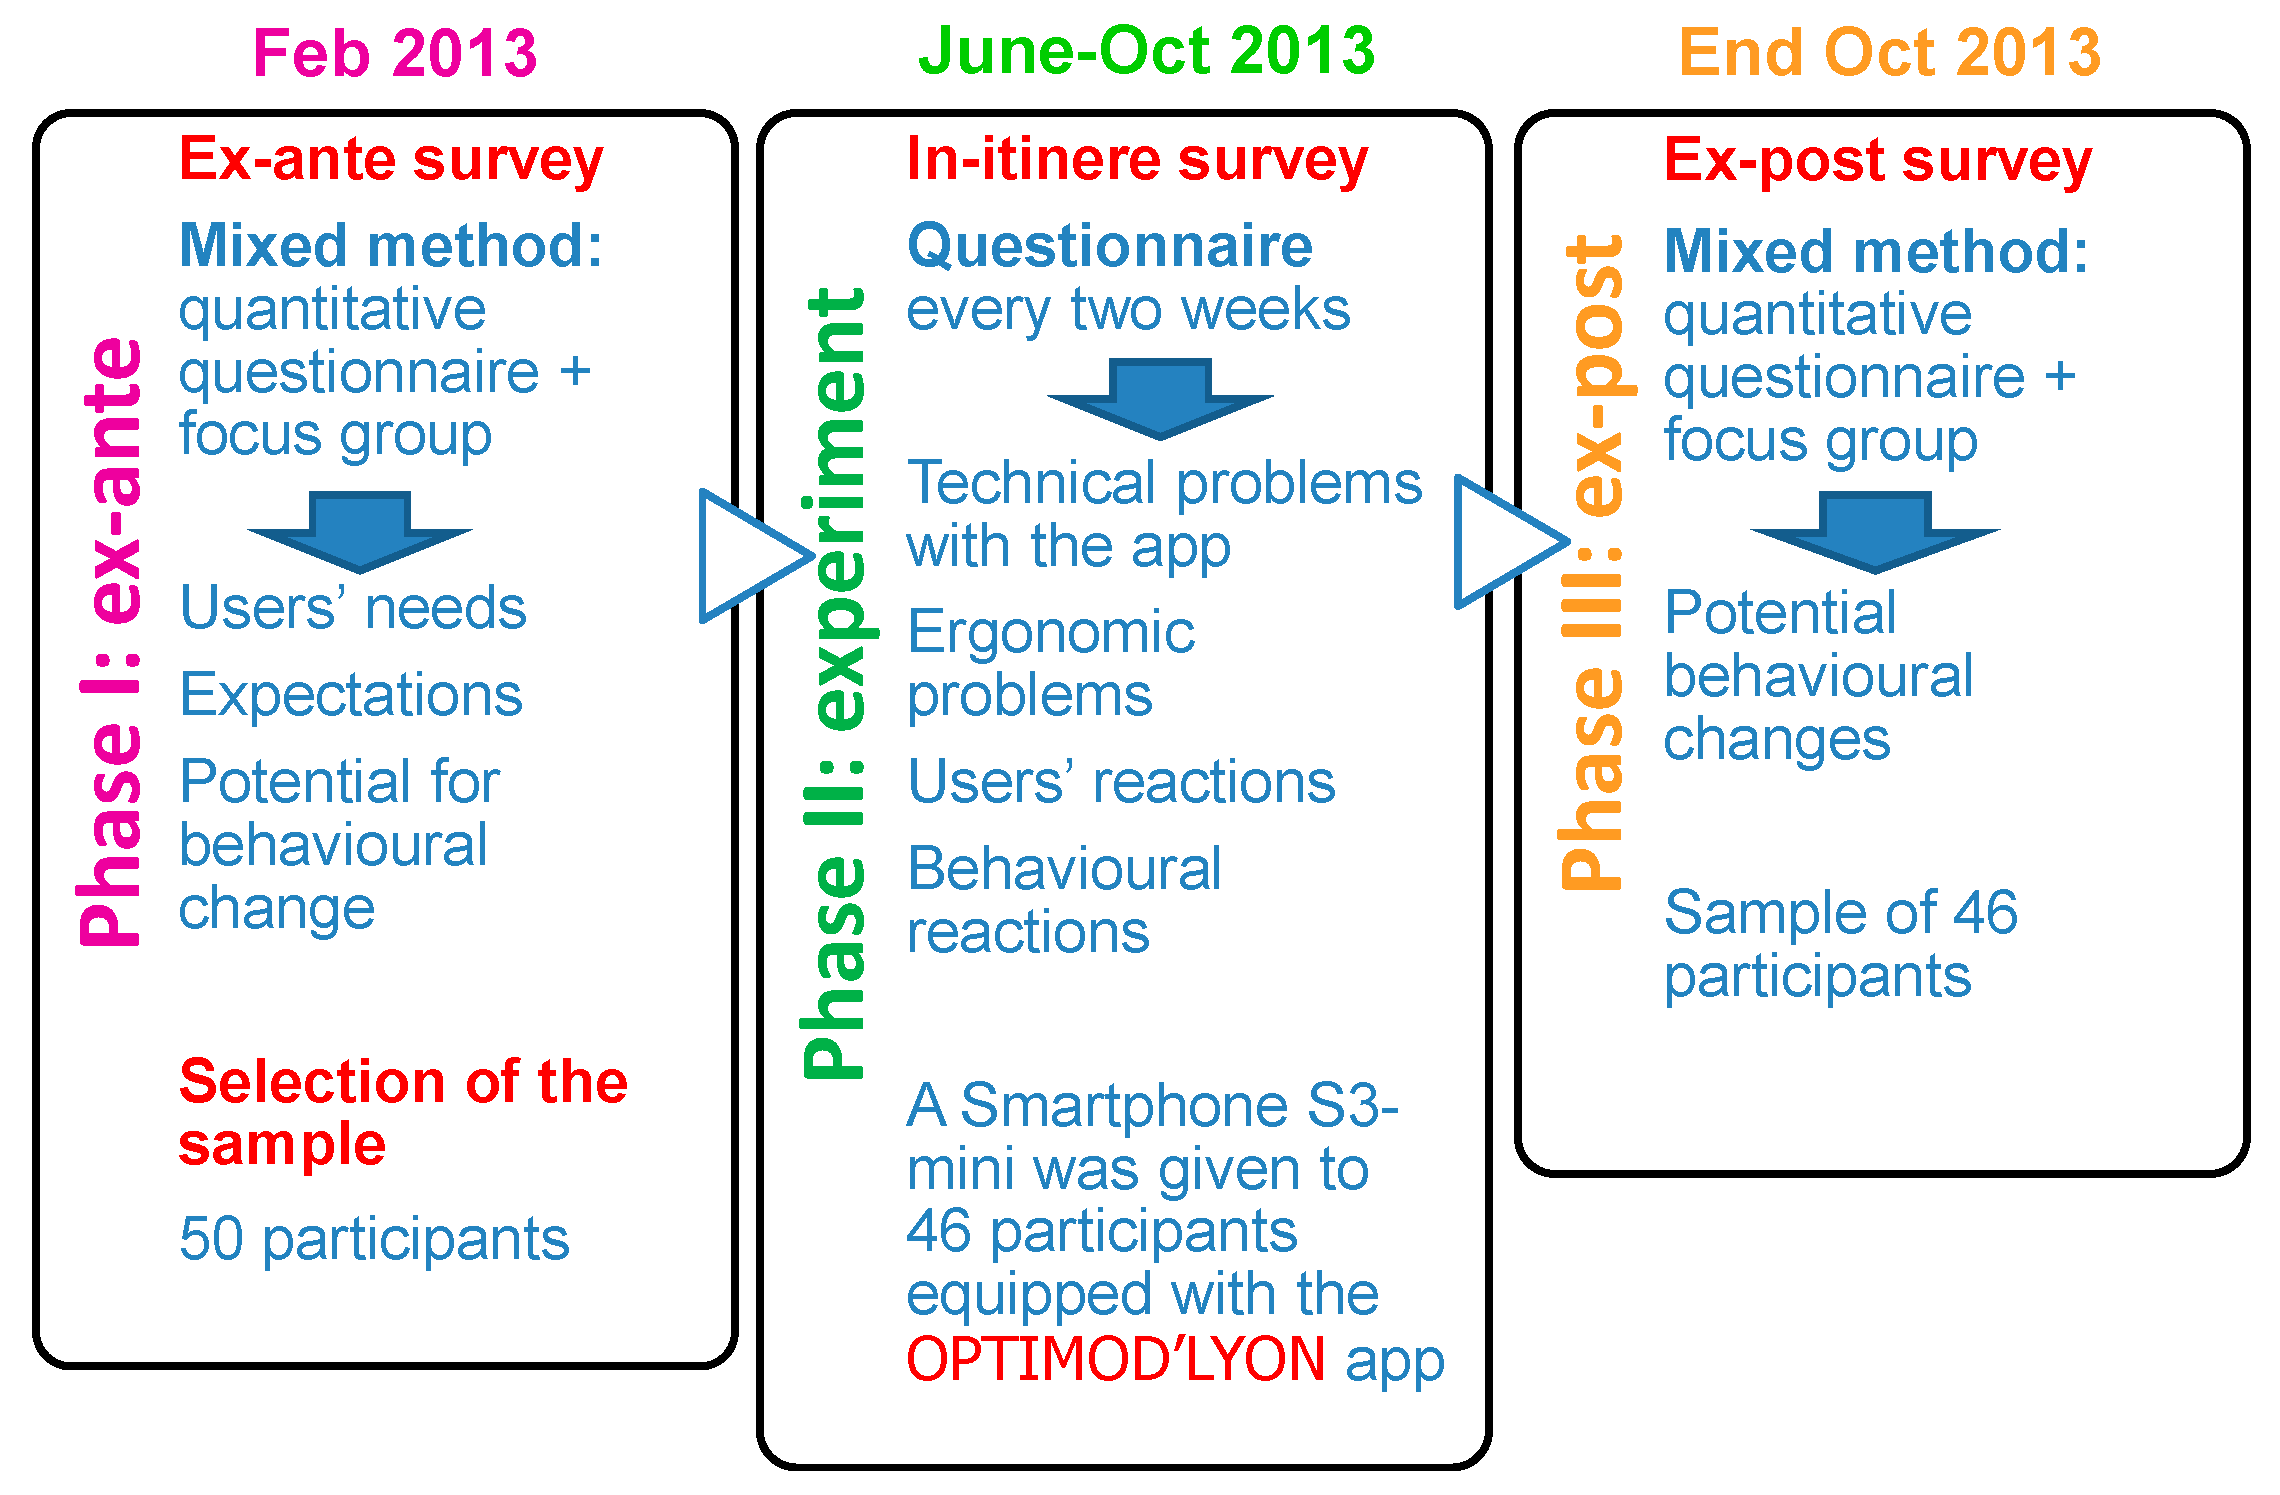
2. Materials and Methods
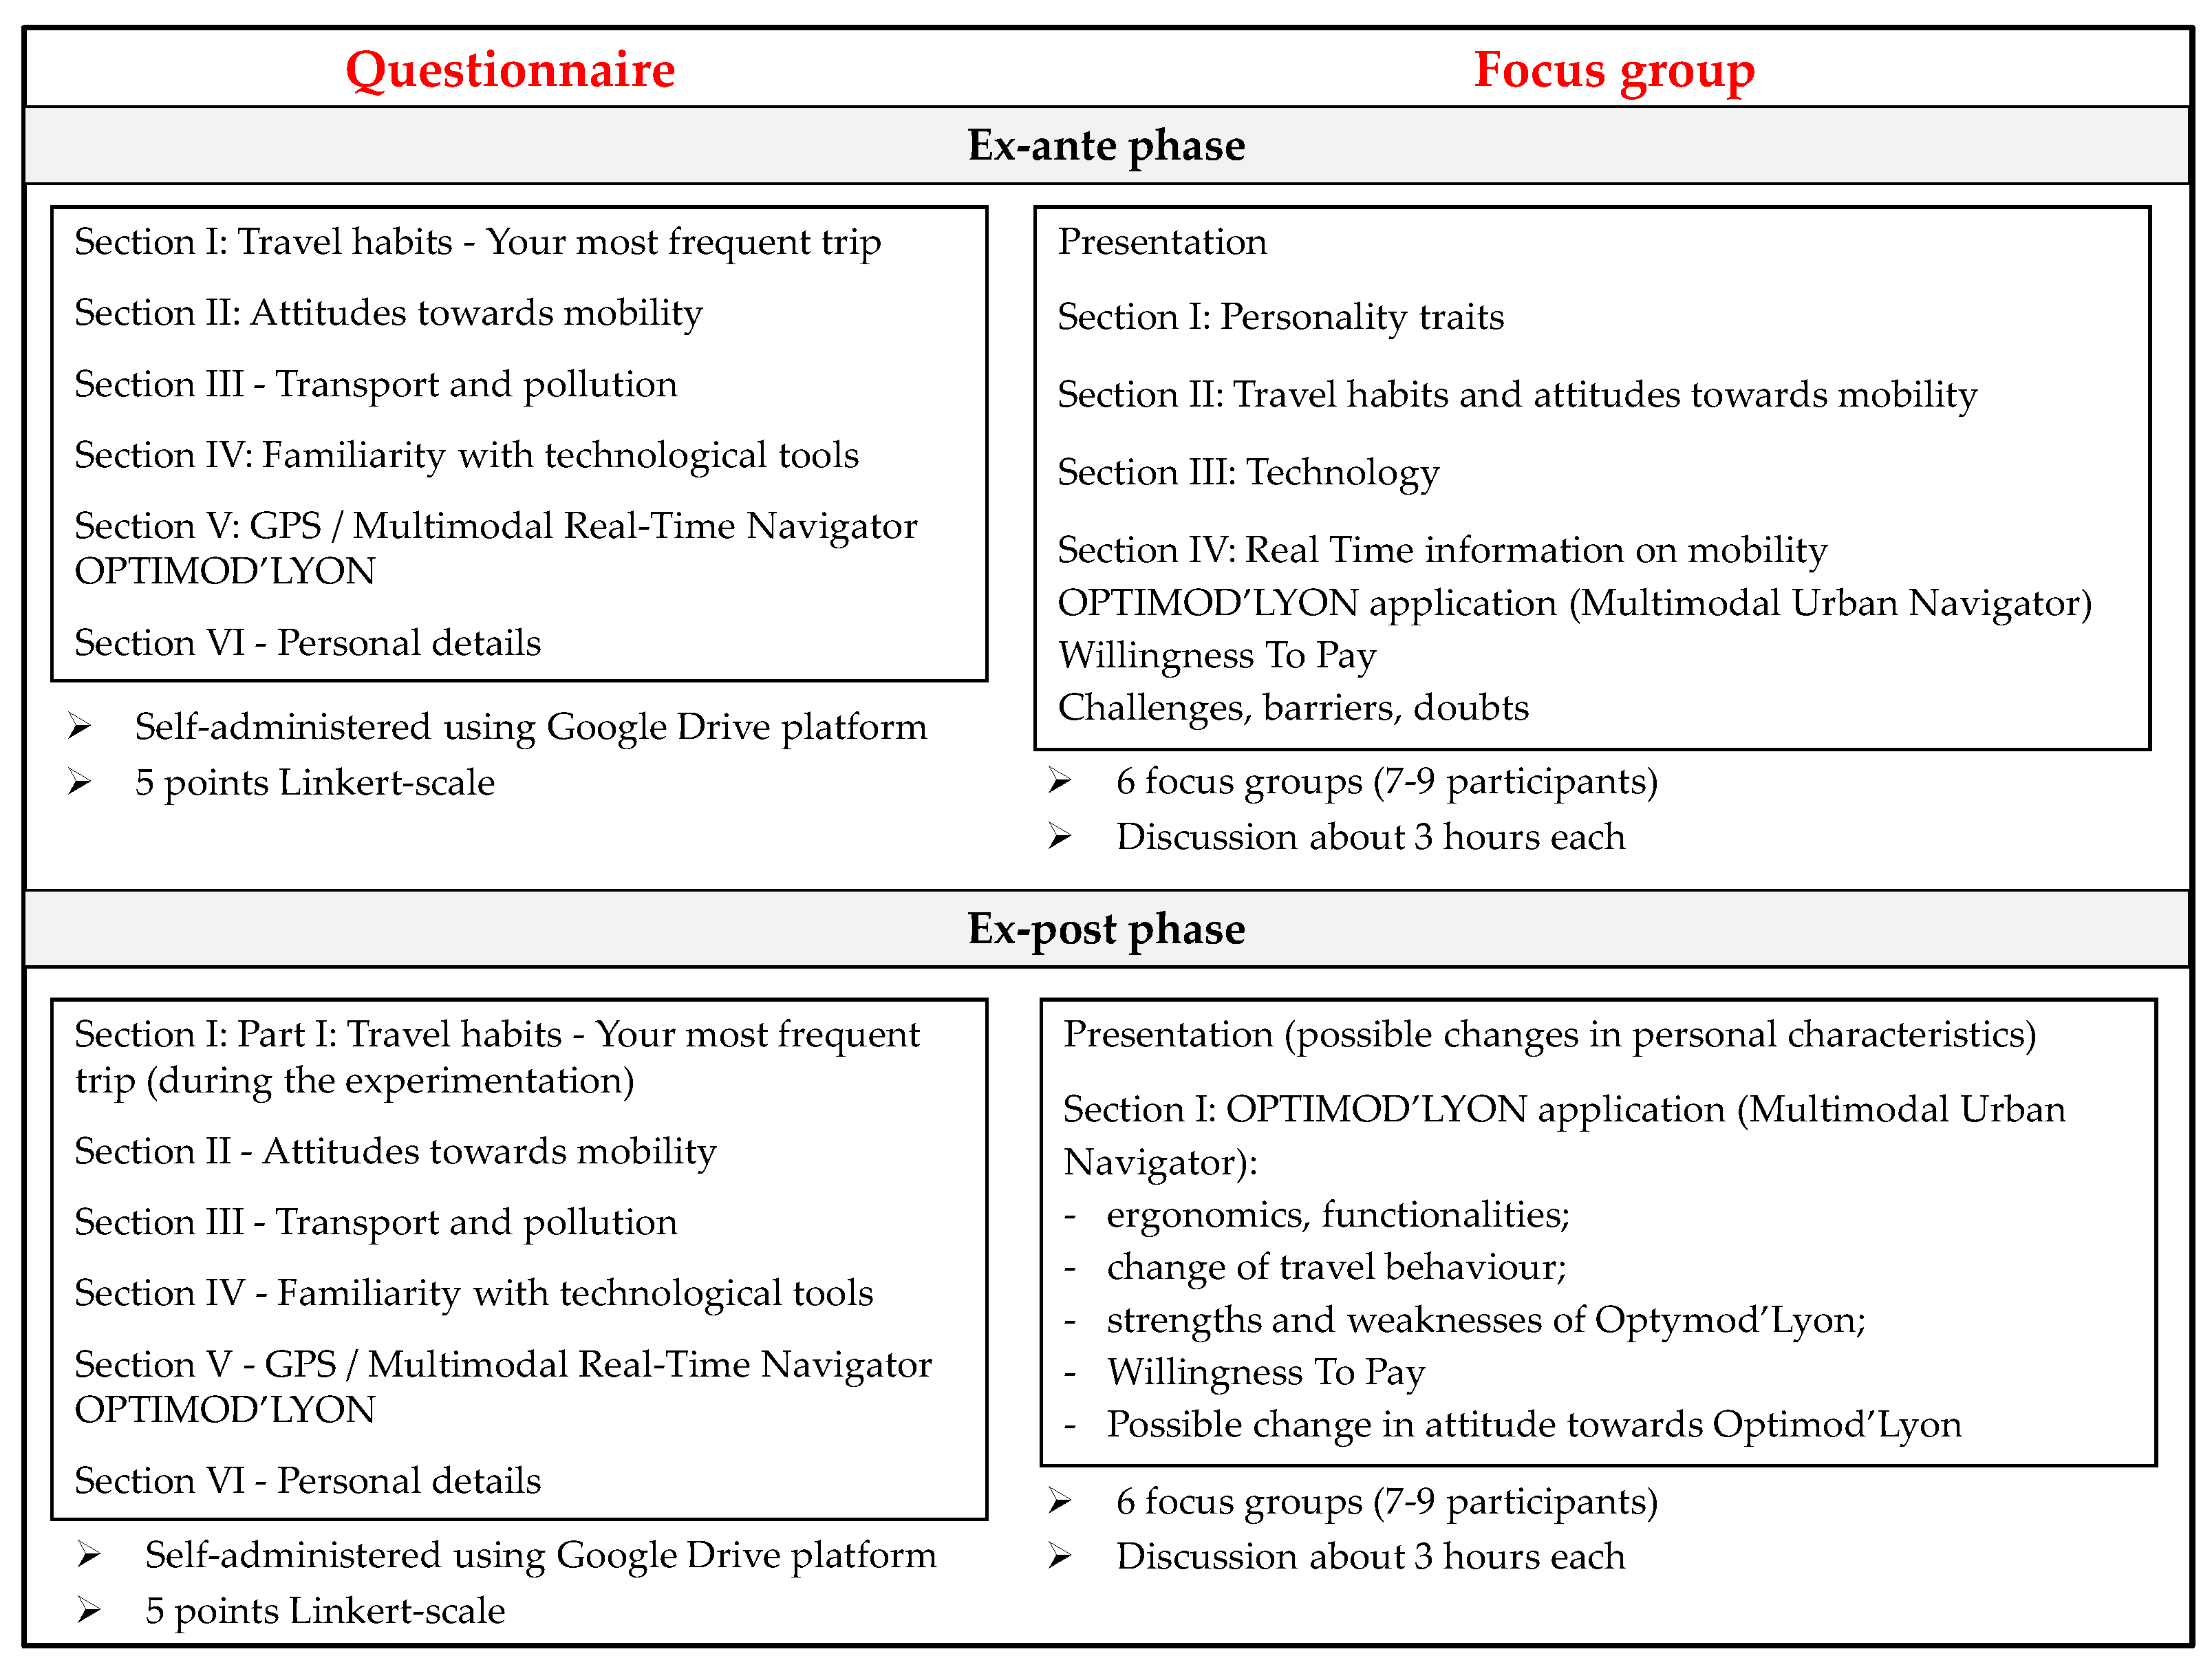
- personality traits and behaviour towards infrequent trips: how people get information, their emotions and sense of direction, and the way they use the information during their trips;
- travel habits: understanding of most frequent travel behaviour, emotions, attitude towards modes, attitude to changing route during the most frequent trips;
- technological habits: ownership of a smartphone, trust in online purchases and technologies, use of technology in their everyday life, ownership of a GPS;
- willingness to use Optymod’Lyon: their interest in the technology and if they would change behaviour by using it; willingness to pay for Optymod’Lyon.
3. Results
- the idealists (n = 12, 28.6%) showing a strong negative attitude towards the introduction of a fee to use real-time information. “I have been used to not paying anything to use applications for 20 years, so it is a problem for me to pay [Didier]”. “I’m talking about my experience, what I have seen abroad, applications which are not so complete, but which are closer to this application and usable for free” [Jérémie];
- the pragmatics (n = 11, 26.2%) expressing a moderate negative willingness to pay. “The same for me […] Because we already pay for so many things each month” [Géraldine]. “The problem is that you already pay the toll for the ring road, the car park because you want to park your car, the public transport when you use it; why should you have to pay to know how to use them (transport systems)? Do you understand what I mean? You already use them [Pierre-Luc];
- the ambiguous (n = 9, 23.8%) representing people not taking a clear stance on their own WTP but not opposed to the introduction of a charge. “The traveller is bit logical, isn’t it?” [Frédéric]. “I have this application, I can benefit from it, I am going to pay, OK, but in the end maybe there will be a benefit, maybe later, in the meantime I am waiting for a benefit if it will come ..., I do not know, we will see”. [Fabrice];
- the opportunists (n = 9, 21.4%) willing to pay for the tool. “That said, I am willing to pay much more ... twice as much if there is a radar detector” [Brice]. “In fact, for me to be willing to pay 4–5 Euros, maximum, it really has to be effective, and it should allow me to save time” [Nouzha].
3.1. The Acceptable Level of Charge and Form of Payment
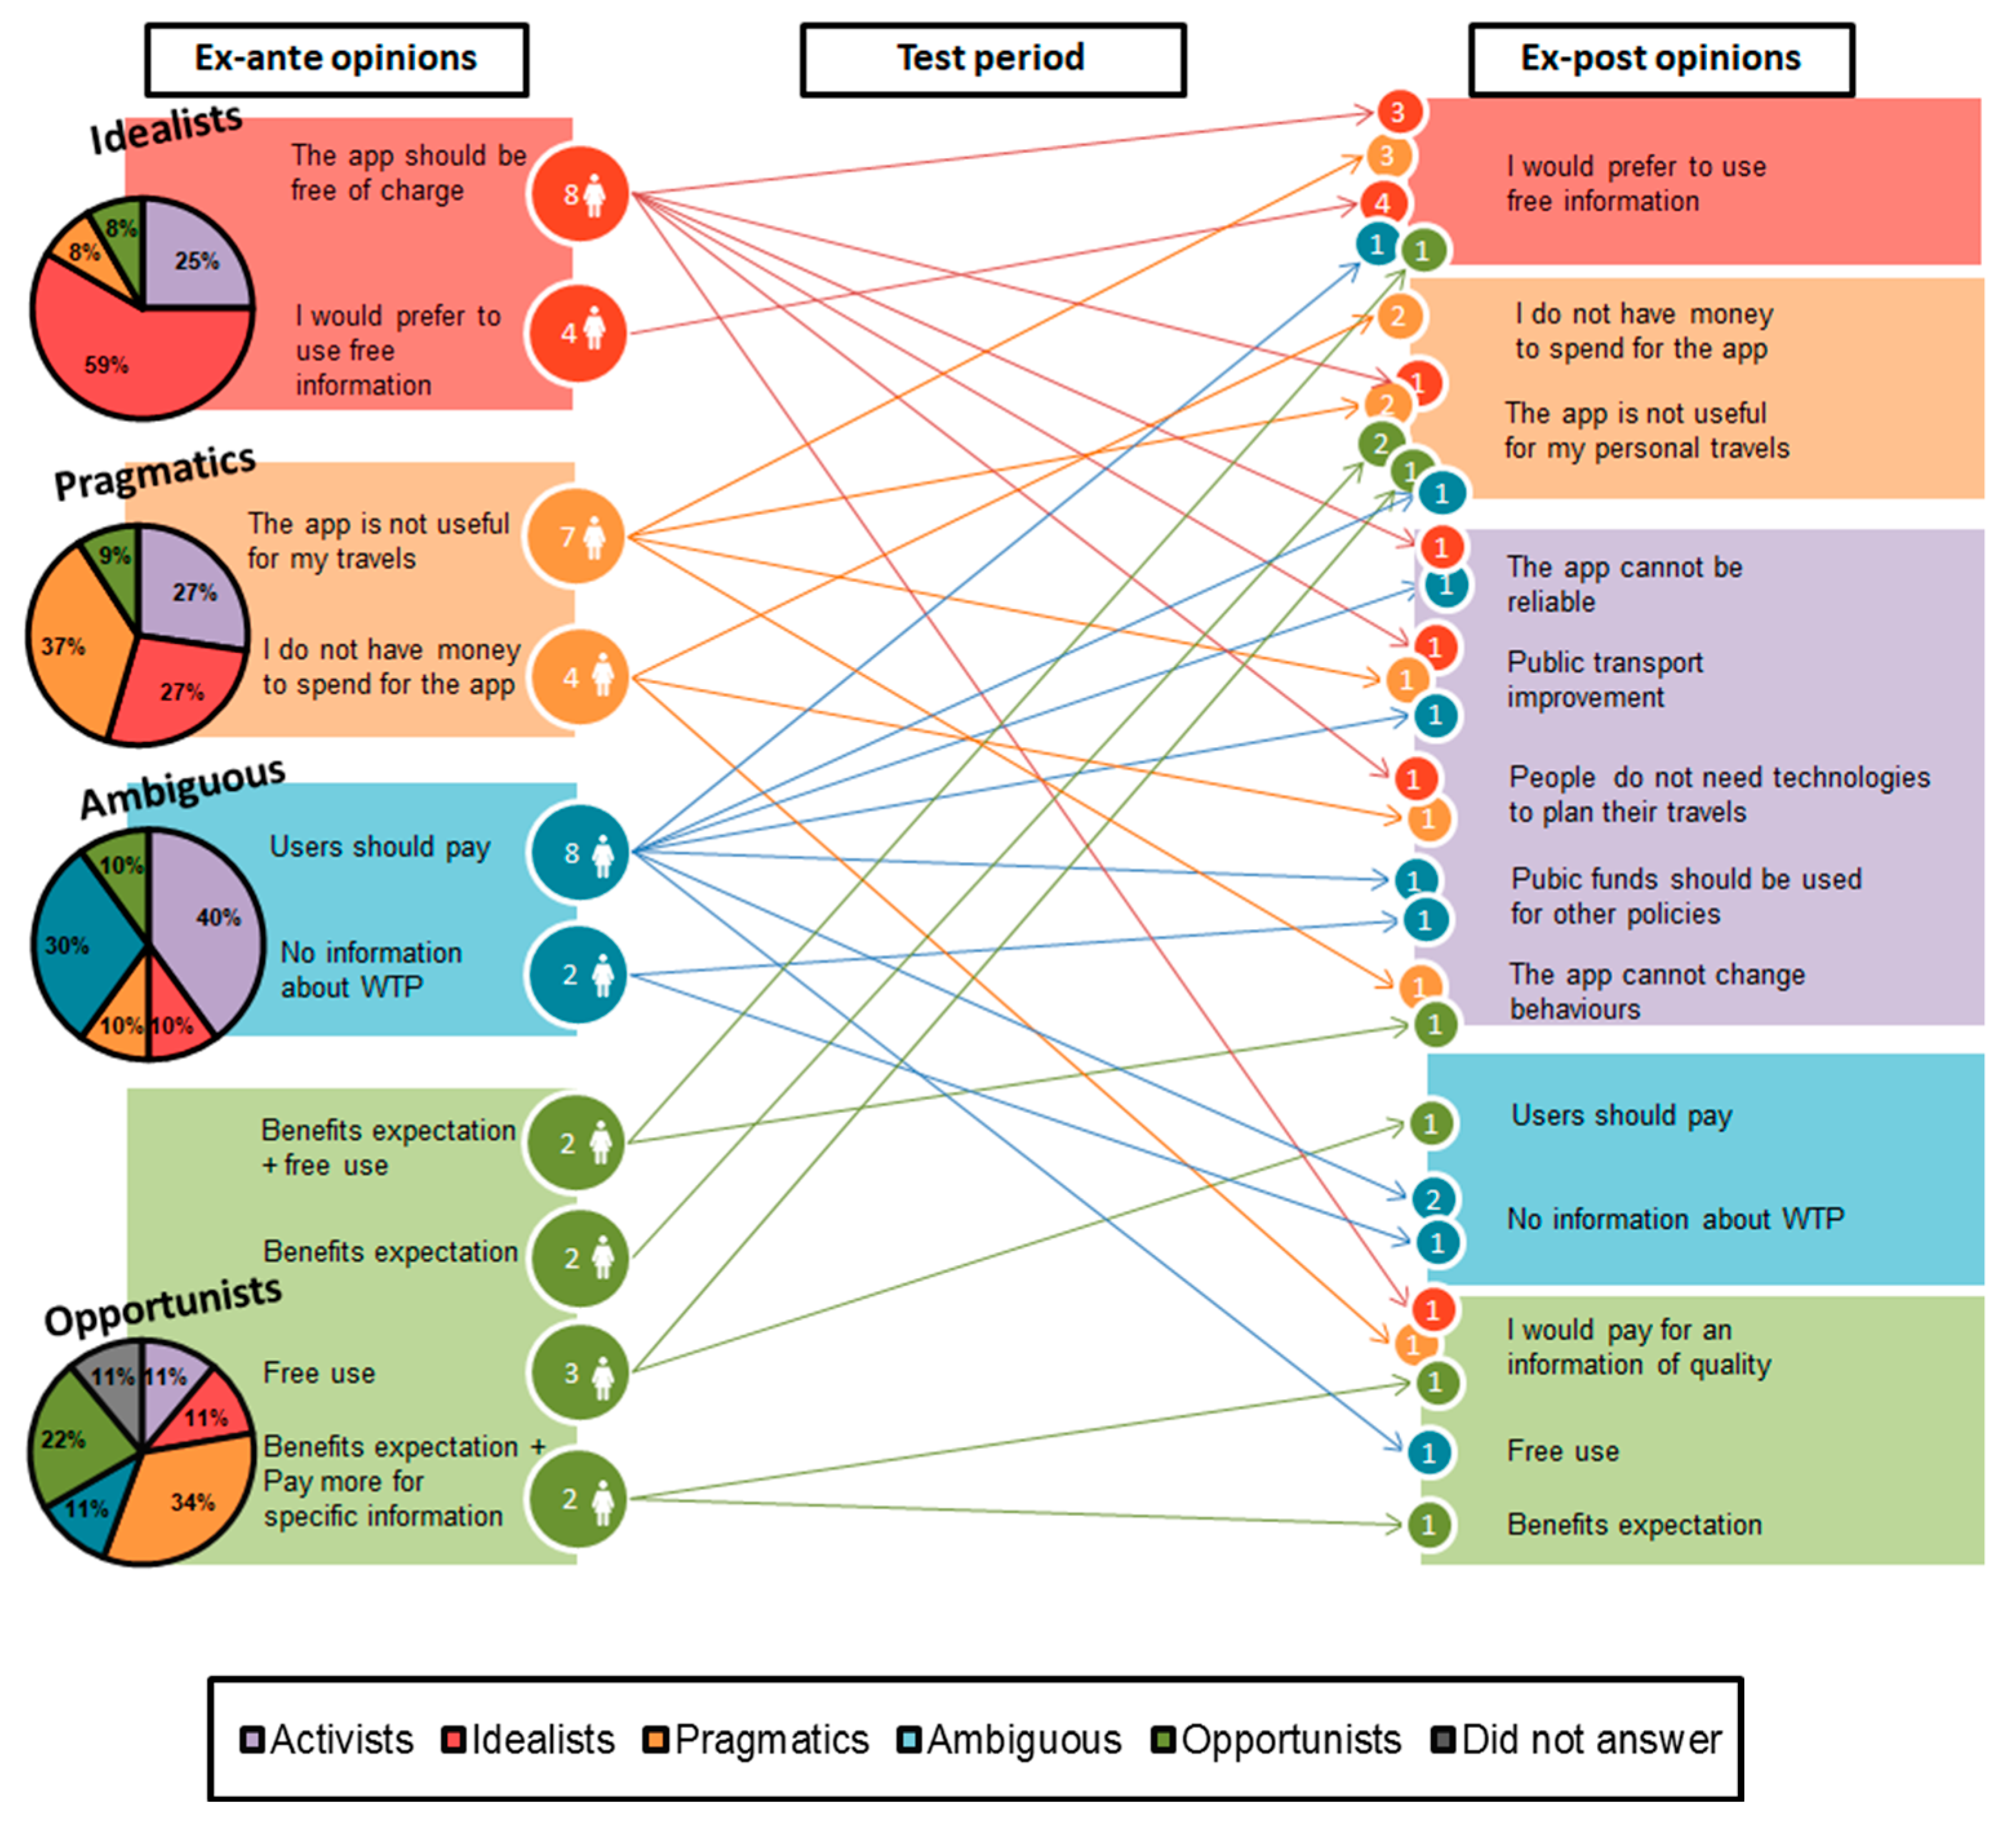
3.2. The Evolution of Attitudes and Opinions After the Test
4. Discussion and Conclusions
Acknowledgments
Author Contributions
Conflicts of Interest
References
- European Commission. Proposal for a Directive of the European Parliament and of the Council; 2008/0263 (COD); Commission of the European Communities: Brussels, Belgium, 2008. [Google Scholar]
- European Parliament and Council of the European Union. Directive 2010/40/EU; Official Journal of the European Union: Bruxelles, Belgium, 2010. [Google Scholar]
- Potoènik, J. Making the European transport industry “greener, safer and smarter” to boost our industrial competitiveness. In Proceedings of the Transport Research Arena Opening Ceremony, Ljubjana, Slovenia, 21 April 2008. [Google Scholar]
- Abdel-Aty, M.; Vaughn, M.K.; Kitamura, R.; Jovanis, P. Investigating effect of advanced traveler information on commuter tendency to use transit. Transp. Res. Rec. 1996, 1550, 65–72. [Google Scholar] [CrossRef]
- Gan, H.C.; Sun, L.J.; Chen, J.Y.; Yuan, W.P. The Advanced Traveler Information System for Metropolitan Expressways in Shanghai, China. Transp. Res. Rec. 2006, 1944, 35–40. [Google Scholar] [CrossRef]
- Schofer, J.L.; Khattak, A.; Koppelman, F.S. Behavioral issues in the design and evaluation of advanced traveler information systems. Transp. Res. C Emerg. Technol. 1993, 1, 107–117. [Google Scholar] [CrossRef]
- Asakura, Y.; Hato, E.; Kashiwadani, M.; Katsuki, S. The simulation study of traffic information strategies using the computer for data collection on drivers’ responses to ATIS. WIT Trans. Built Environ. 1999, 44, 10. [Google Scholar] [CrossRef]
- Chorus, C.; Molin, E.; Van Wee, B.; Arentze, T.; Timmermans, H. Responses to Transit Information among Car-drivers: Regret-based Models and Simulations. Transp. Plan. Technol. 2006, 29, 249–271. [Google Scholar] [CrossRef]
- Levinson, D. The Value of Advanced Traveler Information Systems for Route Choice. Transp. Res. C Emerg. Technol. 2003, 11, 75–87. [Google Scholar] [CrossRef]
- Abdalla, F.; Abdel-Aty, M. Modeling travel time under ATIS using mixed linear models. Transportation 2006, 33, 63–82. [Google Scholar] [CrossRef]
- Toledo, T.; Beinhaker, R. Evaluation of the potential benefits of advanced traveler information systems. J. Intell. Transp. Syst. 2006, 10, 173–183. [Google Scholar] [CrossRef]
- Jou, R.C. Modeling the impact of pre-trip information on commuter departure time and route choice. Trans. Res. B Methodol. 2001, 35, 887–902. [Google Scholar] [CrossRef]
- Pronello, C.; Camusso, C. User requirements for the design of efficient mobile devices to navigate through public transport networks. In ICT for Transport: Opportunities and Threats; Thomopoulos, N., Givoni, M., Rietveld, P., Eds.; Edward Elgar Publishing: Cheltenham Glos, UK, 2015; pp. 55–93. ISBN 978-178-347-128-7. [Google Scholar]
- Caulfield, B.; O’Mahony, M. An Examination of the Public Transport Information Requirements of Users. IEEE Trans. Intell. Transp. Syst. 2007, 8, 21–30. [Google Scholar] [CrossRef]
- Monzon, A.; Hernandez, S.; Cascajo, R. Quality of bus services performance: Benefits of real-time passenger information systems. Transp. Telecommun. 2013, 14, 155–166. [Google Scholar] [CrossRef]
- Taylor, B.D.; Fink, C.N. The Factors Influencing Transit Ridership: A Review and Analysis of the Ridership Literature; UCLA Department of Urban Planning Working Paper; UCLA Institute of Transportation Studies: Los Angeles, CA, USA, 2003. [Google Scholar]
- Tang, L.; Thakuriah, P. Will Psychological Effects of Real-Time Transit Information Systems Lead to Ridership Gain? Transp. Res. Rec. 2011, 2216, 67–74. [Google Scholar] [CrossRef]
- Abdel-Aty, M. Using ordered probit modeling to study the effect of ATIS on transit ridership. Transp. Res. C Emerg. Technol. 2001, 9, 265–277. [Google Scholar] [CrossRef]
- Tang, L.; Thakuriah, P. Ridership effects of real-time bus information system: A case study in the City of Chicago. Transp. Res. C Emerg. Technol. 2012, 22, 146–161. [Google Scholar] [CrossRef]
- Gotzenbrucker, G.; Kohl, M. Sustainable Future Mobility by ICTs. The impacts of Advance Traveler Information Systems on mobility behavior. In Proceedings of the 8th ITS European Congress, Lyon, France, 6–9 June 2011; pp. 1–15. [Google Scholar]
- Chorus, C.; Molin, E.E.; Van Wee, B. Use and Effects of Advanced Traveller Information Services (ATIS): A Review of the Literature. Transp. Rev. 2006, 26, 127–149. [Google Scholar] [CrossRef]
- Williams, B.M.; Hu, H.; Khattak, A.J.; Rouphail, N.M.; Pan, X. Effectiveness of Traveler Information Tools; North Carolina State University: Raleigh, NC, USA, 2008. [Google Scholar]
- Khattak, A.J.; Schofer, J.L.; Koppelman, F.S. Commuters’ en-route diversion and return decisions: Analysis and implications for advanced traveler information systems. Transp. Res. Board A 1993, 27, 101–111. [Google Scholar]
- Adler, J.L.; Blue, V.J. Toward the design of intelligent traveler information systems. Transp. Res. C Emerg. Technol. 1998, 6, 157–172. [Google Scholar] [CrossRef]
- Kenyon, S.; Lyons, G. The value of integrated multimodal traveller information and its potential contribution to modal change. Transp. Res. F Traffic Psychol. Behav. 2003, 6, 1–21. [Google Scholar] [CrossRef]
- Chorus, C.G.; Walker, J.L.; Ben-Akiva, M.E. Traveler decision making under conditions of knowledge limitations and information provision. In Proceedings of the 86th Transportation Research Board, Washington, DC, USA, 21–25 January 2007. [Google Scholar]
- Kollmuss, A.; Agyman, J. Mind the Gap: Why do people act environmentally and what are the barriers to pro-environmental behavior? Environ. Educ. Res. 2002, 8, 239–260. [Google Scholar] [CrossRef]
- Pronello, C.; Veiga-Simão, J.; Rappazzo, V. Can The Multimodal Real Time Information Systems Induce a More Sustainable Mobility? Transp. Res. Rec. 2016, 2566, 64–70. [Google Scholar] [CrossRef]
- Emmerink, R.H.; Nijkamp, P.; Rietveld, P.; Van Ommeren, J.N. Variable message signs and radio traffic information: An integrated empirical analysis of drivers’ route choice behaviour. Transp. Res. A Policy Pract. 1996, 30, 135–153. [Google Scholar] [CrossRef]
- Molin, E.J.; Timmermans, H.J. Traveler expectations and willingness-to-pay for Web-enabled public transport information services. Transp. Res. C Emerg. Technol. 2006, 14, 57–67. [Google Scholar] [CrossRef]
- Dziekan, K.; Kottenhoff, K. Dynamic at-stop real-time information displays for public transport: Effects on customers. Transp. Res. A Policy Pract. 2007, 41, 489–501. [Google Scholar] [CrossRef]
- Ygnace, J.L.; Koo, R.; Yim, Y. User Response to the Telephone Advisory Traveler Information System in the San Francisco Bay Area; Publication UCB-ITS-PWP-2000-8; California Partners for Advanced Transit and Highways (PATH): San Francisco, CA, USA, 2000. [Google Scholar]
- Wolinetz, L.; Khattak, A.J.; Yim, Y. TravInfo Evaluation: Traveler Response Element Willingness to Pay for Traveler Information: Analysis of Wave 2 Broad Area Survey; Publication UCB-ITS-PWP-2001-5; Partners for Advanced Transit and Highways (PATH): San Francisco, CA, USA, 2001. [Google Scholar]
- Clemons, J.; Aultman-Hall, L.; Bowling, S. ARTIMIS Telephone Travel Information Service: Current Use Patterns and User Satisfaction; Publication KTC-99-24; Kentucky Transportation Center: Lexington, KY, USA, 1999. [Google Scholar]
- Zhang, L.; Levinson, D. Determinants of route choice and value of traveler information: A field experiment. Transp. Res. Rec. 2008, 2086, 81–92. [Google Scholar] [CrossRef]
- Eboli, L.; Mazzulla, G. Willingness-to-pay of public transport users for improvement in service quality. Eur. Transp. Trasp. Eur. 2008, 38, 107–118. [Google Scholar]
- Zografos, K.G.; Androutsopoulos, K.N.; Apospori, E. User Acceptance and Willingness to Pay for the Use of Multimodal Trip Planning Systems. Procedia Soc. Behav. Sci. 2012, 48, 2405–2414. [Google Scholar] [CrossRef]
- Mehndiratta, S.; Kemp, M.; Pierce, S.; Lappin, J. Users of a regional telephone-based traveler information system–A study of TravInfo™ users in the San Francisco Bay Area. Transportation 2000, 27, 391–417. [Google Scholar] [CrossRef]
- Peirce, S.; Lappin, J. Evolving awareness, use, and opinions of Seattle region commuters concerning traveler information: Findings from the Puget Sound Transportation Panel Survey, 1997 and 2000. In Proceedings of the 82nd Annual Meeting of the Transportation Research Board, Washington, DC, USA, 12–16 January 2003. [Google Scholar]
- Zito, P.; Salvo, G. Latent class approach to estimate the willingness to pay for transit user information. J. Transp. Technol. 2012, 2, 193–203. [Google Scholar] [CrossRef]
- Noonan, J.; Shearer, O. Intelligent Transportation Systems Field Operational Test Cross-Cutting Study: Advance Traveler Information Systems; Publication FHWA-JPO-99-038; Department of Transportation: Washington, WA, USA, 1998.
- Balakrishna, R.; Ben-Akiva, M.; Bottom, J.; Gao, S. Information impacts on traveler behavior and network performance: State of knowledge and future directions. In Advances in Dynamic Network Modeling in Complex Transportation Systems; Ukkusuri, S.V., Özbay, K.M.A., Eds.; Springer: New York, NY, USA, 2013; pp. 193–224. ISBN 978-146-146-242-2. [Google Scholar]
- Polydoropoulou, A.; Gopinath, D.; Ben-Akiva, M. Willingness to pay for advanced traveler information systems: SmarTraveler case study. Transp. Res. Rec. 1997, 1588, 1–9. [Google Scholar] [CrossRef]
- Neuherz, M.; Patz, V.; Pischner, T.; Keller, H. User acceptance and impacts of new multimodal traffic information services in BAYERNINFO. In Proceedings of the 7th ITS World Congress, Turin, Italy, 6–9 November 2000; pp. 6–9. [Google Scholar]
- Dantan, S.; Bulteau, J.; Nicolaï, I. Hurried or risk-adverse travelers: Who will pay more for multimodal information? Procedia Eng. 2015, 115, 61–68. [Google Scholar] [CrossRef]
- Pronello, C.; Camusso, C. Travellers’ profiles definition using statistical multivariate analysis of attitudinal variables. J. Transp. Geogr. 2011, 19, 1294–1308. [Google Scholar] [CrossRef]
- Agence d’Urbanisme Pour le Développement de l’agglomération Lyonnaise. Les Chiffres clés mis à Disposition par l’INSEE (Recensement de la Population 2008, Pole Empli. DARES, DADS…) Pour les Communes du Grand Lyon et du Sepal. 2011. Available online: http://www.urbalyon.org/AffichePDF/Chiffres_cles_-_De_Albigny-sur-Saone_a_Corbas_-Partie_I-_-3060 (accessed on 18 August 2017).
- Kitzinger, J. Qualitative research. Introducing focus groups. Br. Med. J. 1991, 311, 299. [Google Scholar] [CrossRef]
- Blais, M.; Martineau, S. L’analyse inductive générale: Description d’une démarche visant à donner un sens à des données brutes. Rech. Qual. 2006, 26, 1–18. [Google Scholar]
- Krueger, R.A.; Casey, M.A. Focus Group, a Pratical Guide for Applied Research, 3rd ed.; Sage Publication: London, UK, 2000; ISBN 978-148-336-524-4. [Google Scholar]
- Creswell, J.W.; Clark, V.L.P. Designing and Conducting Mixed Methods Research, 2nd ed.; Sage Publication: London, UK, 2011; ISBN 978-141-297-517-9. [Google Scholar]
- Mackett, R.; Edwards, M. The impact of new urban public transport systems: Will the expectations be met? Transp. Res. A Policy Pract. 1998, 32, 231–245. [Google Scholar] [CrossRef]
- Schweiger, C.L. Real-Time Bus Arrival Information Systems; Synthesis 48; Transportation Research Board: Washington, DC, USA, 2003. [Google Scholar]
- Khattak, A.J.; Yim, Y.; Prokopy, L.S. Willingness to pay for travel information. Transp. Res. C Emerg. Technol. 2003, 11, 137–159. [Google Scholar] [CrossRef]


| N° | Variables | Levels of the Variables | |
|---|---|---|---|
| 1 | Gender | F | Female |
| M | Male | ||
| 2 | Children in the household | K | Kids < 14 years old. |
| NK | No kids < 14 years old | ||
| 3 | Age | L | Young 18–30 |
| M | Medium 31–50 | ||
| H | High 51–70 | ||
| 4 | Most frequent mode of transport | C | Car |
| PT | Public Transport | ||
| B | Bike | ||
| F | Foot | ||
| 5 | Origin (Household location) | C | City |
| SU | Sub-urban | ||
| 6 | Most frequent destination | C | City |
| SU | Sub-urban | ||
| 7 | Income | L | Low |
| M | Medium | ||
| H | High | ||
| 8 | Occupation | A | Active |
| I-H | Inactive (housework) | ||
| I-U | Inactive (Unemployed) | ||
| I-R | Inactive (retired) | ||
| 9 | Education | L | Low |
| M | Medium | ||
| H | High | ||
| Grand Lyon Metropolitan Area | Optymod’Lyon Sample | ||
|---|---|---|---|
| Gender of the Total Population 1 | |||
| Male | 47% | 50% | |
| Female | 53% | 50% | |
| Education for Citizens Older than 15 Years 1 | |||
| N: <High school diploma | 51.4% | 28.6% | |
| H: High school diploma | 15.7% | 11.9% | |
| U: >high school diploma | 33.1% | 59.5% | |
| Household Size 1 | |||
| 1 | 39.3% | 23.8% | |
| ≥2 | 60.7% | 76.2% | |
| Children in the Household 1 | |||
| 0 | 45.2% | 57.1% | |
| 1 | 22.9% | 11.9% | |
| 2 | 20.3% | 23.8% | |
| ≥3 | 11% | 7.1% | |
| Cars in the household 2 | |||
| 0 | 26.4% | 9.5% | |
| 1 | 49.9% | 42.9% | |
| ≥2 | 23.7% | 47.7% | |
| Public Transport Subscription 3 | |||
| No | 62.4% | 71.4% | |
| Yes | 27.6% | 28.6% | |
| Mode Used 2 | Autumn/Winter | Spring/Summer | |
| Car | 41.9% | 52.4% | 35.7% |
| 2 wheels motorised | 0.6% | - | 4.8% |
| PT | 19.4% | 28.6% | 14.3% |
| Bike | 1.7% | - | 14.3% |
| Walking | 35.3% | 7.1% | 9.5% |
| Others | 1.1% | - | - |
| PT + soft modes | - | 7.1% | 11.9% |
| PT + auto | - | - | 14.3% |
| Name | Age | Education 4 | Income Level 5 | Household Size | Children in the Household | Cars in the Household | Public Transport Subscription 3 | Bike Sharing Subscription | The Most Frequent Trip | ||||||||||||||
|---|---|---|---|---|---|---|---|---|---|---|---|---|---|---|---|---|---|---|---|---|---|---|---|
| Duration | Purpose 6 | Mode Aut/Wint 7 | Mode Spring/Summer 8 | Route Changes | Weekly Frequency | ||||||||||||||||||
| WOMEN | |||||||||||||||||||||||
| Yvette | 65 | N | 1 | 1 | 0 | 1 | N | N | 40 | 3 | 2 | 7 | 7 | N | 3 | 1 | |||||||
| Annick | 65 | N | 2 | 1 | 0 | 1 | Y | N | 40 | 3 | 5 | 2 | 2 | Y | 3 | 2 | |||||||
| Martine | 62 | U | 3 | 2 | 0 | 0 | Y | Y | 30 | 1 | 2 | 2 | Y | 5 | 4 | ||||||||
| Michelle | 56 | U | 2 | 1 | 0 | 1 | N | N | Y | 10 | 1 | 1 | 4 | 4 | 7 | Y | 5 | 4 | |||||
| Chantal | 55 | N | 2 | 1 | 0 | 1 | N | N | 45 | 1 | 1 | 3 | 1 | Y | 5 | ||||||||
| Agnès | 53 | U | 2 | 1 | 0 | 1 | N | N | 20 | 1 | 1 | 1 | N | 5 | |||||||||
| Evelyne | 51 | H | 3 | 2 | 2 | 1 | 0 | 2 | 1 | N | N | 30 | 1 | 1 | 6 | 7 | 6 | N | 3 | ||||
| Odile | 50 | U | 3 | ≥4 | 2 | 1 | Y | N | 30 | 1 | 2 | 3 | 2 | Y | 5 | ||||||||
| Géraldine | 44 | U | 2 | ≥4 | 2 | 2 | N | N | 5 | 1 | 3 | 1 | 1 | 4 | Y | 5 | 2 | ||||||
| Nouzha | 43 | U | 2 | 3 | 2 | 1 | Y | N | N | 52 | 1 | 5 | 1 | 2 | 7 | 1 | Y | 5 | |||||
| Karyne | 42 | N | 2 | ≥4 | ≥3 | 1 2 | N | N | 30 | 3 | 2 | 2 | 1 | 7 | 2 | N | 2 | 1 | |||||
| Laurence | 41 | N | 0 | ≥4 | ≥3 | 1 | N | Y | N | 5 | 1 | 3 | 3 | Y | 5 | ||||||||
| Carine | 37 | U | 2 | 0 | 1 | 0 | 0 | Y | N | 90 | 1 | 5 | 5 | N | 5 | ||||||||
| Marjorie | 36 | U | 2 | 3 | 2 | 0 | 1 | N | N | 10 | 1 | 3 | 7 | 3 | Y | 5 | |||||||
| Anne-Sophie | 34 | N | 0 | 2 | ≥4 | 2 | 1 | N | N | 42 | 5 | 5 | 2 | 4 | Y | 4 | 5 | ||||||
| Malika | 30 | U | 2 | 3 | 1 | 2 | N | N | 20 | 1 | 1 | 1 | 7 | N | 5 | ||||||||
| Sabrina H. | 30 | H | 2 | ≥4 | 2 | 2 | N | N | 30 | 1 | 1 | 1 | N | 5 | |||||||||
| Sabrina P. | 30 | U | 3 | ≥4 | 2 | 1 | Y | Y | 30 | 1 | 2 | 5 | Y | 5 | |||||||||
| Olivia | 27 | U | 3 | 2 | 0 | 2 | N | N | 30 | 1 | 1 | 1 | N | 5 | |||||||||
| Camille | 25 | U | 2 | 2 | 0 | 2 | Y | N | 10 | 2 | 1 | 2 | 4 | 2 | N | 5 | 2 | ||||||
| Charlotte | 23 | U | 1 | 1 | 0 | 02 | N | Y | N | 20 | 4 | 1 | 5 | 2 | 5 | 2 | Y | 5 | 4 | ||||
| MEN | |||||||||||||||||||||||
| Gilles | 68 | N | 3 | 2 | 2 | 0 | 2 | N | N | 30 | 3 | 2 | 2 | 1 | 2 | 1 | Y | 2 | 1 | ||||
| José | 65 | H | 2 | 1 | 1 | 0 | 1 | N | N | 40 | 2 | 5 | 1 | 7 | 1 | N | 3 | 2 | |||||
| Alain 1 | 60 | U | 3 | 2 | 2 | 0 | 12 | Y | N | 40 | 3 | 2 | 2 | N | 1 | ||||||||
| Pascal S. | 55 | H | 3 | 2 | 0 | ≥3 | N | N | 30 | 1 | 1 | 1 | Y | 2 | |||||||||
| Pascal V. | 53 | U | 2 | 3 | 3 | 1 | 2 | N | N | 10 | 2 | 1 | 6 | N | 5 | ||||||||
| Jean-Claude | 53 | U | 4 | 2 | 0 | 2 | N | N | 40 | 1 | 1 | 1 | N | 5 | |||||||||
| Mark | 52 | N | 2 | 3 | 1 | 1 | N | N | 12 | 1 | 1 | 4 | N | 5 | |||||||||
| Pascal R. | 49 | U | 3 | 4 | 4 | 2 | 2 | Y | N | N | 45 | 1 | 2 | 1 | 4 | N | 5 | ||||||
| Philippe | 48 | U | 3 | ≥4 | 2 | 2 | N | N | 45 | 1 | 1 | 1 | Y | 5 | |||||||||
| Didier | 48 | N | 2 | 3 | 1 | 2 | 1 | N | N | 22 | 1 | 1 | 1 | N | 5 | ||||||||
| Mohamed | 44 | U | 2 | ≥4 | ≥3 | 1 | N | N | 45 | 3 | 2 | 2 | 3 | Y | 2 | 3 | |||||||
| Pierre-Luc | 42 | U | 3 | ≥4 | 2 | 2 | 1 | N | N | 60 | 1 | 1 | 1 | Y | 5 | ||||||||
| François | 41 | U | 3 | 2 | 0 | 1 | N | N | 30 | 1 | 1 | 2 | 2 | N | 2 | 4 | |||||||
| Rezki 1 | 39 | U | 2 | 3 | 1 | 2 | Y | N | 40 | 1 | 1 | 2 | 1 | 2 | N | 5 | |||||||
| Fabrice | 38 | N | 2 | 0 | ≥4 | 2 | 2 | N | N | 10 | 1 | 1 | 1 | Y | 5 | ||||||||
| Frédéric | 38 | U | 3 | 4 | 2 | 0 | ≥3 | N | N | 25 | 1 | 1 | 1 | Y | 5 | ||||||||
| Brice | 35 | U | 3 | 2 | 0 | 2 | N | N | 20 | 1 | 1 | 1 | 3 | Y | 4 | 3 | |||||||
| Cédric | 34 | N | 3 | 4 | 2 | 0 | 2 | N | N | 30 | 1 | 1 | 1 | N | 5 | ||||||||
| Sébabstien | 32 | N | 2 | 2 | 1 | 0 | 2 | N | N | 15 | 1 | 1 | 6 | 6 | Y | 5 | |||||||
| Jérémie | 30 | U | 2 | 1 | 0 | 0 2 | Y | N | 25 | 1 | 5 | 2 | 3 | Y | 5 | ||||||||
| Julien | 30 | H | 2 | 1 | 0 | 1 | Y | Y | 22 | 1 | 2 | 4 | N | 4 | |||||||||
| Idealists | Pragmatics | Ambiguous | Opportunists | ||
| n = 12, 28.6% | n = 11, 26.2% | n = 10, 23.8% | n = 9, 21.4% | ||
| Gender | Male | 66.7% | 27.3% | 50.0% | 55.6% |
| Female | 33.3% | 72.7% | 50.0% | 44.4% | |
| Age | Average | 47.2 | 41.3 | 45.6 | 41.9 |
| Education | NH | 25.0% | 36.4% | 30.0% | 22.2% |
| H | 8.3% | 9.1% | 20.0% | 11.1% | |
| U | 66.7% | 54.5% | 50.0% | 66.7% | |
| Income Level €/Month | <1500 | 7.7% | 11.1% | - | - |
| 1500–3000 | 38.5% | 55.6% | 60.0% | 66.7% | |
| 3000–5000 | 46.2% | 33.3% | 40.0% | 22.2% | |
| >5000 | - | - | - | 11.1% | |
| NtR * | 7.7% | - | - | - | |
| Household Size | 1 | 25.0% | 27.3% | 30.0% | 11.1% |
| 2 | 33.3% | 27.3% | 40.0% | 44.4% | |
| 3 | 16.7% | - | 10.0% | 33.3% | |
| ≥4 | 25.0% | 45.5% | 20.0% | 11.1% | |
| Children in the Household | 0 | 58.3% | 4.,5% | 70.0% | 55.6% |
| 1 | 16.7% | - | 10.0% | 22.2% | |
| 2 | 16.7% | 45.5% | 20.0% | 11.1% | |
| ≥3 | 8.3% | 9.1% | - | 11.1% | |
| Cars in the Household | 0 | 8.3% | 18.2% | 10.0% | - |
| 1 | 50.0% | 36.4% | 40.0% | 44.4% | |
| 2 | 33.3% | 45.5% | 40.0% | 55.6% | |
| ≥3 | 8.3% | - | 10.0% | - | |
| Public Transport Subscription | No | 58.3% | 81.8% | 60.0% | 88.9% |
| Yes | 41.7% | 18.2% | 40.0% | 11.1% | |
| Bike Sharing Subscription | No | 91.7% | 100.0% | 80.0% | 100.0% |
| Yes | 8.3% | - | 20.0% | - | |
| Trip Duration | Average | 32.3 | 31.6 | 23.9 | 31.4 |
| Trip Purpose | Work | 63.6% | 63.6% | 90.0% | 77.8% |
| Take/drop someone | 9.1% | 9.1% | 10.0% | 11.1% | |
| Leisure | 27.3% | 9.1% | - | 11,1% | |
| Study | - | 9.1% | - | - | |
| Shopping | - | 9.1% | - | - | |
| Mode Used in Autumn/Winter | Car | 50.0% | 36.4% | 60.0% | 66.7% |
| PT | 41.7% | 18.2% | 40.0% | 11.1% | |
| Pedestrian | 0.0% | 18.2% | - | 11.1% | |
| PT + soft modes | 8.3% | 27.3% | - | 11.1% | |
| Mode Used in Spring/Summer | Car | 33.3% | 36.4% | 20.0% | 55.6% |
| PT | 33.3% | 9.1% | 10.0% | - | |
| Pedestrian | 8.3% | 18.2% | 10.0% | - | |
| Bike | - | 9.1% | 50.0% | - | |
| PT + soft modes | 8.3% | 18.2% | - | - | |
| Moto | 8.3% | 9.1% | - | - | |
| PT + car | 8.3% | - | 10.0% | 44.4% | |
| Idealists | Pragmatics | Ambiguous | Opportunists | ||
| n = 12, 28.6% | n = 11, 26.2% | n = 10, 23.8% | n = 9, 21.4% | ||
| Route Changes 1 | No | 50.0% | 27.3% | 50.0% | 66.7% |
| Yes | 50.0% | 72.7% | 50.0% | 33.3% | |
| Weekly Frequency | Once | 8.3% | - | - | - |
| Twice | 25.0% | 9.1% | - | 11.1% | |
| 3 times | 16.7% | - | 10.0% | 11.1% | |
| 4 times | - | 9.1% | 10.0% | 11.1% | |
| 5 times | 50.0% | 81.8% | 80.0% | 66.7% |
| Average (€) | Median (€) | |
|---|---|---|
| Idealists | 0.8 | 0 |
| Pragmatics | 2.5 | 1.7 |
| Ambiguous | 3.9 | 1.6 |
| Opportunists | 3.3 | 3 |
| Survey | Sample | Attitude Towards Payment and WTP | References | Comparison with OPTYMOD’LYON: Real-Time Multimodal Navigator. Test on 150 Travellers |
| Existing ATIS | ||||
| WISETRIP: International Multimodal Journey Planner | ||||
| Laboratory simulation of user acceptance and WTP | 425 people |
| [37] | Optymod’Lyon proposed dynamic information. However, some people willing to pay (opportunists, 22.2%) expressed their resolve to pay more if it integrated specific information such as radar localisation, highlighting a desire to improve the quality of the device. |
| TravInfo: A Real-Time Traveller Advisory Telephone System Providing Traffic and Transit Information | ||||
| Questionnaire to investigate the use and the WTP per call | 511 persons using the service |
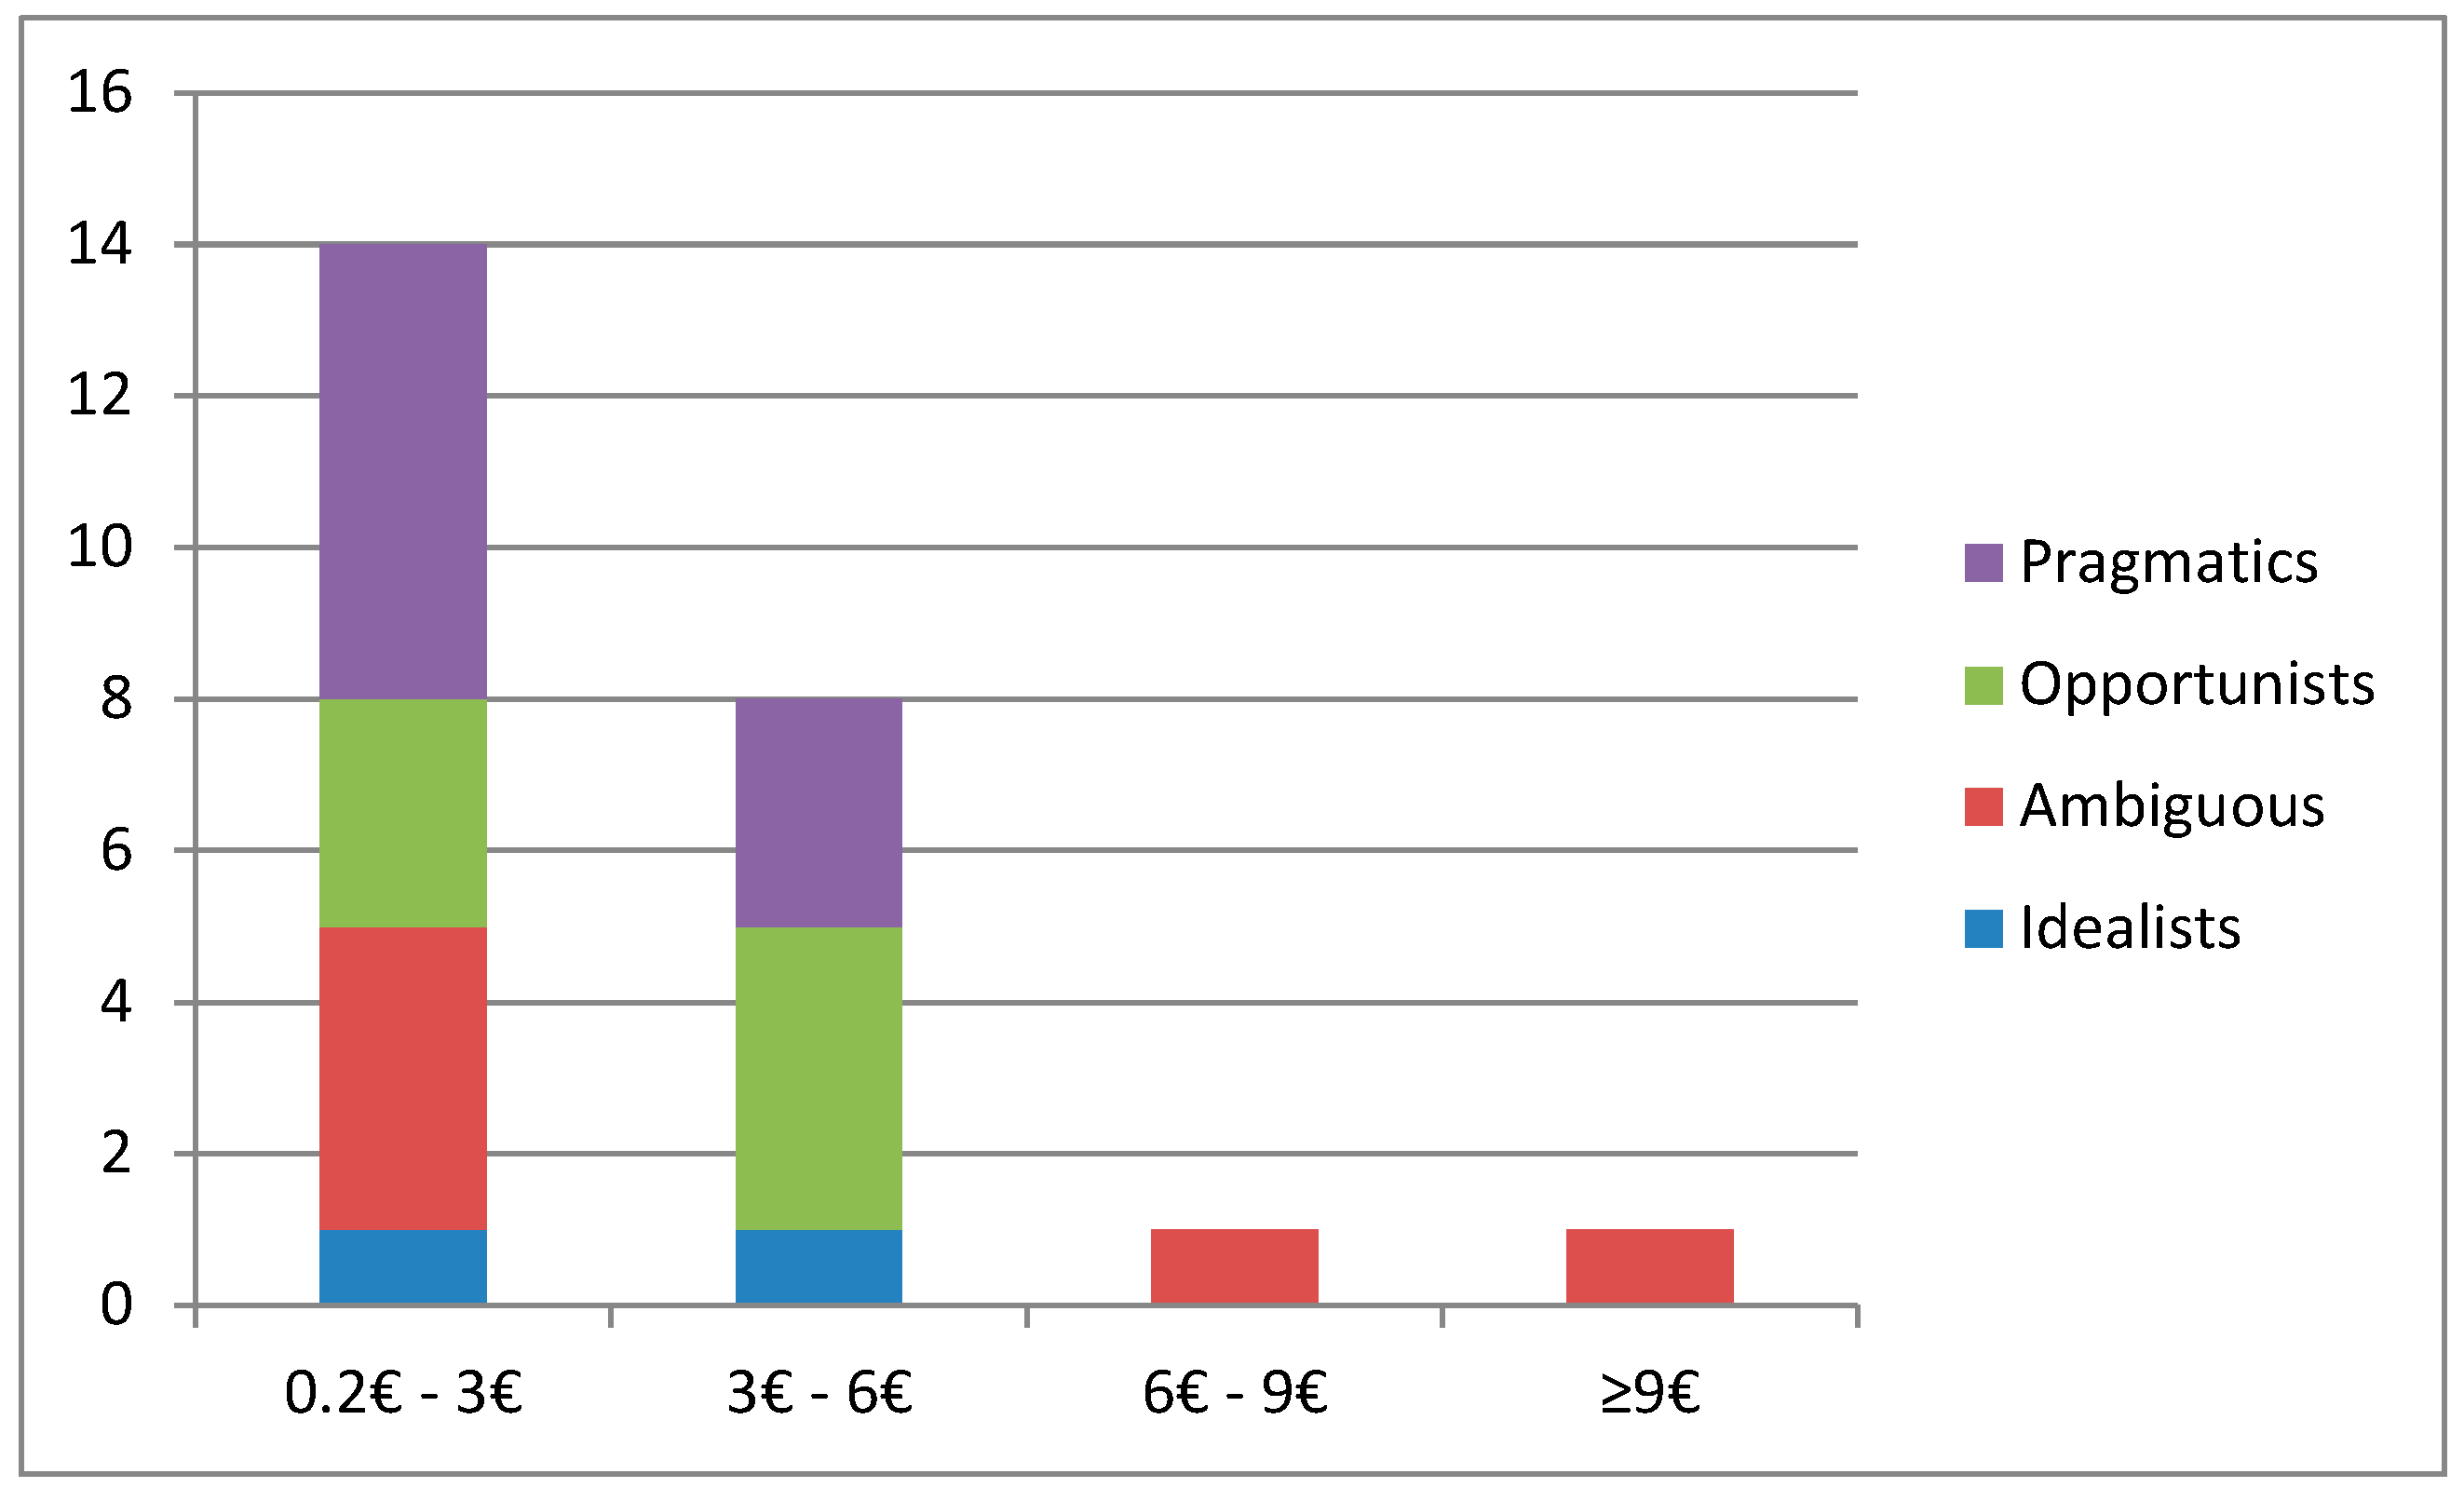
| [32,54] | Some participants willing to pay were ready to accept a higher monthly charge (55.6% of the opportunists) of between €3 and €6. In case of Optymod’Lyon car drivers are more willing to pay (66.7% in autumn/winter; 100% in spring/summer, including PT + car), are highly educated (>66.7% high school graduates) and mainly travelling for work (77.8%). |
| 69 persons using the service |
| [38] | Percentage of people willing to pay was lower (21.4% of the total population) than in the study under comparison. Some people willing to pay expressed their resolve to pay more if Optymod’Lyon integrated specific information such as radar localisation (opportunists, 22.2%). | |
| Survey | Sample | Attitude Towards Payment and WTP | References | Comparison with OPTYMOD’LYON: Real-Time Multimodal Navigator. Test on 150 Travellers |
| Existing ATIS (Continued) | ||||
| TravInfo: A Real-Time Traveller Advisory Telephone System Providing Traffic and Transit Information (continued) | ||||
| Questionnaire to investigate the use and the WTP per call (continued) | Persons from SF area: 658 persons (accepted form of payment) 481 persons using ATIS in general (WTP) |
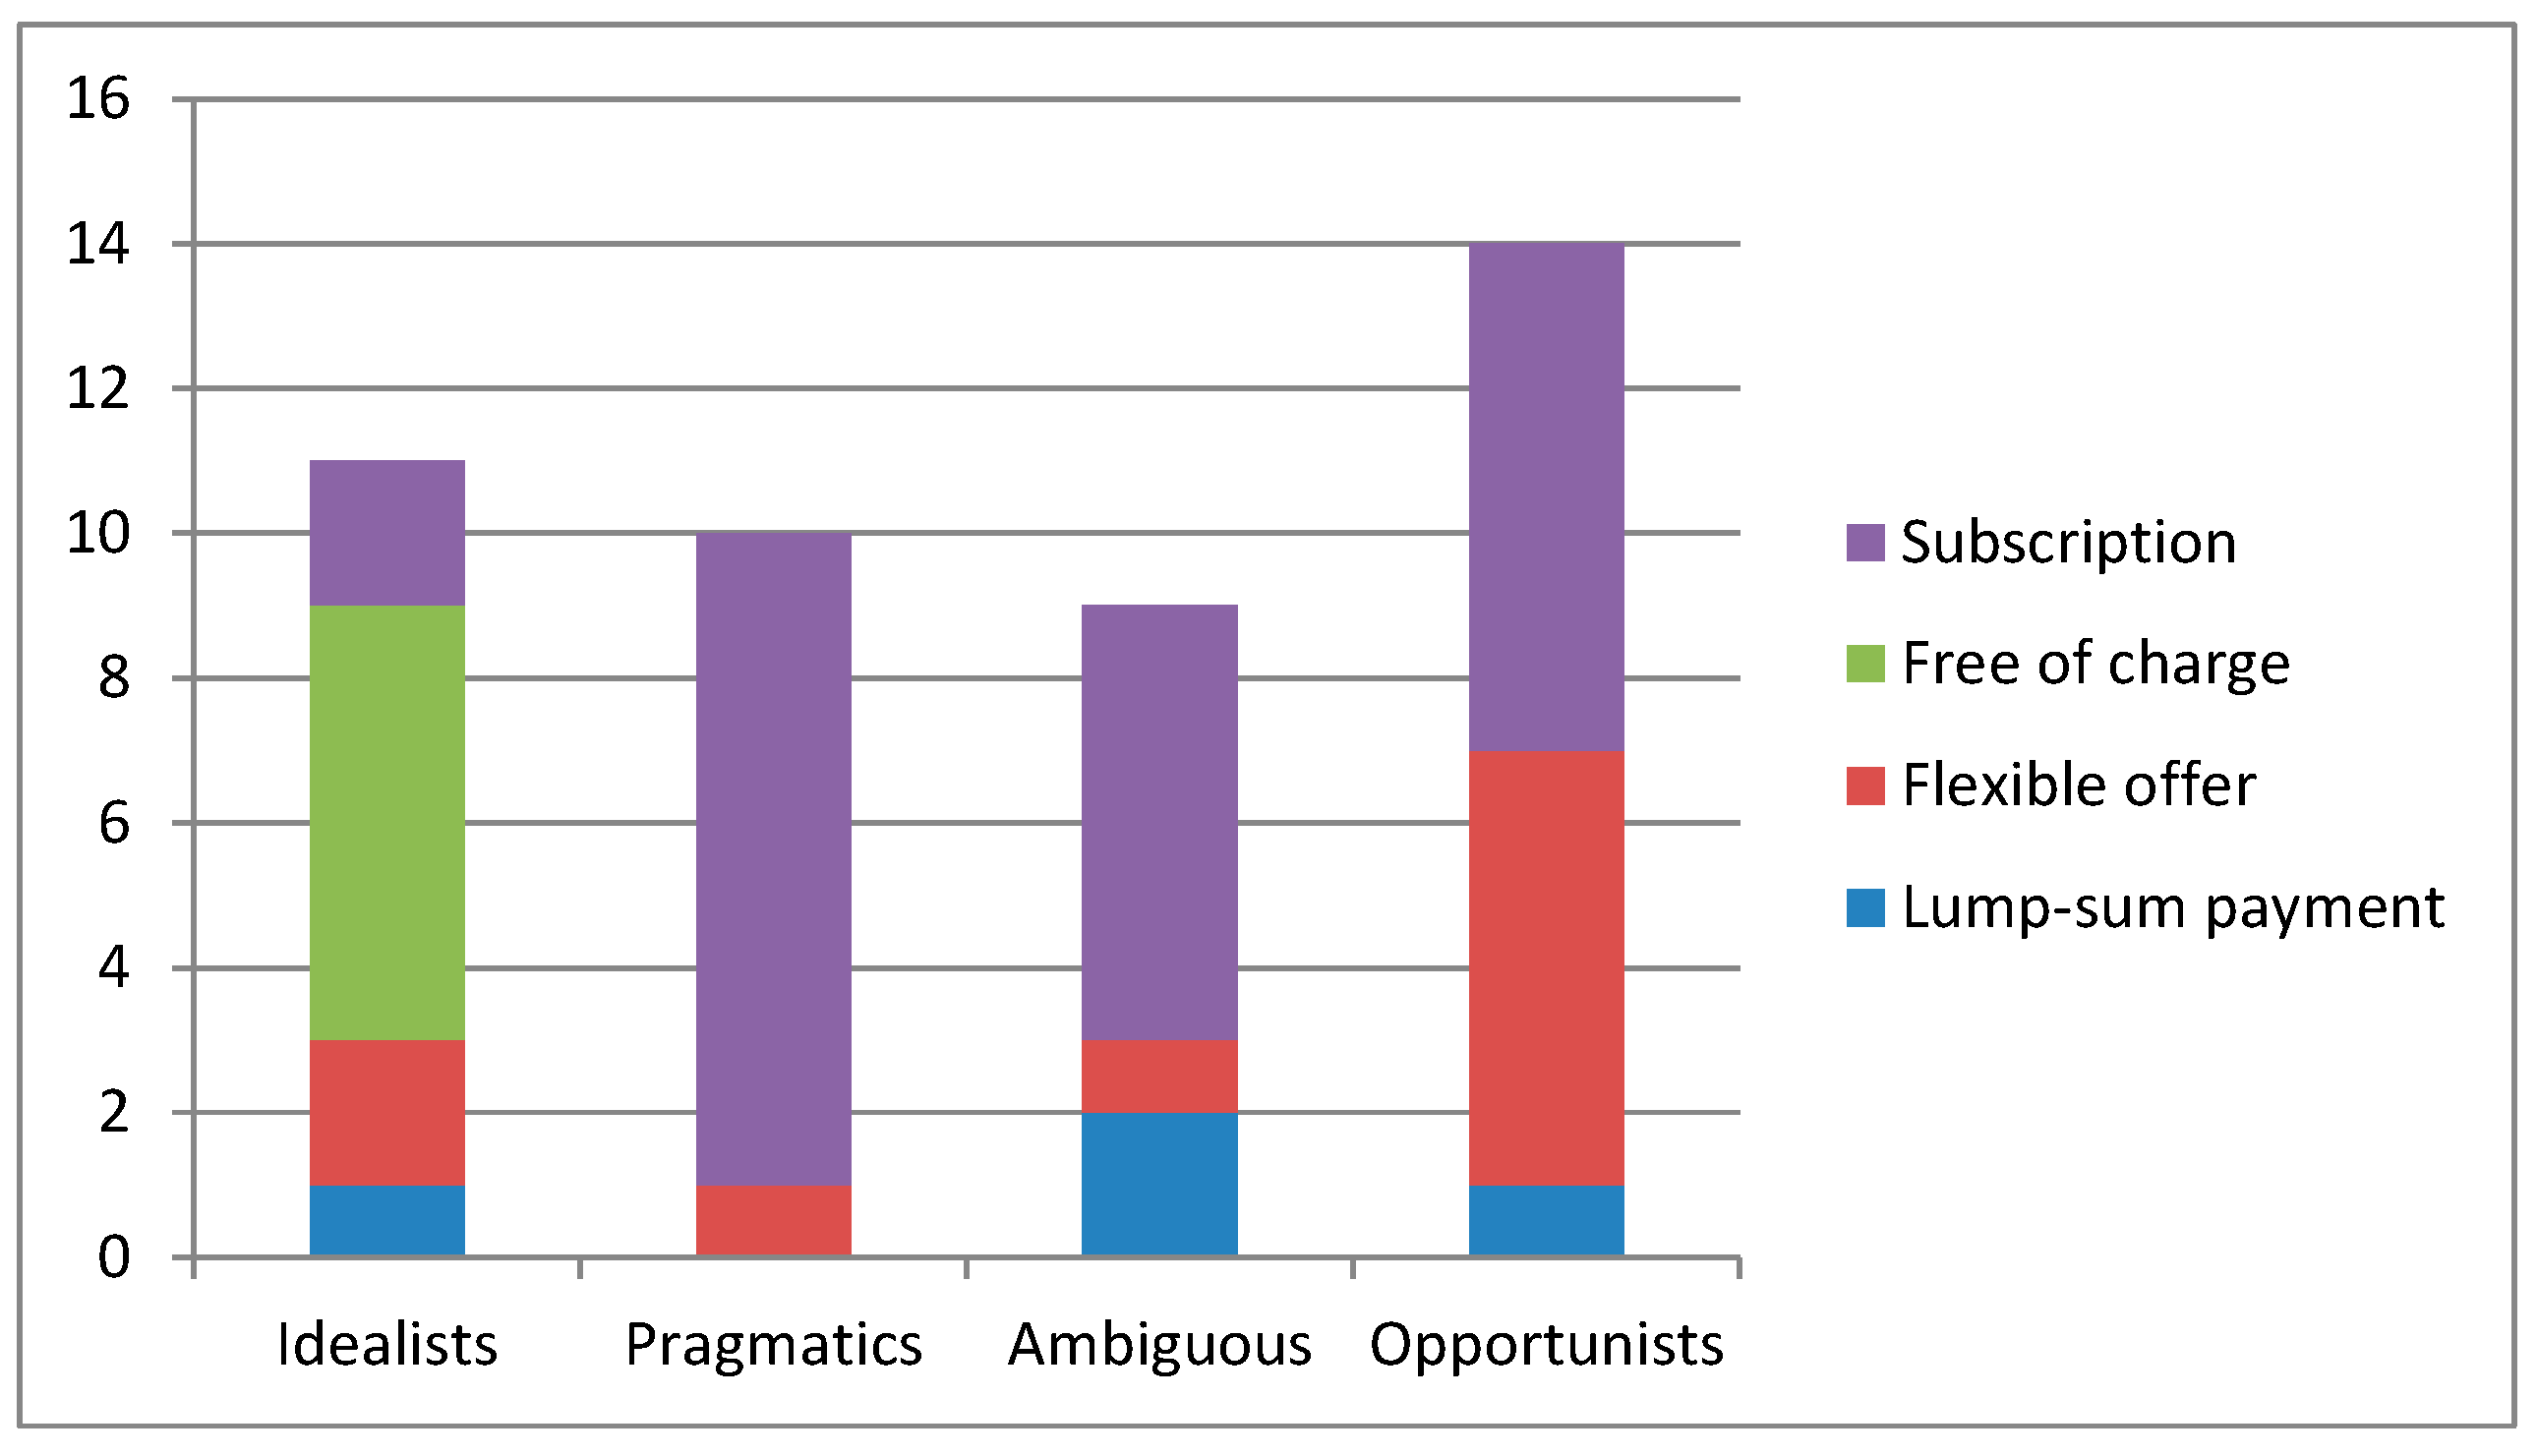
| [33] | Monthly charge was the most popular subscription among groups (72.7% of the pragmatics; 66.7% of the ambiguous; 77.8% of the opportunists), a part of the idealists (50%) who strongly expressed their preference for a free of charge app. |
| BayernInfo: A Supra-Regional Multimodal Traffic Information System Provided through a Portable Mobility Planner for Public Transport and Car Users | ||||
| Questionnaire mainly investigating the use | 866 persons using the service |
| [44] | Percentage of people willing to pay for Optymod’Lyon was also low (21.4% of the total population). |
| ARTIMIS: A Telephone Information System Providing Traffic Information | ||||
| Questionnaire to investigate the WTP per call | 779 persons using the service |
| [34] | In accordance with those results, panellists willing to pay after the experiment would pay (n = 3) for reliable information. |
| SMARTWAY: A Public Transport Real-Time Information Navigator for Smartphone | ||||
| Questionnaire and focus groups to understand user needs | 21 Italian and 21 German participants in focus groups and 19 in the questionnaire |
| [13] | Only 9.5% of participants expressed a positive opinion about a fixed fee and only 11% among the opportunists (n = 1). A monthly charge was the most popular subscription among groups (72.7% of the pragmatics; 66.7% of the ambiguous; 77.8% of the opportunists), and for a part of the idealists (50%) who strongly expressed their preference for an app free of charge. |
| Survey | Sample | Attitude Towards Payment and WTP | References | Comparison with OPTYMOD’LYON: Real-Time Multimodal Navigator. Test on 150 Travellers |
| EXISTING ATIS (Continued) | ||||
| SmarTraveler: A Real-Time Location-Specific Providing Traffic Information and Transit Information Per Telephone | ||||
| Two questionnaires investigating use and WTP of users and non-users of the service | 220 including actual and potential users of the service |
| [43] | In accordance with the results in the present study, panellists willing to pay after the experiment would do so for reliable information (n = 3). Before the experiment, they also indicated they expected benefits from the use of the service (opportunists, 66.7%). Moreover, after the experiment, a new opinion expressed by 2 participants indicated that they doubt of the possibility to implement a reliable service. |
| Potential Services to Be Provided by ATIS | ||||
| Review | ||||
| Multi-dimensional study on the state of the art |
| [42] | Before the experiment, panellists willing to pay, also indicated they expected benefits from the use of the service (opportunists, 66.7%). | |
| Real-Time Transit Information | ||||
| Stated preference survey on WTP | 110 public transport users |
| [40] | In accordance with those results, panellists willing to pay after the experiment would do so for reliable information (n = 3). |
| Survey | Sample | Attitude towards payment and WTP | References | Comparison with OPTYMOD’LYON: Real-Time Multimodal Navigator. Test on 150 Travellers |
| Potential Services to Be Provided by ATIS (Continued) | ||||
| Multimodal Information Platform | ||||
| Stated preference survey on WTP | 398 commuters |
| [45] | Gender characteristics are not significant to distinguish the groups; however, the idealists and the pragmatics are opposed in terms of age and gender: the first are females (72.7%) and have the lowest average age (41.3) while the second ones are the oldest group (average age 47.2), mainly males (66.2%). |
| Pre-Trip Travel Time Information for Drivers | ||||
| Field experiment and stated preference survey on WTP | 113 persons |
| [35] | Percentage of people willing to pay for Optymod’Lyon was also low (21.4% of the total population). 19% of participants (some of the idealists) thought the app should be provided for free. |
| Information at Bus Stops | ||||
| Stated preference survey on WTP | 470 students using public transport |
| [36] | Ex-post focus groups revealed that some participants would have preferred an improvement of public transport and other policies to the deployment of Optymod’Lyon. |
| Survey | Sample | Attitude towards payment and WTP | References | Comparison with OPTYMOD’LYON: real-time multimodal navigator. Test on 150 travellers |
| Potential Services to Be Provided by ATIS (Continued) | ||||
| Web-Enabled Public Transport Information Services | ||||
| Stated choice experiment on WTP | 184 public transport users |
| [30] | Only, 21.4% of the panellists of Optymod’Lyon were willing to pay. |
| Review | ||||
| Cross-Cutting study on the state of the art |
| [41] | Before the experiment, willing- to- pay panellists, indicated they expected benefits from the use of the service (opportunists, 66.7%). | |
| Stated preference survey to examine the roles of psychological factors | 99 Chicago-area commuters |
| [19] | Only one participant in the ex-ante focus groups proposed to pay per ride. A monthly charge was the most popular subscription method among groups (72.7% of the pragmatics; 66.7% of the ambiguous; 77.8% of the opportunists) and for some of the idealists (50%) who strongly expressed their preference for an app free of charge. |
| Other Services | ||||
| Radio Traffic Information and Variable Message Signs Information | ||||
| Questionnaire on the impact on route choice behaviour and WTP | 826 participants |
| [29] | Results of Optymod’Lyon pointed out that car drivers are more willing to pay (66.7% in autumn/winter; 100% in spring/summer, including PT + car), while gender is not a significant issue. Results also indicated that participants in our study are highly educated (>66.7% high school graduates) and mainly travelling to work (77.8%). |
© 2017 by the authors. Licensee MDPI, Basel, Switzerland. This article is an open access article distributed under the terms and conditions of the Creative Commons Attribution (CC BY) license (http://creativecommons.org/licenses/by/4.0/).
Share and Cite
Pronello, C.; Duboz, A.; Rappazzo, V. Towards Smarter Urban Mobility: Willingness to Pay for an Advanced Traveller Information System in Lyon. Sustainability 2017, 9, 1690. https://doi.org/10.3390/su9101690
Pronello C, Duboz A, Rappazzo V. Towards Smarter Urban Mobility: Willingness to Pay for an Advanced Traveller Information System in Lyon. Sustainability. 2017; 9(10):1690. https://doi.org/10.3390/su9101690
Chicago/Turabian StylePronello, Cristina, Amandine Duboz, and Valentina Rappazzo. 2017. "Towards Smarter Urban Mobility: Willingness to Pay for an Advanced Traveller Information System in Lyon" Sustainability 9, no. 10: 1690. https://doi.org/10.3390/su9101690