Abstract
Many production line imbalances have been observed in the pursuit of higher profits. A sustainable production line, also called balanced, leads to lower costs, good production environments, and green manufacturing. A decision analysis method, such as production line evaluation, is often employed to help decision makers make sustainable decisions. In this study, a sustainable decision-making model is proposed for the evaluation of engine manufacturing. To solve uncertainties in manufacturing industries while maintaining lower costs and an efficient production environment, evidential reasoning is used in order to evaluate the sustainable production line effectively. First, uncertainties in the engine production line and deficiencies in the existing methods for evaluating the sustainable production line are analyzed. Then, evidential reasoning evaluation of the sustainable engine production line model is proposed and an example is presented; to be specific, the analysis of three production line plans is conducted using evidential reasoning, and plan P3 is found to be the best. Finally, a FlexSim simulation is used to prove the feasibility of evidential reasoning evaluation, verifying its suitability for achieving sustainable production line evaluation.
1. Introduction
With the development of the world economy, requirements for production line sustainability are increasing. Many production line imbalances have been observed in the pursuit of higher profits. The balance of production lines affects production efficiency and cost. Thus, industries seek to optimize production lines. Furthermore, a sustainable production line must also be balanced as it leads to lower costs, good production environments and green manufacturing. Thus, to develop a sustainable production line, its balance problem must be addressed efficiently. A mixed production line processes different types of products, and therefore maintaining production line balance presents greater difficulty. To achieve a balanced production line, there is higher requirement for sustainable production options and evaluation. Hence, sustainable production line evaluation is an important topic for study.
Sustainable production line evaluation involves decision analysis and plan management for helping decision makers make informed evaluations and select alternatives with the aim of contributing to the attainment of incommensurate and often conflicting objectives, and in the presence of limited resources and other constraints. A sustainable production line is considered balanced and leads to lower costs, good production environments, and green manufacturing. However, production line evaluation, simplified as a sustainable production line evaluation problem in this study, is more challenging because of the following reasons: (1) The traditional single production line has become the current hybrid production line. This requires the coordination of various products in the production line; (2) Previous production line evaluation methods, such as the analytical hierarchy process [1] and data envelopment analysis [2], require more detailed evaluation data; (3) The cost of production line evaluation simulation is high, and it needs professional simulation software. This is also the research motivation of this article.
The main contribution of this study is modeling and solving the sustainable production line evaluation problem using the evidential reasoning (ER) method. An ER production line evaluation model for the engine manufacturing industry is proposed in this study. Polymerization is the indicator of production line sustainability using the ER aggregation rules. This method uses the Dempster–Shafer(D-S) theory to address engine production line uncertainty. Moreover, the different types of uncertainty data are turned into a unified structure rule base by this method. Thus, the ER method is used to achieve logical reasoning and plan the evaluation. Finally, an engine production line balance plan for sustainable selection is used to illustrate the advantages of the method, and its feasibility is verified using a FlexSim simulation.
The remainder of the paper is structured as follows: Section 2 presents the literature review as well as previous theories and approaches and their relationship with the proposed methodology. Section 3 describes the sustainable production line problem in the engine manufacturing industry. Section 4 and Section 5 build the model and provide a detailed description of the application of sustainable production line evaluation based on the ER theory. Finally, Section 6 presents the FlexSim simulation used to verify ER in the sustainable production line. Section 7 concludes the study with a summarizing discussion.
2. Literature Review
Recently, the concept of sustainability has been encouraged widely in the economy [3,4,5]. Galal and Moneim [6] addressed the sustainable product mix with a mathematical programming approach. In the research [6], a sustainability index for a manufacturing facility was proposed. A smart factory for ensuring sustainability is a popular topic, and a smartness assessment framework with the analytic network process was used to assess smart, sustainable factories [7]. Sustainable performance assessment is important for sustainability, and a fuzzy analytical hierarchy process was used to determine sustainable supply chain management [1]. Further, the sustainable development of Japanese automobile suppliers was studied using an integrated approach [8]. Sustainable assessment with multiple attribute decision-making methods was applied for analyzing aerosol pollution [9], and significant criteria for brownfield land redevelopment strategies in urban areas were established [10]. Guo et al. [11] used a fuzzy multi-criteria decision-making approach to evaluate and select a “green” supplier. In the study, a fuzzy multi-criteria decision-making model was established in manufacturing. Wei et al. studied listed Chinese sustainability companies, and the analytical hierarchy process was used to analyze indicators [12].
Many factors influence the sustainability of a production line, and a combination of qualitative and quantitative methods are needed to discover them. To resolve these issues, namely, the identification of the type of underlying impact factors, uncertainty of the influencing factors, and incompleteness of the evaluation information, the researchers used the evaluation method with analytical hierarchy process [13,14] and simulations [15] in the industries. The production line was streamlined by using many methods. The production line service was proposed by T. Levitt [16] in 1972. From that time, the production line was considered an important research area. Kłosowski et al. [17] proposed a fuzzy logic controller for machine load and developed two models of manufacturing systems to balance production tasks by machine tools. A model for assessing comparative production efficiencies for product line management was proposed by using an appropriate data envelopment analysis score [2]. Mastor [18] proposed production line balancing techniques to investigate and evaluate production line balancing problems. Infrared imaging was used to address the problem of production line quality control by increasing productivity and cost-effectiveness [19]. Chen et al. analyzed production lines by developing mathematical models [20], and a platform-driven production line was planned by using bi-level models with an optimization method.
Engine manufacturing research has great significance. Shin et al. [21] used a unified system-framework in the engine manufacturing industry to improve instrumentation systems. A study about grating ruling engine in manufacturing showed improvement in a practical application [22]. A mathematical model was proposed to evaluate manufacturing productivity and energy efficiency [23], which involved stochastic efficiency frontier analysis in manufacturing.
Simulations achieved a great deal in manufacturing, as they are widely used in production line research. A simulation to analyze the differences in the “chasing-overtaking” production line was proposed [24]. In this simulation [24], this production line showed good production capacity and adaptability to worker differences. A simulation framework was used in engine-control unit inspection in the manufacturing phase [25]. Alrabghi et al. used a simulation to study the industrial case with maintenance systems [26], and the research achieved optimization of maintenance in industrial systems. A numerical simulation was applied in engine bearings by integrating vibration and wear analysis techniques [27], and a fixed cycle production line model was established with linear constraints for the evaluation of production facilities. Boysen [28] used FlexSim simulation to illustrate the reasons for the balance of the production line. Borisovsky et al. [29] examined the overall situation and found constraints on the line; they eliminated the bottleneck process to put forward the ideal solution in a further simulation using FlexSim. In addition, Peng [30] conducted a simulation for the optimization of a hybrid production line by using FlexSim. The author analyzed the layout of the production line, designed its details, and then used simulation optimization.
However, these methods are not enough to evaluate the above problem correctly, and the cost of the simulation method is high. Furthermore, this method is not sustainable. As mentioned above, a sustainable production line involves lower costs, good production environments, and green manufacturing. ER is used widely to conduct the multi-attribute decision analysis under uncertainty [31]. Wu [32] used the ER-based cognitive reliability and error analysis method in human reliability analysis of the maritime accident process. A general ER algorithm was proposed to conduct the multi-attribute decision analysis under interval uncertainty [33]. Then, Liu et al. [34] used an ER rule-based approach to conduct evaluation, ranking, and selection of research and development projects. Additionally, an ER approach for production modeling [35] was proposed for improving products items. Finally, to address the uncertainty in the production line, ER was introduced.
3. Problem Description
Balance in the industrial production line affects production efficiency and costs, and it has been a constant goal for many companies seeking optimization [36,37,38,39,40]. In a mixed production line, which processes different types of products, achieving balance presents greater difficulty.
This study focuses on the case of an engine production line in the engine manufacturing industry [41]. Here, the daily production capacity of each line is 70 units, and each line has 42 stations in the industry. This study examines a production line used to manufacture four products—A, B, C, and D—in the ratio of 4:3:2:1. Figure 1 presents the original data. The chart also shows the processing time of the longest process of each product. In A, the longest production process is “hoisting cylinder head” with a processing time of 298 s; in B, the longest production process is “hoisting cylinder head” with a processing time of 293 s; in C, the longest production process is for the “starter” with a processing time of 306 s; and in D, the longest production process is “hoisting cylinder head” with a processing time of 257 s. Analysis of the original data showed that the production line has low balance (54.19%). The balance rate can be calculated by (1) as follows [41]:
where is the yield of production , is the sum of the processing time, is the number of processing steps, and is the time required for the bottleneck process. Therefore, the balance rate of this production line is 54.19%, which is low balance rate.
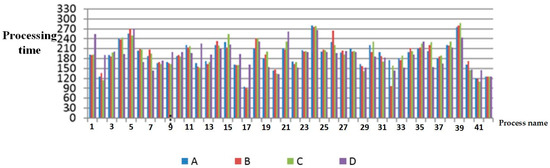
Figure 1.
Processing time of each process.
Hence, the hybrid engine production line has several problems with many bottlenecks, frequent downtimes, and the need for human treatment [41]. The processing times of “fastening the gear chamber cover” and “pulley” are lower than that of “process beat”. The processing times of “hoisting cylinder head” and “starter” are higher than that of “process beat”, which is a bottleneck process. The rule of the production line is to conform to the order form, whose limit is the production amount boundary. Hence, the production capacity of the production line cannot reach the maximum.
Many factors affect the production line, and the impact of these factors is uncertain as the information is incomplete. Combining industrial engineering, logistics theory, and related tools, the study analyzes the problem with low cost production environments and so on to improve its production line balance and productivity. The ER method is used to evaluate and select the total capacity of the improvement scheme. Additionally, it is analyzed using the following factors: economic benefits; worker’s salary; implementation difficulty; machine cost, and; factory logistics. (Machine cost includes the cost of purchasing the machine and machine maintenance. Factory logistics refers to raw materials or semi-finished products in line-edge logistics and finished products in factory-transport logistics.) Finally, the FlexSim simulation software is used to verify the accuracy and feasibility of the scheme.
4. Sustainable Production Line Evaluation Based on ER
ER was proposed by Yang [31] to address the uncertainty in decision-making. This method has been used widely in the assessment of solutions for the treatment of uncertain information. There are diverse ways to assess the influencing factors of sustainable production line plans, both qualitatively and quantitatively, but the information is incomplete here as well. The evaluation index includes subjective data on the natural expressions given by experts, such as high or low factory logistics. Quantitative data may provide the specific value of a worker’s salary. Uncertainty of the information refers to probabilities, ambiguities, and the unknowns.
To address diversity and uncertainty of the underlying data of the sustainable production line, the data should be unified before the model is established. In this study, the belief of the Dempster-Shafer theory [31] is used to unify the underlying data. The ER method for evaluation consists of four steps. First, construct the corresponding belief rule base, which is the core of ER. Second, convert the input information into a form with a belief structure. This process involves the conversion of multiple data types. After data conversion, the input data on the degree of activation of the belief rule base are calculated. Finally, evidence evaluation algorithm is used to calculate the final evaluation result of the input information.
The rule base is composed of a number of “if ... then ...” rules, where “if ...” is a prerequisite and “then ...” is the result of the corresponding premise. The belief structure (BS) uses belief to represent uncertainty and incomplete information. The belief structure (identified as BS in the equation) consists of numerical and reliability parts. It is described as follows [31]:
where is a set of numerical or competency levels, is the belief set, and N is the number of elements in set X.
Let be the set of prerequisites, and be the number of elements in this set. Let be the conclusion items, and is the number of elements in set R. Set is the belief set.
Hence, belief rules can be described as follows:
The belief rule base is composed of these belief rules, and it is a traversal of all possible combinations of prerequisites.
(1) Belief rule matching degree calculation [42]. Let input data be expressed as
where indicates the input value of the underlying indicator of the sustainable production line; is the input belief of , which reflects the input uncertainty of sustainable production line i.
The rule is a special case of a prerequisite item and conclusion item. If the input data are similar to the prerequisite item of a rule, then the result of the evaluation is similar to the conclusion of the rule. The ER method uses the matching degree to describe the degree of similarity between the inputs to the rule. The matching degree calculation consists of calculating the matching degree between the input and rules in the established rule base. The matching degree directly affects the weight of each rule when the next rule is synthesized.
First, calculate the matching degree between the input and rules of sustainable production line [42] as follows:
where , is the value of rule prerequisites, and is the matching degree of input to the rule prerequisites . is called the similarity function, which is defined as follows:
If the prerequisite value is a discrete sequence, it can be assumed that it is a monotonically increasing sequence whose input is a single point.
If the input is described with a belief structure, the input belief should be matching degree .
Second, aggregate the prerequisite matching degree in the same rule. Matching degree can be obtained between the input and each rule.
If the rule in a prerequisite can be described by the logical symbol “”, then
where , is the relative weight of k-th rule prerequisite , and . is the matching degree of the k-th rule prerequisite , and . It can be seen that according to (7). If and only if , .
If the rule in a prerequisite can be described by the logical symbol “”, then
where , , and is the matching degree of the k-th prerequisite.
(2) Brief rule activation degree calculation. Brief rule activation degree calculation refers to the degree of input data in every rule [42]. It is represented by
where is the rule weight, and = 0 means that the rule is not activated.
If the matching degree is higher between the input data and the rule, the rule activation degree will be higher. The activation degree is the weight of the rule during rule synthesis.
(3) Rule aggregation based on the Dempster-Shafer theory. Before rule aggregation, the rule brief will be revised [42]. It is defined as
where
is the revised factor, which indicates the revision of input incomplete information. is the number of prerequisites of rule k (, ). If the activated rule is complete, then
After rule revision, the basic brief number is construed.
Let be the basic brief number, which represents the basic brief number of the first conclusion, and let represent the k-th basic brief number [42].
Let be the uncertainty with weight , and is the uncertainty from the incomplete information.
Then, rule aggregation based on the Dempster-Shafer theory is described as in [42] as follows:
where is the basic brief number of the first conclusion. Assessment of the sustainable production line can be done after all the sub-indicators are aggregated. It satisfies the following [42]:
where is the brief of first level of target ability, and represents the incomplete brief in target capability assessment. Hence, the assessment of sustainable production line plans can be ranked by . The ER method can be used in the evaluation of the sustainable production line.
5. Case Study for ER
The bottom impact factor used in this study for the sustainable production line in engine manufacturing includes economic benefits, worker’s salary, implementation difficulty, machine cost, and factory logistics. The two evaluation ratings, high and low, are presented in Table 1.

Table 1.
Evaluation Ratings of Production Impact Factors.
It is assumed that the weights of rules in the rules base are equal, and rule prerequisites are also equal. The rule base is presented in the Appendix A.
The ER structure is established in Figure 2.
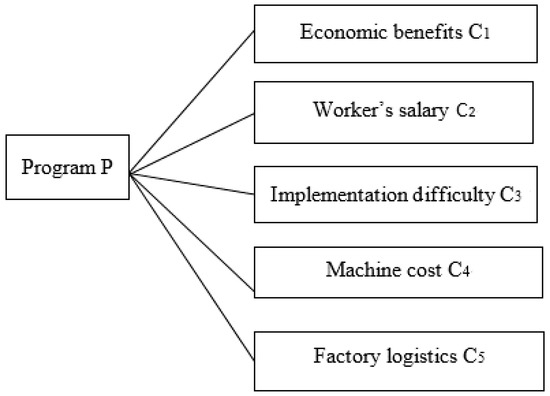
Figure 2.
The evidence reasoning structure.
In this study, concrete measures of the sustainable production line are developed by combining “fastening gear chamber cover” and “pulley”, and increasing workers in the “hoisting cylinder head” and “starter”. Otherwise, production rules of the production line are adjusted, the optimal order of production is calculated, and batch production is used.
The total capacity of the three plans is calculated by ER as follows:
- (1)
- Original plan: C1 = {(high, 0.8), (low, 0.2)}; C2 = {(high, 0.4), (low, 0.6)}; C3 = {(high, 0.25), (low, 0.75)}; C4 = {(high, 0.4), (low, 0.6)}; and C5 = {(high, 0.8), (low, 0.2)}. The above underlying data are substituted to activate the rule base, and the result is calculated by the formulas in Section 3, P1 = (0.7393, 0.2626).
- (2)
- Plan 2: C2 = {(high, 0.2), (low, 0.8)}; C3 = {(high, 0.25), (low, 0.75)}, C4 = {(high, 0.2), (low, 0.8)}; and C5 = {(high, 0.2), (low, 0.8)}. Then, the result is calculated as P2 = (0.7983, 0.2029).
- (3)
- Plan 3 is different from Plan 2 with C1 = {(high, 0.2), (low, 0.8)}. Similarly, P3 = (0.8552, 0.1454).
Comparing the total capacity of the plan,
P3 > P2 > P1.
Evaluation of sustainable production lines through ER shows that Plan P3 is the best, and the original plan, P1, is the worst. Therefore, combining the “fastening gear chamber cover” and “pulley” and increasing workers in “hoisting cylinder head” and “starter” can allow the production line to have a good effect. Otherwise, adjusting the production rules of the production line, calculating the optimal order of production, and using batch production can yield a better result for the sustainable production line. Additionally, ER is an efficient method for sustainable production line evaluation. It can address the uncertainty problem in sustainable production line assessment and can been easily performed using a computer. Moreover, ER costs less.
6. Simulation Modeling and Analysis Verification Using FlexSim
To verify the feasibility of ER in the evaluation of a sustainable production line, a FlexSim simulation is used. The application-based FlexSim simulation has been widely used, as it can efficiently evaluate a production line. Therefore, after evaluating the sustainable production line, a simulation is necessary to objectively verify that ER has a good effect on the evaluation.
For establishing the simulation model, based on the status quo of the problem, a simulation flow chart can be built as shown in Figure 3.
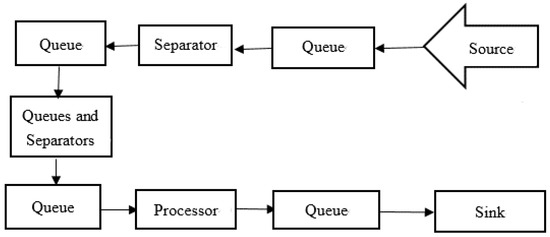
Figure 3.
Simulation flow chart.
According to the data [41], the simulation model is established as in Figure 4.
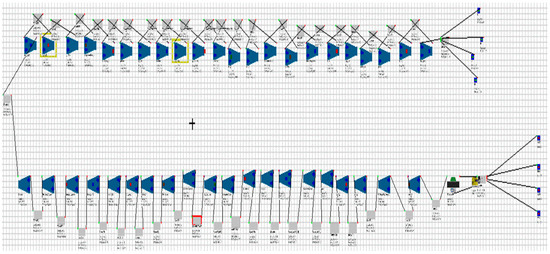
Figure 4.
FlexSim simulation modeling.
The three plans in Section 3 were modeled separately. Input of the underlying data in Section 3 is adjusted for modeling the relevant process entities and parameters.
- (1)
- Original plan 1.
- (2)
- Plan 2, which combines “fastening the gear chamber cover” with “pulley” and increases the workers appropriately in the “hoisting cylinder head”, and the “starter”.
- (3)
- Plan 3, in which the production line is adjusted based on Plan 2. The best producing order is calculated and, subsequently, batch production is used.
This simulation sets the simulation time equal to one workday (36,000 s) and runs five iterations to find the average values.
The simulation result is as follows:
From Table 2, it can be seen that combining the processes and increasing the workers are good for the production capacity. Plan 3 adjusts the production capacity from 70 to 80 based on Plan 2, and it has the best effect.
Table 2.
Average Production Capacity of the Plan.
From the simulation results in Figure 5, it is verified that it would be effective to use ER in engine production line evaluation and selection. Through the simulation results, it can be deduced that the ER and simulation results for the three plans are consistent. In the ER evaluation, plan P3 was found to be the best, followed by plan P2, and finally plan P1. According to the simulations of the three plans, Plan 3 is the best and Original plan 1 is the worst. Therefore, the best plan for this sustainable production line involves combining “fastening gear chamber cover” and “pulley” and increasing workers in the “hoisting cylinder head” and “starter”, adjusting the production rules of the production line, calculating the optimal order of production, and using batches for production.
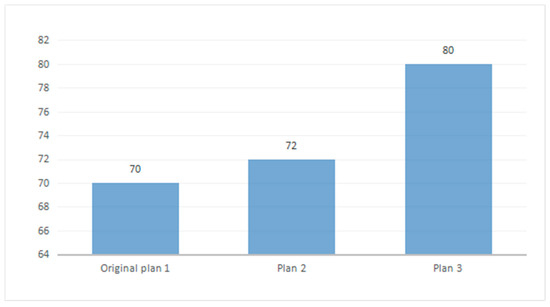
Figure 5.
Simulation results.
Given the above results, ER is a scientific method for evaluating a sustainable production line.
7. Conclusions
7.1. Result Analysis
A case study evaluating a sustainable production line in engine manufacturing is used to verify the proposed method. The production line has several problems: the processing times of “fastening gear chamber cover” and “pulley” are shorter and those of “hoisting cylinder head” and “starter” are longer than that of “process beat”, which is a bottleneck process. The rule of the production line is to conform to the order form, for which the limit is the production amount boundary. Hence, the production capacity of the production line cannot reach the maximum. Therefore, in order to balance the production line, three plans are proposed. Then, the three production line plans are analyzed using ER. The result is P1 = (0.7393, 0.2626), P2 = (0.7983, 0.2029), and P3 = (0.8552, 0.1454). It can be seen that plan P3 is the best. Moreover, a FlexSim simulation is used to verify the ER method’s applicability to the evaluation of the sustainable production line. The result of the simulation for the three plans is the daily output (Original plan 1 = 70, Plan 2 = 72, and Plan 3 = 80), and Plan 3 is found to be the best. Therefore, the ER and simulation results are the same. This proves that the ER method is applicable in the evaluation of a sustainable production line.
7.2. Discussion
This ER model is proposed to address the sustainable production line evaluation problem.
With an illustrative example in the engine manufacturing production line, the economic benefits, worker’s salary, implementation difficulty, machine cost, and factory logistics are considered. Some highlighted results of this case study can be summarized as follows:
- (1)
- Comparing with existing production line evaluation methods, ER evaluation model needs less clear input data. With the ER model, the overall capacity for the production line evaluation is obtained by using the underlying indicator status to activate the rule base.
- (2)
- The cost of ER is considerably low. Most of the existing methods for production line evaluation do not meet the sustainability criteria, as they are relatively expensive. For instance, production line evaluation through FlexSim is a widely used method, which can achieve good results. However, an industrial simulation of a production line needs investigation of the production line factors and collection of multiple sets of specific industrial data. Moreover, professional simulation software is necessary for modeling. Therefore, the cost of production line simulation is high.
- (3)
- It has been shown that ER model is effective in evaluation problem with uncertainty. Strict logical reasoning is necessary in the decision-making process, and the synthesis of evidence in ER model can be used to describe the rules in real world with the rigorous process, which is important in production line evaluation.
7.3. Summary
The plan for production line sustainability and balance is a popular issue in the modern industrial economy. However, improving a sustainable plan involves many factors, and the incomplete information poses difficulties for the decision maker. The purpose of sustainable production line development is achieving balance in the production line. Further, a sustainable production line involves lower costs, efficient production environments, green manufacturing, and so on. Hence, sustainable production line evaluation is a meaningful and challenging problem.
To deal with the problem described above, ER is employed to evaluate a sustainable production line, and a FlexSim simulation is used to verify its feasibility. Furthermore, ER is a good method that requires low cost for addressing the industrial problems of uncertain information, information diversity, and incompleteness of information. However, indicators of sustainable production lines evaluation are simplified to some extent; therefore, as a next step, some more complicated indicators can be obtained to evaluate sustainable production lines using ER.
Acknowledgments
We are thankful to the Editor and the reviewers for their valuable comments and detailed suggestions to improve the paper. Further, we also acknowledge the partial support by the National Science Foundation of China under grants No. 71690233 and No. 71671186.
Author Contributions
Zhexuan Zhou and Jianbin Sun conceived and designed the experiments; Zhexuan Zhou performed the experiments; Yajie Dou and Yuejin Tan analyzed the data; Yajie Dou and Jiang Jiang contributed reagents/materials/analysis tools; Zhexuan Zhou wrote the paper.
Conflicts of Interest
The authors declare no conflict of interest.
Appendix A
The rule base is as follows:
| Numbers | Prerequisites | Conclusions |
|---|---|---|
| C1 | C1 = {(High, 0.8), (Low, 0.2)} | |
| C1 | C1 = {(High, 0.9), (Low, 0.1)} | |
| C2 | C2 = {(High, 0.4), (Low, 0.6)} | |
| C2 | C2 = {(High, 0.2), (Low, 0.8)} | |
| C3 | C3 = {(High, 0.25), (Low, 0.75)} | |
| C3 | C3 = {(High, 0.2), (Low, 0.8)} | |
| C4 | C4 = {(High, 0.4), (Low, 0.6)} | |
| C4 | C4 = {(High, 0.2), (Low, 0.8)} | |
| C5 | C5 = {(High, 0.7), (Low, 0.3)} | |
| C5 | C5 = {(High, 0.8), (Low, 0.2)} | |
| 1 | (C1 = High)∧(C2 = High)∧(C3 = High)∧(C4 = High)∧(C5 = High) | P = {(High, 0.65), (Low, 0.35)} |
| 2 | (C1 = High)∧(C2 = High)∧(C3 = High)∧(C4 = High)∧(C5 = Low) | P = {(High, 0.5), (Low, 0.5)} |
| 3 | (C1 = High)∧(C2 = High)∧(C3 = High)∧(C4 = Low)∧(C5 = High) | P = {(High, 0.68), (Low, 0.32)} |
| 4 | (C1 = High)∧(C2 = High)∧(C3 = High)∧(C4 = Low)∧(C5 = Low) | P = {(High, 0.65), (Low, 0.35)} |
| 5 | (C1 = High)∧(C2 = High)∧(C3 = Low)∧(C4 = High)∧(C5 = High) | P = {(High, 0.6), (Low, 0.4)} |
| 6 | (C1 = High)∧(C2 = High)∧(C3 = Low)∧(C4 = High)∧(C5 = Low) | P = {(High, 0.69), (Low, 0.31)} |
| 7 | (C1 = High)∧(C2 = High)∧(C3 = Low)∧(C4 = Low)∧(C5 = High) | P = {(High, 0.8), (Low, 0.2)} |
| 8 | (C1 = High)∧(C2 = High)∧(C3 = Low)∧(C4 = Low)∧(C5 = Low) | P = {(High, 0.6), (Low, 0.4)} |
| 9 | (C1 = High)∧(C2 = Low)∧(C3 = High)∧(C4 = High)∧(C5 = High) | P = {(High, 0.65), (Low, 0.35)} |
| 10 | (C1 = High)∧(C2 = Low)∧(C3 = High)∧(C4 = High)∧(C5 = Low) | P = {(High, 0.52), (Low, 0.48)} |
| 11 | (C1 = High)∧(C2 = Low)∧(C3 = High)∧(C4 = Low)∧(C5 = High) | P = {(High, 0.66), (Low, 0.34)} |
| 12 | (C1 = High)∧(C2 = Low)∧(C3 = High)∧(C4 = Low)∧(C5 = Low) | P = {(High, 0.65), (Low, 0.35)} |
| 13 | (C1 = High)∧(C2 = Low)∧(C3 = Low)∧(C4 = High)∧(C5 = High) | P = {(High, 0.78), (Low, 0.22)} |
| 14 | (C1 = High)∧(C2 = Low∧(C3 = Low)∧(C4 = High)∧(C5 = Low) | P = {(High, 0.65), (Low, 0.35)} |
| 15 | (C1 = High)∧(C2 = Low)∧(C3 = Low)∧(C4 = Low)∧(C5 = High) | P = {(High, 1), (Low, 0)} |
| 16 | (C1 = High)∧(C2 = Low)∧(C3 = Low)∧(C4 = Low)∧(C5 = Low) | P = {(High, 0.67), (Low, 0.33)} |
| 17 | (C1 = Low)∧(C2 = High)∧(C3 = High)∧(C4 = High)∧(C5 = High) | P = {(High, 0.8), (Low, 0.2)} |
| 18 | (C1 = Low)∧(C2 = High)∧(C3 = High)∧(C4 = High)∧(C5 = Low) | P = {(High, 0), (Low, 1)} |
| 19 | (C1 = Low)∧(C2 = High)∧(C3 = High)∧(C4 = Low)∧(C5 = High) | P = {(High, 0.4), (Low, 0.6)} |
| 20 | (C1 = Low)∧(C2 = High)∧(C3 = High)∧(C4 = Low)∧(C5 = Low) | P = {(High, 0.2), (Low, 0.8)} |
| 21 | (C1 = Low)∧(C2 = High)∧(C3 = Low)∧(C4 = High)∧(C5 = High) | P = {(High, 0.55), (Low, 0.45)} |
| 22 | (C1 = Low)∧(C2 = High)∧(C3 = Low)∧(C4 = High)∧(C5 = Low) | P = {(High, 0.65), (Low, 0.35)} |
| 23 | (C1 = Low)∧(C2 = High)∧(C3 = Low)∧(C4 = Low)∧(C5 = High) | P = {(High, 0.5), (Low, 0.5)} |
| 24 | (C1 = Low)∧(C2 = High)∧(C3 = Low)∧(C4 = Low)∧(C5 = Low) | P = {(High, 0.65), (Low, 0.35)} |
| 25 | (C1 = Low)∧(C2 = Low)∧(C3 = High)∧(C4 = High)∧(C5 = High) | P = {(High, 0.49), (Low, 0.51)} |
| 26 | (C1 = Low)∧(C2 = Low)∧(C3 = High)∧(C4 = High)∧(C5 = Low) | P = {(High, 0.65), (Low, 0.35)} |
| 27 | (C1 = Low)∧(C2 = Low)∧(C3 = High)∧(C4 = Low)∧(C5 = High) | P = {(High, 0.2), (Low, 0.8)} |
| 28 | (C1 = Low)∧(C2 = Low)∧(C3 = High)∧(C4 = Low)∧(C5 = Low) | P = {(High, 0.22), (Low, 0.78)} |
| 29 | (C1 = Low)∧(C2 = Low)∧(C3 = Low)∧(C4 = High)∧(C5 = High) | P = {(High, 0.45), (Low, 0.65)} |
| 30 | (C1 = Low)∧(C2 = Low)∧(C3 = High)∧(C4 = High)∧(C5 = Low) | P = {(High, 0.18), (Low, 0.82)} |
| 31 | (C1 = Low)∧(C2 = Low)∧(C3 = Low)∧(C4 = Low)∧(C5 = High) | P = {(High, 0.6), (Low, 0.4)} |
| 32 | (C1 = Low)∧(C2 = Low)∧(C3 = Low)∧(C4 = Low)∧(C5 = Low) | P = {(High, 0.52), (Low, 0.48)} |
References
- Xu, J.; Jiang, X.; Wu, Z. A Sustainable Performance Assessment Framework for Plastic Film Supply Chain Management from a Chinese Perspective. Sustainability 2016, 8, 1042. [Google Scholar] [CrossRef]
- Joo, S.J.; Choi, H.C.P. Assessing comparative production efficiencies for product line management. Int. J. Prod. Res. 2015, 53, 241–5250. [Google Scholar] [CrossRef]
- Dong, C.; Shen, B.; Chow, P.S.; Yang, L.; Chi, T.N. Sustainability investment under cap-and-trade regulation. Ann. Oper. Res. 2016, 240, 509–531. [Google Scholar] [CrossRef]
- Liu, J.; Mooney, H.; Hull, V.; Davis, S.J.; Gaskell, J.; Hertel, T.; Lubchenco, J.; Seto, K.C.; Gleick, P.; Kremen, C.; et al. Systems integration for global sustainability. Science 2015, 347, 1258832. [Google Scholar] [CrossRef] [PubMed]
- Bardos, R.P.; Bone, B.D.; Boyle, R.; Evans, F.; Harries, D.N.; Howard, T.; Smith, J.W. The rationale for simple approaches for sustainability assessment and management in contaminated land practice. Sci. Total Environ. 2016. [Google Scholar] [CrossRef] [PubMed]
- Galal, N.; Moneim, A. A Mathematical Programming Approach to the Optimal Sustainable Product Mix for the Process Industry. Sustainability 2015, 7, 13085–13103. [Google Scholar] [CrossRef]
- Lee, J.; Jun, S.; Chang, T.W.; Park, J. A Smartness Assessment Framework for Smart Factories Using Analytic Network Process. Sustainability 2017, 9, 794. [Google Scholar] [CrossRef]
- Wang, C.N.; Huang, Y.F.; Le, T.N.; Ta, T.T. An Innovative Approach to Enhancing the Sustainable Development of Japanese Automobile Suppliers. Sustainability 2016, 8, 420. [Google Scholar] [CrossRef]
- Čereška, A.; Zavadskas, E.; Cavallaro, F.; Podvezko, V.; Tetsman, I.; Grinbergienė, I. Sustainable Assessment of Aerosol Pollution Decrease Applying Multiple Attribute Decision-Making Methods. Sustainability 2016, 8, 586. [Google Scholar] [CrossRef]
- Burinskiene, M.; Bielinskas, V.; Podviezko, A.; Gurskiene, V.; Maliene, V. Evaluating the Significance of Criteria Contributing to Decision-Making on Brownfield Land Redevelopment Strategies in Urban Areas. Sustainability 2017, 9, 759. [Google Scholar] [CrossRef]
- Zhaoxia, G.; Haitao, L.; Dongqing, Z.; Jing, Y. Green Supplier Evaluation and Selection in Apparel Manufacturing Using a Fuzzy Multi-Criteria Decision-Making Approach. Sustainability 2017, 9, 650. [Google Scholar] [CrossRef]
- Wei, F.; Lu, J.; Kong, Y. Research on Sustainability Financial Performance of Chinese Listed Companies. Sustainability 2017, 723. [Google Scholar] [CrossRef]
- Shankar, K.M.; Kumar, P.U.; Kannan, D. Analyzing the Drivers of Advanced Sustainable Manufacturing System Using AHP Approach. Sustainability 2016, 8. [Google Scholar] [CrossRef]
- Wu, G.; Duan, K.; Zuo, J.; Zhao, X.; Tang, D. Integrated Sustainability Assessment of Public Rental Housing Community Based on a Hybrid Method of AHP-Entropy Weight and Cloud Model Sustainability. Sustainability 2017, 9, 603. [Google Scholar] [CrossRef]
- Koltai, T.; Lozano, S.; Uzonyi-Kecskés, J.; Moreno, P. Evaluation of the results of a production simulation game using a dynamic DEA approach. Comput. Ind. Eng. 2017, 105, 1–11. [Google Scholar] [CrossRef]
- Levitt, T. Production Line Approach to Service. McKinsey Q. 1973, 9, 2–18. [Google Scholar] [CrossRef]
- Kłosowski, G.; Gola, A.; Świć, A. Application of Fuzzy Logic Controller for Machine Load Balancing in Discrete Manufacturing System. In International Conference on Intelligent Data Engineering and Automated Learning; Springer: Cham, Switzerland, 2015; pp. 256–263. [Google Scholar]
- Mastor, A.A. An Experimental Investigation and Comparative Evaluation of Production Line Balancing Techniques. Manag. Sci. 1970, 16, 728–746. [Google Scholar] [CrossRef]
- Grabowski, D.; Cristalli, C. Production line quality control using infrared imaging. Infrared Phys. Technol. 2015, 71, 416–423. [Google Scholar] [CrossRef]
- Chen, G.; Wang, C.; Zhang, L.; Arinez, J.; Xiao, G. Transient, Performance Analysis of Serial Production Lines with Geometric Machines. IEEE Trans. Autom. Control 2015, 61, 877–891. [Google Scholar] [CrossRef]
- Shin, K.Y.; Suh, S.H.; Choi, S.W. A unified system-framework engine for industrial instrumentation systems. Int. J. Comput. Integr. Manuf. 2017. [Google Scholar] [CrossRef]
- Yao, X.; Cui, J.; Yu, H.; Qi, X.; Mi, X.; Jiang, Y.; Wang, M.; Li, X. An improved accuracy-measuring method in manufacturing the lead screw of grating ruling engine. Precis. Eng. 2017. [Google Scholar] [CrossRef]
- Shui, H.; Jin, X.; Ni, J. Manufacturing productivity and energy efficiency: A stochastic efficiency frontier analysis. Int. J. Energy Res. 2015, 39, 1649–1663. [Google Scholar] [CrossRef]
- Chen, Q.; Liao, S.L.; Wu, Z.Z.; Yi, S.P. Comparative analysis of the performance of a novel, U-shaped ‘chasing-overtaking’ production line. Int. J. Prod. Res. 2016, 54, 1–14. [Google Scholar] [CrossRef]
- Ham, W.K.; Ko, M.; Sang, C.P. A framework for simulation-based engine-control unit inspection in manufacturing phase. Control Eng. Pract. 2017, 59, 137–148. [Google Scholar] [CrossRef]
- Alrabghi, A.; Tiwari, A.; Savill, M. Simulation-based optimisation of maintenance systems: Industrial case studies. J. Manuf. Syst. 2017, 44, 191–206. [Google Scholar] [CrossRef]
- Haneef, M.D.; Randall, R.B.; Smith, W.A.; Peng, Z. Vibration and Wear Prediction Analysis of IC Engine Bearings by Numerical Simulation. Wear 2017. [Google Scholar] [CrossRef]
- Boysen, N.; Fliedner, M.; Scholl, A. Assembly line balancing: Which model to use when. Int. J. Prod. Econ. 2008, 111, 509–528. [Google Scholar] [CrossRef]
- Borisovsky, P.A.; Delorme, X.; Dolgui, A. Genetic algorithm for balancing reconfigurable machining lines. Comput. Ind. Eng. 2013, 66, 541–547. [Google Scholar] [CrossRef]
- Peng, J. Mixed Production Line Balancing and Optimization Based on Flexsim. Mod. Mach. Tool Autom. Manuf. Tech. 2014, 9, 140–143. (In Chinese) [Google Scholar]
- Yang, J.B.; Xu, D.L. On the evidential reasoning algorithm for multiple attribute decision analysis under uncertainty. IEEE Trans. Syst. Man Cybern. Part A Syst. Hum. 2002, 32, 289–304. [Google Scholar] [CrossRef]
- Wu, B.; Yan, X.; Wang, Y.; Soares, C.G. An Evidential Reasoning-Based CREAM to Human Reliability Analysis in Maritime Accident Process. Risk Anal. 2017. [Google Scholar] [CrossRef] [PubMed]
- Zhang, M.J. A general evidential reasoning algorithm for multi-attribute decision analysis under interval uncertainty. Eur. J. Oper. Res. 2017, 257, 1005–1015. [Google Scholar] [CrossRef]
- Liu, F.; Zhu, W.D.; Chen, Y.W.; Xu, D.L.; Yang, J.B. Evaluation, ranking and selection of, R&D projects by multiple experts: An evidential reasoning rule based approach. Scientometrics 2017, 111, 1–19. [Google Scholar] [CrossRef]
- Nodoust, S.; Mirzazadeh, A.; Weber, G.W. An evidential reasoning approach for production modeling with deteriorating and ameliorating items. Oper. Res. 2017, 1–19. [Google Scholar] [CrossRef]
- Gilenson, M.; Hassoun, M.; Yedidsion, L. Setting defect charts control limits to balance cycle time and yield for a tandem production line. Comput. Oper. Res. 2015, 53, 301–308. [Google Scholar] [CrossRef]
- Kovalev, S.; Delorme, X.; Dolgui, A.; Oulamara, A. Minimizing the number of stations and station activation costs for a production line. Comput. Oper. Res. 2017, 79, 131–139. [Google Scholar] [CrossRef]
- Andres, C.; Miralles, C.; Pastor, R. Balancing and scheduling tasks in assembly lines with sequence-dependent setup times. Eur. J. Oper. Res. 2008, 187, 1212–1223. [Google Scholar] [CrossRef]
- Battaia, O.; Dolgui, A. A taxonomy of line balancing problems and their solution approaches. Int. J. Prod. Econ. 2013, 142, 259–277. [Google Scholar] [CrossRef]
- Boysen, N.; Fliedner, M. A versatile algorithm for assembly line balancing. Eur. J. Oper. Res. 2008, 184, 39–56. [Google Scholar] [CrossRef]
- Fan, L.; Shen, D.; Jian, X.; Chen, Y.; Hui, Q.; Zhang, Z.Z. Based on Simulafion in a Balanced Improvement of Engine Hybrid Production Line. Mod. Mach. Tool Autom. Manuf. Tech. 2016, 8, 118–123. (In Chinese) [Google Scholar]
- Cheng, B.; Jiang, J.; Tan, Y.J.; Lu, Y.J. A novel approach for WSoS capability requirement satisfactory degree evaluation using evidential reasoning. Syst. Eng. Theory Pract. 2011, 31, 2210–2216. (In Chinese) [Google Scholar]
© 2017 by the authors. Licensee MDPI, Basel, Switzerland. This article is an open access article distributed under the terms and conditions of the Creative Commons Attribution (CC BY) license (http://creativecommons.org/licenses/by/4.0/).