Terrestrial Condition Assessment for National Forests of the USDA Forest Service in the Continental US


 ,
,
Abstract
:1. Introduction
2. Materials and Methods
2.1. Study Area and Analysis Units
2.2. Data Sources
2.3. Overview of EMDS Framework
2.4. NetWeaver Logic Design for TCA
- Evaluates a proposition about the topic represented by the network, which is contained in a comment field;
- Has a logical specification composed of its immediate logical antecedents and one or more logic operators that determine how the antecedents contribute to the proposition;
- Has a measure of the strength of evidence for the proposition provided by its antecedents;
- Has one or more documentation attributes that describe important aspects of the network (e.g., most networks have an explanation attribute at a minimum).
2.5. TCA Analysis in EMDS System
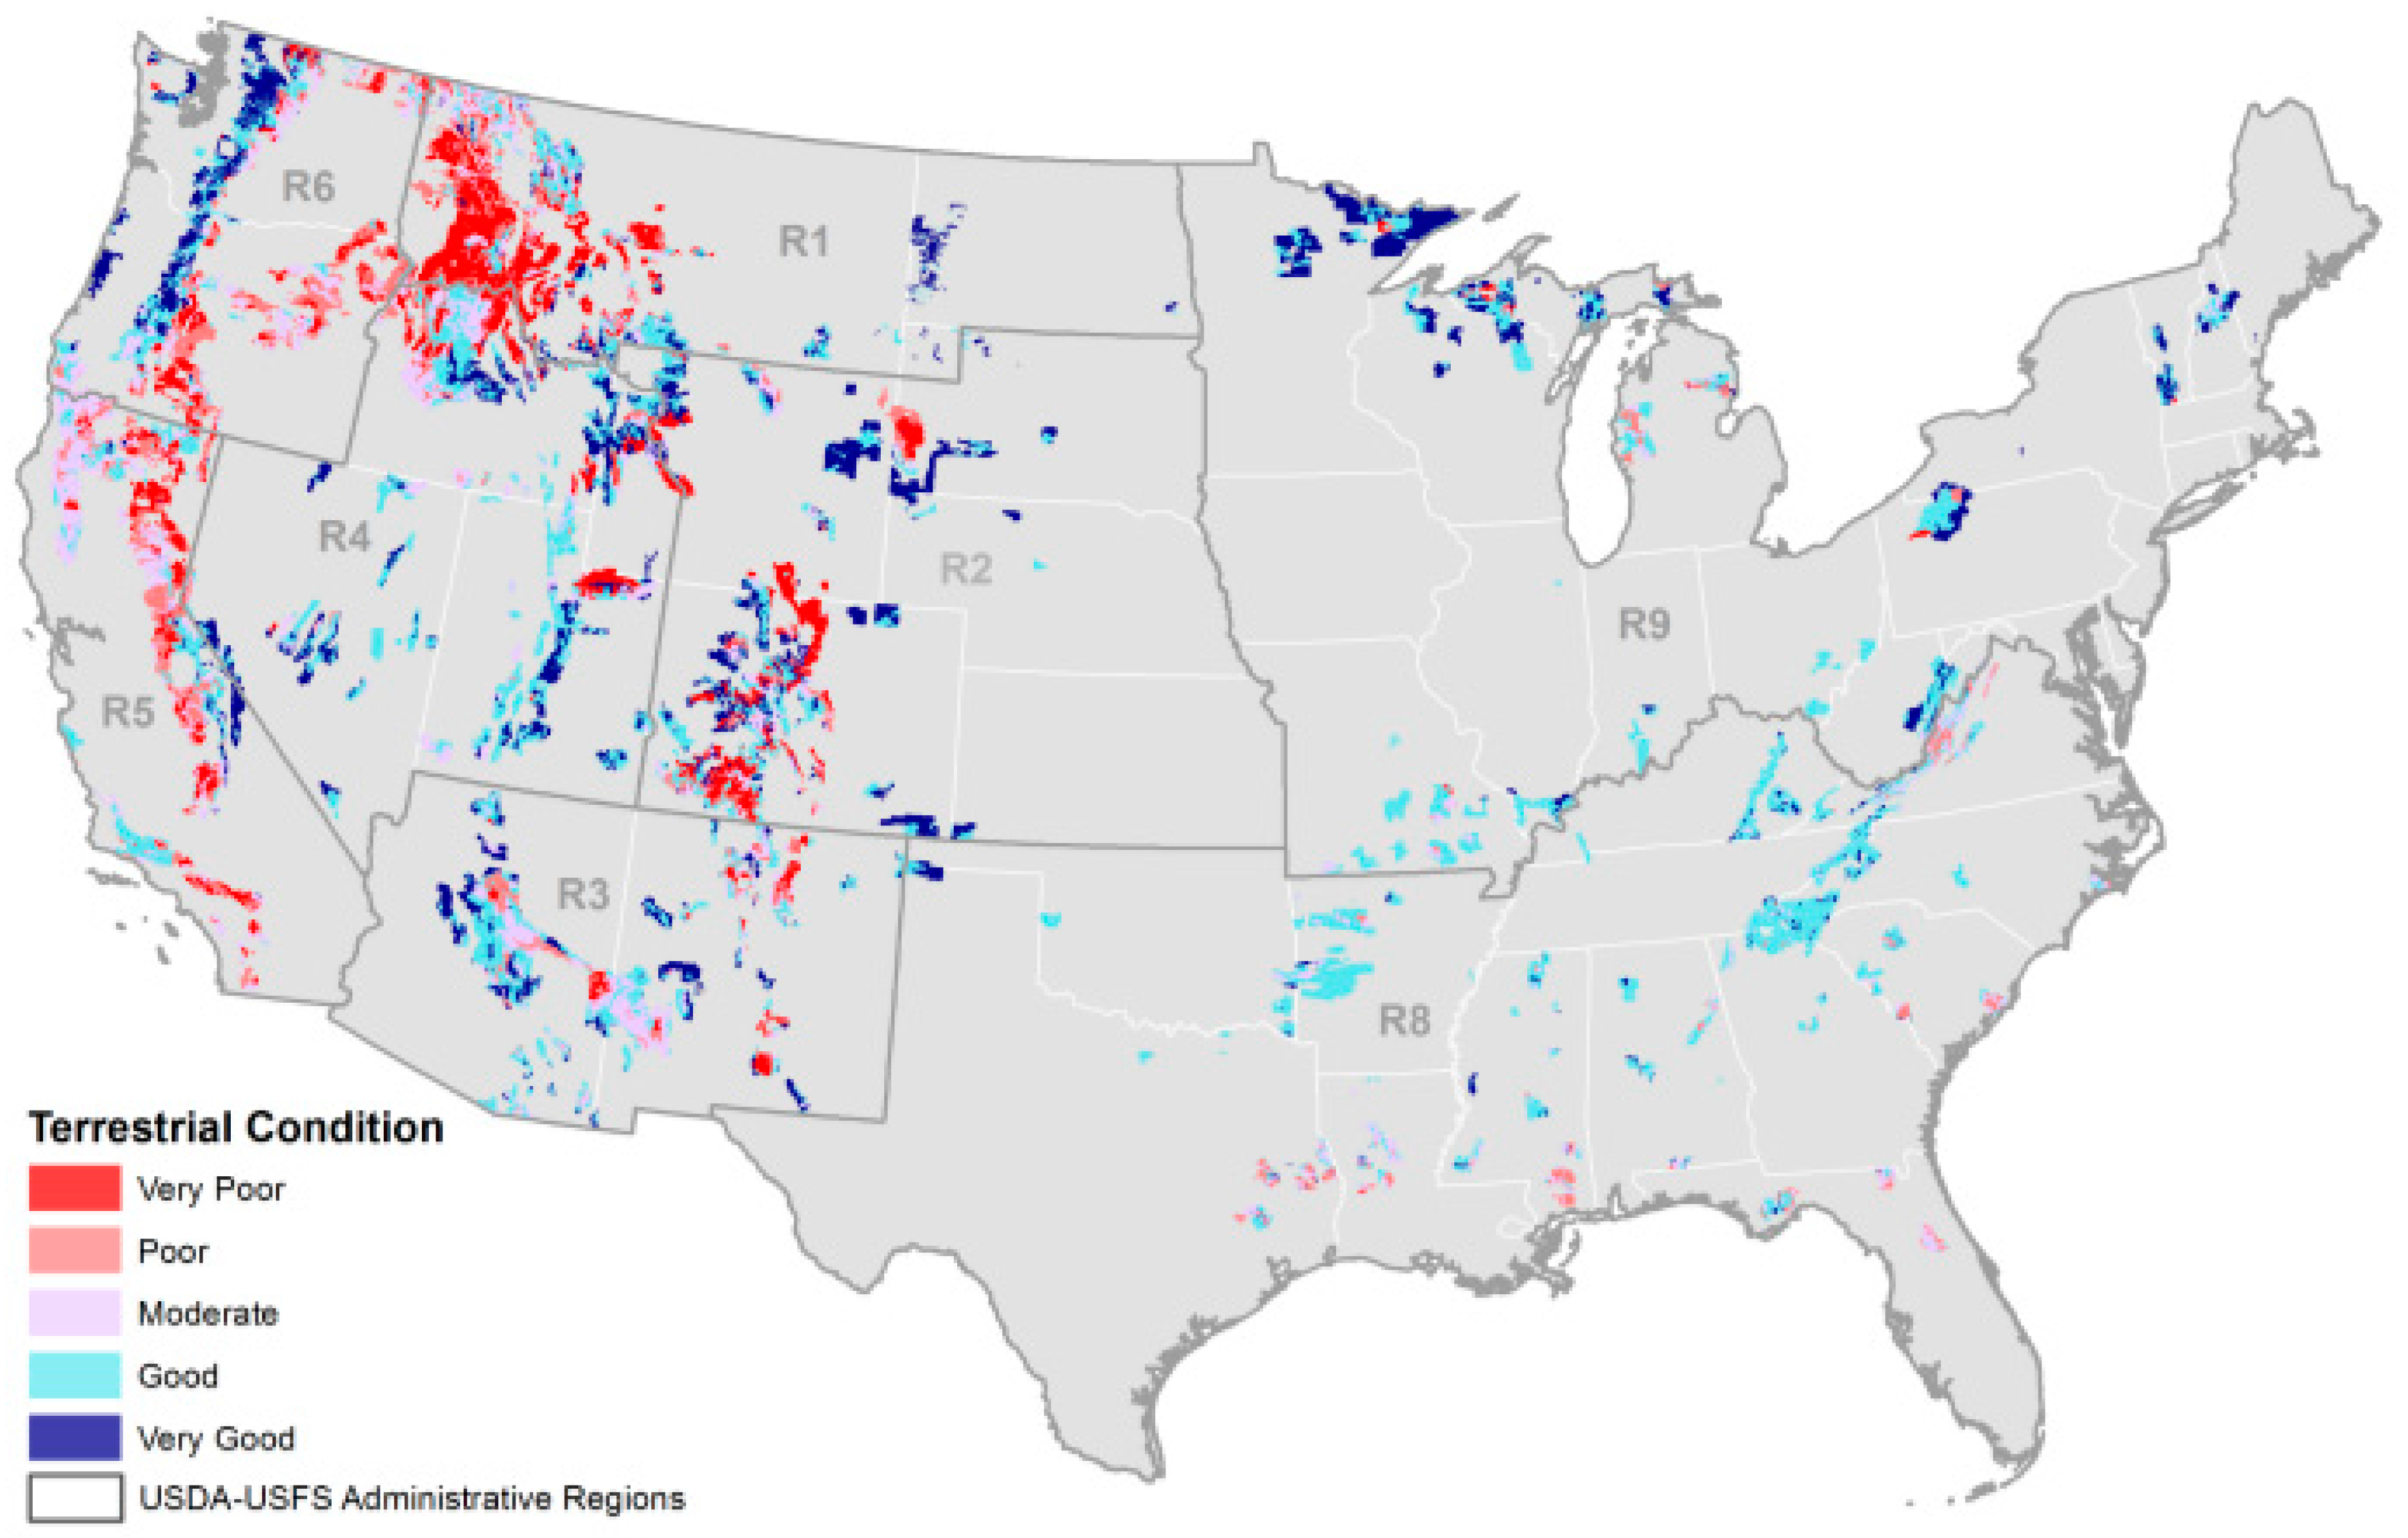
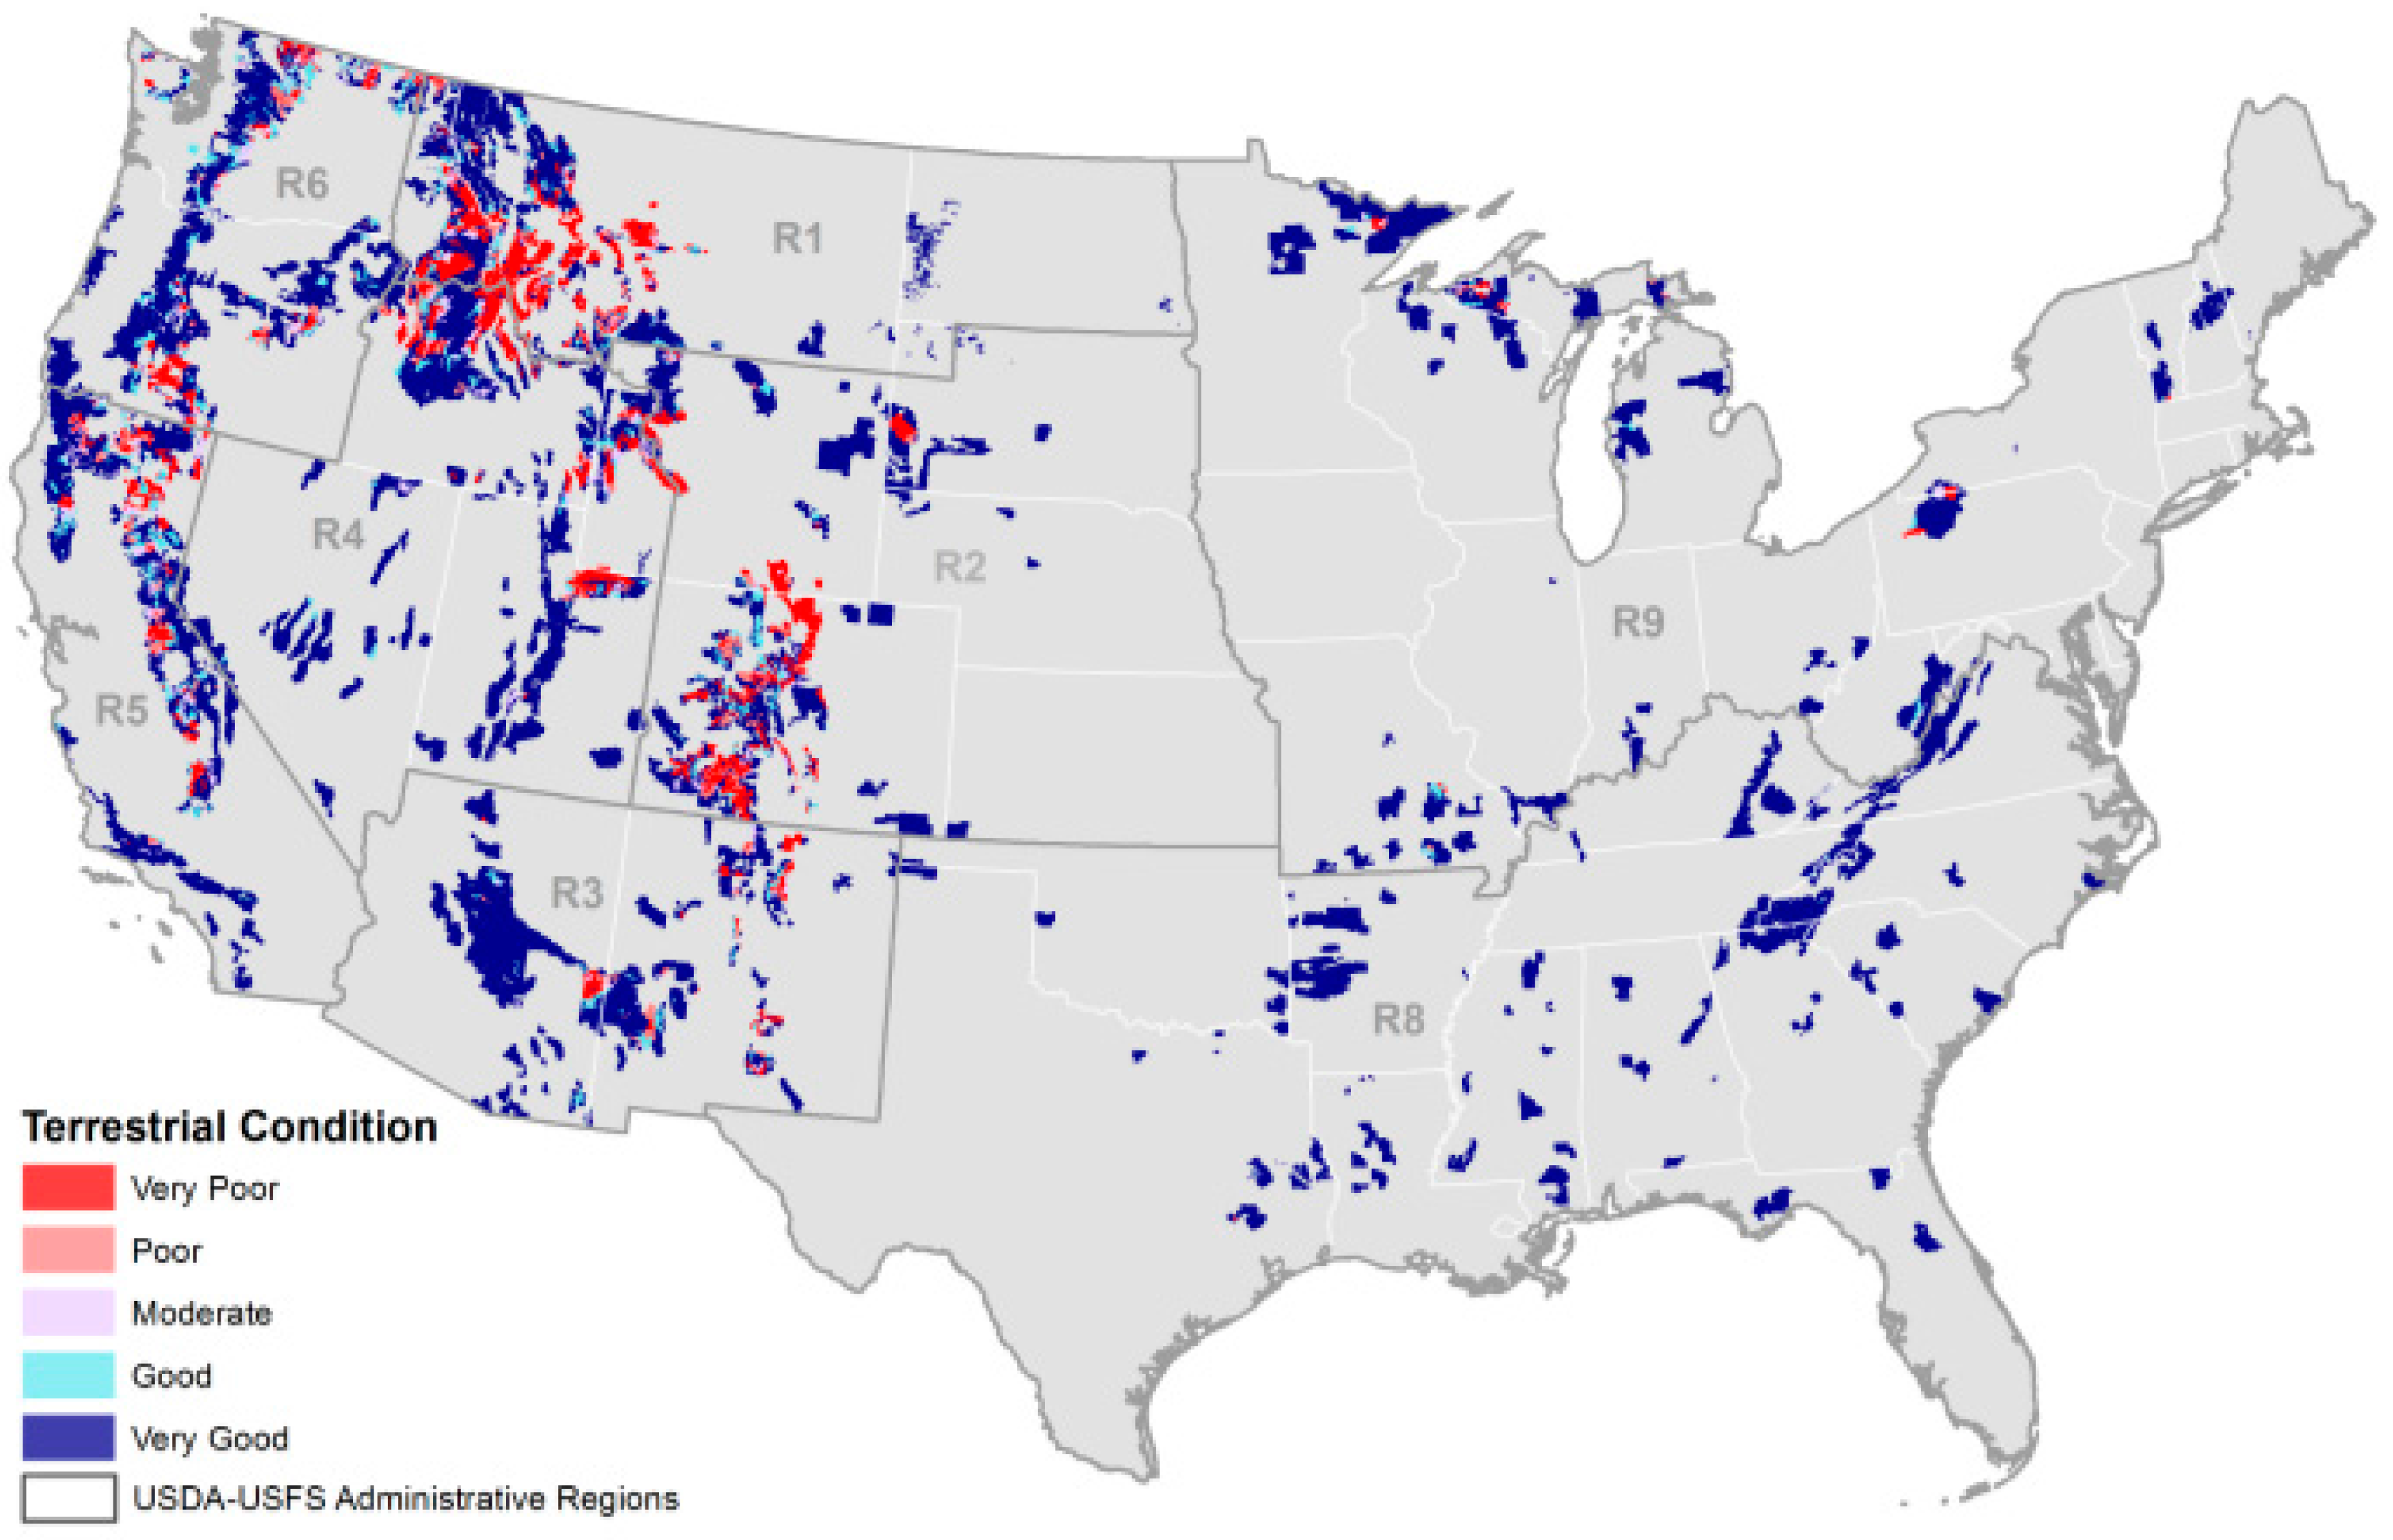
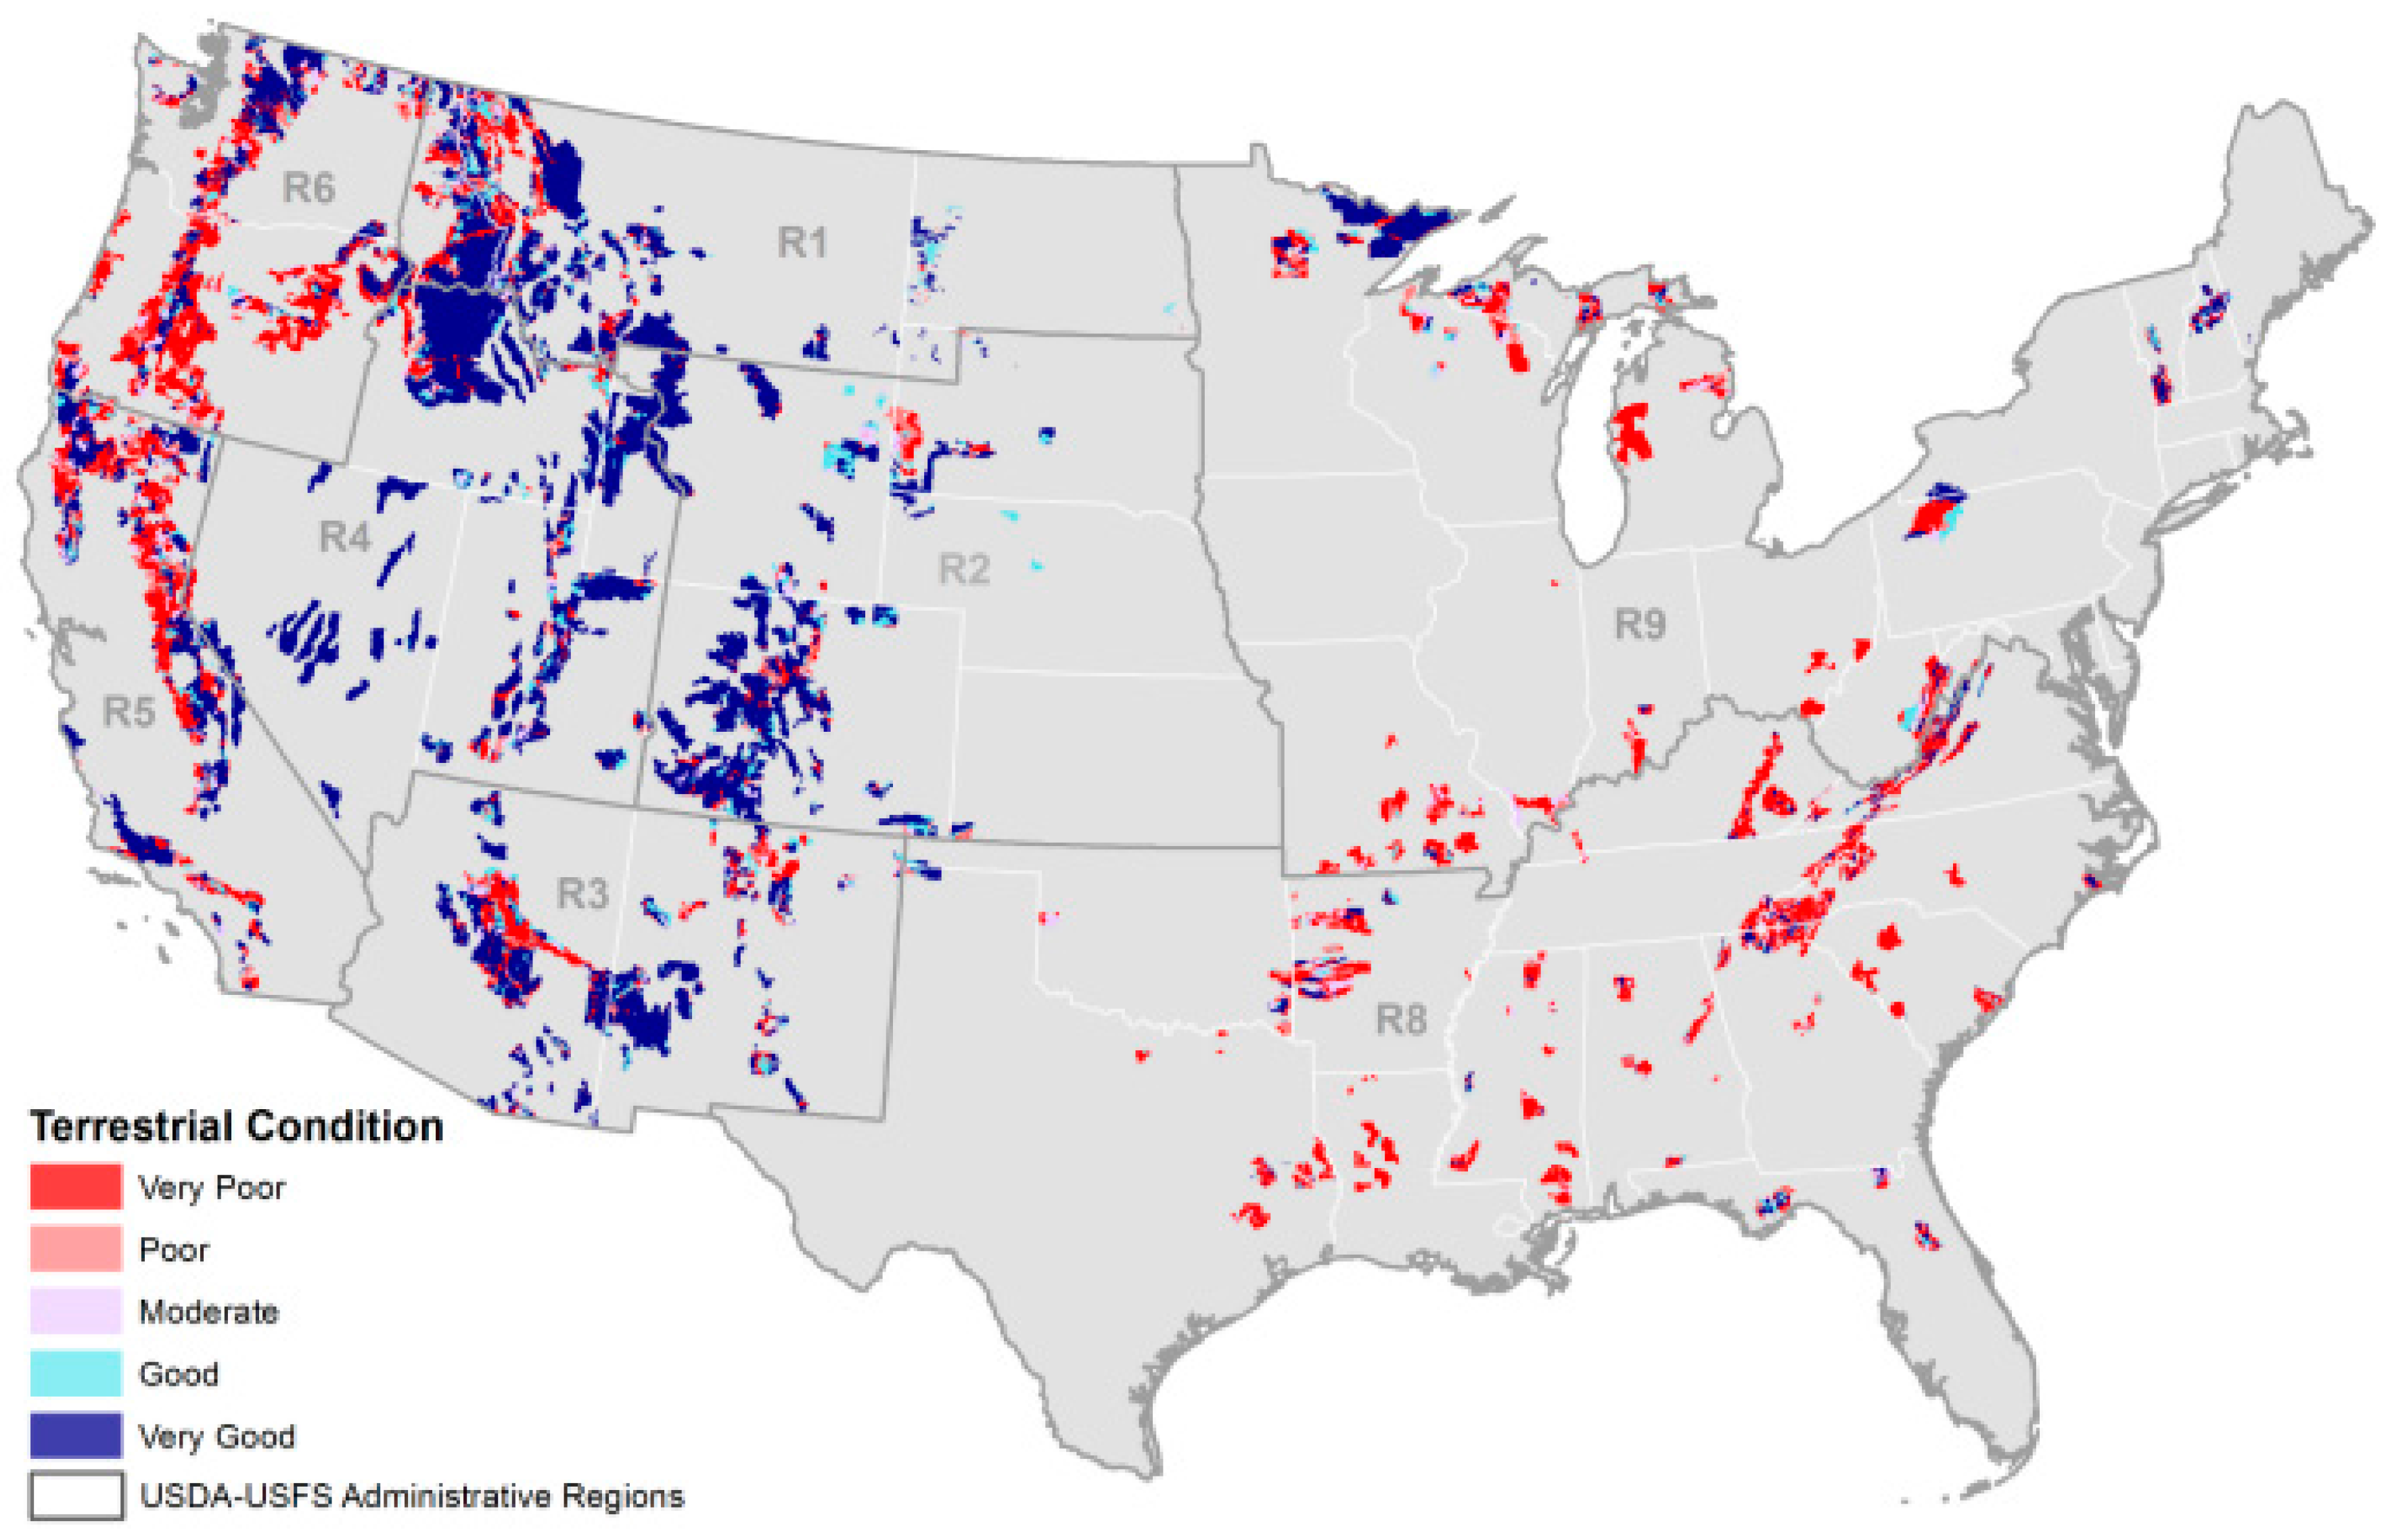
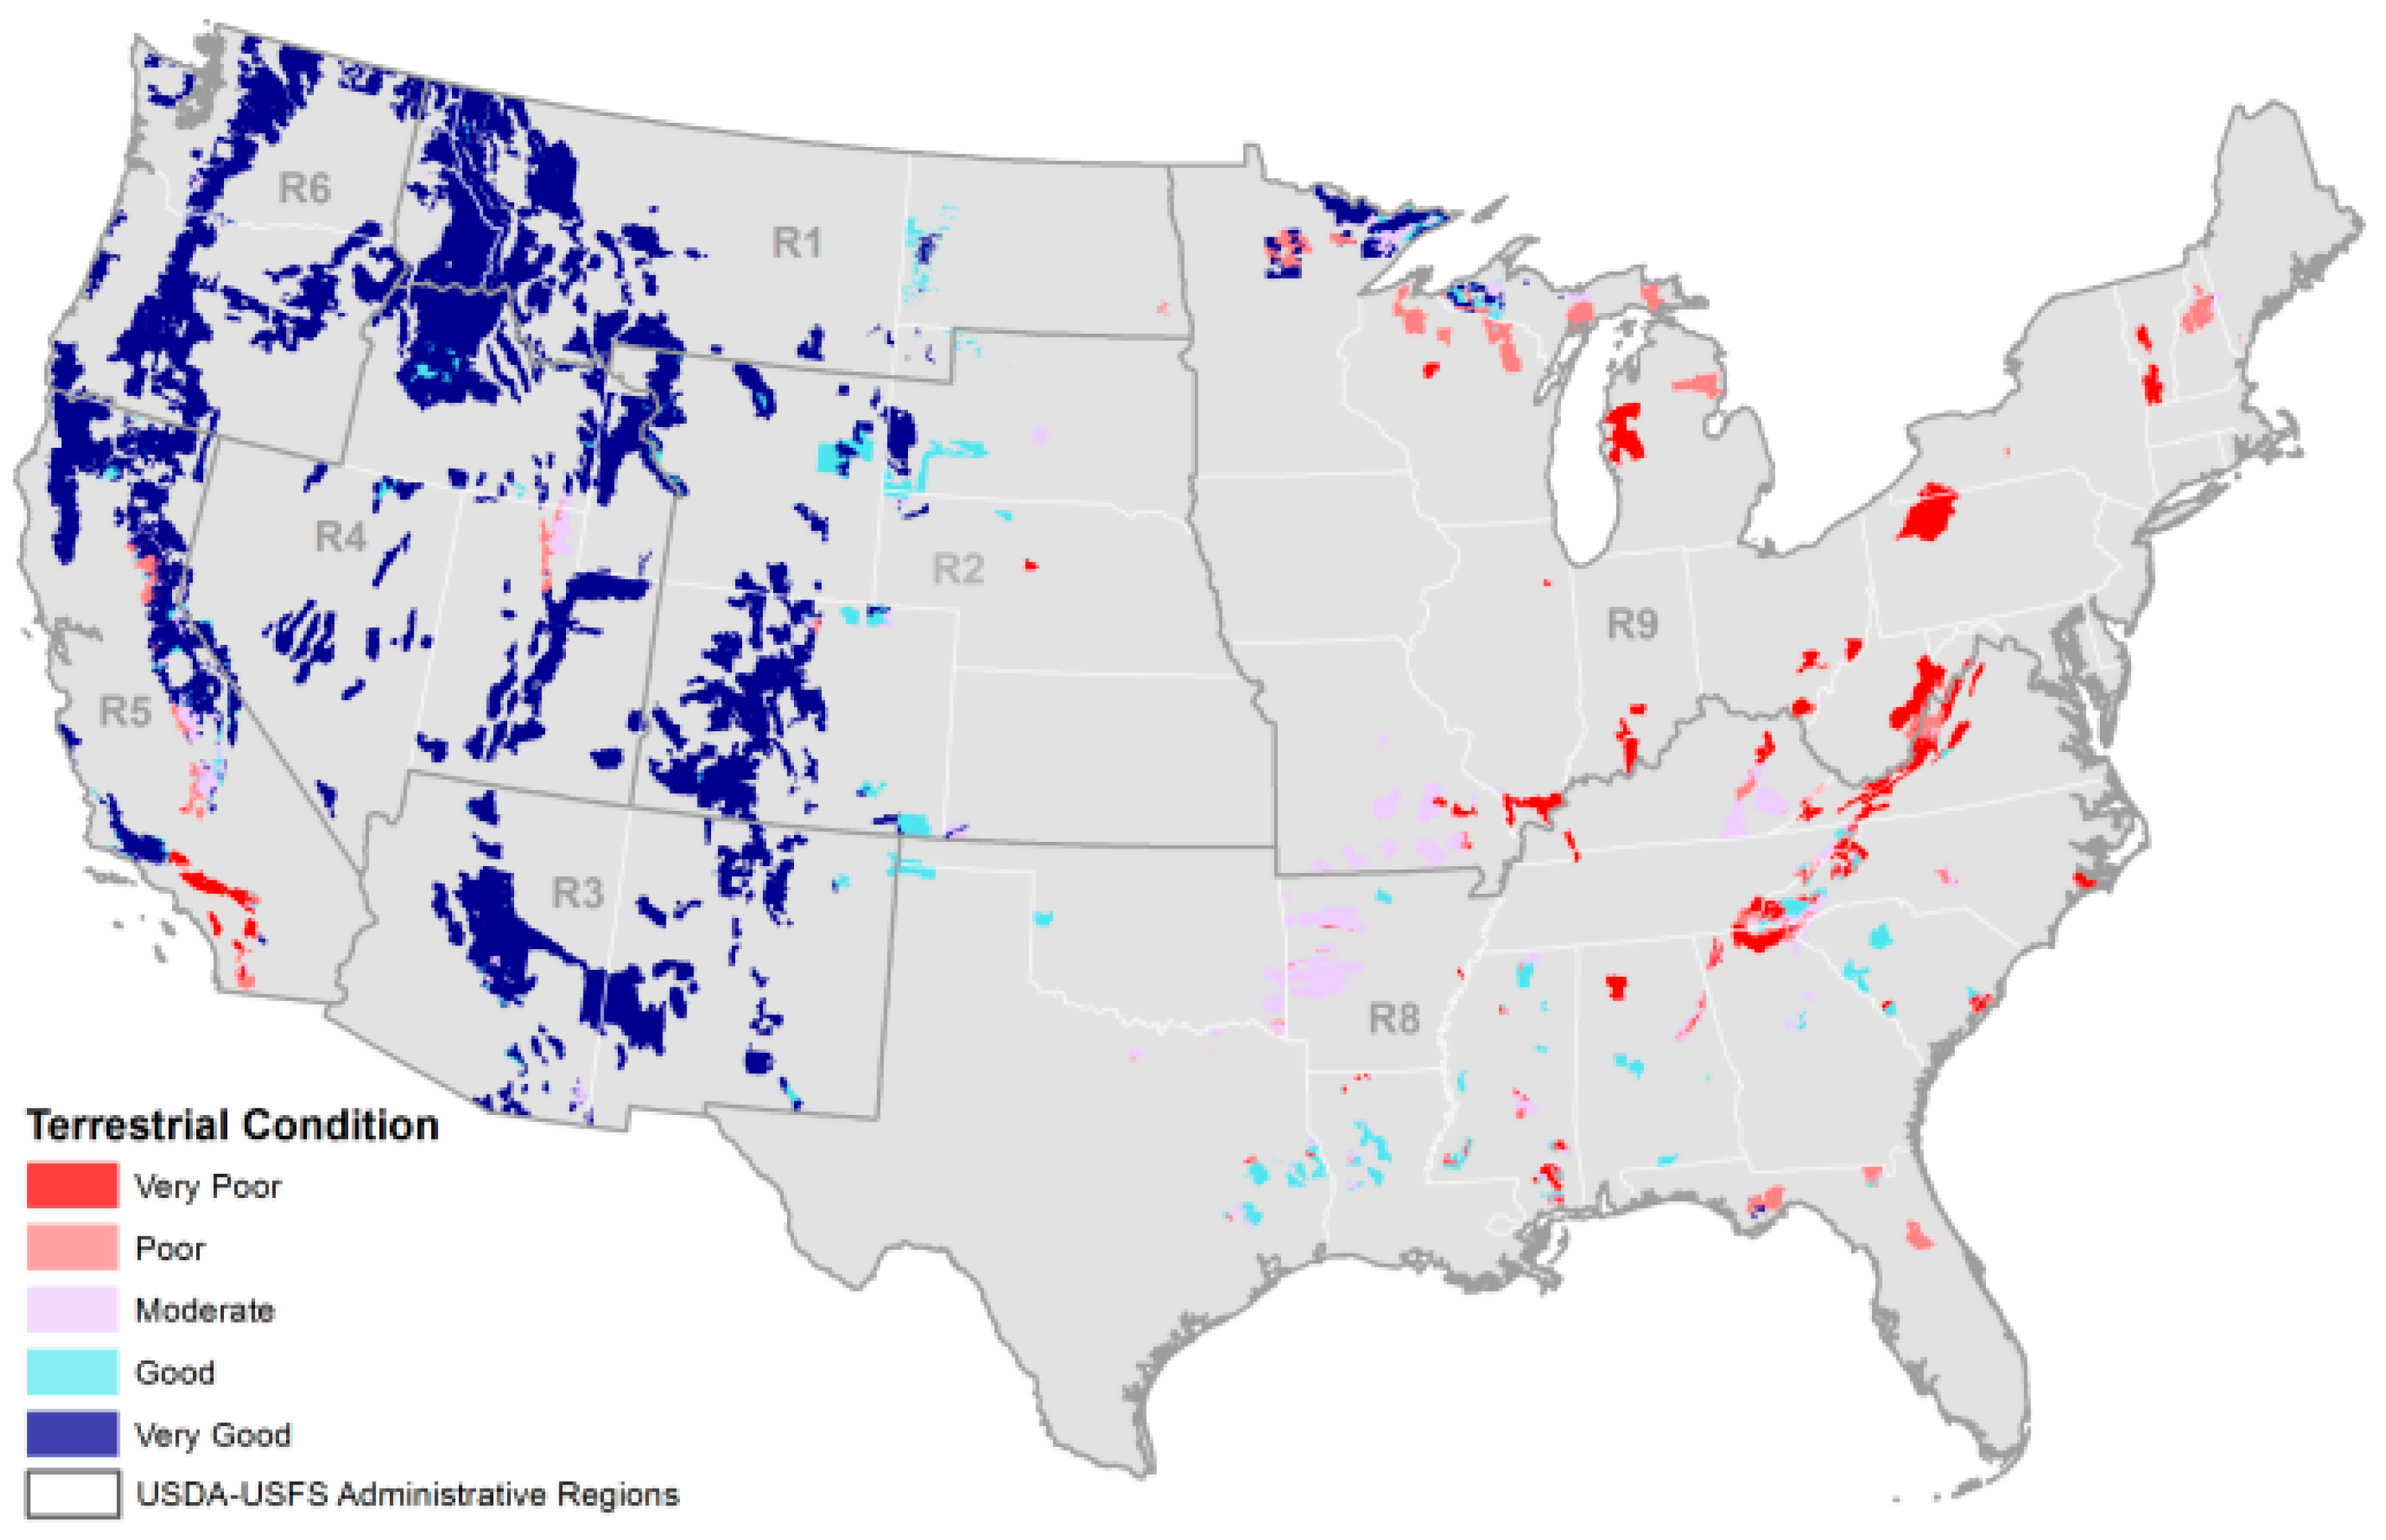
3. Results
4. Discussion
4.1. Customizing TCA for NFS Regions and National Forests
- National data presented in this study could be replaced with local data sources if local data sources were believed to be more accurate or more appropriate for the local context.
- Thresholds used to define fuzzy membership functions that interpret the TCA metrics (Table 2) could be revised to better reflect local conditions. A good example in this context is the interpretation of road densities with respect to their effects on wildlife habitat fragmentation.
- The national TCA logic includes several metrics related to uncharacteristic disturbances (indicator 6, Figure 2) including the spatial extent of mine impacts, landslides, blowdown, and flooding. Although logic topics and metrics associated with these impacts were designed into the NetWeaver logic model, they are turned off in the national analysis that we have presented because national data for these effects are not available. However, regions and forests could turn on one or more of these logic topics to include in their local assessments if they were considered important. Within the national TCA template, Region and Forest staff have two options for accounting for these ecosystem impacts: use of continuous measures (e.g., measured spatial extent) or use of ordinal rankings provided by specialists (see the HTML NetWeaver logic documentation included in the supplementary materials at the end of the paper).
- Finally, the basic logic structure of the national TCA template is easily edited in NetWeaver by Region and Forest staffs to customize the logic for local contexts. For example, some logic topics in the national TCA template may not be considered relevant in some local contexts, in which case they can be turned off. In addition, the combination of logic operations used to synthesize evidence for logical premises of a particular logic topic might be edited by changing logic operators, or reorganizing the logic structure of premises to alter how a set of premises contribute to the strength of evidence for their parent topic.
4.2. Additional Steps in Decision Support for Ecosystem Restoration and Maintenance
5. Conclusions
Supplementary Materials
Acknowledgments
Author Contributions
Conflicts of Interest
References
- Abatzoglou, J.T.; Willimas, P.A. Impact of anthropogenic climate change on wildfire across western US forests. Proc. Natl. Acad. Sci. USA 2016, 113, 11770–11775. [Google Scholar] [CrossRef] [PubMed]
- Westerling, A.L.R. Increasing western US forest wildfire activity: Sensitivity to changes in the timing of spring. Philos. Trans. R. Soc. B 2016, 371, 20150178. [Google Scholar] [CrossRef] [PubMed]
- Six, D.L.; Biber, E.; Long, E. Management for Mountain Pine Beetle Outbreak Suppression: Does Relevant Science Support Current Policy? Forests 2014, 5, 103–133. [Google Scholar] [CrossRef]
- FSM 2020: Ecological Restoration. Available online: https://www.fs.fed.us/dirindexhome/fsm/2000/wo_2020-2016-1.docx (accessed on 20 November 2017).
- Potyondy, J.P.; Geir, T.W. Watershed Condition Classification Technical Guide; FS-978; USDA Forest Service: Washington, DC, USA, 2011.
- Karr, J.R.; Dudley, D.R. Ecological perspective on water quality goals. Environ. Manag. 1981, 5, 55–68. [Google Scholar] [CrossRef]
- Andreasen, J.K.; O’Neill, R.V.; Noss, R.; Slosser, N.C. Considerations for the development of a terrestrial index of ecological interity. Ecol. Indic. 2001, 1, 21–35. [Google Scholar] [CrossRef]
- Ervin, J. Protected area assessments in perspective. BioScience 2003, 53, 819–822. [Google Scholar] [CrossRef]
- Timko, J.A.; Innes, J.L. Evaluating Ecological Integrity in National Parks: Case Studies in Canada and South Africa. Biol. Conserv. 2009, 142, 676–688. [Google Scholar] [CrossRef]
- Parrish, J.D.; Braun, D.P.; Unnasch, R.S. Are We Conserving What We Say We Are? Measuring Ecological Integrity within Protected Areas. BioScience 2003, 53, 851–860. [Google Scholar] [CrossRef]
- Heckmann, K.E.; Manley, P.N.; Schlesinger, M.D. Ecological integrity of remnant montane forests along an urban gradient in the Sierra Nevada Forest. Ecol. Manag. 2008, 255, 2453–2466. [Google Scholar] [CrossRef]
- Unnasch, R.S.; Braun, D.P.; Comer, P.J.; Eckert, G.E. The Ecological Integrity Assessment Framework: A Framework for Assessing the Ecological Integrity of Biological and Ecological Resources of the National Park System. Report to the National Park Service. 2008. Available online: http://www.natureserve.org/sites/default/files/publications/files/nps_ecological_integrity_framework.pdf (accessed on 1 November 2017).
- Cleland, D.T.; Avers, P.E.; McNab, W.H.; Jensen, M.E.; Bailey, R.G.; King, T.; Russell, W.E. National hierarchical framework of ecological units. In Ecosystem Management: Applications for Sustainable Forest and Wildlife Resources; Boyce, M.S., Haney, A., Eds.; Yale University Press: New Haven, CT, USA, 1997; pp. 181–200. [Google Scholar]
- Thrush, S.F.; Hewitt, J.E.; Dayton, P.K.; Coco, G.; Lohrer, A.M.; Norkko, A.; Norkko, J.; Chiantore, M. Forecasting the limits of resilience: Integrating empirical research with theory. Proc. R. Soc. B 2009, 276, 3209–3217. [Google Scholar] [CrossRef] [PubMed]
- Reynolds, K.M.; Rodriguez, S.; Bevans, K. User Guide for the Ecosystem Management Decision Support System, Version 3.0; Environmental Systems Research Institute: Redlands, CA, USA, 2003; 89p. [Google Scholar]
- Reynolds, K.M.; Hessburg, P.F.; Bourgeron, P.S. (Eds.) Making Transparent Environmental Management Decisions: Applications of the Ecosystem Management Decision Support System; Springer: Berlin, Germany, 2014. [Google Scholar]
- Ecosystem Management Decision Support System. Available online: https://en.wikipedia.org/wiki/Ecosystem_Management_Decision_Support (accessed on 20 August 2017).
- QGIS. Available online: http://qgis.org/en/site/ (accessed on 20 August 2017).
- MapWindow. Available online: http://www.mapwindow.org/ (accessed 20 August 2017).
- Miller, B.J.; Saunders, M.C. The NetWeaver Reference Manual; Pennsylvania State University: College Park, PA, USA, 2002; p. 55. [Google Scholar]
- Saaty, T.L. Multicriteria Decision Making: The Analytical Hierarchy Process; RWS Publications: Pittsburgh, PA, USA, 1992; p. 321. [Google Scholar]
- Saaty, T.L. Fundamentals of Decision Making and Priority Theory with the Analytical Hierarchy Process; RWS Publications: Pittsburgh, PA, USA, 1994; p. 527. [Google Scholar]
- Krist, F.J.; Ellenwood, J.R.; Woods, M.E.; McMahan, A.J.; Cowardin, J.P.; Ryerson, D.E.; Sapio, F.; Zweifler, M.O.; Romero, S.A. 2013–2017 National Insect and Disease Forest Risk Assessment. Available online: https://www.fs.fed.us/foresthealth/technology/pdfs/2012_RiskMap_Report_web.pdf (accessed on 1 November 2017).
- Zadeh, L.A. The concept of a linguistic variable and its application to approximate reasoning. Part I. Inf. Sci. 1975, 8, 199–249. [Google Scholar] [CrossRef]
- Zadeh, L.A. The concept of a linguistic variable and its application to approximate reasoning. Part II. Inf. Sci. 1975, 8, 301–357. [Google Scholar] [CrossRef]
- Zadeh, L.A. The concept of a linguistic variable and its application to approximate reasoning. Part III. Inf. Sci. 1976, 9, 43–80. [Google Scholar] [CrossRef]
- von zur Gathen, J.; Gerhard, J. Modern Computer Algebra; Cambridge University Press: Cambridge, UK, 2003; p. 787. [Google Scholar]
- Collins, B.M.; Everett, R.G.; Stephens, S.L. Impacts of fire exclusion and recent managed fire on forest structure in old growth Sierra Nevada mixed-conifer forests. Ecosphere 2011, 2, 1–14. [Google Scholar] [CrossRef]
- Naficy, C.; Sala, A.; Keeling, E.G.; Graham, J.; DeLuca, T.H. Interactive effects of historical logging and fire exclusion on ponderosa pine forest structure in the northern Rockies. Ecol. Appl. 2010, 20, 1851–1864. [Google Scholar] [CrossRef] [PubMed]
- Margulis, S.A.; Cortes, G.; Girotto, M.; Huning, L.S.; Dongyue, L.; Durand, M. Characterizing the extreme 2015 snowpack deficit in the Sierra Nevada (USA) and the implications for drought recovery. Geophys. Res. Lett. 2016, 43, 6341–6349. [Google Scholar] [CrossRef]
- Bentz, B.J.; Regniere, J.; Fettig, C.J.; Hansen, E.M.; Hayes, J.L.; Hicke, J.A.; Kelsey, R.G.; Negron, J.F.; Seybold, S.J. Climate change and bark beetles of the western United States and Canada: Direct and indirect effects. Bioscience 2010, 60, 602–613. [Google Scholar] [CrossRef]
- Reynolds, K.M.; Murphy, P.J.; Paplanus, S. Toward geodesign for watershed restoration on the Fremont-Winema National Forest, Pacific Northwest, USA. Sustainability 2017, 9, 678. [Google Scholar] [CrossRef]
- Henrion, M.; Breese, J.S.; Horvitz, E.J. Decision analysis and expert systems. AI Mag. 1991, 12, 64–91. [Google Scholar]


| Indicator | Metric 1 | Data Source |
|---|---|---|
| Tree mortality | Mortality due to Insects and Pathogens Data unit: Binary of presence or absence (Ordinal) TCA metric: percent area | National forest pest conditions database produced by USFS forest health technology enterprise team (FHTET) https://foresthealth.fs.usda.gov/portal Raster data at the resolution of 240 m |
| Terrestrial invasive species | Local Data; Occurrence | NRIS TESP Data are incomplete and not available yet, so this data source is not included in the analysis, although the model includes a placeholder for it. |
| Road density | Highway road density Paved road density Light duty road Density Unimproved road density Data unit: mi/sq. mi. (Numeric) TCA metric: mi/sq. mi. (Numeric) | USFS FSTOPO transportation dataset developed by USFS geospatial technology and applications center (GTAC) http://data.fs.usda.gov/geodata/vector/index.php Vector line features |
| Climate exposure | Temperature: Mean seasonal temperatures Spring, summer, fall, winter Data unit: Degrees Fahrenheit (Numeric) TCA metric: Degrees F difference Precipitation: Total seasonal precipitations Spring, summer, fall, winter % precipitations Spring, summer, fall, winter Data unit: Inches (Numeric) TCA metric: Inches difference | PRISM Climatological Data produced by PRISM Climate Group of Oregon State University with
Parameter elevation Regression on Independent Slopes Model http://prism.oregonstate.edu/ Raster data mostly at the resolution of 4 km |
| Air pollution | Terrestrial acidification (Exceedance, CAL); Data unit: Ranks of good, moderate, or poor (Ordinal) TCA metric: Ranks of good, moderate, or poor Terrestrial eutrophication (N) Data unit: kg/ha/yr (Numeric) TCA metric: kg/ha/yr (Numeric) | Terrestrial acidification database produced by USFS southern global change program, using the simple mass balance equation (SMBE) http://fsweb.wo.fs.fed.us/wfw/airquality/criticalloads.html Raster data are at the resolution of 1 km2 Terrestrial eutrophication database generated by EPA’s community multiscale air quality (CMAQ) modeling system https://www.epa.gov/air-research/community-multi-scale-air-quality-cmaq-modeling-system-air-quality-management Raster data are at the resolution of 120 m (resampled from 12 km) |
| Catastrophic disturbance | Uncharacteristic fire severity Uncharacteristic fire frequency Data unit: Binary of uncharacteristic and other (Ordinal) TCA metric: Percent area | Database of uncharacteristically severe wildfires derived from (1) Monitoring trends in burn severity (MTBS) data by USGS and USFS and (2) LANDFIRE data of percent low severity fire and percent mixed-severity Fire http://mtbs.gov https://landfire.gov/fireregime.php Raster data at the resolution of 30 m Database of uncharacteristically frequent fire derived from a combination of (1) MTBS as the current condition and (2) Mean fire return interval (MFRI) of LANDFIRE as the reference condition. |
| Wildfire potential | Uncharacteristic fuel buildup Data unit: Binary of high risk or other TCA metric: Percent area | Wildfire hazard potential (WHP) database produced by USFS Fire Modeling Institute http://www.firelab.org/project/wildfire-hazard-potential Raster data at the resolution of 270 m |
| Insect and pathogen risk | Potential uncharacteristic mortality Data unit: Binary of presence or absence (Ordinal) TCA metric: Percent area | National insect and disease risk map (NIDRM) produced by USFS forest health protection (FHP) http://www.fs.fed.us/foresthealth/technology/nidrm. shtmlRaster data at the resolution of 270 m |
| Vegetation departure | Vegetation departure index Data unit: 0–100% (Numeric) TCA metric: Mean | Vegetation departure index (VDEP) produced by LANDFIRE http://www.landfire.gov Raster data at the resolution of 30 m |
| Ecological process departure | Missed Fire Cycle TCA metric: Mean | Mean fire return interval (MFRI) produced by LANDFIRE http://www.landfire.gov |
| Indicator Number | TCA Indicator | Associated Metrics | Threshold for No Evidence 1 | Threshold for Full Evidence 2 | Unit |
|---|---|---|---|---|---|
| 1 | Tree mortality | Mortality due to insects and pathogens | 25.0 | 5.0 | % Land-type associations (LTA) area |
| 3 | Road density | Highway | 0.3 | 0.1 | mile/square mile |
| Paved roads | 0.3 | 0.1 | mile/square mile | ||
| Light duty roads | 1.5 | 0.5 | mile/square mile | ||
| Unimproved roads | 2.5 | 1.0 | mile/square mile | ||
| 4 | Climate exposure | Spring temperature | 2.0 | 0.0 | °F changed |
| Summer temperature | 2.0 | 0.0 | °F changed | ||
| Fall temperature | 2.0 | 0.0 | °F changed | ||
| Winter temperature | 2.0 | 0.0 | °F changed | ||
| Spring precipitation | −1.0 | 0.0 | inch changed | ||
| Summer precipitation | −1.0 | 0.0 | inch changed | ||
| Fall precipitation | −1.0 | 0.0 | inch changed | ||
| Winter precipitation | −1.0 | 0.0 | inch changed | ||
| Spring precipitation (%) | −10.0 | 0.0 | % changed | ||
| Summer precipitation (%) | −10.0 | 0.0 | % changed | ||
| Fall precipitation (%) | −10.0 | 0.0 | % changed | ||
| Winter precipitation (%) | −10.0 | 0.0 | % changed | ||
| 5 | Air pollution | Terrestrial acidification | poor | good | rank |
| Terrestrial eutrophication (N) | 10.0 | 1.6 | kg/ha/yr | ||
| 6 | Catastrophic disturbance | Uncharacteristic fire severity | 5.0 | 0.0 | % LTA area |
| Uncharacteristic fire frequency | 1.0 | 1.5 | dimensionless | ||
| 7 | Wildfire potential | Uncharacteristic fuel buildup | 66.0 | 20.0 | % LTA area |
| 8 | Insect and pathogen risk | Potential uncharacteristic mortality | 50.0 | 10.0 | % LTA area |
| 9 | Vegetation departure | Vegetation departure index | 67.0 | 43.0 | % area departed |
| 10 | Ecological process departure | Missed fire cycle | 35.0 | 200.0 | year departed |
| Terrestrial Condition 1 | Frequency | Hectares | Percent of National Forest System Lands |
|---|---|---|---|
| Very Good | 1618 | 15,862,119 | 18.41 |
| Good | 3962 | 31,896,498 | 37.02 |
| Moderate | 1736 | 15,942,480 | 18.50 |
| Poor | 1226 | 9,785,574 | 11.36 |
| Very Poor | 1491 | 12,669,501 | 14.71 |
| Region | Terrestrial Condition | Hectares | Percent Regional | Region | Terrestrial Condition | Hectares | Percent Regional |
|---|---|---|---|---|---|---|---|
| 1 | Very Good | 1,065,169 | 9.46 | 5 | Very Good | 448,620 | 4.74 |
| 1 | Good | 2,547,906 | 22.62 | 5 | Good | 1,894,951 | 20.01 |
| 1 | Moderate | 1,711,470 | 15.20 | 5 | Moderate | 3,263,593 | 34.46 |
| 1 | Poor | 1,497,393 | 13.30 | 5 | Poor | 2,162,259 | 22.83 |
| 1 | Very Poor | 4,439,859 | 39.42 | 5 | Very Poor | 1,702,486 | 17.97 |
| 2 | Very Good | 3,540,636 | 31.51 | 6 | Very Good | 2,295,182 | 20.36 |
| 2 | Good | 3,213,151 | 28.60 | 6 | Good | 2,573,660 | 22.83 |
| 2 | Moderate | 1,157,275 | 10.30 | 6 | Moderate | 2,514,413 | 22.30 |
| 2 | Poor | 874,659 | 7.79 | 6 | Poor | 2,337,587 | 20.73 |
| 2 | Very Poor | 2,449,247 | 21.80 | 6 | Very Poor | 1,554,411 | 13.79 |
| 3 | Very Good | 1,838,627 | 19.76 | 8 | Very Good | 550,467 | 5.36 |
| 3 | Good | 3,777,133 | 40.59 | 8 | Good | 6,794,328 | 66.13 |
| 3 | Moderate | 2,236,714 | 24.03 | 8 | Moderate | 1,860,729 | 18.11 |
| 3 | Poor | 834,357 | 8.97 | 8 | Poor | 1,060,174 | 10.32 |
| 3 | Very Poor | 619,630 | 6.66 | 8 | Very Poor | 8379 | 0.08 |
| 4 | Very Good | 2,805,318 | 20.08 | 9 | Very Good | 3,318,101 | 35.44 |
| 4 | Good | 6,056,478 | 43.35 | 9 | Good | 5,038,891 | 53.82 |
| 4 | Moderate | 2,741,347 | 19.62 | 9 | Moderate | 456,939 | 4.88 |
| 4 | Poor | 634,118 | 4.54 | 9 | Poor | 385,028 | 4.11 |
| 4 | Very Poor | 1,732,351 | 12.40 | 9 | Very Poor | 163,139 | 1.74 |
© 2017 by the authors. Licensee MDPI, Basel, Switzerland. This article is an open access article distributed under the terms and conditions of the Creative Commons Attribution (CC BY) license (http://creativecommons.org/licenses/by/4.0/).
Share and Cite
Cleland, D.; Reynolds, K.; Vaughan, R.; Schrader, B.; Li, H.; Laing, L. Terrestrial Condition Assessment for National Forests of the USDA Forest Service in the Continental US. Sustainability 2017, 9, 2144. https://doi.org/10.3390/su9112144
Cleland D, Reynolds K, Vaughan R, Schrader B, Li H, Laing L. Terrestrial Condition Assessment for National Forests of the USDA Forest Service in the Continental US. Sustainability. 2017; 9(11):2144. https://doi.org/10.3390/su9112144
Chicago/Turabian StyleCleland, David, Keith Reynolds, Robert Vaughan, Barbara Schrader, Harbin Li, and Larry Laing. 2017. "Terrestrial Condition Assessment for National Forests of the USDA Forest Service in the Continental US" Sustainability 9, no. 11: 2144. https://doi.org/10.3390/su9112144