Cost Based Value Stream Mapping as a Sustainable Construction Tool for Underground Pipeline Construction Projects
Abstract
:1. Introduction
2. Literature Review
2.1. Value Stream Mapping Principle
2.2. Value Stream Mapping and Sustainability in Construction
2.3. Line of Balance in Lean Construction
3. Methodology
4. Data Characteristics
5. Data Analysis for Current State of VSM
5.1. Cost Based Current State of VSM
5.2. Suggested Improvement and Future State of VSM
- -
- Vertical axis plots cumulative progress of number of joints completed in the project. Horizontal axis plots time and sloping lines represent rate of production i.e., number of joints per day.
- -
- To complete the project and minimize the waste and lead time, the crews are distributed as following:
- (1)
- Two crews for excavation and final backfilling. Each crew consists three civil workers under one supervisor.
- (2)
- One crew for pipes and fittings laying (three pipe fitters)
- (3)
- One crew for fit-up and welding (four welders and three helpers)
- (4)
- One crew for NDT testing (two NDT technicians)
- (5)
- One crew for painting (three painters)
- (6)
- One crew for hydro-testing (four mechanical/pipe fitters).
5.3. Proposed Future State of VSM
- -
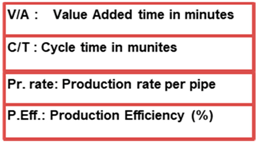
- The lead time was calculated in current state 8545 min based on construction of one joint. While, the total lead time in the future state is 5922 min. There is an improvement of 30.7%.
- -
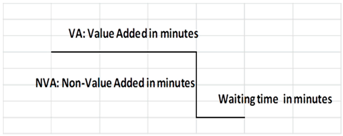
- The value-added time in current state is 1592 min, and it is improved by 43.3% as 903 min.
- -
- With application of VSM, the non-value-added time is reduced by 27.8%. The NVA was reduced from 5019 min to 6953 min.
- -
- The comparison of production capacity for current and future states is based on one joint and one pipe for current and future states of VSM.
5.4. Cost Based Future State of VSM
6. Discussion of Results
7. Conclusions and Recommendations
Author Contributions
Conflicts of Interest
Appendix A
| Symbol/Icon | Meaning and Description |
|---|---|
 | Customer/Supplier Icon: represents the Supplier when in the upper left, customer when in the upper right, the usual end point for material |
 | Manpower Icon: represents skilled manpower. Shows the number of manpower required to process the VSM family at a particular workstation |
 | Dedicated Activity flow Icon: a process, operation, machine or department, through which material flows. Represents one department with a continuous, internal fixed flow. |
 | Data Box Icon: it goes under other icons that have significant information/data required for analysing and observing the system. |
 | Timeline Icon: shows value added times (Cycle Times) and non-value added (wait) times. Use this to calculate Lead Time and Total Cycle Time. |
 | Inventory Icons: show inventory and waiting time between two activities/processes. |
 | Electronic Info Icon: represents electronic flow such as electronic data interchange, the Internet, indicate the frequency of information/data interchange. |
 | Manual Information Icon: A straight, thin arrow shows general flow of information from memos, reports, or conversation. Frequency and other notes may be relevant. |
 | FIFO Lane Icon: First-In-First-Out inventory. Use this icon when processes are connected with a FIFO system that limits input. |
 | Push Arrow Icon: represents the “pushing” of material from one activity to the next activity. |
 | Kaizen Burst Icon: used to highlight improvement needs and plan kaizen workshops at specific activities that are critical to achieving the Future State Map of the value stream. |
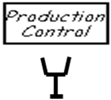
 | Kanban Post Icon: a location where kanban signals reside for pickup. Often used by a central production scheduling or control production department. |
 | Withdrawal Kanban Icon: represents a device that instructs a material handler to transfer parts from a supermarket to the receiving process. He goes to the supermarket and withdraws the necessary items. |
 | Supermarket Icon: an inventory “supermarket” (kanban stockpoint) with a"Pull" icon that indicates physical removal. |
 | Production Kanban Icon: triggers production of a predefined number of parts. Signals a supplying process to provide parts to a downstream process. |
 | Load Leveling Icon: a tool to batch kanbans in order to level the production volume and mix over a period of time. |
References
- Carvalho, A.C.V.; Granja, A.D.; Silva, V.G. A Systematic Literature Review on Integrative Lean and Sustainability Synergies over a Building’s Lifecycle. Sustainability 2017, 9, 1156. [Google Scholar] [CrossRef]
- Rother, M.; Shook, J.; Womack, J.; Jones, D. Learning to See: Value Stream Mapping to Add Value and Eliminate MUDA, 3rd ed.; Lean Enterprise Institute: Cambridge, MA, USA, 2003. [Google Scholar]
- Yun, S.; Jung, W. Benchmarking Sustainability Practices Use throughout Industrial Construction Project Delivery. Sustainability 2017, 9, 1007. [Google Scholar] [CrossRef]
- Wenchi, S.; Jun, W.; Peng, W.; Xiangyu, W.; Heap-Yih, C. A cross-sector review on the use of Value Stream Mapping. Int. J. Prod. Res. 2017, 55. [Google Scholar] [CrossRef]
- Martin, K.; Osterling, M. Value Stream Mapping: How to Visualize Work and Align Leadership for Organizational Transformation; McGraw-Hill: New York, NY, USA, 2013. [Google Scholar]
- Schmidtke, D.; Heiser, U.; Hinrichsen, O. A Simulation-enhanced Value Stream Mapping Approach for Optimisation of Complex Production Environments. Int. J. Prod. Res. 2014, 52, 6146–6160. [Google Scholar] [CrossRef]
- Sabaghi, M.; Rostamzadeh, R.; Mascle, C. Kanban and value stream mapping analysis in lean manufacturing philosophy via simulation: A plastic fabrication (case study). Int. J. Serv. Oper. Manag. 2015, 20, 118–140. [Google Scholar] [CrossRef]
- Suarez-Barraza, M.F.; Miguel-Davila, J.; Vasquez-García, C.F. Supply chain value stream mapping: A new tool of operation management. Int. J. Q. Reliab. Manag. 2016, 33, 518–534. [Google Scholar] [CrossRef]
- Yuvamitra, K.; Lee, J.; Dong, K. Value Stream Mapping of Rope Manufacturing: A Case Study. Int. J. Sustain. Eng. 2017, 2017. [Google Scholar] [CrossRef]
- Tyagi, S.; Choudhary, A.; Cai, X.; Yang, K. Value Stream Mapping to reduce the lead-time of a product development process. Int. J. Prod. Econ. 2015, 160, 202–212. [Google Scholar] [CrossRef]
- Wang, T.; Zhang, Q.; Chong, H.; Wang, X. Integrated Supplier Selection Framework in a Resilient Construction Supply Chain: An Approach via Analytic Hierarchy Process (AHP) and Grey Relational Analysis (GRA). Sustainability 2017, 9, 289. [Google Scholar] [CrossRef]
- Jeong, W.; Chang, S.; Son, J.; Yi, J. BIM-Integrated Construction Operation Simulation for Just-In-Time Production Management. Sustainability 2016, 8, 1106. [Google Scholar] [CrossRef]
- Lee, D.; Kim, S.; Kim, S. Development of Hybrid Model for Estimating Construction Waste for Multifamily Residential Buildings Using Artificial Neural Networks and Ant Colony Optimization. Sustainability 2016, 8, 870. [Google Scholar] [CrossRef]
- Jia, S.; Yuan, Q.; Lv, J.; Liu, Y.; Ren, D.; Zhang, Z. Therblig-embedded Value Stream Mapping method for lean energy machining. Energy 2017, 138, 1081–1098. [Google Scholar] [CrossRef]
- Chien-Liang, L.; Chen-Huu, J. Exploring Interface Problems in Taiwan’s Construction Projects Using Structural Equation Modeling. Sustainability 2017, 9, 822. [Google Scholar] [CrossRef]
- Pasqualini, F.; Zawislak, P.A. Value Stream Mapping in construction: A case study in a Brazilian construction company. In Proceedings of the 13th Annual Conference of the International Group for Lean Construction, Sydney, Australia, 19–21 July 2005; pp. 117–125. [Google Scholar]
- Yu, H.; Tweed, T.; Al-Hussein, M.; Nasseri, R. Development of lean model for house construction using Value Stream Mapping. J. Constr. Eng. Manag. 2009, 135, 782–790. [Google Scholar] [CrossRef]
- Shou, W.; Wang, J.; Chong, H.Y.; Wang, X. Examining the Critical Success Factors in the Adoption of Value Stream Mapping. In Proceedings of the 24th Annual Conference of the International Group for Lean Construction (IGLC), Boston, MA, USA, 20–22 July 2016; pp. 93–102. [Google Scholar]
- Alvandi, S.; Li, W.; Schönemann, M.; Kara, S.; Herrmann, C. Economic and Environmental Value Stream Map (E2VSM) Simulation for Multiproduct Manufacturing Systems. Int. J. Sustain. Eng. 2016, 9, 354–362. [Google Scholar] [CrossRef]
- Dinesh, S.; Nitin, S.; Pratik, D. Application of Value Stream Mapping (VSM) for lean and cycle time reduction in complex production environments: A case study. Prod. Plan. Control 2017, 28, 398–419. [Google Scholar] [CrossRef]
- Rosenbaum, S.; Toledo, M.; González, V. Improving environmental and production performance in construction projects using Value-Stream Mapping: Case study. J. Constr. Manag. 2014, 140. [Google Scholar] [CrossRef]
- Mok, K.L.; Sin, E.; Han, S.H.; Jang, W. Value stream mapping and simulation as integrated lean approach tool for improving productivity in the installation of natural gas pipes. In Proceedings of the Construction, Building and Real Estate Research Conference of the Royal Institution of Chartered Surveyors (COBRA 2010), Paris, France, 2–3 September 2010; ISBN 978-1-84219-619-9. [Google Scholar]


| Construction Activity | Cycle Time (Minutes) |
|---|---|
| Trench Excavation | 193.0 |
| Laying Pipes & Fittings | 130.0 |
| Fit-up | 128.0 |
| Welding | 600.0 |
| NDT Test | 320.0 |
| Partial Backfilling | 48.0 |
| Hydro-testing | 181.0 |
| Painting | 179.0 |
| Final Backfilling | 601.0 |
| Current State of VSM | Employee Cost ($) | Production Support Cost ($) | Maintenance Cost ($) | Machine/Equipment Cost ($) | Other Costs ($) | Total Cost ($) |
|---|---|---|---|---|---|---|
| Trench Excavation | 1306 | 250 | 550 | 1096 | 3202 | |
| Pipe & fittings laying | 583 | 286 | 389 | 603 | 1861 | |
| Fit-up | 755 | 250 | 1005 | |||
| Welding | 617 | 500 | 150 | 274 | 300 | 1841 |
| NDT | 20 | 350 | 370 | |||
| Partial Backfilling | 1062 | 150 | 822 | 2034 | ||
| Hydro-testing | 754 | 145 | 130 | 250 | 1279 | |
| Painting | 617 | 250 | 95 | 962 | ||
| Final Backfilling | 822 | 250 | 255 | 1096 | 2423 | |
| 4500 (Construction Managers and Site Engineers) | 4500 | |||||
| Total | 19,477 |
| Construction Activity | Current State | Future State | Improvement |
|---|---|---|---|
| Lead Time (min) | 8545 | 5922 | 30.7% |
| Value Added (min) | 1592 | 903 | 43.3% |
| Non-Value added (min) | 6953 | 5019 | 27.8% |
| Production capacity | 1 joint/1 pipe | 1 joint/1 pipe |
| Future State of VSM | Employee Cost ($) | Production Support Cost ($) | Maintenance Cost ($) | Machine/Equipment Cost ($) | Other Costs ($) | Total Cost ($) |
|---|---|---|---|---|---|---|
| Trench Excavation | 1424.7 | 250 | 550 | 310.5 | 2535.2 | |
| Pipe & fittings laying | 602.7 | 286 | 389 | 125.4 | 1403.1 | |
| Fit-up | ||||||
| Welding | 1095.9 | 500 | 150 | 82.2 | 300 | 2128.1 |
| NDT | 20 | 350 | 370 | |||
| Partial Backfilling | ||||||
| Hydro-testing | 754 | 145 | 130 | 250 | 1279 | |
| Painting | 617 | 250 | 95 | 962 | ||
| Final Backfilling | 1424.7 | 250 | 255 | 310.5 | 2240.2 | |
| 4500 (Construction Managers and Site Engineers) | 4500 | |||||
| Total | 15,417.6 |
© 2017 by the authors. Licensee MDPI, Basel, Switzerland. This article is an open access article distributed under the terms and conditions of the Creative Commons Attribution (CC BY) license (http://creativecommons.org/licenses/by/4.0/).
Share and Cite
Gunduz, M.; Fahmi Naser, A. Cost Based Value Stream Mapping as a Sustainable Construction Tool for Underground Pipeline Construction Projects. Sustainability 2017, 9, 2184. https://doi.org/10.3390/su9122184
Gunduz M, Fahmi Naser A. Cost Based Value Stream Mapping as a Sustainable Construction Tool for Underground Pipeline Construction Projects. Sustainability. 2017; 9(12):2184. https://doi.org/10.3390/su9122184
Chicago/Turabian StyleGunduz, Murat, and Ayman Fahmi Naser. 2017. "Cost Based Value Stream Mapping as a Sustainable Construction Tool for Underground Pipeline Construction Projects" Sustainability 9, no. 12: 2184. https://doi.org/10.3390/su9122184
APA StyleGunduz, M., & Fahmi Naser, A. (2017). Cost Based Value Stream Mapping as a Sustainable Construction Tool for Underground Pipeline Construction Projects. Sustainability, 9(12), 2184. https://doi.org/10.3390/su9122184


