The Functional Structure Convergence of China’s Coastal Ports

Abstract
:1. Introduction
2. Data and Methods
2.1. Data and Samples
2.2. Definition and Evaluation Model
3. Similarity of Adjacent Ports in a Port Group
3.1. Similarities in the Outbound Structure of Adjacent Ports
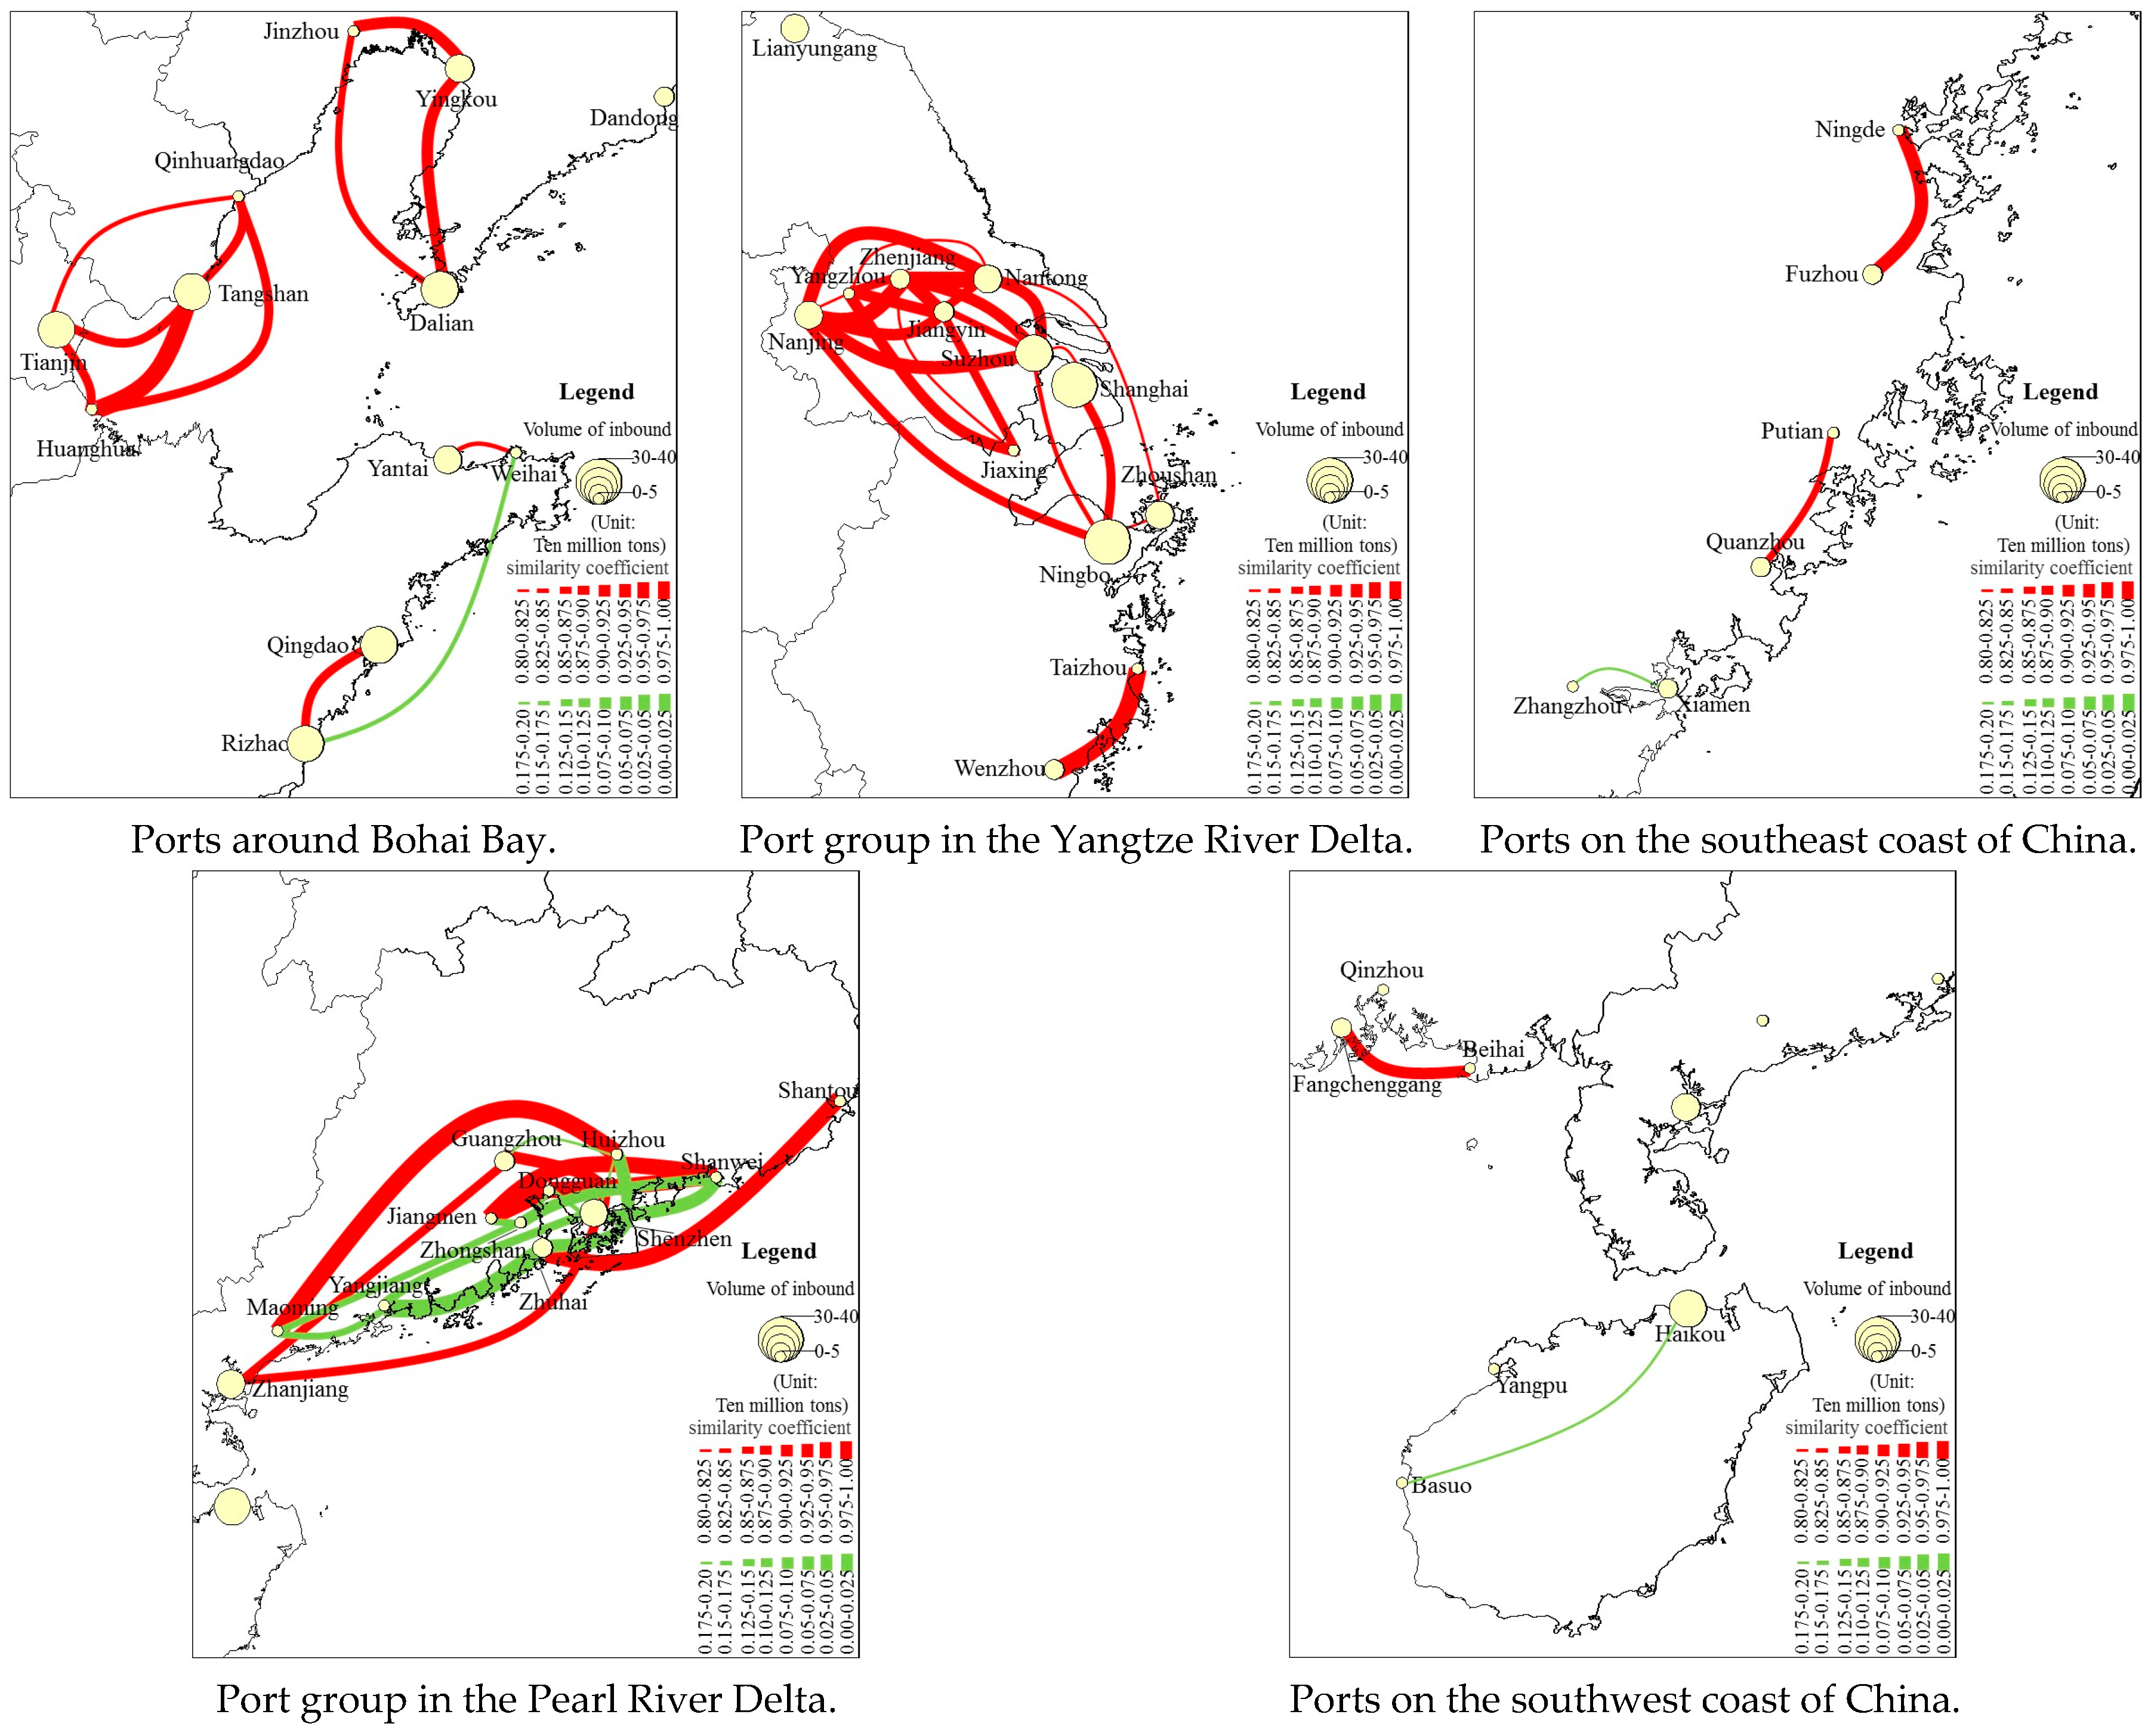
3.2. Similarities in the Inbound Structure of Adjacent Ports
3.3. Comparison of the Similarity of Inbound and Outbound Structures between Port Groups
4. Similarity of Hub Ports in China
5. Discussion
6. Conclusions
- (1)
- There were many adjacent ports that had a similar cargo structure and the phenomenon of functional convergence between these ports was serious. For the outbound structure, typical pairs of similar ports were Qinhuangdao and Huanghua, Taizhou and Wenzhou, Shenzhen and Zhanjiang, Zhongshan and Jiangmen, and Dalian and Yingkou. For the inbound structure, the most serious regions of functional convergence were Huanghua and Tangshan, Taizhou and Wenzhou, and Huizhou and Maoming. Each pair of similar ports handled the same main cargoes and there was no significant difference in the proportions handled.
- (2)
- From the spatial distribution, ports around Bohai Bay were the most serious region of functional convergence in terms of outbound cargo. This reflected coal transportation from the three western districts of the Three Provinces Region. In terms of the inbound structure, the functional convergence of the port group in the Yangtze River Delta was the most serious. The similarity in South China was lower than in the north. The port group in the Pearl River Delta had the least similarity, and there is a clear functional division, with more cooperation among ports than competition.
- (3)
- The major contributors to the similarity in different regions varied geographically due to the different market demands. In terms of the inbound structure, metal ore was the main cause of similarity in ports around Bohai Bay. Coal and metal ore were the leading factors determining similarity in the area of the Yangtze River Delta. Coal and other goods were the main contributors in the area of the Pearl River Delta.
- (4)
- For the adjacent ports, the similarity coefficient of inbound structure was larger than the outbound. This was because the resource endowments of port hinterlands vary widely, but the industrial structures of provinces in China are quite similar. The similarity of resource endowments of the hinterland is smaller than that of the industrial structure. The functional convergence between hub ports was more serious than between adjacent ports, in terms of both the outbound and inbound structure. Tianjin had the least similarity with the other hub ports. The main cargo of hub ports was other goods.
- (5)
- Over time, the average similarity coefficients of the inbound and outbound structure both displayed an increasing trend. The transportation function division of port system is becoming less clear. Industrial structure convergence and local government policy were the main reasons for the structural similarity of ports.
Acknowledgments
Author Contributions
Conflicts of Interest
Appendix A

| Port Group | A Pair of Ports | Similarity Coefficient | Port Group | A Pair of Ports | Similarity Coefficient |
|---|---|---|---|---|---|
| Ports around Bohai Bay | Qinhuangdao and Huanghua | 0.9994 | Port group in the Pearl River Delta | Shenzhen and Zhanjiang | 0.9930 |
| Dalian and Yingkou | 0.9825 | Zhongshan and Jiangmen | 0.9860 | ||
| Qinhuangdao and Tangshan | 0.9697 | Guangzhou and Zhanjiang | 0.9658 | ||
| Yantai and Weihai | 0.9690 | Shenzhen and Guangzhou | 0.9642 | ||
| Huanghua and Tangshan | 0.9642 | Zhuhai and Jiangmen | 0.9097 | ||
| Dandong and Yingkou | 0.9549 | Zhongshan and Zhuhai | 0.8970 | ||
| Weihai and Qingdao | 0.9494 | Zhuhai and Yangjiang | 0.8409 | ||
| Yantai and Qingdao | 0.9483 | Huizhou and Maoming | 0.8311 | ||
| Dandong and Dalian | 0.9254 | Yangjiang and Maoming | 0.8238 | ||
| Dandong and Jinzhou | 0.9217 | Jiangmen and Yangjiang | 0.8124 | ||
| Tangshan and Tianjin | 0.8853 | Shenzhen and Jiangmen | 0.1939 | ||
| Dalian and Jinzhou | 0.8771 | Huizhou and Dongguan | 0.1904 | ||
| Yingkou and Jinzhou | 0.8757 | Guangzhou and Yangjiang | 0.1786 | ||
| Qinhuangdao and Tianjin | 0.8591 | Huizhou and Jiangmen | 0.1778 | ||
| Huanghua and Tianjin | 0.8464 | Dongguan and Yangjiang | 0.1694 | ||
| Port group in the Yangtze River Delta | Taizhou and Wenzhou | 0.9961 | Shantou and Huizhou | 0.1684 | |
| Shanghai and Ningbo | 0.9588 | Huizhou and Zhongshan | 0.1640 | ||
| Zhenjiang and Nantong | 0.9217 | Shantou and Zhuhai | 0.1621 | ||
| Jiangyin and Yangzhou | 0.9169 | Dongguan and Zhongshan | 0.1553 | ||
| Jiaxing and Yangzhou | 0.9098 | Shantou and Jiangmen | 0.1489 | ||
| Ningbo and Wenzhou | 0.9092 | Dongguan and Jiangmen | 0.1483 | ||
| Jiaxing and Jiangyin | 0.8948 | Yangjiang and Zhanjiang | 0.1458 | ||
| Ningbo and Taizhou | 0.8877 | Dongguan and Zhanjiang | 0.1222 | ||
| Shanghai and Taizhou | 0.8673 | Shantou and Shanwei | 0.1204 | ||
| Nantong and Yangzhou | 0.8454 | Shenzhen and Yangjiang | 0.1134 | ||
| Jiaxing and Nantong | 0.8144 | Shenzhen and Dongguan | 0.1037 | ||
| Ningbo and Jiangyin | 0.1753 | Shanwei and Jiangmen | 0.0851 | ||
| Jiaxing and Taizhou | 0.1725 | Shanwei and Dongguan | 0.0712 | ||
| Jiaxing and Wenzhou | 0.1694 | Shanwei and Guangzhou | 0.0465 | ||
| Ports on the southeast coast of China | Quanzhou and Xiamen | 0.9437 | Shanwei and Shenzhen | 0.0385 | |
| Ningde and Zhangzhou | 0.9159 | Shanwei and Zhongshan | 0.0378 | ||
| Fuzhou and Quanzhou | 0.8901 | Shanwei and Zhuhai | 0.0228 | ||
| Fuzhou and Xiamen | 0.8874 | Shanwei and Huizhou | 0.0080 | ||
| Putian and Xiamen | 0.1465 | Ports on the southwest coast of China | Yangpu and Basuo | 0.1856 | |
| Fuzhou and Zhangzhou | 0.1406 | Beihai and Fangchenggang | 0.1828 | ||
| Putian and Quanzhou | 0.1359 | Haikou and Basuo | 0.0380 | ||
| Ningde and Quanzhou | 0.1129 | ||||
| Quanzhou and Zhangzhou | 0.0770 | ||||
| Ningde and Putian | 0.0283 | ||||
| Putian and Zhangzhou | 0.0077 |
| Port Group | A Pair of Ports | Similarity Coefficient | Port Group | A pair of Ports | Similarity Coefficient |
|---|---|---|---|---|---|
| Ports around Bohai Bay | Huanghua and Tangshan | 0.9971 | Ports on the southeast coast of China | Fuzhou and Ningde | 0.9344 |
| Yingkou and Jinzhou | 0.9109 | Putian and Quanzhou | 0.8684 | ||
| Dalianand Yingkou | 0.9095 | Zhangzhou and Xiamen | 0.1898 | ||
| Huanghua and Tianjin | 0.8989 | Port group in the Pearl River Delta | Huizhou and Maoming | 0.9854 | |
| Qinhuangdao and Tangshan | 0.8923 | Shanwei and Dongguan | 0.9629 | ||
| Qingdao and Rizhao | 0.8865 | Dongguan and Jiangmen | 0.9541 | ||
| Qinhuangdao and Huanghua | 0.8846 | Shantou and Zhuhai | 0.9515 | ||
| Tangshan and Tianjin | 0.8770 | Shanwei and Jiangmen | 0.9502 | ||
| Dalian and Jinzhou | 0.8676 | Shenzhen and Guangzhou | 0.9238 | ||
| Qinhuangdao and Tianjin | 0.8436 | Guangzhou and Zhanjiang | 0.8817 | ||
| Yantai and Weihai | 0.8336 | Shenzhen and Zhanjiang | 0.8788 | ||
| Weihai and Rizhao | 0.1548 | Guangzhou and Huizhou | 0.1836 | ||
| Port group in the Yangtze River Delta | Taizhou and Wenzhou | 0.9882 | Shenzhen and Huizhou | 0.1759 | |
| Zhenjiang and Nantong | 0.9509 | Zhongshan and Dongguan | 0.1725 | ||
| Nanjing and Zhenjiang | 0.9508 | Dongguan and Shenzhen | 0.1577 | ||
| Nanjing and Nantong | 0.9484 | Maoming and Yangjiang | 0.1406 | ||
| Zhenjiang and Jiangyin | 0.9480 | Jiangmen and Zhongshan | 0.1318 | ||
| Nanjing and Suzhou | 0.9356 | Maoming and Zhongshan | 0.1297 | ||
| Jiaxing and Yangzhou | 0.9247 | Yangjiang and Shenzhen | 0.1012 | ||
| Zhenjiang and Suzhou | 0.9235 | Zhongshan and Shanwei | 0.0878 | ||
| Suzhou and Nantong | 0.9195 | Shenzhen and Shanwei | 0.0718 | ||
| Nanjing and Jiangyin | 0.9187 | Zhongshan and Huizhou | 0.0657 | ||
| Jiangyin and Yangzhou | 0.9150 | Yangjiang and Zhongshan | 0.0249 | ||
| Jiaxing and Jiangyin | 0.8930 | Ports on the southwest coast of China | Beihai and Fangchenggang | 0.9045 | |
| Ningbo and Nanjing | 0.8896 | Basuo and Haikou | 0.1871 | ||
| Shanghai and Ningbo | 0.8858 | ||||
| Zhenjiang and Yangzhou | 0.8794 | ||||
| Nantong and Jiangyin | 0.8791 | ||||
| Suzhou and Jiangyin | 0.8663 | ||||
| Ningbo and Suzhou | 0.8320 | ||||
| Zhoushan and Nantong | 0.8183 | ||||
| Nanjing and Yangzhou | 0.8141 | ||||
| Shanghai and Suzhou | 0.8101 | ||||
| Jiaxing and Zhenjiang | 0.8074 | ||||
| Nantong and Yangzhou | 0.8059 | ||||
| Ningbo and Zhoushan | 0.8029 |
| A Pair of Ports | Similarity Coefficient | A Pair of Ports | Similarity Coefficient | ||
|---|---|---|---|---|---|
| Outbound | Qingdao and Ningbo | 0.9954 | Inbound | Dalian and Shenzhen | 0.9870 |
| Dalian and Qingdao | 0.9818 | Xiamen and Guangzhou | 0.9666 | ||
| Dalian and Shenzhen | 0.9729 | Shanghai and Guangzhou | 0.9312 | ||
| Ningbo and Fuzhou | 0.9703 | Shenzhen and Guangzhou | 0.9238 | ||
| Shanghai and Guangzhou | 0.9664 | Shanghai and Xiamen | 0.9230 | ||
| Dalian and Guangzhou | 0.9661 | Dalian and Guangzhou | 0.9199 | ||
| Dalian and Ningbo | 0.9649 | Shanghai and Ningbo | 0.8858 | ||
| Shenzhen and Guangzhou | 0.9642 | Xiamen and Shenzhen | 0.8733 | ||
| Qingdao and Shanghai | 0.9630 | Dalian and Xiamen | 0.8712 | ||
| Shanghai and Ningbo | 0.9588 | Tianjin and Qingdao | 0.8611 | ||
| Qingdao and Shenzhen | 0.9549 | Ningbo and Fuzhou | 0.8518 | ||
| Qingdao and Fuzhou | 0.9527 | Dalian and Shanghai | 0.8355 | ||
| Qingdao and Guangzhou | 0.9493 | Shanghai and Fuzhou | 0.8319 | ||
| Dalian and Shanghai | 0.9445 | Ningbo and Xiamen | 0.8195 | ||
| Shanghai and Fuzhou | 0.9434 | Shanghai and Shenzhen | 0.8153 | ||
| Ningbo and Shenzhen | 0.9391 | Qingdao and Ningbo | 0.8047 | ||
| Ningbo and Guangzhou | 0.9308 | ||||
| Shanghai and Shenzhen | 0.9281 | ||||
| Xiamen and Shenzhen | 0.9255 | ||||
| Xiamen and Guangzhou | 0.9121 | ||||
| Dalian and Xiamen | 0.9068 | ||||
| Dalian and Fuzhou | 0.9054 | ||||
| Fuzhou and Shenzhen | 0.8950 | ||||
| Ningbo and Xiamen | 0.8903 | ||||
| Qingdao and Xiamen | 0.8884 | ||||
| Fuzhou and Xiamen | 0.8874 | ||||
| Fuzhou and Guangzhou | 0.8854 | ||||
| Shanghai and Xiamen | 0.8719 | ||||
| Tianjin and Xiamen | 0.1433 | ||||
| Tianjin and Shenzhen | 0.1201 |
References
- Rimmer, P.J. The search for spatial regularities in the development of Australian seaports 1861–1961/2. Geogr. Ann. 1967, 49, 42–54. [Google Scholar]
- Notteboom, T.E. Concentration and load centre development in the European container port system. J. Transp. Geogr. 1997, 5, 99–115. [Google Scholar] [CrossRef]
- Notteboom, T.E. Concentration and the formation of multi-port gateway regions in the European container port system: An update. J. Transp. Geogr. 2010, 18, 567–583. [Google Scholar] [CrossRef]
- Liu, L.M.; Wang, K.Y.; Yip, T.L. Development of a container port system in Pearl River Delta: Path to multi-gateway ports. J. Transp. Geogr. 2013, 28, 30–38. [Google Scholar] [CrossRef]
- Chen, C.F. Port system’s structure evolution and advantage compare in Yangtze River delta. Port Waterw. Eng. 2011, 6, 54–60. [Google Scholar]
- Cao, Y.H.; Li, H.J.; Chen, W. The spatial structure and the competition pattern of the container port system of China. Acta Geogr. Sin. 2004, 59, 1020–1027. [Google Scholar]
- Ducruet, C.; Roussin, S.; Jo, J.C. Going west? Spatial polarization of the North Korean port system. J. Transp. Geogr. 2009, 17, 357–368. [Google Scholar] [CrossRef]
- Wang, Z.L.; Han, Z.L. Research on competitiveness of main ports in circum-Bohai area. Resour. Dev. Mark. 2012, 28, 214–217. [Google Scholar]
- Wang, A.H.; Liu, X.H. Port competiveness: A structured literature review and implications for future research. J. South China Univ. Technol. 2013, 15, 9–25. [Google Scholar]
- Song, D.P.; Lyons, A.; Li, D.; Sharifi, H. Modeling port competition from a transport chain perspective. Transp. Res. Part E Logist. Transp. Rev. 2016, 87, 75–96. [Google Scholar] [CrossRef]
- Tongzon, J.; Heng, W. Port privatization, efficiency and competitiveness: Some empirical evidence from container ports (terminals). Transp. Res. 2005, 39, 405–424. [Google Scholar] [CrossRef]
- Carlan, V.; Sys, C.; Vanelslander, T. How port community systems can contribute to port competitiveness: Developing a cost–benefit framework. Res. Transp. Bus. Manag. 2016, 19, 51–64. [Google Scholar] [CrossRef]
- Zheng, S.Y.; Negenborn, R.R. Centralization or decentralization: A comparative analysis of port regulation modes. Transp. Rev. 2014, 69, 21–40. [Google Scholar] [CrossRef]
- Tovar, B.; Hernández, R.; Rodríguez-Déniz, H. Container port competitiveness and connectivity: The Canary Islands main ports case. Transp. Policy 2015, 38, 40–51. [Google Scholar] [CrossRef]
- Álvarez-SanJaime, Ó.; Cantos-Sánchez, P.; Moner-Colonques, R.; Sempere-Monerris, J. The impact on port competition of the integration of port and inland transport services. Transp. Res. 2015, 80, 291–302. [Google Scholar] [CrossRef]
- Han, Z.L.; Wang, C.J. The discussion of the port transportation system in the region around Bo Sea. Hum. Geogr. 2002, 17, 86–89. [Google Scholar]
- Zhao, X.J. An analysis on competition and cooperation within the circum-Bohai port cluster. Soc. Sci. J. Univ. Shanxi 2011, 23, 39–41. [Google Scholar]
- Li, J.B.; Oh, Y.S. A research on competition and cooperation between Shanghai Port and Ningbo—Zhoushan Port. Asian J. Shipp. Logist. 2010, 26, 67–91. [Google Scholar] [CrossRef]
- Chen, L.; Wu, S.D.; Chen, P.J. A research on the structure of Fujian port system. Trop. Geogr. 2007, 27, 249–283. [Google Scholar]
- Zhang, F. A study on the competition and cooperation of the ports in Pearl Delta. Urban Stud. 2004, 11, 75–81. [Google Scholar]
- Wang, L.H.; Notteboom, T.; Lau, Y.Y.; Ng, A. Functional Differentiation and Sustainability: A New Stage of Development in the Chinese Container Port System. Sustainability 2017, 9, 328. [Google Scholar] [CrossRef]
- Hoshino, H. Competition and collaboration among container ports. Asian J. Shipp. Logist. 2010, 26, 31–47. [Google Scholar] [CrossRef]
- Heaver, T.; Meersman, H.; Moglia, F.; Van de Voorde, E. Do mergers and alliances influence European shipping and port competition? Marit. Policy Manag. 2000, 27, 363–373. [Google Scholar] [CrossRef]
- Wang, J.X. Interaction and Development between Chinese Ports and Cities, 1st ed.; Southeast University Press: Nanjing, China, 2010; pp. 98–103. [Google Scholar]
- Zhang, X.J. Analysis of game theory for cooperation of ports. Logist. Eng. Manag. 2009, 31, 13–15. [Google Scholar]
- Yu, H.H.; Wang, X.P. Research on the relations among ports in the Yangtze River Delta based on co-opetition game. Logist. Sci-Tech 2010, 10, 16–20. [Google Scholar]
- Notteboom, T.; Yang, Z.Z. Port governance in China since 2004: Institutional layering and the growing impact of broader policies. Res. Transp. Bus. Manag. 2017, 22, 184–200. [Google Scholar] [CrossRef]
- Cao, Y.H.; Mao, H.Y.; Xu, G. The functional structure of the lower Changjiang River port system. Acta Geogr. Sin. 2002, 56, 590–598. [Google Scholar]
- He, C.F.; Zhu, S.J. Economic transition and industrial restructuring in China: Structural convergence or divergence? Post-Communist Econ. 2007, 19, 317–342. [Google Scholar]
- Wei, S.Q.; Chen, Y.H.; Ge, J.H. Empirical study on industrial isomorphism comparing Fujian and Taiwan provinces by the similar coefficient and R/S. Geogr. Res. 2010, 29, 491–499. [Google Scholar]
- Jiang, Y.L.; Yang, Z.Z.; Wang, L.; Zou, W.Q. Homogenization analysis of airports in China Yangtze River Delta region. Econ. Geogr. 2013, 33, 122–127. [Google Scholar]
- Ishii, M.; Lee, T.W.; Tezuka, K.; Chang, Y.T. A game theoretical analysis of port competition. Transp. Res. Part E Logist. Transp. Rev. 2013, 49, 92–106. [Google Scholar] [CrossRef]
- He, C.F.; Liu, Z.L.; Wang, L. Economic transition and convergence of regional industrial structure in China. Acta Geogr. Sin. 2008, 63, 807–819. [Google Scholar]
- Chen, Y. Measurement of industrial structure convergence and its desirability or non-desirability. China Ind. Econ. 1998. [Google Scholar] [CrossRef]


| Port Group | Number of Pairs of Ports | Average Similarity Coefficient | ||||
|---|---|---|---|---|---|---|
| Similar (Outbound) | Complementary (Outbound) | Similar (Inbound) | Complementary (Inbound) | Outbound | Inbound | |
| Ports around Bohai Bay | 15 | 0 | 11 | 1 | 0.90 | 0.71 |
| Port group in the Yangtze River Delta | 11 | 3 | 24 | 0 | 0.60 | 0.76 |
| Ports on the southeast coast of China | 4 | 7 | 2 | 1 | 0.36 | 0.51 |
| Port group in the Pearl River Delta | 10 | 23 | 8 | 12 | 0.29 | 0.45 |
| Ports on the southwest coast of China | 0 | 3 | 1 | 1 | 0.26 | 0.52 |
| Total | 40 | 36 | 46 | 15 | 0.51 | 0.59 |
| Year | Industrial Structure of Coastal Provinces | Inbound Structure of Ports | Outbound Structure of Ports |
|---|---|---|---|
| 2000 | 0.679 | 0.516 | 0.361 |
| 2003 | 0.637 | 0.510 | 0.426 |
| 2005 | 0.642 | 0.559 | 0.486 |
| 2008 | 0.643 | 0.573 | 0.496 |
| 2010 | 0.662 | 0.604 | 0.515 |
| 2012 | 0.664 | 0.586 | 0.498 |
| 2014 | 0.669 | 0.595 | 0.507 |
© 2017 by the authors. Licensee MDPI, Basel, Switzerland. This article is an open access article distributed under the terms and conditions of the Creative Commons Attribution (CC BY) license (http://creativecommons.org/licenses/by/4.0/).
Share and Cite
Wang, W.; Wang, C.; Jin, F. The Functional Structure Convergence of China’s Coastal Ports. Sustainability 2017, 9, 2185. https://doi.org/10.3390/su9122185
Wang W, Wang C, Jin F. The Functional Structure Convergence of China’s Coastal Ports. Sustainability. 2017; 9(12):2185. https://doi.org/10.3390/su9122185
Chicago/Turabian StyleWang, Wei, Chengjin Wang, and Fengjun Jin. 2017. "The Functional Structure Convergence of China’s Coastal Ports" Sustainability 9, no. 12: 2185. https://doi.org/10.3390/su9122185