A New Approach to Identify Social Vulnerability to Climate Change in the Yangtze River Delta

Abstract
:1. Introduction
2. Materials and Methods
2.1. Definition
2.2. Traditional Methods for Social Vulnerability Assessment
2.3. Alternative Methods for Social Vulnerability Assessment
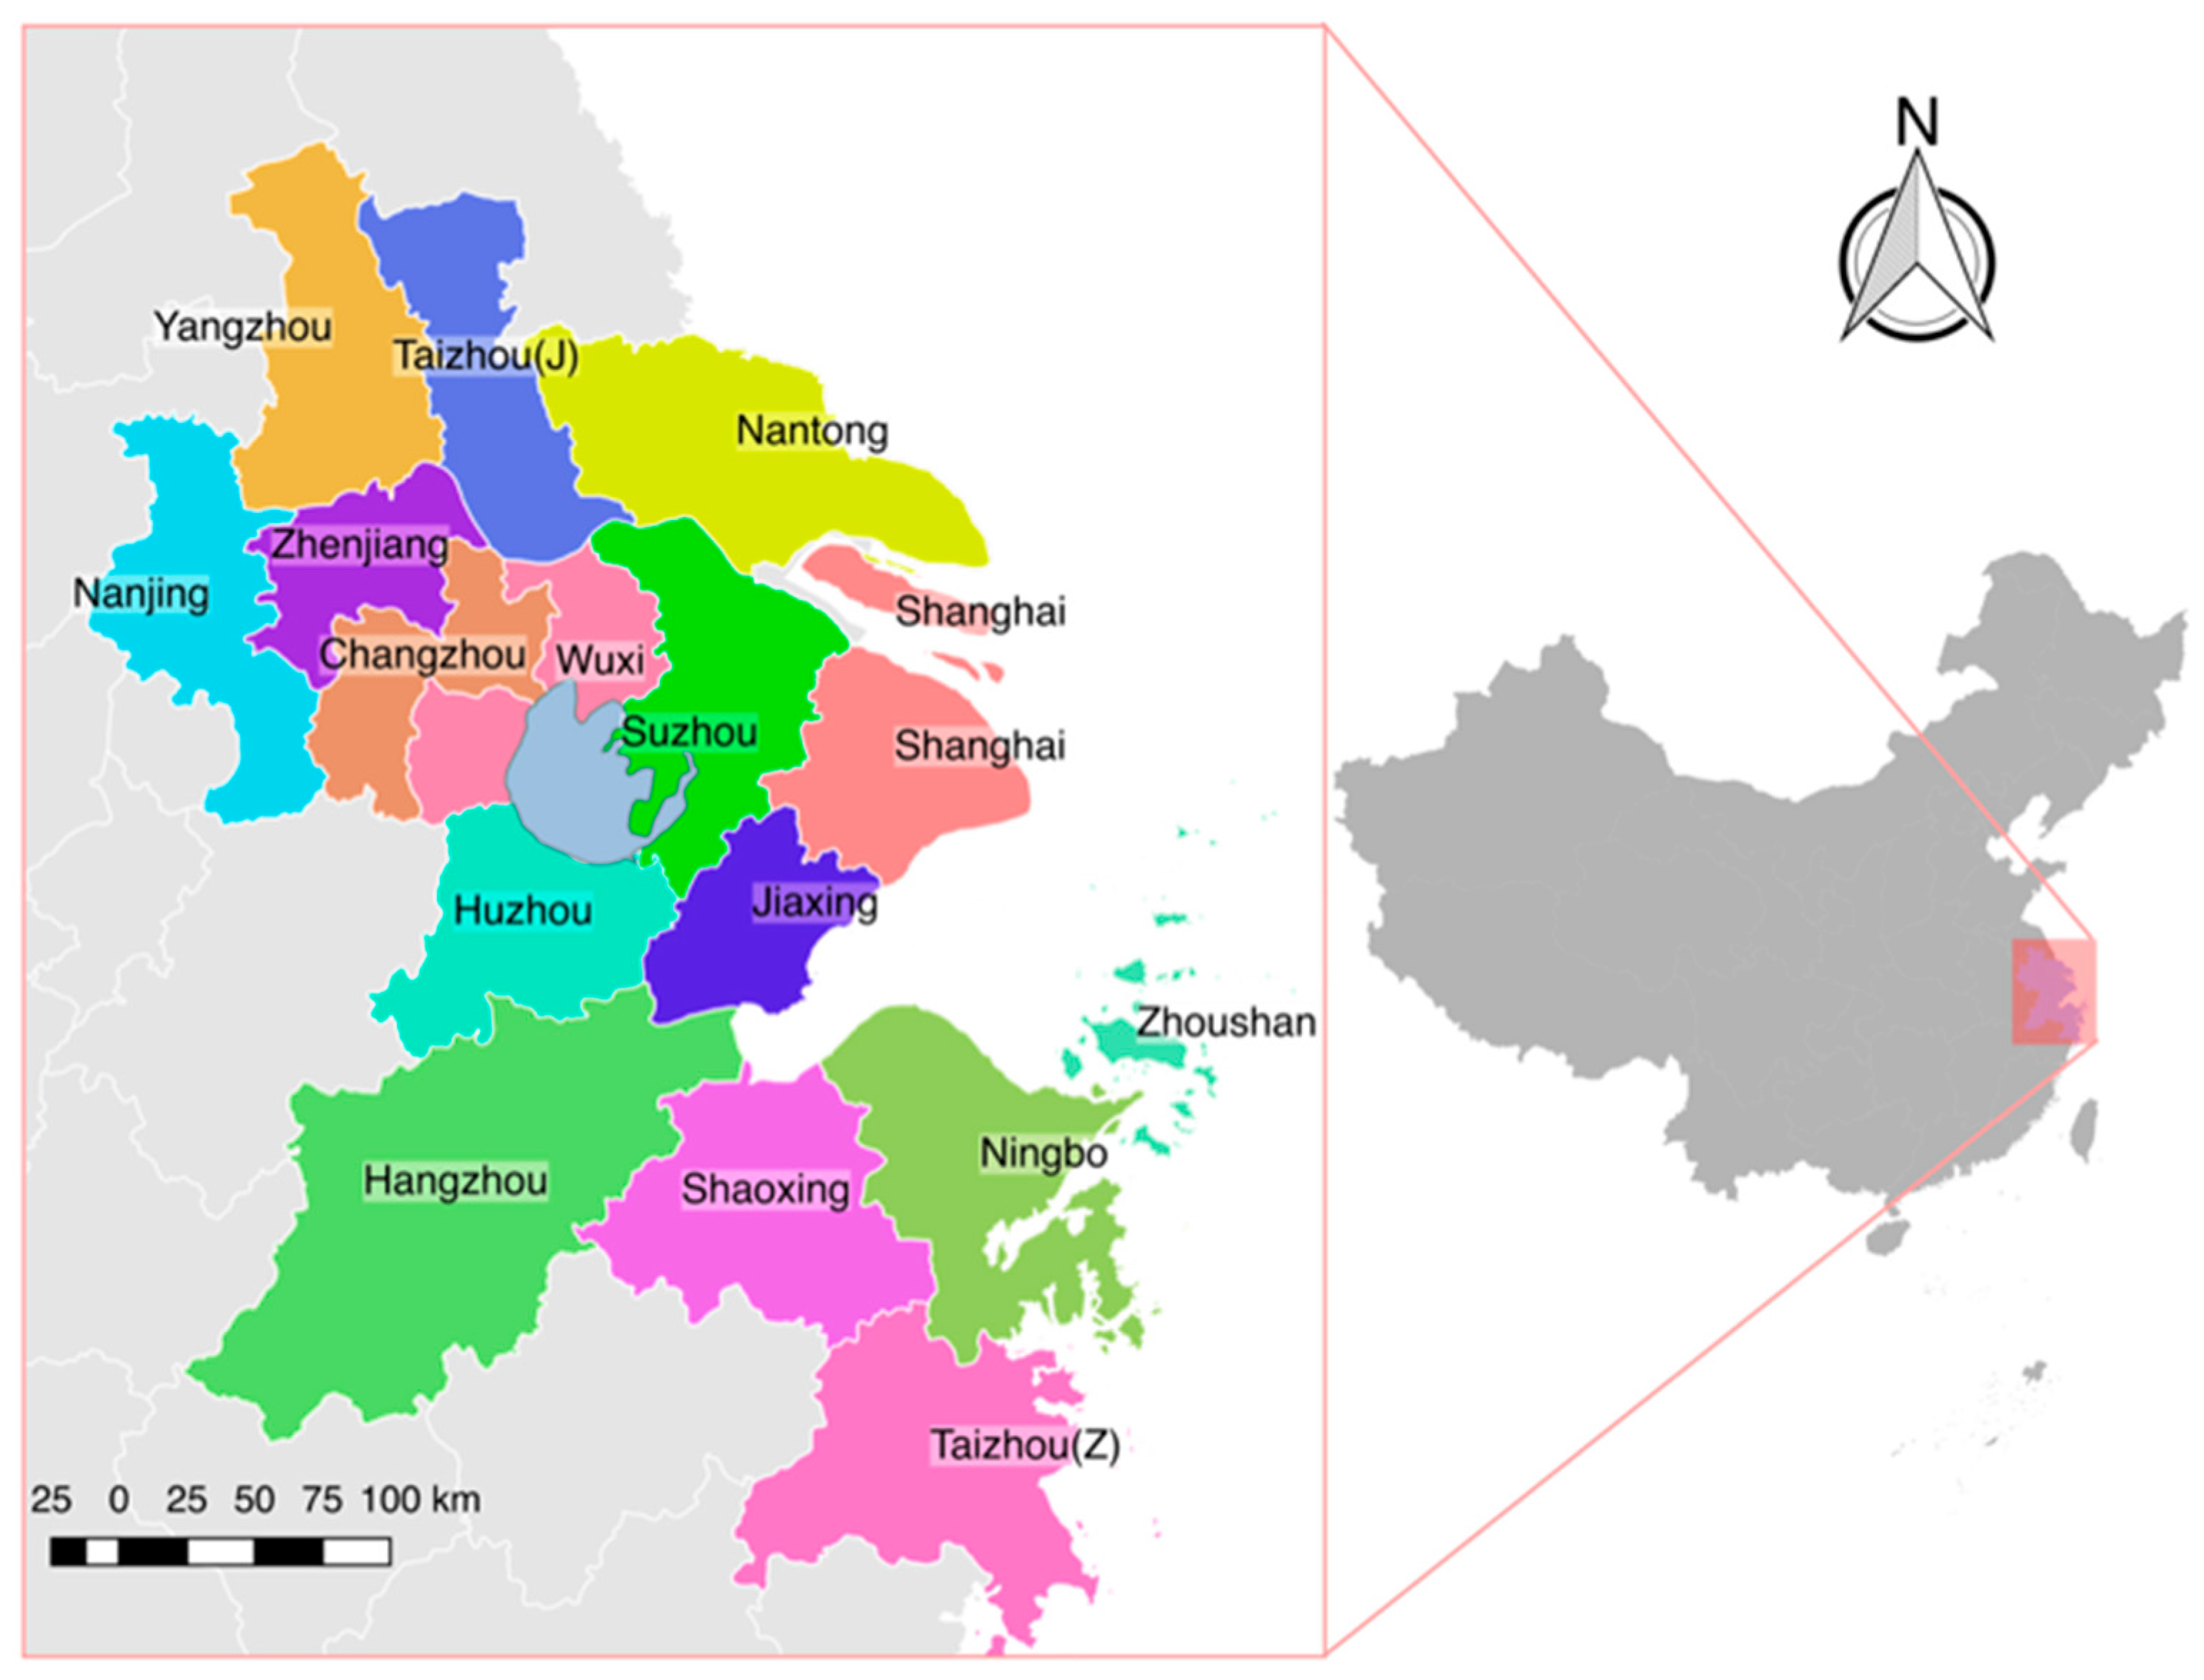
2.4. Study Area
2.5. Selection of Vulnerability Indicators
2.6. A Modified Similarity-Based Methods
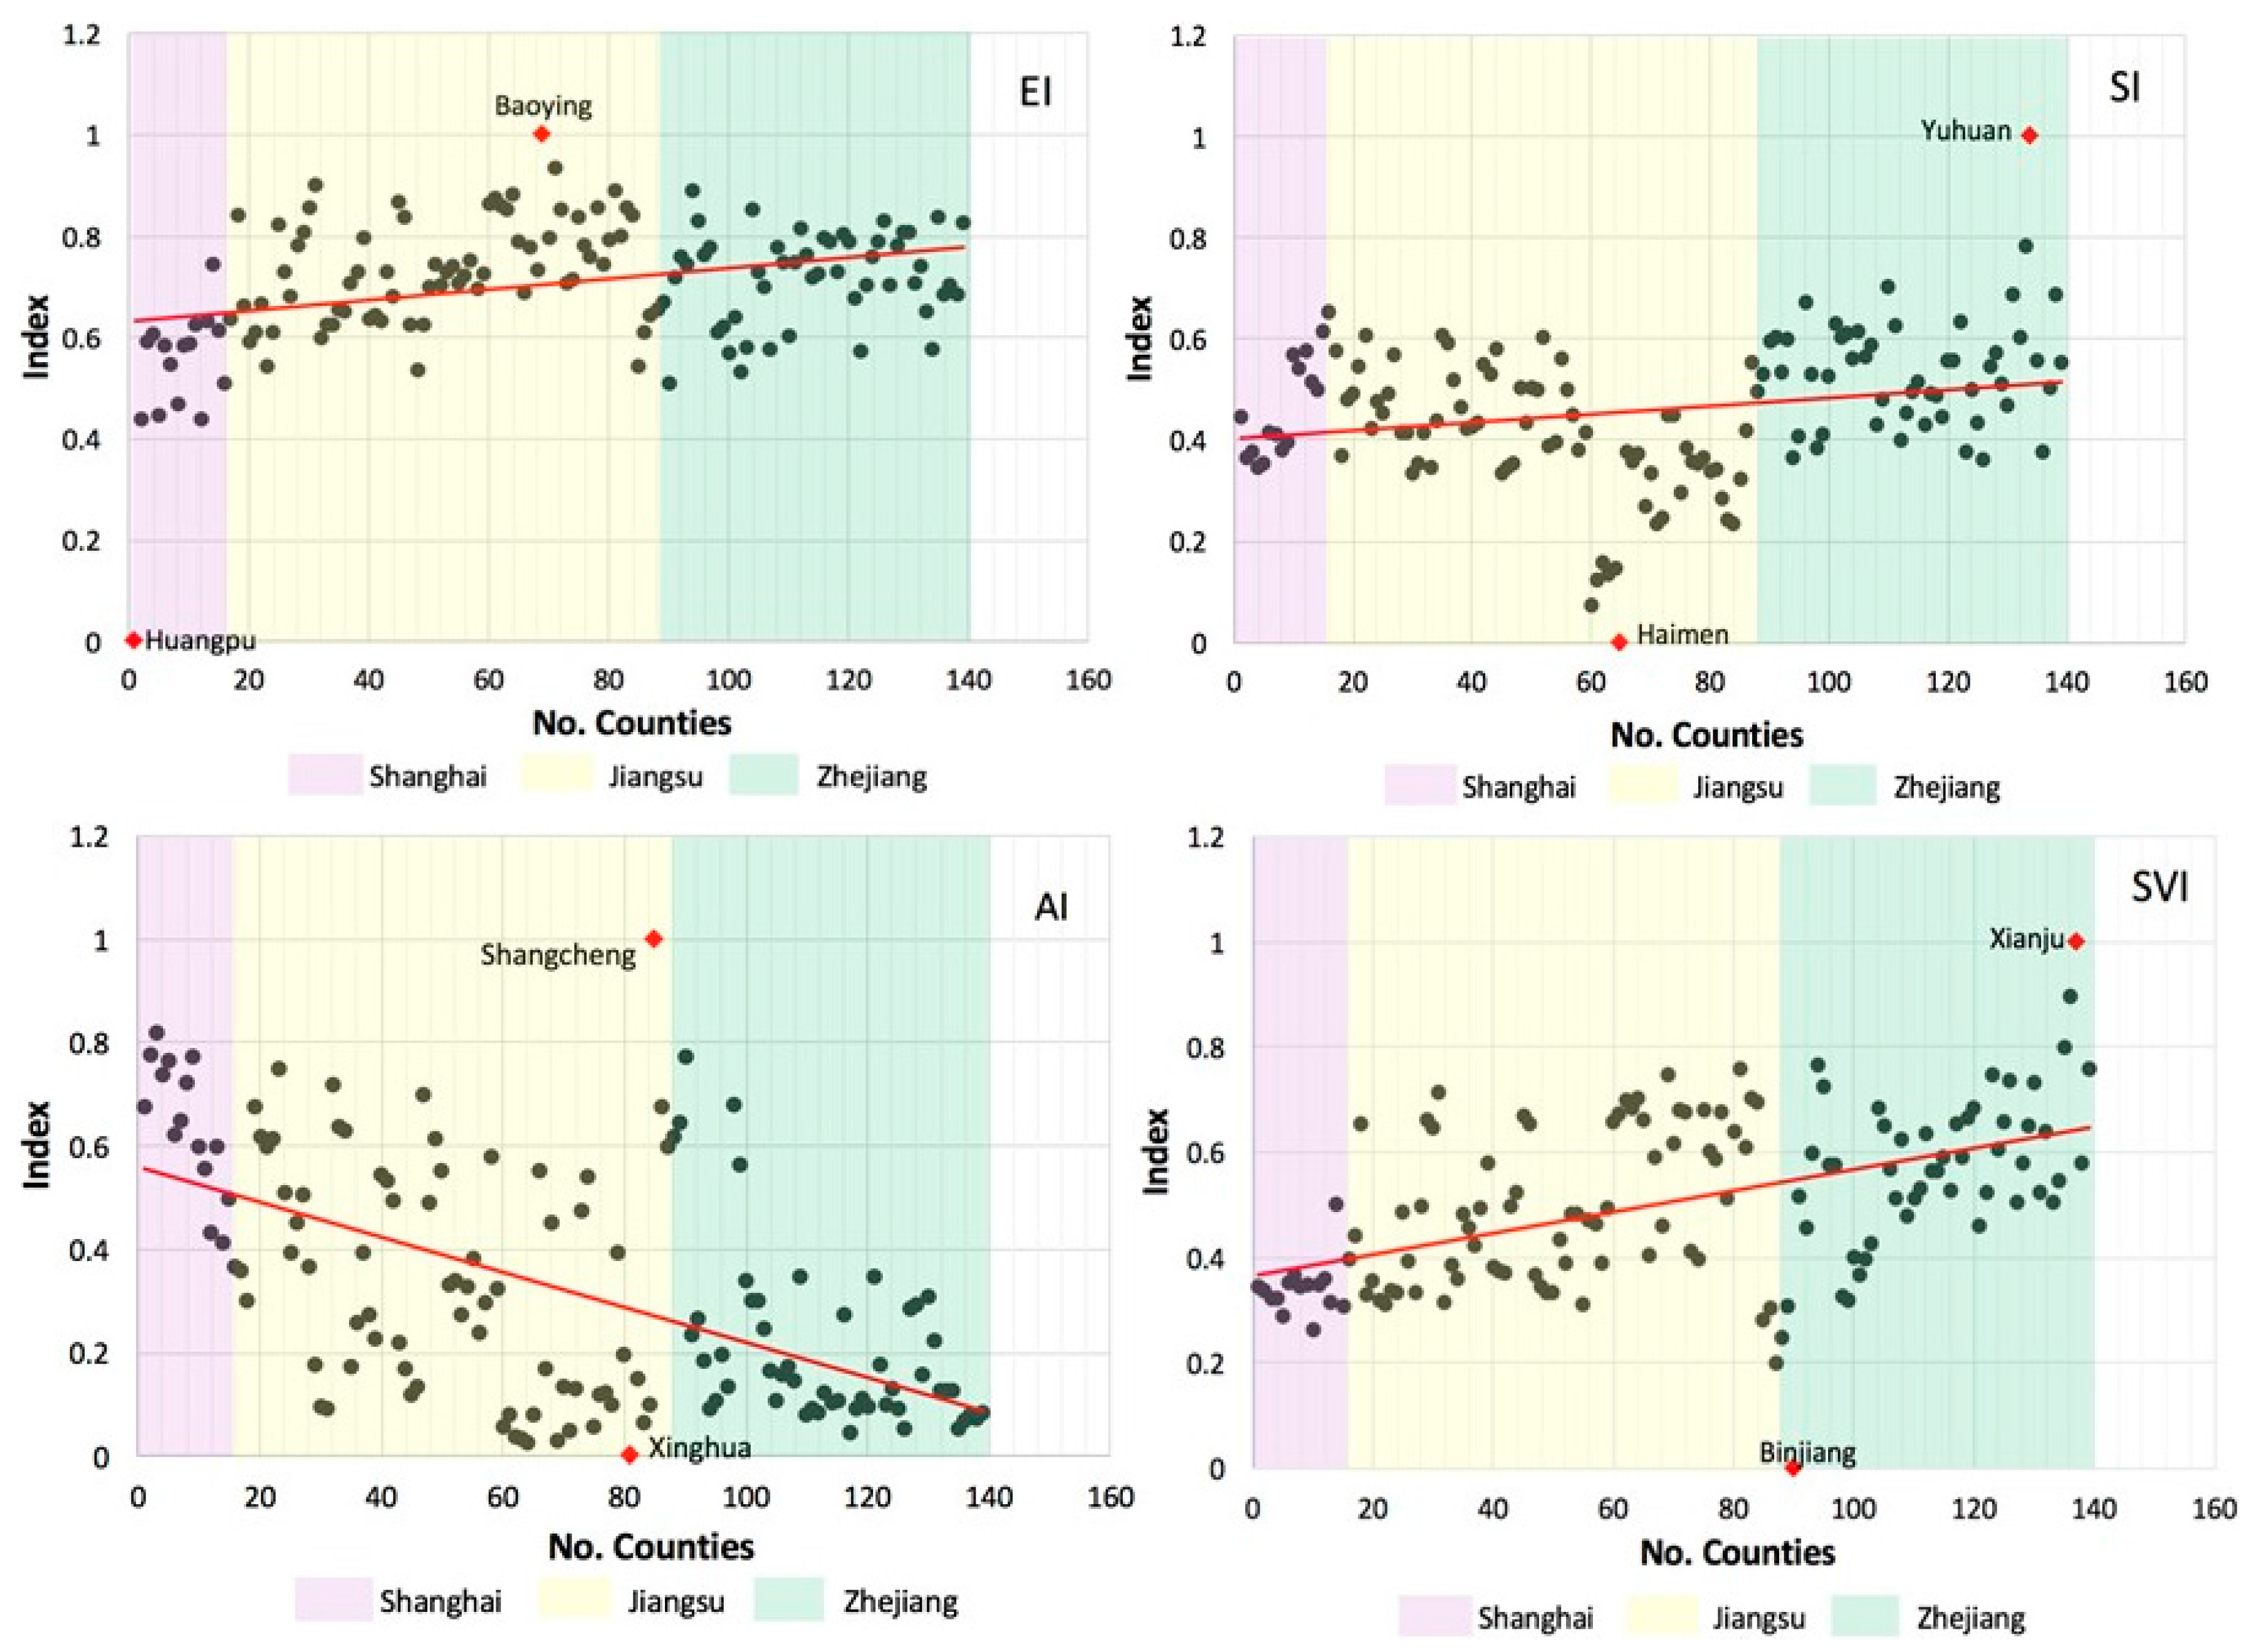
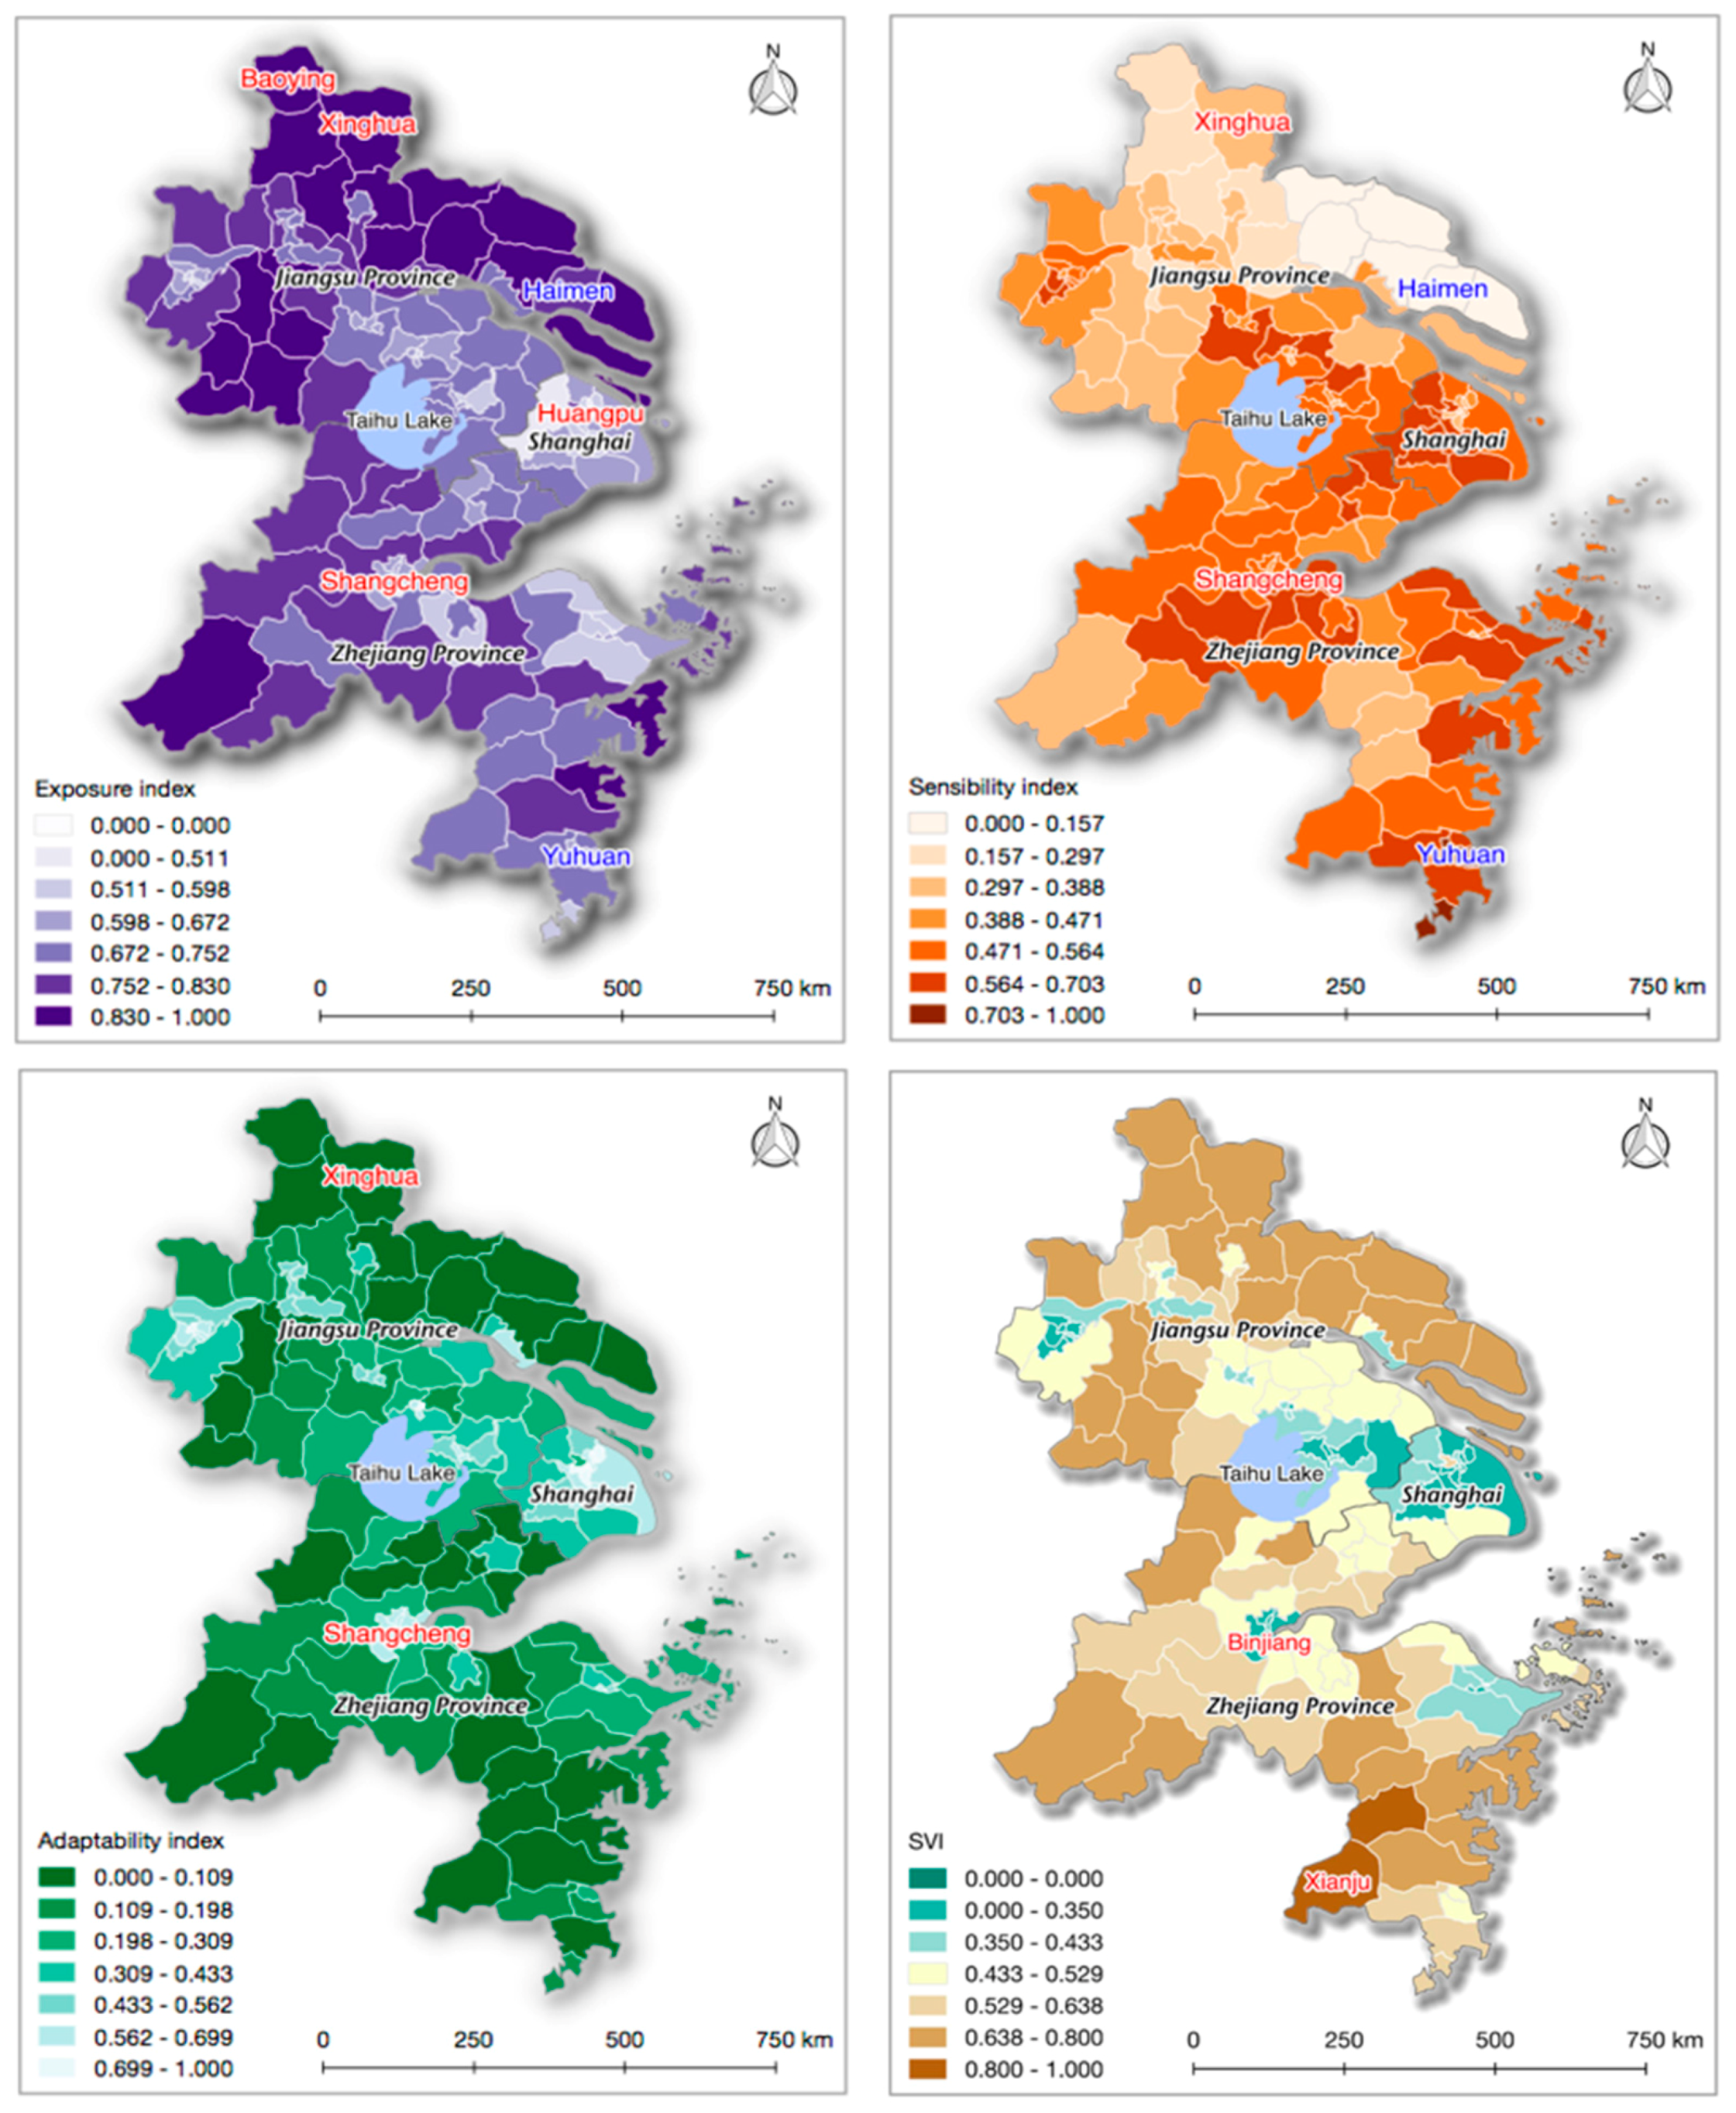
3. Results
4. Discussion and Conclusions
Acknowledgments
Author Contributions
Conflicts of Interest
References
- Intergovernmental Panel on Climate Change (IPCC). Climate Change 2014 Synthesis Report Summary Chapter for Policymakers; IPCC: Copenhagen, Denmark, 2014. [Google Scholar]
- Petkova, E.P.; Ebi, K.L.; Culp, D.; Irwin, R. Climate Change and Health on the U.S. Gulf Coast: Public Health Adaptation is Needed to Address Future Risks. Int. J. Environ. Res. Public Health 2015, 12, 9342–9356. [Google Scholar] [CrossRef] [PubMed]
- Cutter, S.L.; Boruff, B.J.; Shirley, W.L. Social Vulnerability to Environmental Hazards. Soc. Sci. Q. 2003, 84, 242–261. [Google Scholar] [CrossRef]
- Su, S.; Pi, J.; Wan, C.; Li, H.; Xiao, R.; Li, B. Categorizing social vulnerability patterns in Chinese coastal cities. Ocean Coast. Manag. 2015, 116, 1–8. [Google Scholar] [CrossRef]
- Wang, J.; Wang, W.; Wang, S. Climate Change and Coastal Vulnerability Assessment: A Case Study of China’s Yangtze River Delta Region. Geomat. Spat. Inf. Technol. 2017, 40, 81–89. [Google Scholar]
- State Oceanic Administration of PRC. China Marine Disaster Bulletin; SOA: Beijing, China, 2017.
- Global Change Research Institute; Battelle Memorial Institute; Pacific Northwest Division. China: Impact of Climate Change to 2030—A Commissioned Research Report; National Intelligence Council: Washington, DC, USA, 2009. [Google Scholar]
- Chang, S.E.; Yip, J.Z.K. Using vulnerability indicators to develop resilience networks: A similarity approach. Nat. Hazards 2015, 78, 1827–1841. [Google Scholar] [CrossRef]
- Cambridge University Press. Climate Change 2001: Impacts, Adaptation and Vulnerability; McCarthy, J.J., Canziani, O.F., Leary, N.A., Dokken, D.J., White, K.S., Eds.; Cambridge University Press: Cambridge, UK, 2001. [Google Scholar]
- Ge, Y.; Liu, J.; Li, F.; Shi, P. Quantifying social vulnerability for flood disasters of insurance company. J. Southeast Univ. 2008, 24, 147–150. [Google Scholar]
- Füssel, H.-M. Vulnerability: A generally applicable conceptual framework for climate change research. Glob. Environ. Chang. 2007, 17, 155–167. [Google Scholar] [CrossRef]
- Ge, Y.; Dou, W.; Liu, N. Planning Resilient and Sustainable Cities: Identifying and Targeting Social Vulnerability to Climate Change. Sustainability 2017, 9, 1394. [Google Scholar] [CrossRef]
- Cutter, S.L.; Finch, C. Temporal and spatial changes in social vulnerability to natural hazards. Proc. Natl. Acad. Sci. USA 2008, 7, 2301–2306. [Google Scholar] [CrossRef] [PubMed]
- Aubrecht, C.; Steinnocher, K.; Mario, K.; Zuger, J.; Loibl, W. Long-term spatio-temporal social vulnerability variation considering health-related climate change parameters particularly affecting elderly. Nat. Hazards 2013, 68, 1371–1384. [Google Scholar] [CrossRef]
- Birkmann, J.; Cardona, O.D.; Carreño, M.L.; Barbat, A.H.; Pelling, M.; Schneiderbauer, S.; Kienberger, S.; Keiler, D.; Alexander, M.; Zeil, T.; et al. Framing vulnerability, risk and societal responses: The MOVE framework. Nat. Hazards 2013, 67, 193–211. [Google Scholar] [CrossRef]
- Yenneti, K.; Tripathi, S.; Wei, Y.D.; Chen, W.; Joshi, G. The truly disadvantaged? Assessing social vulnerability to climate change in urban India. Habitat Int. 2016, 56, 124–135. [Google Scholar] [CrossRef]
- Stafford, S.; Abramowitz, J. An analysis of methods for identifying social vulnerability to climate change and sea level rise: A case study of Hampton Roads, Virginia. Nat. Hazards 2017, 85, 1089–1117. [Google Scholar] [CrossRef]
- Maria, B.; Hummell, D.L.; Cutter, S.L.; Emrich, C.T. Social Vulnerability to Natural Hazards in Brazil. Int. J. Disaster Risk Sci. 2016, 7, 111–122. [Google Scholar]
- Lundgren, L.; Jonsson, A. Assessment of Social Vulnerability: A Literature Review of Vulnerability Related to Climate Change and Natural Hazards; Centre for Climate Science and Policy Research: Norrköping, Sweden, 2012. [Google Scholar]
- Nguyen, T.T.X.; Bonetti, J.; Rogers, K.; Woodroffe, C.D. Indicator-based assessment of climate-change impacts on coasts: A review of concepts, methodological approaches and vulnerability indices. Ocean Coast. Manag. 2016, 123, 18–43. [Google Scholar] [CrossRef]
- Adger, W.N.; Vincent, K. Uncertainty in adaptive capacity. C. R. Geosci. 2005, 337, 399–410. [Google Scholar] [CrossRef]
- Mahendraa, R.S.; Mohanty, P.C.; Bisoyia, H.; Kumara Srinivasa, T.; Nayak, S. Assessment and management of coastal multi-hazard vulnerability along the Cuddalore–Villupuram, east coast of India using geospatial techniques. Ocean Coast. Manag. 2011, 54, 302–311. [Google Scholar] [CrossRef]
- Cutter, S.L.; Mitchell, J.T.; Scott, M.S. Revealing the Vulnerability of People and Places: A Case Study of Georgetown County, South Carolina. Source Ann. Assoc. Am. Geogr. 2000, 90, 713–737. [Google Scholar] [CrossRef]
- Wu, S.; Yarnal, B.; Fisher, A. Vulnerability of coastal communities to sea-level rise: A case study of Cape May County, New Jersey, USA. Clim. Res. 2002, 22, 255–270. [Google Scholar] [CrossRef]
- Zahran, S.; Brody, S.D.; Peacock, W.G.; Vedlitz, A.; Grover, H. Social vulnerability and the natural and built environment: A model of flood casualties in Texas. Disasters 2008, 32, 537–560. [Google Scholar] [CrossRef] [PubMed]
- Hou, J.; Lv, J.; Chen, X.; Yu, S. China’s regional social vulnerability to geological disasters: Evaluation and spatial characteristics analysis. Nat. Hazards 2016, 84, 97–111. [Google Scholar] [CrossRef]
- Noradika, Y.; Sungsu, M. Assessment of social vulnerability to natural hazards in South Korea: Case study for typhoon hazard. Spat. Inf. Res. 2017, 25, 99–116. [Google Scholar]
- Vincent, K. Creating an Index of Social Vulnerability to Climate Change in Africa; University of East Anglia: Norwich, UK, 2004. [Google Scholar]
- Singh, S.R.; Eghdami, M.R.; Singh, S. The Concept of Social Vulnerability: A Review from Disasters Perspectives. Int. J. Interdiscip. Multidiscip. Stud. 2014, 1, 71–82. [Google Scholar]
- Yoon, D.K. Assessment of social vulnerability to natural disasters: A comparative study. Nat. Hazards 2012, 823–843. [Google Scholar] [CrossRef]
- Vincent, K. Uncertainty in adaptive capacity and the importance of scale. Glob. Environ. Chang. 2007, 17, 12–24. [Google Scholar] [CrossRef]
- Wood, N.J.; Burton, C.G.; Cutter, S.L. Community variations in social vulnerability to Cascadia-related tsunamis in the U.S. Pacific Northwest. Nat. Hazards 2010, 52, 369–389. [Google Scholar] [CrossRef]
- Wang, C.; Yarnal, B. The vulnerability of the elderly to hurricane hazards. Nat. Hazards 2012, 63, 349–373. [Google Scholar] [CrossRef]
- Guillard-gonçalves, C.; Cutter, S.L.; Emrich, C.T. Application of Social Vulnerability Index (SoVI) and delineation of natural risk zones in Greater Lisbon, Portugal. J. Risk Res. 2015, 9877, 1–24. [Google Scholar] [CrossRef]
- Frigerio, I.; Ventura, S.; Strigaro, D.; Mattavelli, M.; De Amicis, M.; Mugnano, S.; Bof, M. A GIS-based approach to identify the spatial variability of social vulnerability to seismic hazard in Italy. Appl. Geogr. 2016, 74, 12–22. [Google Scholar] [CrossRef]
- De Mendes, J.M.O. Social vulnerability indexes as planning tools: Beyond the preparedness paradigm. J. Risk Res. 2017, 12, 43–58. [Google Scholar] [CrossRef]
- Goodall, D.W. Statistical Plant Ecology. Ann. Rev. Ecol. Syst. 1970, 1, 99–124. [Google Scholar] [CrossRef]
- Hruby, T. Using Similarity Measures in Benthic Impact Assessments. Environ. Monit. Assess. 1987, 8, 163–180. [Google Scholar] [CrossRef] [PubMed]
- Ashby, F.G.; Ennis, D.M. Similarity measures. Scholarpedia 2007, 2, 4116. [Google Scholar] [CrossRef]
- Hastings, A.; Gross, L.J. Encyclopedia of Theoretical Ecology; University of California Press: Oakland, CA, USA, 2012. [Google Scholar]
- Zhao, Y.; He, T.; Cheng, Z.; Zhang, J.; Yang, M.; Zhang, Y. Interspecific Relationships among Common Plant Species in Wetlands in the Yinchuan Plain. Arid Zone Res. 2013, 30, 838–844. [Google Scholar]
- Feng, Y.; Bagheri, E.; Ensan, F.; Jovanovic, J. The state of the art in semantic relatedness: A framework for comparison. Knowl. Eng. Rev. 2017. [Google Scholar] [CrossRef]
- Zhang, M.; Hu, H.; He, Z.; Gao, L.; Sun, L. A comprehensive structural-based similarity measure in directed graphs. Neurocomputing 2015, 167, 147–157. [Google Scholar] [CrossRef]
- Zager, L.A.; Verghese, G.C. Graph similarity scoring and matching. Appl. Math. Lett. 2008, 21, 86–94. [Google Scholar] [CrossRef]
- Beg, I.; Ashraf, S. Similarity Measures for Fuzzy Sets. Appl. Comput. Math. 2009, 8, 192–202. [Google Scholar]
- Deshpande, R.; VanderSluis, B.; Myers, C. Comparison of profile similarity measures for genetic interaction networks. PLoS ONE 2013, 8. [Google Scholar] [CrossRef] [PubMed]
- Yu, Z. Comparison Method of DNA Sequence Similarity in Aquatic Organisms. Chin. J. Fish. 2016, 29, 22–26. [Google Scholar]
- Furr, R.M.; Wood, D. On the similarity between exchangeable profiles: A psychometric model, analytic strategy, and empirical illustration. J. Res. Personal. 2013, 47, 233–247. [Google Scholar] [CrossRef] [PubMed]
- Fang, N. China’s Democracy Path; Springer: Berlin/Heidelberg, Germany, 2015. [Google Scholar]
- Han, L.; Xu, Y.; Pan, G.; Deng, X.; Hu, C.; Xu, H.; Shi, H. Changing properties of precipitation extremes in the urban areas, Yangtze River Delta, China, during 1957. Nat. Hazards 2015, 79, 437–454. [Google Scholar] [CrossRef]
- Zhong, S.; Qian, Y.; Zhao, C.; Leung, R.; Wang, H.; Yang, B.; Fan, J.; Yan, H.; Yang, X.-Q.; Liu, D.Q. Urbanization-induced urban heat island and aerosol effects on climate extremes in the Yangtze River Delta region of China. Atmos. Chem. Phys. 2017, 17, 5439–5457. [Google Scholar] [CrossRef]
- Zhang, D.; You, X.; Wang, C. New and Excellent Tree Species Selection in Shanghai’s Response to Climate Change. Chin. Landsc. Archit. 2010, 9, 72–77. [Google Scholar]
- Gu, C.; Hu, L.; Zhang, X.; Wang, X.; Guo, J. Climate change and urbanization in the Yangtze River Delta. Habitat Int. 2011, 35, 544–552. [Google Scholar] [CrossRef]
- IPCC Climate Change 2013: The Physical Science Basis; Working Group I to the Fifth Assessment Report of the Intergovernmental Panel on Climate Change; Cambridge University Press: Cambridge, UK, 2013.
- Liu, B.; Ling, Y.; Gordon, S.; Wei, M. Exceedance probability of multiple natural hazards: Risk assessment in China’s Yangtze River Delta. Nat. Hazards 2013, 69, 2039–2055. [Google Scholar] [CrossRef]
- The National Disaster Reduction Center of China (Ministry of Civil Affairs of China). Atlas of Natural Disaster in China; SinoMaps Press: Beijing, China, 2017.
- Ge, Y.; Dou, W.; Zhang, H. A New Framework for Understanding Urban Social Vulnerability from a Network Perspective. Sustainability 2017, 9, 1723. [Google Scholar] [CrossRef]
- Tucker, J.; Daoud, M.; Oates, N.; Matheson, S. Social vulnerability in three high-poverty climate change hot spots: What does the climate change literature tell us? Reg. Environ. Chang. 2015, 15, 783–800. [Google Scholar] [CrossRef]
- Holand, I.S.; Lujala, P.; Rød, J.K. Social vulnerability assessment for Norway: A quantitative approach. Nor. Geogr. Tidsskr. 2011, 65, 1–17. [Google Scholar] [CrossRef]
- Feroz, R.A. Climate Change Vulnerability Assessment for Sustainable Urban Development: A Study on Slum Population of Kota, India; Linköping University: Linköping, Sweden, 2012. [Google Scholar]
- Morrow, B.H. Identifying and Mapping Community Vulnerability. Disasters 1999, 23, 1–18. [Google Scholar] [CrossRef] [PubMed]
- Wisner, B.; Blaikie, P.; Cannon, T.; Davis, I. At Risk: Natural Hazards, People’s Vulnerability, and Disasters, 2nd ed.; Routledge: London, UK, 2004. [Google Scholar]
- Frigerio, I.; Amicis, M. De Mapping social vulnerability to natural hazards in Italy: A suitable tool for risk mitigation strategies. Environ. Sci. Policy 2016, 63, 187–196. [Google Scholar] [CrossRef]
- Mildrexler, D.; Yang, Z.; Cohen, W.B.; Bell, D.M. A forest vulnerability index based on drought and high temperatures. Remote Sens. Environ. 2015, 173, 314–325. [Google Scholar] [CrossRef]
- Zhou, Y.; Li, N.; Wu, W.; Wu, J.; Shi, P. Local spatial and temporal factors influencing population and societal vulnerability to natural disasters. Risk Anal. 2014, 34, 614–639. [Google Scholar] [CrossRef] [PubMed]
- Ge, Y.; Dou, W.; Gu, Z.; Qian, X. Assessment of social vulnerability to natural hazards in the Yangtze River Delta, China. Stoch. Environ. Res. Risk Assess. 2013, 27, 1899–1908. [Google Scholar] [CrossRef]
- Ge, Y.; Zhang, H.; Dou, W.; Chen, W.; Liu, N.; Wang, Y.; Shi, Y.; Rao, W. Mapping Social Vulnerability to Air Pollution: A Case Study of the Yangtze River Delta Region, China. Sustainability 2017, 9, 109. [Google Scholar] [CrossRef]


| Disaster | Province | Affected (10,000) | Death and Missing | Homeless (10,000) | Estimated Damage (Million Yuan) |
|---|---|---|---|---|---|
| drought | Shanghai | 0 | 0 | 0 | 0 |
| Jiangsu | 440.9 | / | / | 156 | |
| Zhejiang | 93.3 | / | / | 1580 | |
| flood | Shanghai | 2.2 | 0 | 0 | 40 |
| Jiangsu | 126.8 | 0 | 2.2 | 1830 | |
| Zhejiang | 200.8 | 11 | 10.6 | 4230 | |
| hail | Shanghai | 0.02 | 2 | 0 | 2 |
| Jiangsu | 174.0 | 9 | 1.0 | 1300 | |
| Zhejiang | 9.3 | 3 | 0.1 | 110 | |
| Typhoon | Shanghai | 20.8 | 1 | 16.3 | 270 |
| Jiangsu | 121.4 | 0 | 8.3 | 1270 | |
| Zhejiang | 610.0 | 6 | 124.8 | 22760 | |
| Snow and freezing | Shanghai | 0 | 0 | 0 | 0 |
| Jiangsu | 26.1 | 0 | 0.1 | 290 | |
| Zhejiang | 41.8 | 2 | 0.4 | 440 |
| Province | City | GDP (Billion US Dollars) | Population (Million) | Land Area (km2) | Population Density (People per km2) |
|---|---|---|---|---|---|
| Shanghai | Shanghai | 385.04 | 24.26 | 6341 | 3826 |
| Jiangsu | Nanjing | 144.15 | 6.49 | 6587 | 1247 |
| Wuxin | 134.10 | 4.77 | 4627.46 | 1405 | |
| Changzhou | 80.11 | 3.69 | 4372 | 1074 | |
| Suzhou | 224.89 | 6.61 | 8657 | 1225 | |
| Nantong | 92.38 | 7.68 | 10,549 | 692 | |
| Yangzhou | 60.43 | 4.61 | 6591 | 679 | |
| Zhenjiang | 53.15 | 2.72 | 3847 | 826 | |
| Taizhou | 55.09 | 5.09 | 5787 | 802 | |
| Total | 844.30 | 41.65 | 51,017 | 816 | |
| Zhejiang | Hangzhou | 150.45 | 7.16 | 16,596 | 431 |
| Ningbo | 124.37 | 5.84 | 9816 | 595 | |
| Jiaxing | 54.79 | 3.48 | 3915 | 889 | |
| Huzhou | 31.97 | 2.64 | 5820 | 453 | |
| Shaoxing | 69.72 | 4.43 | 8279 | 535 | |
| Zhoushan | 16.59 | 0.97 | 1455 | 670 | |
| Taizhou | 55.36 | 5.97 | 9411 | 634 | |
| Total | 503.25 | 30.50 | 55,292 | 552 | |
| China | 10,401.42 | 1367.82 | 9,600,000 | 142 | |
| YRD | 1732.59 | 96.56 | 112,650 | 857 | |
| Ratio of YRD to China | 16.66% | 7.06% | 1.17% | 6.04 | |
| No. | Indicator | Description | Impact to SVI | Factor | Dimension of SVI |
|---|---|---|---|---|---|
| 1 | Population density | High population density means more people exposed in risk and makes evacuation and recovery management more complicated [59] | + | People exposure | Exposure |
| 2 | Rate of natural increase (RNI) | Communities with high RNI may challenge the available public services [3]. | + | ||
| 3 | Employees in primary industry | These employees are affected by climate hazards directly and severely due to greater dependence on resource extraction economies [12]. | + | ||
| 4 | GDP in primary sector | GDP in this sector gained most from resource extraction economies which affected climate change most [12]. | + | Economic exposure | |
| 5 | GDP density | A substitute for fixed assets exposed to extreme events [3]. | + | ||
| 6 | Houses with no bath facilities | People living in poor housing conditions, such as lacking sufficient living space or access to safe drinking water and sanitation, are more fragile to climate change and hazards [60]. | + | House exposure | |
| 7 | Houses with no lavatory | + | |||
| 8 | Houses with no tap water | + | |||
| 9 | Houses with no kitchen | + | |||
| 10 | Children | Children are more fragile to extreme events than adults [61]. | + | People sensitivity | Sensitivity |
| 11 | Elderly | Elderly may have mobility constraints and be sensible to diseases [61]. | + | ||
| 12 | Female | Responsibilities make women have more difficulty than men after extreme events [62]. | + | ||
| 13 | Family size | Families with large numbers of dependents will reduce the resilience of the whole family [63]. | + | Family sensitivity | |
| 14 | Ethnic minorities | Language and cultural barriers limited their access to efficient aid [12]. | + | Vulnerable group | |
| 15 | Illiterate | Their access to recovery information is often constrained [64]. | + | ||
| 16 | Unemployed | They are more likely to be exposed to hazardous environmental changes and take fewer precautions and recovery actions [64]. | + | ||
| 17 | Renter | They lack sufficient shelter options and access to information of aid [3]. | + | ||
| 18 | Immigrates from other provinces | The unfamiliar environment limited their access to aid [12]. | + | ||
| 19 | GDP per capita | Wealth enables the residents to absorb and recover from losses quickly [3]. | − | Economic adaptability | Adaptability |
| 20 | Higher education graduate | Higher education links to higher socioeconomic status and more access to prevention and recovery [59]. | − | Individual adaptability | |
| 21 | Urban residents | Rural residents depend more on resource extraction economies affected by climate change largely [3]. | − | ||
| 22 | Beds in hospital per 1000 people | Sufficient medical services including beds and physicians will help relief and recovery in mitigation [3]. | − | Health care infrastructures | |
| 23 | Physicians in hospital per 1000 people | − | |||
| 24 | Employees in management sector | Management services can alleviate the potential losses and improve the resilience of communities [65]. | − | Management services |
| Value | Referenced Community (Max) | Referenced Community (Min) | |
|---|---|---|---|
| ESI matrix | 0.344 | Baoying County of Yangzhou City | Huangpu District of Shanghai City |
| SSI matrix | 0.445 | Yuhuan County of Taizhou (Z) City | Haimen County of Nantong City |
| ASI matrix | 0.360 | Shangcheng District of Hangzhou City | Xinghua County of Taizhou (J) City |
| VSI matrix | 0.466 | Xianju County of Taizhou (Z) City | Binjiang District of Hangzhou City |
| Maximum | Minimum | Average Value | Stand Deviation | |
|---|---|---|---|---|
| EI | 1 | 0 | 0.707 | 0.125 |
| SI | 1 | 0 | 0.459 | 0.458 |
| AI | 1 | 0 | 0.323 | 0.236 |
| SVI | 1 | 0 | 0.507 | 0.506 |
| Indicator Name | SVI | EI | SI | AI |
|---|---|---|---|---|
| Children | 0.69 | 0.41 | 0.17 | −0.65 |
| Elderly | 0.50 | 0.33 | −0.77 | −0.21 |
| Family size | 0.32 | 0.43 | −0.20 | −0.37 |
| Female | 0.33 | 0.25 | −0.75 | −0.17 |
| Ethnic minorities | −0.17 | −0.33 | 0.72 | −0.02 |
| Immigrates from other provinces | −0.84 | −0.72 | 0.61 | 0.65 |
| Illiterate | 0.67 | 0.43 | 0.22 | −0.61 |
| Unemployed | 0.71 | 0.50 | 0.06 | −0.63 |
| Renter | −0.72 | −0.78 | 0.65 | 0.51 |
| Rate of natural increase (RNI) | −0.32 | −0.09 | 0.66 | 0.09 |
| Population density | −0.51 | −0.66 | −0.09 | 0.69 |
| Employees in primary industry | 0.89 | 0.72 | −0.43 | −0.74 |
| GDP in primary sector | 0.84 | 0.70 | −0.22 | −0.75 |
| GDP per capita | −0.44 | −0.72 | −0.10 | 0.62 |
| Houses with no tap water | −0.40 | −0.01 | −0.21 | 0.30 |
| Houses with no kitchen | 0.27 | 0.64 | −0.66 | −0.09 |
| Houses with no lavatory | −0.35 | 0.22 | 0.13 | 0.26 |
| Houses with no bath facilities | −0.20 | 0.30 | −0.47 | 0.24 |
| Urban residents | −0.86 | −0.71 | −0.11 | 0.94 |
| Higher education graduate | −0.78 | −0.57 | 0.00 | 0.91 |
| Employees in management sector | −0.67 | −0.52 | 0.13 | 0.81 |
| Physicians in hospital per 1000 people | −0.58 | −0.51 | −0.14 | 0.86 |
| Beds in hospital per 1000 people | −0.56 | −0.46 | −0.03 | 0.64 |
| GDP per capita | −0.61 | −0.41 | 0.29 | 0.41 |
© 2017 by the authors. Licensee MDPI, Basel, Switzerland. This article is an open access article distributed under the terms and conditions of the Creative Commons Attribution (CC BY) license (http://creativecommons.org/licenses/by/4.0/).
Share and Cite
Ge, Y.; Dou, W.; Dai, J. A New Approach to Identify Social Vulnerability to Climate Change in the Yangtze River Delta. Sustainability 2017, 9, 2236. https://doi.org/10.3390/su9122236
Ge Y, Dou W, Dai J. A New Approach to Identify Social Vulnerability to Climate Change in the Yangtze River Delta. Sustainability. 2017; 9(12):2236. https://doi.org/10.3390/su9122236
Chicago/Turabian StyleGe, Yi, Wen Dou, and Jianping Dai. 2017. "A New Approach to Identify Social Vulnerability to Climate Change in the Yangtze River Delta" Sustainability 9, no. 12: 2236. https://doi.org/10.3390/su9122236
APA StyleGe, Y., Dou, W., & Dai, J. (2017). A New Approach to Identify Social Vulnerability to Climate Change in the Yangtze River Delta. Sustainability, 9(12), 2236. https://doi.org/10.3390/su9122236