Article

Assessment of Selected Parameters of the Automatic Scarification Device as an Example of a Device for Sustainable Forest Management

by
Ryszard Tadeusiewicz
1,
Paweł Tylek
2,
Florian Adamczyk
3,*,
Paweł Kiełbasa
4,
Mirosław Jabłoński
1,
Zbigniew Bubliński
1,
Joanna Grabska-Chrząstowska
1,
Zdzisław Kaliniewicz
5,
Józef Walczyk
2,
Jan Szczepaniak
3,
Tadeusz Juliszewski
4 and
Michał Szaroleta
3
1
Faculty of Electrical Engineering, Automatics, Computer Science and Biomedical Engineering, AGH University of Science and Technology, Al. A. Mickiewicza 30, Kraków 30-059, Poland
2
Faculty of Forestry, University of Agriculture in Krakow, UR, Al. 29 Listopada 46, Kraków 31-425, Poland
3
Industrial Institute of Agricultural Engineering, Przemysłowy Instytut Maszyn Rolniczych, PIMR, ul. Starołęcka 31, Poznan 60-963, Poland
4
Faculty of Production and Power Engineering, University of Agriculture in Krakow, UR, ul. Balicka 116B, Kraków 30-149, Poland
5
Faculty of Technical Sciences, University of Warmia and Mazury in Olsztyn, UWM, ul. Oczapowskiego 11, Olsztyn 10-719, Poland
*
Author to whom correspondence should be addressed.
Sustainability 2017, 9(12), 2370; https://doi.org/10.3390/su9122370
Submission received: 7 November 2017 / Revised: 15 December 2017 / Accepted: 16 December 2017 / Published: 19 December 2017

Abstract

:
Due to technological progress in forestry, seedlings with covered root systems—especially those grown in container nurseries—have become increasingly important in forest nursery production. One the trees that is most commonly grown this way is the common oak (Quercus robur L.). For an acorn to be sown in a container, it is necessary to remove its upper part during mechanical scarification, and evaluate its sowing suitability. At present, this is mainly done manually and by visual assessment. The low effectiveness of this method of acorn preparation has encouraged a search for unconventional solutions. One of them is the use of an automated device that consists of a computer vision-based module. For economic reasons related to the cost of growing seedlings in container nurseries, it is beneficial to minimize the contribution of unhealthy seeds. The maximum accuracy, which is understood as the number of correct seed diagnoses relative to the total number of seeds being assessed, was adopted as a criterion for choosing a separation threshold. According to the method proposed, the intensity and red components of the images of scarified acorns facilitated the best results in terms of the materials examined during the experiment. On average, a 10% inaccuracy of separation was observed. A secondary outcome of the presented research is an evaluation of the ergonomic parameters of the user interface that is attached to the unit controlling the device when it is running in its autonomous operation mode.

1. Introduction

Common oak (Quercus robur L.) is one of the main forest-forming species, occurring in almost the entire Europe: from the Iberian Peninsula in the west to the foothills of the Ural Mountains in the east, and from the Scandinavian Peninsula in the north to the Balkan Peninsula and the Apennine Peninsula in the south [1,2,3]. Forest nursery staff in both in Poland and in Europe artificially regenerate this species, whereas natural regeneration is limited to certain areas, and even then only in the most fertile years [4]. The direct sowing of acorns is rarely performed [5]. Due to technological progress in the forestry industry, seedlings with covered root systems have grown in importance in forest nursery production, especially those grown in container nurseries. In sustainable forest management, such seedlings are mainly used in areas that have been subject to strong anthropopressure and degraded, but due to their shortened production period, they are increasingly being used for regeneration in post-disaster stands and for afforestation under difficult soil and climatic conditions, e.g., post-fire cultivation areas, abandoned agricultural areas, and post-mining excavations [6]. The most important factors influencing the quality of seedlings produced in container nurseries include an optimally mixed and compacted culture substrate [7]. Apart from stabilizing the seedlings, the culture substrate must provide water, oxygen, nutrients, and minerals. In order to obtain a suitable substrate for the container production of seedlings, organic and inorganic ingredients (peat, compost, mycorrhizal fungus, perlite, vermiculite, dolomite, sand, pumice stone, rock wool, and others) are mixed together [8,9,10]. Another important factor influencing the success of the production of seedlings in a clod of soil is the quality of sowing material and the depth of sowing [11]. Seedling producers should have at their disposal sowing material that is not only of high genetic value, i.e., representing the full genetic diversity of the ecosystem, but also appropriately sorted, cleaned, and possibly equal as to its mass or size [12,13]. This is also enforced by economic calculations regarding the production of seedlings, particularly of those vaccinated with mycorrhizal fungi [14,15]. Modern forest nursery technologies and techniques should therefore be based on very high-quality seeds, each of which could produce a seedling with the expected morphological parameters. This is particularly important in container nurseries due to the optimization of the production area: only one seed should be sown in one container cell.
Decades-long research on the collection of acorns has shown that an abundant acorn yield usually occurs every five to seven years in Poland, while good seed seasons might occur more frequently (once every three years) or less frequently (once every nine years) [16,17]. In a mild climate (in Western Europe), seed years occur more frequently (every two to five years). On the national scale, the main source of oak seeds are managed seed stands. In the case of high yields, the demand for seeds amounts to approximately 600,000 kg, which presents a large logistical problem concerning the preparation of such large quantities of seeds. The seeds of common oak fall into the “recalcitrant” category, and therefore, in order to preserve their longevity, they require constant maintenance of their natural humidity and thus cannot be frozen for the purpose of long-term storage. Since acorns quickly lose their viability, their storage is practically limited to two to three years. The worse the quality of seeds at the beginning of storage, the sooner they age. This justifies the importance of seed separation, the purpose of which is to clean the seeds and separate the mature, properly developed ones from the immature or damaged ones. The very collection of larger-size acorns is a selection process. However, it is important to remember that trees growing in the same stand may produce seeds that are very different in their physical characteristics. The age of the tree significantly influences the newly-produced seeds’: critical velocity of flying, thickness, width, angle of external friction, shape, and density. Seeds from old trees are often smaller than those from young trees that are entering the seed production stage [18,19]. Due to the need for the protection and preservation of genetic diversity, large and heavy seeds as well as small and light ones should be of equal importance. The gradual rejection of small seeds, which is commonly done when using classical separation methods, may result in eliminating the seeds of old trees from the yield, i.e., the trees that are the most likely of native character, and best suited to given habitat conditions [20].
The selection of seeds with the expected biological characteristics is commonly done using their correlations with physical properties [21]. Those properties, called distribution features, include: aerodynamic features, geometric features, density, friction coefficient, surface texture, and mechanical, electrical, and optical properties. It should be noted that the seeds are alive all of the time, so separation processes must not cause their mechanical damage and interfere with their physiological or biochemical processes [22]. Previous research on common oak seeds showed that only their density, and to a very limited extent, their mass, aerodynamic and mechanical properties, depend on their health. However, it is not possible to separate only healthy seeds in a seed lot; they may only be separated together with slightly unhealthy seeds. An acorn’s size—which is characterized by linear dimensions or volume—as well as its frictional properties, are not distributive features, as the mummification process affects almost all of the fractions of acorns. Acorn shape is a similar case: both among healthy acorns as well as unhealthy and slightly unhealthy ones, there are similar numbers of slender seeds (a rotational ellipsoid) and bulky (spherical) ones [13,23]. Acorn damage may occur even before harvest, as well as during harvest, and treatment and may be caused by bacteria, fungi, and insects. In some cases, the level of damage reaches is significant [24,25].
The low effectiveness of acorn separation when using the classical methods has prompted a search for unconventional solutions [26]. These include optical properties, in the classical sense, such as color and intensity [19,27]. The pre-sowing preparation of oak seeds includes scarification, i.e., cutting off 20–30% of the distal part of the acorn. It is followed by a visual assessment of the health of the seed [28]. Thanks to this pre-sowing rejection of necrotic seeds, it is possible to increase the field germination ability by approximately 30% [29]. An analysis of the color and topography of mummification changes visualized in cotyledons, which are uncovered during scarification, could thus be regarded as a distributive feature in both manual and automated scarification procedures.
In the design process of the scarification device, several demands have been mitigated. The apparatus is expected to operate in an automated way with assumed accuracy, and require only periodic or emergency assistance from an operator. In this study, we propose and evaluate the performance of the distributive feature; we also examine the ergonomic properties of the touch control panel, which provides a graphical user interface to the operator and embodies the human–machine interface. Therefore, this study is also related to the activity of the human senses, brain, and mind.
Apart from the typically cognitive activities, the aims of cognitive science include the modeling and simulation of cognitive human activities, as well as areas such as language, learning, perception, thinking, consciousness, decision-making, etc. Juliszewski et al. [30] have examined several on-board computer interfaces in agricultural machinery and tractors, as well as procedures for activating selected functions, and they often observed a lack of logical links between them in tractors and machines made by different manufacturers. An additional difficulty in the configuration of such a system is the ambiguity of methods of mental stress measurement, which, despite numerous techniques, does not provide satisfactory results. This is complicated further by problems of euthyphronics not yet being widespread. One of the techniques, which can address the ambiguity problem, is a measurement of the response of an individual’s central nervous system, as expressed by the heart rate. Among other approaches, video plethysmography is currently recognized as a promising non-invasive heart rate measurement method that is advantageous for the ubiquitous monitoring of humans in natural work or living conditions [31]. According to Złowodzki et al. [32], the information load is not only due to its quantity, but also to the necessity of knowing many sequences and the proper decoding of information. In the ergonomic man–machine system, the carrier of this message is a signal from a device designed for this particular purpose: the so-called signaling device. Its purpose is to provide information to the operator in an understandable way. The operator who uses the machine should see the abnormal condition of its operation (signaled e.g., by a LED–Light-Emitting Diode) relatively quickly, and then be able to identify the sub-normal state of the machine (indicated by a green LED, as well as its above-normal state (indicated e.g., by a red LED). It is only after identifying and decoding the information based on specific knowledge that the operator takes a decision to change particular settings of the machine. It should be emphasized that the wrong decision and the possible failure of the equipment have tangible financial consequences, as the prices of machinery currently used in agriculture often exceed a quarter million PLN (pol. Nowy Polski Złoty- polish currency).
In spite of the tremendous potential of the human brain, the following limitation is important here [33]: the reduction of the information stream ranges from 3,000,000 bits per second (flow through the nervous system) to 16 bits/s (the stream of information that is consciously perceived) and 0.7 bits/s (the stream of information that is permanently remembered). Tadeusiewicz [34] states that the information capacity of the sensory channels can be estimated as follows: sight 100 Mb/s, touch 1 Mb/s, hearing 15 Kb/s, smell 1 Kb/s, taste 100 bit/s. It should be noted that, according to Hagerer and Köbsell [35], during the combine harvesting of cereals lying on the ground, the average amount of information was 1.30 bit/s, and the maximum amount of information was 8.82 bit/s.

2. Materials and Methods

The basic functions of automaton that are currently being developed should implement functions referring to the sequence of actions to which each single acorn must be subjected. Adequate modules providing these functions have been designed and integrated. Some of them implement few functionalities, e.g., the first machine vision module detects the seed, measures its length, and determines the orientation—these three factors are acquired by the algorithm in a single step. The interdisciplinary team designed from scratch and manufactured the critical components, including the: gripper, belt conveyor, rotator, cutting blades (scarifier), rotating arm, and the chassis, which both supports and connects all of the mechanical components. The other components were purchased in order to meet milestones defined in the schedule of the project. These included the: vibrating feeder, programmable analogue controller, processing unit, and touch-screen control panel. Particular modules and infrastructure, including sensors and actuators, have been assembled using the following professional automation components: pneumatic actuators, stepper motors, encoders, photoelectric barriers, and machine vision cameras.

2.1. Vision-Based Separation of Acorns

At the beginning of the research, simplified models of particular modules were arranged using off-the-shelf consumer components. Rapid prototyping methods, including three-dimensional (3D) printing technology and model based-design with software-in-the-loop methodology [36], were applied. In the initial stage, these allowed the acquisition of data that was necessary for designing image-processing algorithms and establishing main assumptions for virtual prototyping and further manufacturing of the automaton device [37]. Since the images of sections of scarified acorns are proposed as a carrier of the distributive feature, the critical component of the device is the machine vision system, which consists of a digital camera based on sensor produced by means of Complementary Metal-Oxide Semiconductor (CMOS) technology, a lens, an illuminator, and a processing unit that is running computer vision algorithms. The results of the computer vision-based recognition are used for controlling the sorter, which is responsible for directing particular seeds to appropriate containers after vision-based evaluation by means of the sorter comprising three separate channels, as depicted in the virtual 3D model of the sorter shown in Figure 1. It consists of three funnel reception baskets that end with channels introducing a seed into the appropriate container dedicated to healthy acorns, which guarantees the potential of obtaining healthy, unhealthy, and undetermined seedlings.
Modern vision systems are used in agriculture at various stages of plant cultivation and crop processing. They are particularly useful where there is a need to analyze large numbers of objects in fast-changing processes, such as seed dose control during sowing [38] or fruit dose control during processing [39]. In other cases, the aim is to diagnose plants in a contact by using color image analysis [40] without the need for specialized measurement instruments. The process of seed scarification, which consists in cutting off a part of cotyledons, is mainly used for the equalization of germination [1,4]. More details on computer vision-based automated scarification are presented in a complementary article [41], which is related to the research presented here. It is obvious that the visual method used in the automatic device described in the present study is non-destructive. The white light illuminator is used to obtain stable lighting. This is critical under normal conditions of container nursery operation, when ambient illumination can disturb the operation of computer vision algorithms. However, it must be noted that this aspect is also examined by researchers in the context of the production of good quality oak seedlings [42] using controlled illumination.

2.2. Measures of the Effectiveness of Seed Health Assessment

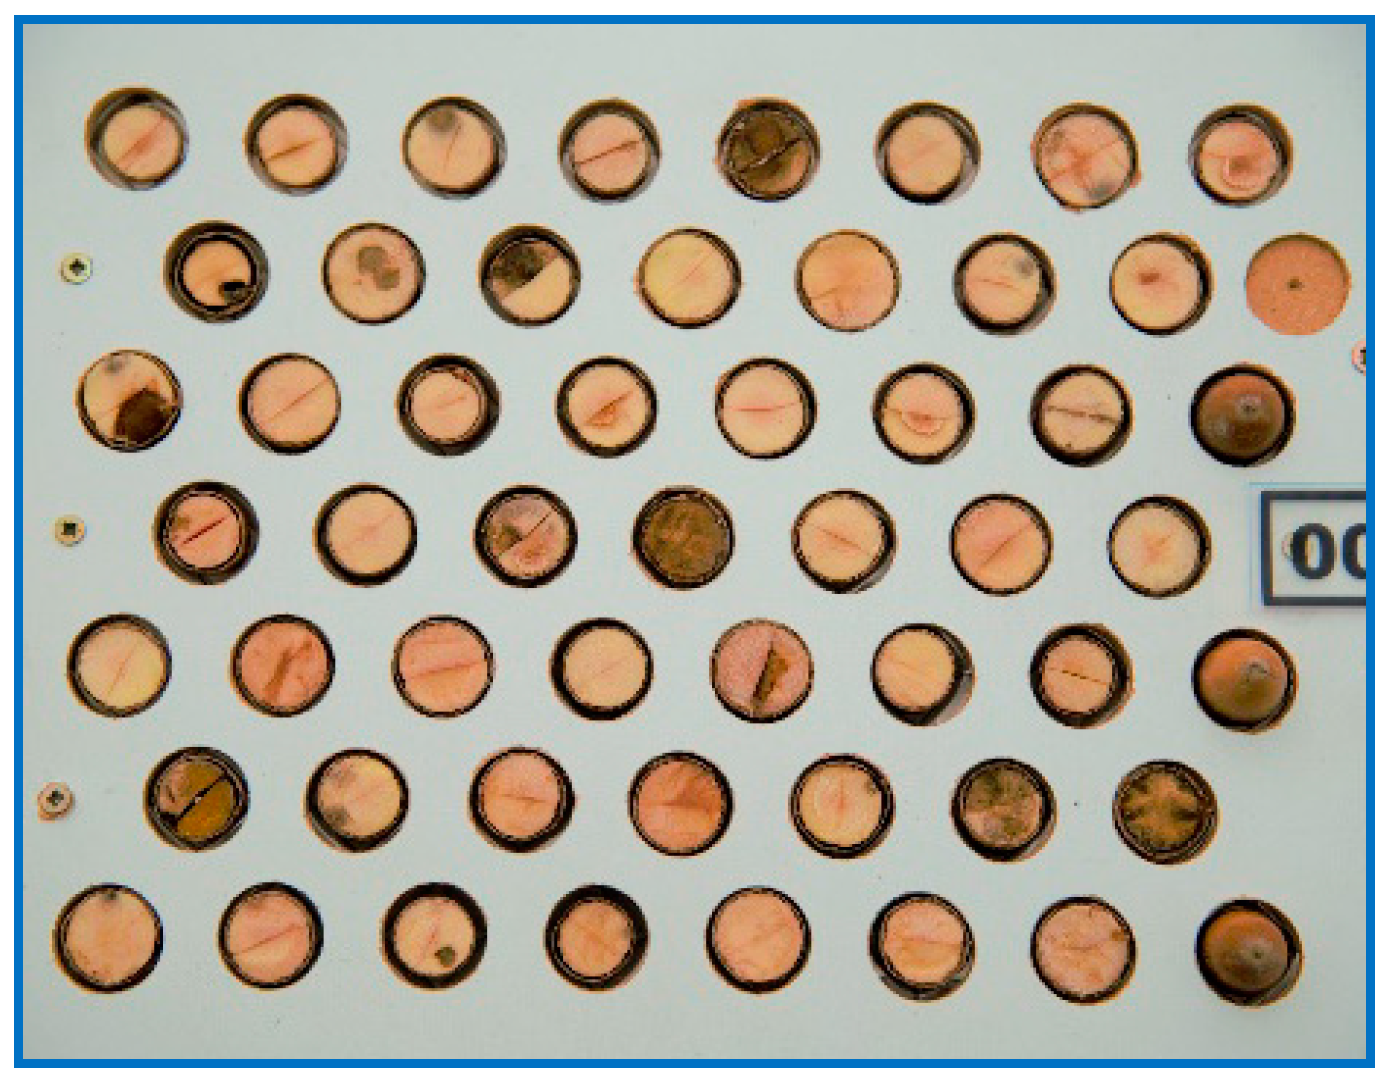
One of the vital parameters of the automatic device that has been subjected to evaluation in this study is the effectiveness of seed sorting by a visual detector of disease changes in acorns. Examining the effectiveness of such a detector in an automated sorting process using different separation features is an important aspect of the research presented here. In the first approach, seed health prediction was performed by means of binary discrimination of the features of the color image of the cross-section. For that purpose, during an in-field experiment that took place in the spring of 2015, 400 images of seeds were collected, along with information about which of them germinated and which were unhealthy. A sample set of 50 seeds is presented in Figure 2. The methodology of the experiment and further analysis is described in the paper Jabłoński et al. [29].
In the present study, the analysis has been extended to include additional features in the form of the red index and green index according to Formulas (1) and (2), where R, G, B are respectively the intensity of the red, green, and blue components in the pixels of the image in question.
ExR = 1.3R − B,
ExG = 2G − R − B,
The collected data were divided into two sets: the training set (240 acorns), and the test set (160 acorns). The values of the green channel, divided into the two sets, are presented in Figure 3a. The courses of performance indexes under assessment are shown in Figure 3b. These are: accuracy (ACC), precision (PPV), the yield of seeds recognized as healthy (UZ), and the effective yield of seeds that were actually healthy (UZS). Here, accuracy (ACC) represents the number of correct diagnoses relative to the total number of seeds that underwent prediction. Precision (PPV) determines the fraction of the number of actually healthy seeds in the group of those that the system qualified as healthy, as shown in Formula (3).
PPV = TP/(TP + FP),
where TP (True Positive) represents true positive identifications, while FP (False Positive) represents false positive identifications. The value of PPV = 1.0 means a prediction without error. The yield (UZ) defined by Formula (4) estimates the fraction of seeds (at a given threshold) that has been classified by the computer system as healthy. This parameter directly indicates the percentage of seeds that ought to be designated for container sowing.
UZ = (TP + FP)/N,
where N—the number of all of the sections assessed. The effective yield (UZS) corresponds to the fraction of seeds that were automatically qualified for sowing in this way, and were truly healthy because they germinated. The actual value can be computed a posteriori only if the result of germination is assessed during vegetation of the seeds.
For economic reasons resulting from the cost of seedling cultivation in container nurseries, it is beneficial to maximize precision (PPV). It is clear that the course of precision depends on the threshold separating healthy seeds from unhealthy ones, but for high values, there is a discrepancy between the test set (the black line, Figure 3b) and the training set (the blue line, Figure 3b). Thus, the maximum accuracy (ACC) was adopted as a threshold criterion for separation. This threshold falls in the center of the diagram, and is more stable in its immediate vicinity. The blue lines marked as (learn) refer to the training set, and the remaining ones refer to the test set. The computer analysis of the seeds was performed using MATLAB R2013a (The MathWorks Inc., Natick, MA, USA) software.

2.3. Methods of Ergonomic Assessment of the User Interface

The device being designed is intended to support container nurseries in the preparation of a high volume of acorns. Although it is expected to run in an autonomous mode, the periodical assistance of the operator is inevitable. He or she must perform the initialization of the system, control stop/run commands, and provide appropriate descriptions of each particular batch of acorns for processing. The end point of the automaton is a control panel i.e., touch-screen display on which the graphical user interface is being rendered by an industrial computer connected to camera modules and programmable controller.
This user interface is a basic element of communication between the operator and the technological system that carries out a given process. Especially in this case, it is important to apply the achievements of ergonomic research related to anthropometry and the psychophysical capabilities of a human being. Moreover, it is necessary to use the knowledge of human cognition, which is often referred to as cognitive science. The functionality of the user interface was examined against conformance with the following standards: PN-EN ISO 9241-210 and EN ISO 9241-210:2010 [43]. In order to investigate the mutual geometric relations of a person and the workstation that is that person’s workplace, the degree of adjustment of the workstation to the worker’s anthropometric data was determined. Then, the ErgoESAER software was used to optimize the analyzed workstation in terms of ergonomics.
In order to analyze the mental involvement of the operator while learning to use the basic interface functions, the Emotiv Excess Post-exercise Oxygen Consumption (EPOC) + neuroheadset was used. This device consists of a headset that has 14 sensors and a dual axis gyroscope that tracks head movements (Figure 4). Electrodes placed on the head measure changes in electric potential on the surface of the skin, and these changes reveal the activity of neurons in the cerebral cortex.

3. Results

In each task for the automatic recognition (or classification) of objects, the key is to choose features on the basis of which required discrimination is made. In the task of seed sorting, the problem of choosing features was indeed unusual, because it was impossible to use typical patterns. Most image recognition tasks use either the shape of the recognized objects (in that case, the natural features are shape factors or geometric moments) or the texture of the objects, in which case the statistical properties of that texture, such as entropy, may be used for recognition. However, in the classification of sections of the acorns acquired in experiment that we performed, neither the shape of objects revealed in the cotyledon section, nor their texture, were useful for recognition by the automaton that had been designed for processing a high volume of acorns under constrained timing. Therefore, the following features were adopted to characterize the images of cross-sections under the present considerations. The average values in the cotyledon region are as follows:
  • Gray—averaged gray levels determined according to the formula:
    Gray = 0.299R + 0.587G + 0.114B,
  • R—averaged red component of section pixels,
  • G—averaged green component of section pixels,
  • B—averaged blue component of section pixels,
  • H—averaged shade of section pixels,
  • S—averaged saturation of section pixels,
  • V—average brightness of section pixels,
  • ExR—averaged red index,
  • ExG—averaged green index.

3.1. Evaluation of Selected Features for Separation of Acorns

The values of the performance indexes that were explained previously in Section 2 and characterize the quality of recognition for these nine global features under analysis are presented in Table 1.
Healthy seeds constitute 49% in the training set, and 40% in the test set. The presented values show that, according to the method adopted, the red component R and the image brightness V make it possible to obtain the best recognition in both the test set and the training set. In these cases, the occurrence of high accuracy is also associated with high precision, which translates into a small discrepancy between the number of seeds assessed as healthy and those that actually germinated. This difference is 9% for the training set, and 11% for the test set.

3.2. Assessment of the Usefulness of Automatic Recognition

The figures in Table 1 reflect the degree of utilization of the sowing material under assessment. The degree of utilization of those container cells into which the seeds qualified as healthy were sown is equal to the precision of recognition, and amounts to 83% for the training set and 76% for the test set. It may therefore be concluded that the use of the visual assessment of seed quality allowed—for the analyzed seed sample—for increasing the utilization of the nursery’s stock by approximately 10% as compared with the method of sowing all of the seeds without their analysis after scarification. Further increase in the utilization of containers using the presented sorting method is possible after the threshold has been increased; however, this is connected with rejecting a larger number of seeds.
The presented results confirm that the performance of vision-based classification of scarified acorns is suitable for controlling the acorn separation unit. The accuracy is comparable with—and in some cases outperforms—the recognition of experienced employees [29]. This makes an image of a section of scarified acorn a promising distributive feature for the automated assessment of acorns with respect to their health.

3.3. Implementation of the Acorn Separation Unit

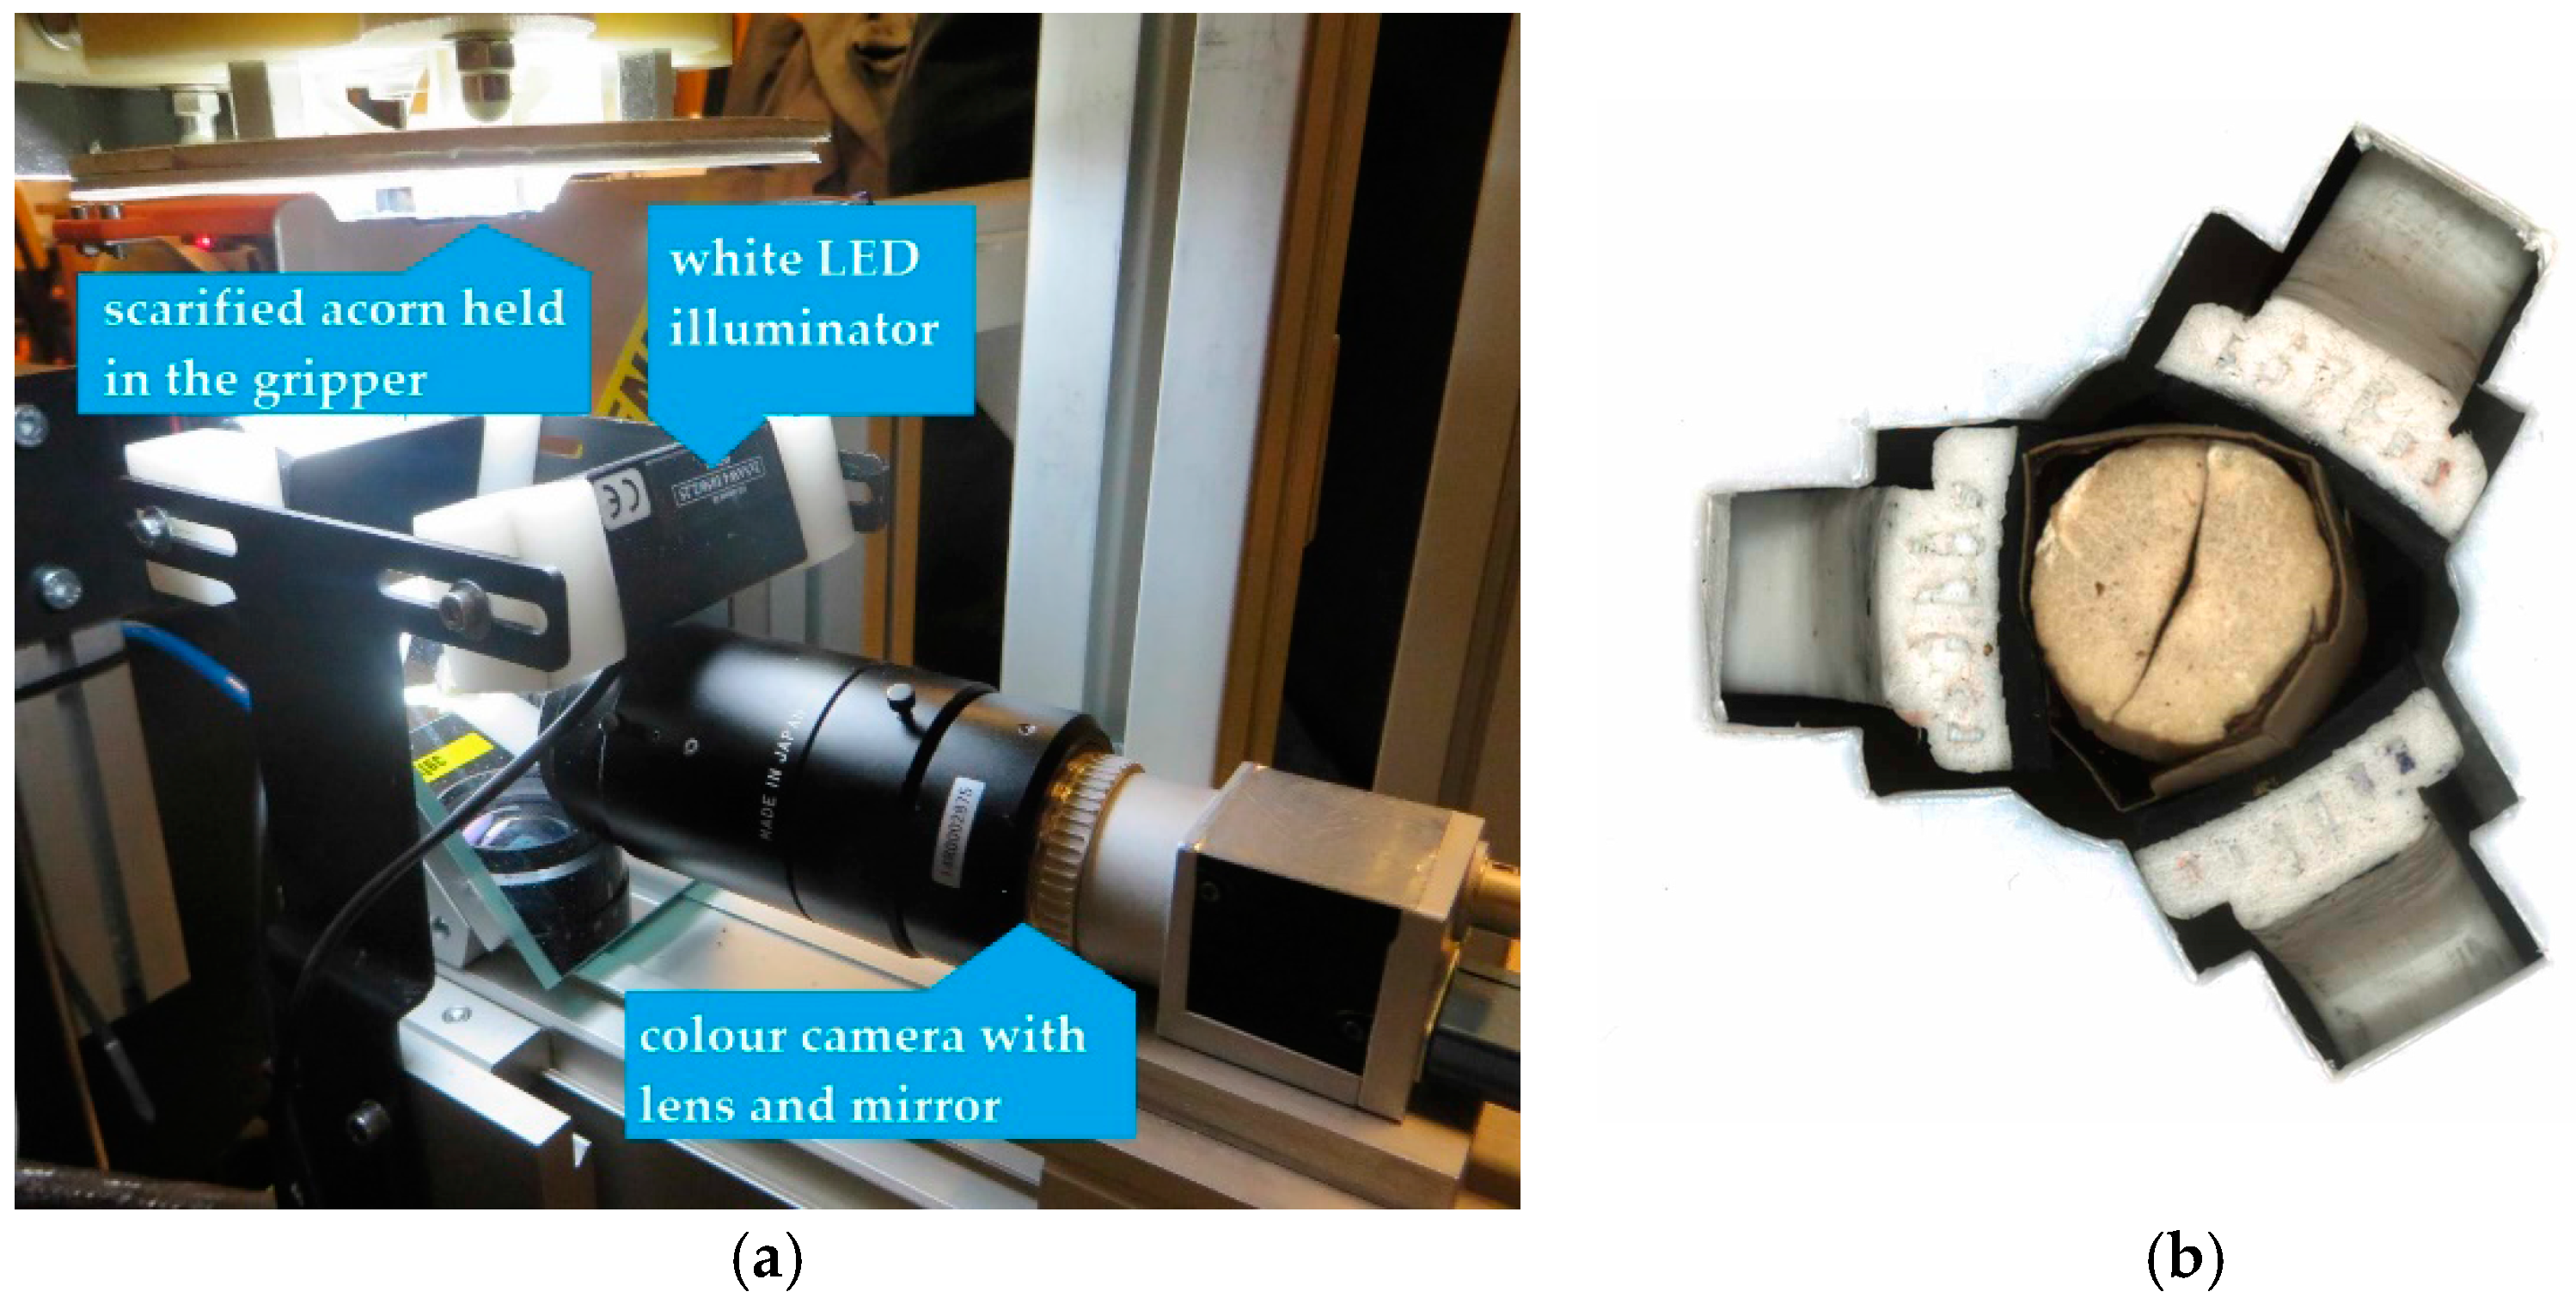
Recognition is performed by a computer vision system that has been designed for the recognition of sections of acorns. Following recognition, the gripper and the separation unit separate the seeds. The gripper is attached to a rotating arm that is triggered by the control unit of the automatic device. An acorn being assessed is fixed by the fingers of the gripper, which move it in a rotary motion over the camera (Figure 5a,b) and further, to the separation unit (Figure 6). The reception baskets are fixed in a single handle, which is attached to a frame. Once released by the fingers of the gripper above the appropriate reception basket, the seed falls through the funnel into the container. The place of the gripper release is automatically controlled on the basis of information obtained from the machine vision unit as a result of computer analysis of the image of the section of an acorn. When the acorn is released, the arm continues to rotate its way to the starting point, where the next seed will be fed to the gripper. The filling levels of containers are controlled by sensors that signal the level of acorns to the control unit, and further to the software module that renders the graphical interface on the control panel.

3.4. Ergonomic Assessment of the User Interface

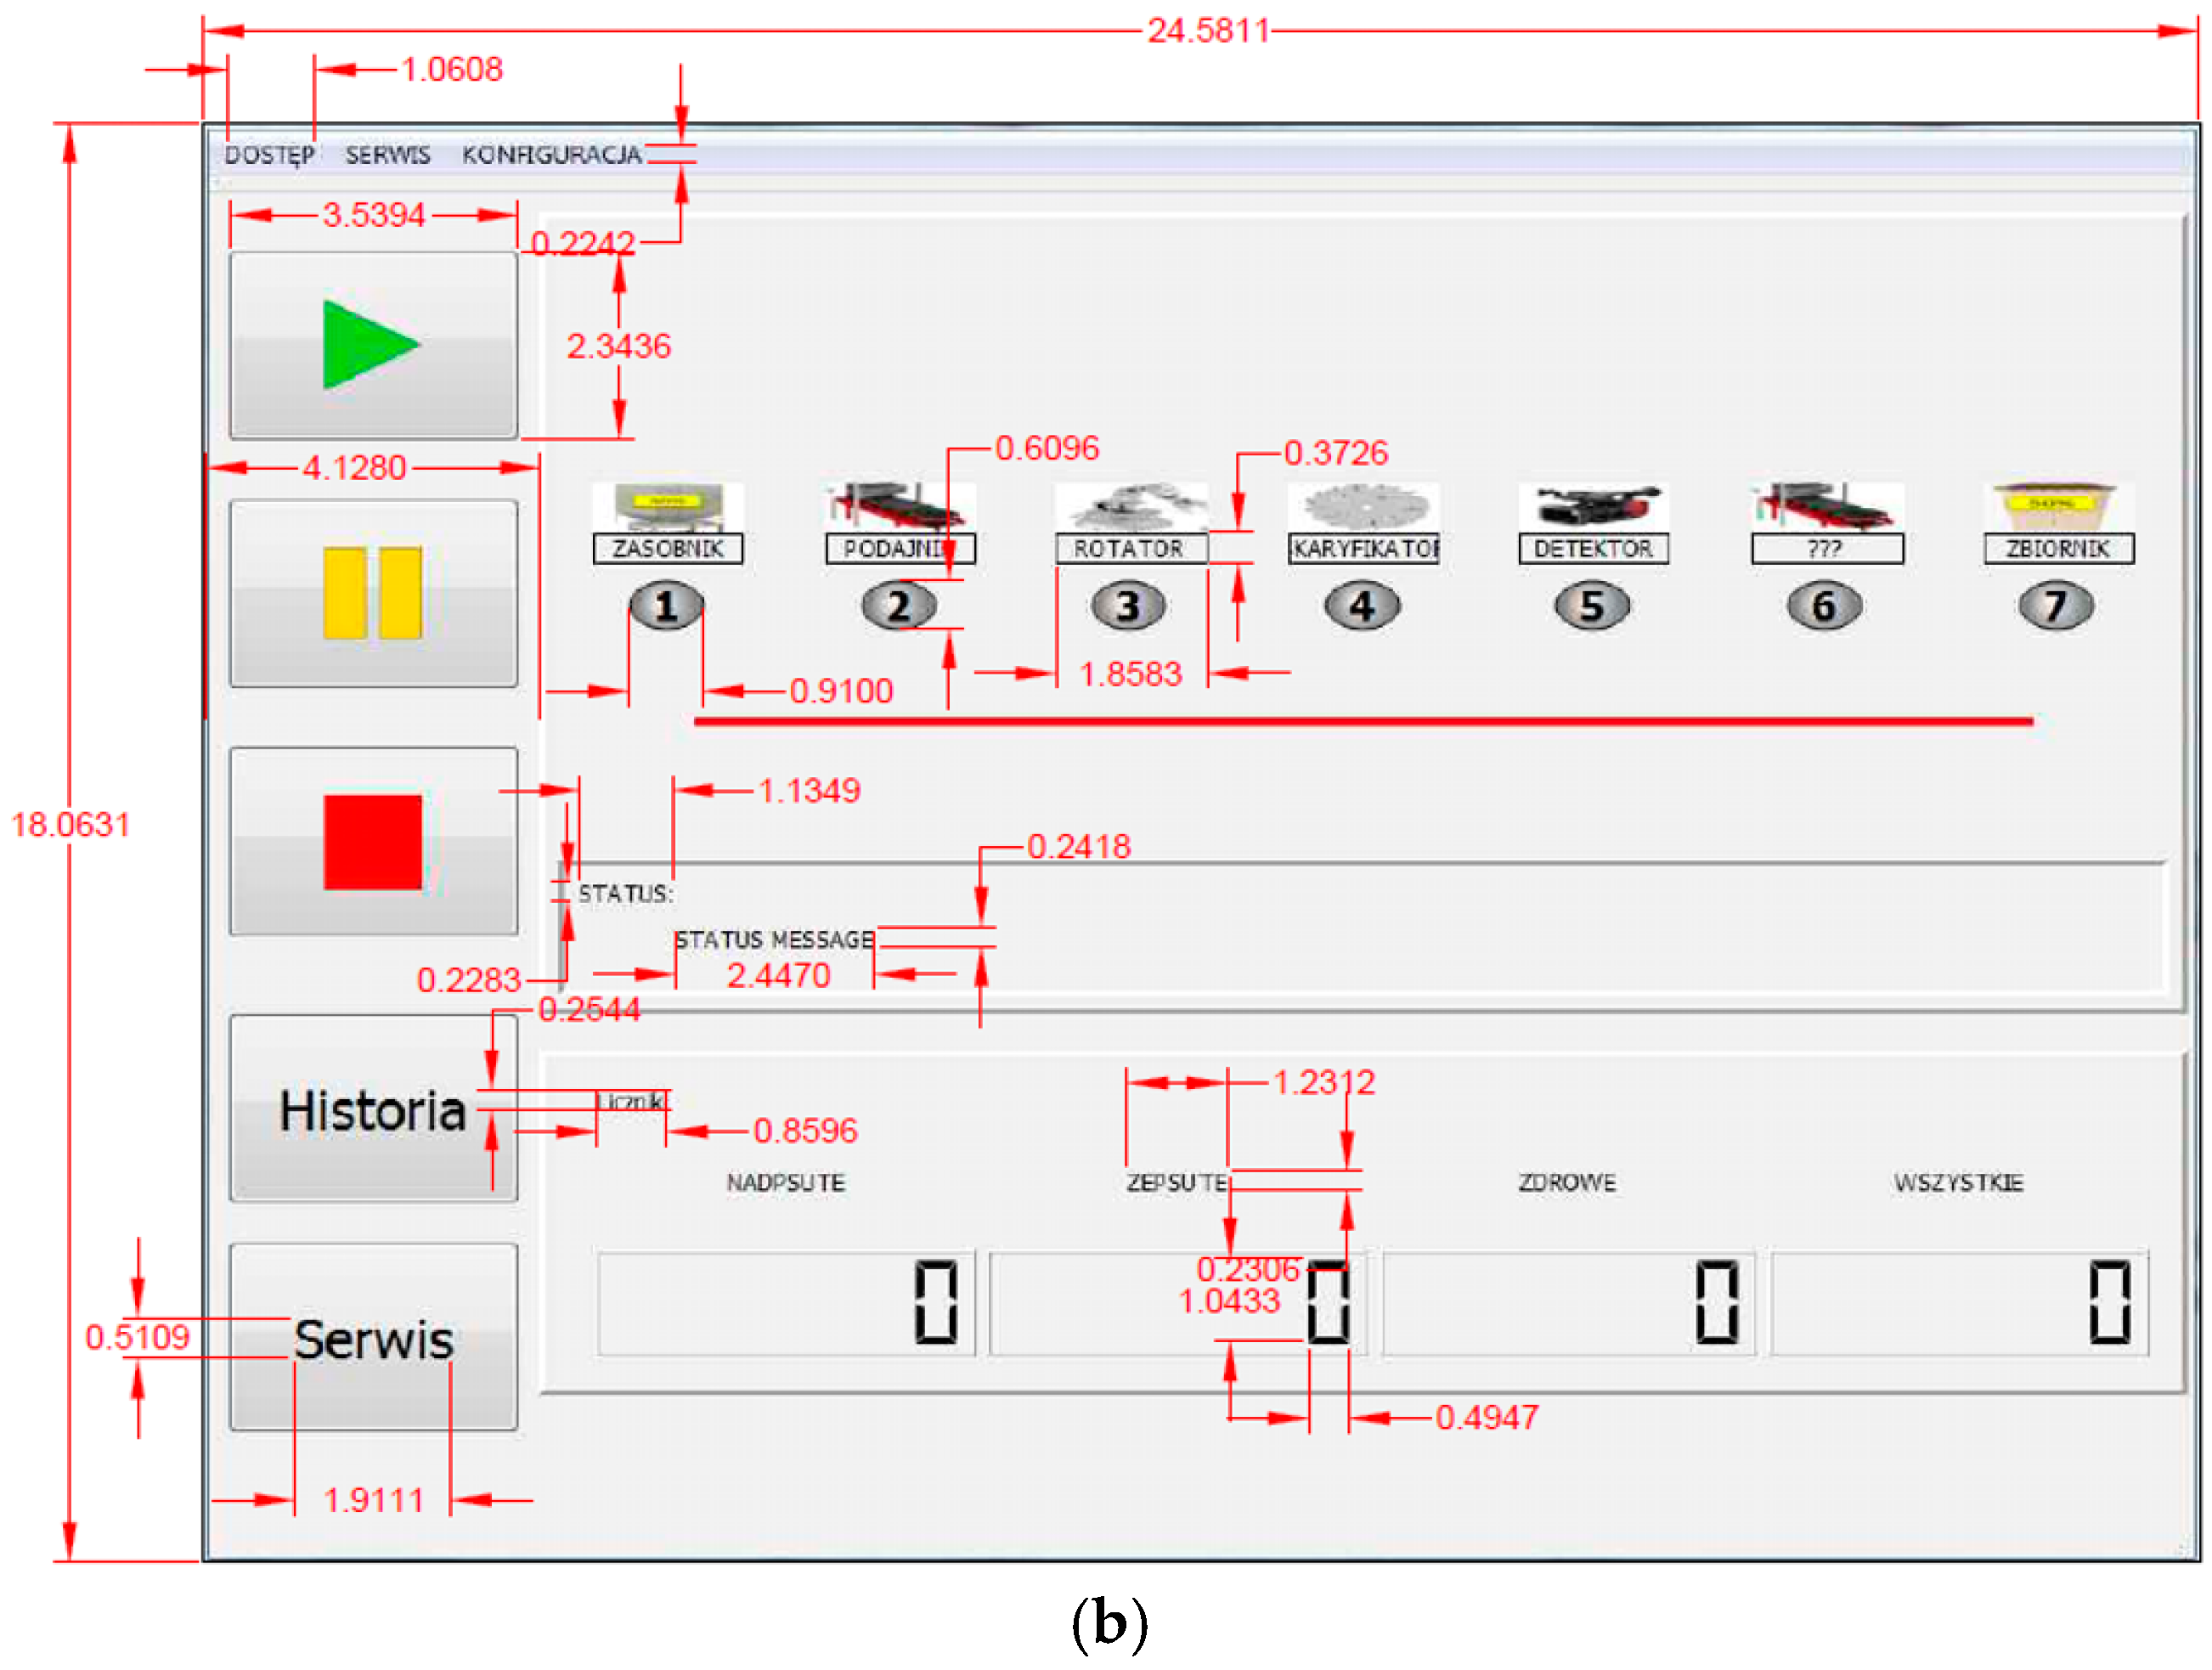
The user interface of the automatic device for acorn scarification should, according to its design assumptions, implement several modes of operation that are necessary for its efficient functioning. The interface under assessment has four operating modes: calibration, continuous operation, service, and history (data analysis), i.e., all of the planned mode. After selecting a particular mode of operation, an interface window is displayed that enables the device to communicate with the user, with a degree of precision appropriate to the programmatically assigned competencies, i.e., user level: calibration, continuous operation; service level (password protected): service, history. Figure 7a,b present the prototype of the user interface of the device, whose idea is ergonomically acceptable while its maximum simplification allows for a reduction of the learning time to the necessary minimum. Assuming that the distance of screen observation by the operators does not exceed 0.5 m and that the minimum height of letters and digits is 2.5 mm, the 12-inch operator panel applied is sufficient.
In light of the above, the interface geometry does not raise any objections, as it respects all of the linear parameters necessary for the free manipulation of human fingertips within the threshold range of centiles, namely: C5—female population, C95—male population (finger thickness—the maximum finger thickness at the metacarpophalangeal joint of a woman: C5 2.2 cm, C50 2.7 cm, C95 3.2 cm; of a man C5 2.6 cm, C50 3,1 cm, C95 3.5 cm; index finger width—the maximum finger width measured at the proximal interphalangeal joint of a woman: C5 1.6 cm, C50 1.9 cm, C95 2.2 cm; of a man C5 1.8 cm, C50 2.1 cm, C95 2.4 cm). The minimum size of the button on the control panel is over 4 cm. The control panel is divided into three windows, i.e., the operating part with the function buttons (off, on, history, and service), the control window of the device operation equipped with icons reflecting the eight key units of the technological process performed by the device during acorn scarification, and the window for viewing the basic operating parameters of the device. The grouping of individual icons into blocks according to their function is correct and reasonable, and their positioning according to the order in which they are used is justified in terms of ergonomics. The layout of the user interface is in accordance with the ISO 11783-6 standard applied in agriculture [44]. When the ON switch is pressed, all of the numeric icons light up in green, indicating that the device is ready for use (after a sequential check of each module’s readiness). If any icon does not light up or lights up in red, it means that the module is not ready to work. In this case, the icon should be pressed, and a message will be displayed for the operator with a list of possible causes of failure. The list of steps required by the checking procedures at each point is displayed and signaled by pressing the pictogram (of access code) of a given control point, which shows the detailed diagram of a given sub-unit with possible points of failure. In addition, the operation is recorded by the system, as well as signaled and archived by the system. Table 2 presents the checklist of ergonomic assessments of the user interface functionality, along with the expert judgment based on PN-EN ISO 9241-210, European Standard EN ISO 9241-210:2010 [43].
Preliminary studies were also conducted on the level of mental involvement while learning to use the basic interface functions. In the experiment, the Emotiv TestBench software tool (Technology, Bioinfomatics, San Francisco, CA, USA) was used (Figure 8). We analyzed the degree of mental involvement of the operator in the course of learning to use the basic interface functions, including supplementation of the data needed to start the device. Taking into account the whole course of the topical characteristics of the person performing the assigned task (Figure 9), it was observed that the relative value of the examined involvement varied between 30% and 40% of the ability of the examined person. The highest increase in mental involvement was observed during data supplementation, where the value of the investigated load reached 90%. This activity was also characterized by the highest amplitude of load indications, which exceeded 80%.
Figure 10 presents the ergonomically optimized settings of the individual components of the workstation, taking into account the rhythm of the work, and corresponding to the standards applicable in enterprises involved in seedling production.
The keyboard is installed at the height of 1.17 m, at the distance of 0.51 m from the operator. The keyboard angle is 9°; additionally, a wrist pad is used. The monitor is located in the central part of the device at the height of 1.69 m with the screen angle of 0.1 m, and the distance from the operator’s eye amounting to 0.51 m.

4. Discussion

An analysis based on the assessment of the cross-section of an acorn is a derivative of viability analysis with the standard cutting method. The analysis takes into account that the latter is a destructive method, and therefore not suitable for the assessment of seeds intended for use in forest management [45]. The cutting test is a tentative method of seed assessment that evaluates the viability of the seeds based on the macroscopic examination of: embryonic development, the condition of cotyledon tissue, and root primordia, as well as internal damage caused by fungi and insects. The assessment is made only on the basis of the external appearance of the longitudinal section through the tissue; hence, the test is the least unreliable in the case of the freshly harvested as well as properly and briefly stored seeds. The following seeds are distinguished: healthy, slightly unsound, unhealthy, damaged by larvae, and empty (without an embryo). Considering the development of the embryo and the topography of mummification changes, it is possible to assess the expected germination ability of seeds, assuming that for healthy seeds it is 100%, for slightly unsound seeds 50%, and that the remaining ones are considered incapable of germination [46]. Unfortunately, in the case of scarification, seed separation is based on the distribution of necrotic foci on the cross-section of an acorn. Irrespective of the severity of scarification, the observer can only see the cotyledon area. Highly intensive scarification significantly accelerates and equalizes germination, as well as increases the precision of the seed health assessment. However, leaving more nutrient reserves in a seed ensures improved embryo development, which results in higher resistance to the negative environmental influence, and positively affects the features of seedlings [28,47,48,49].
During the assessment of acorn health, the observer can make two types of errors: (1) acorns with damaged cotyledons may be classified as unhealthy, although in reality they are only slightly unsound, have a healthy embryo, and do exhibit a certain germination potential; (2) acorns without necrotic lesions in the cotyledon area qualify as healthy, although the mummification of the invisible embryonic root should disqualify it from sowing in container cells. Moreover, the assessment of acorns stored for longer than one year may be subject to additional errors resulting from the discoloration of the cotyledons. However, in spite of the above difficulties, the automation of image recognition processes and the elimination of subjective perception of seed health by the forest nursery staff may result in the optical properties of scarified acorns being an innovative distribution feature with high effectiveness and a high application potential.
An important advantage of visual methods is their low invasiveness, accompanied by the possibility to obtain extensive data, such as size, color, shape and a three-dimensional representation [50,51]. Publications report on the use of machine learning algorithms, which are based on the now popular, biologically inspired, convolutional neural networks (CNN), for the purpose of the identification of plants [52] and their diseases [53], including the use of mobile devices. A review of diagnostic tools and non-invasive methods used in horticulture may be found in Gongal et al. [54].
The general principles of creating computer interfaces are widely known, and a vast majority of them first referred to desktop computers. The on-board computer interfaces used in tractors and agricultural machines are similar, and are also handled by people who use typical PC interfaces every day. According to Juliszewski et al. [30], following adaptation to the needs of assessment or the design of signaling devices on tractors and agricultural machinery, the principles proposed by Banyon and Murray [55] may assume the following form: (a) the system should be adapted to the operator, especially if the user is less adaptable; (b) the system should take into account first of all those characteristics of the operator and the interface that have the greatest impact on their mutual interactions; (c) the system should also take into account the needs of occasional and older users.

5. Conclusions

The separation of scarified acorns through dividing them into healthy, unhealthy, and undefined acorns by means of computer vision has been presented. The best accuracy and precision was observed for two image features: red components, and image brightness. For both, accuracy is also associated with high precision, which reached up to 83%. The performance of separation was also evaluated against the yield of acorns that were recognized as healthy in the given lot. On the basis of the information rendered by this system, the unit that controls the device triggers an actuator of the gripper, so that the acorn is directed to appropriate reception basket. The user interface being assessed in the present study provides the required range of functions that meets the needs of its user, ensuring the ease of understanding, learning, and utilization while performing tasks that are sufficient for precise operation of the automatic device.

Acknowledgments

The research has been carried out as part of implementation of project No. PBS3/A8/34/2015 entitled “The functional model of an automated device with a visual system for scarification and vitality assessment of acorns on the basis of automatic recognition of the topography of mummification changes”. The project has been co-financed by The National Centre for Research and Development (Narodowe Centrum Badań i Rozwoju) under the Applied Research Programme (Program Badań Stosowanych—PBS).

Author Contributions

Józef Walczyk, Paweł Tylek, Ryszard Tadeusiewicz, Tadeusz Juliszewski, Paweł Kiełbasa, Jan Szczepaniak and Florian Adamczyk conceived and designed the experiments; Józef Walczyk, Paweł Tylek, Zdzisław Kaliniewicz conducted bibliography analysis; Józef Walczyk, Paweł Tylek, Mirosław Jabłoński, Tadeusz Juliszewski, Paweł Kiełbasa, Florian Adamczyk, Michał Szaroleta performed the experiments; Józef Walczyk, Paweł Tylek,, Paweł Kiełbasa, Mirosław Jabłoński, Zbigniew Bubliński, Joanna Grabska-Chrząstowska, Mirosław Jabłoński and Florian Adamczyk analyzed the data; Józef Walczyk, Paweł Tylek, Mirosław Jabłoński, Paweł Kiełbasa, Michał Szaroleta contributed reagents/materials/analysis tools; Paweł Tylek, Florian Adamczyk, Paweł Kiełbasa, Ryszard Tadeusiewicz, wrote the paper; Ryszard Tadeusiewicz coordinated work on computer-vision system; Mirosław Jabłoński designed computer-vision system; Zbigniew Bubliński and Joanna Grabska-Chrząstowska studied the suitability of various features of the considered images; Tadeusz Juliszewski, Paweł Kiełbasa evaluated ergonomic aspects of the user interface; Józef Walczyk, Paweł Tylek, analysed the impact of scarification on the quality of acorns seedlings; Florian Adamczyk, Michał Szaroleta, Jan Szczepaniak designed mechanical part of the automaton and analysed its properties during operation.

Conflicts of Interest

The authors declare no conflict of interest. The founding sponsors had no role in the design of the study; in the collection, analyses, or interpretation of data; in the writing of the manuscript, and in the decision to publish the results.

References

  1. Andrzejczyk, T. Dąb Szypułkowy i Bezszypułkowy: Hodowla; Powszechne Wydawnictwo Rolnicze i Leśne (PWRiL): Warszawa, Poland, 2009; p. 328. ISBN 978-83-09-99017-8. [Google Scholar]
  2. Rodriguez-Campos, A.; Diaz-Maroto, I.J.; Barcala-Perez, E.; Vila-Lameiro, P. Comparison of the autoecology of Quercus robur L. and Q. petraea (Mattuschka) Liebl. Stands in the Northwest of the Iberian Peninsula. Ann. For. Res. 2010, 53, 7–25. [Google Scholar]
  3. Schröder, T.; Kehr, R.; Procházková, Z.; Sutherland, J.R. Practical methods for estimating the infection rate of Quercus robur acorn seedlots by Ciboria batschiana. For. Pathol. 2004, 3, 187–196. [Google Scholar] [CrossRef]
  4. Kühne, C.; Bartsch, N. Germination of acorns and development of oak seedlings (Quercus robur L.) following flooding. J. For. Sci. 2007, 53, 391–399. [Google Scholar]
  5. Madsen, P.; Lof, M. Reforestation in southern Scandinavia using direct seeding of oak (Quercus robur L.). Forestry 2005, 1, 55–64. [Google Scholar] [CrossRef]
  6. Khasa, D.P.; Fung, M.; Logan, B. Early growth response of container-grown selected woody boreal seedlings in amended composite tailings and tailings sand. Bioresour. Technol. 2005, 96, 857–864. [Google Scholar] [CrossRef] [PubMed]
  7. Kormanek, M.; Banach, J.; Sowa, P. Effect of soil bulk density on forest tree seedlings. Int. Agrophys. 2015, 29, 67–74. [Google Scholar] [CrossRef]
  8. Banach, J.; Skrzyszewska, K.; Świeboda, Ł. Substrate influences the height of one- and two-year-old seedlings of silver fir and European beech growing in polystyrene containers. Leśn. Pr. Badaw. 2013, 74, 117–125. (In Polish) [Google Scholar] [CrossRef]
  9. Szabla, K.; Pabian, R. New Technologies and Techniques in the Container Nursery System; Centrum Informacyjne Lasów Państwowych (CILP): Warszawa, Poland, 2003; ISBN 8389-7448-05. (In Polish) [Google Scholar]
  10. Walczyk, J.; Tylek, P. Mechanizacja zabiegu sterowanej mikoryzacji sadzonek drzew leśnych i siewu punktowego. Sylwan 2009, 3, 197–202. [Google Scholar]
  11. Tylkowski, T.; Bujarska-Borkowska, B. Effect of acorn size and sowing depth on Quercus robur and Q. petraea seedling emergence and height. Sylwan 2011, 3, 159–170. (In Polish) [Google Scholar]
  12. Barzdajn, W. Wykorzystanie zmienności dębów w hodowli lasu. In Elementy Genetyki i Hodowli Selekcyjnej Drzew Leśnych, 1st ed.; Sabor, J., Ed.; Centrum Informacyjne Lasów Państwowych (CILP): Warszawa, Poland, 2006; pp. 231–240. ISBN 83-88478-21-4. [Google Scholar]
  13. Tylek, P. Wielkość i kształt jako cechy rozdzielcze nasion dębu szypułkowego (Quercus robur L.). Acta Agrophys. 2012, 19, 673–687. [Google Scholar]
  14. Kuc, T.; Aleksandrowicz-Trzcińska, M. Sterowana mikoryzacja i doglebowa aplikacja fungicydów w hodowli dębu szypułkowego. I. Kolonizacja mikoryzowa i wzrost sadzonek z zakrytym systemem korzeniowym w szkółce. Sylwan 2012, 10, 765–775. [Google Scholar]
  15. Szabla, K. Hodowlane i ekonomiczne aspekty produkcji materiału sadzeniowego z zakrytym systemem korzeniowym poddanego zabiegowi sterowanej mikoryzacji. Sylwan 2009, 153, 253–259. [Google Scholar]
  16. Kantorowicz, W. Half century of seed years in major tree species in Poland. Silvae Genet. 2000, 49, 245–249. [Google Scholar]
  17. Suszka, B.; Muller, C.; Bonnet-Masimbert, M. The Seeds of Deciduous Forest Trees from Their Harvesting to Sowing; Wydawnictwo Naukowe PWN: Warszawa, Poland, 2000; ISBN 83011-33430. (In Polish) [Google Scholar]
  18. Kaliniewicz, Z.; Markowski, P.; Anders, A.; Tylek, P.; Krzysia, Z.; Fura, S. Wpływ wieku drzewostanu macierzystego na wybrane cechy fizyczne nasion świerka pospolitego. Sylwan 2017, 161, 548–557. [Google Scholar]
  19. Kaliniewicz, Z.; Tylek, P.; Markowski, P.; Anders, A.; Rawa, T.; Jóźwiak, K.; Fura, S. Correlations between the Germination Capacity and Selected Physical Properties of Scots Pine (Pinus sylvestris L.). Balt. For. 2013, 19, 201–211. [Google Scholar]
  20. Walczyk, J. Mechanizacja prac leśnych w ochronie bioróżnorodności. In Elementy Genetyki i Hodowli Selekcyjnej Drzew Leśnych; Sabor, J., Ed.; Centrum Informacyjne Lasów Państwowych (CILP): Warszawa, Poland, 2006; pp. 473–483. ISBN 83-88478-21-4. [Google Scholar]
  21. Kaliniewicz, Z.; Tylek, P.; Anders, A.; Markowski, P.; Rawa, T.; Oldakowski, M.; Wasowski, L. An Analysis of the Physical Properties of Seeds of Selected Deciduous Tree Species. Balt. For. 2016, 22, 169–174. [Google Scholar]
  22. Szumowski, B. Nowe technologie i techniki stosowane w Leśnym Banku Genów Kostrzyca. Postęp. Tech. Leśn. 2002, 82, 34–42. [Google Scholar]
  23. Tylek, P.; Kaliniewicz, Z.; Kiełbasa, P.; Zagrobelny, T. Mass and density as separation criteria of pedunculate oak (Quercus robur L.) seeds. Electron. J. Pol. Agric. Univ. Ser. For. 2015, 18. Available online: http://www.ejpau.media.pl/volume18/issue4/art-05.html (accessed on 17 December 2017).
  24. Bąk-Badowska, J.; Żeber-Dzikowska, I.; Chmielewski, J. Evaluation of the degree of healthiness of the pedunculate oak (Quercus robur L.) acorns in the Włoszczowa-Jędrzejów Nature Park and its neighbouring area. Ochr. Srodowiska Zasobów Nat. 2017, 28, 14–19. [Google Scholar] [CrossRef]
  25. Knudsen, I.M.B.; Thomsen, K.A.; Jensen, B.; Poulsen, K.M. Effect of hot water treatment, biocontrol agents, disinfectants and a fungicide on storability of English oak acorns and control of the pathogen, Ciboria batschiana. For. Pathol. 2004, 1, 47–64. [Google Scholar] [CrossRef]
  26. Adamczyk, F.; Tylek, P.; Szczepaniak, J.; Szaroleta, M.; Walczyk, J.; Juliszewski, T.; Kiełbasa, P.; Tadeusiewicz, R.; Jabłoński, M.; Piłat, A. Automatyzacja skaryfikacji żołędzi jako metoda uszlachetniania materiału siewnego. In Wybrane Zagadnienia Ekologiczne we Współczesnym Rolnictwie. Monografia t. 10; Zbytek, Z., Ed.; Przemysłowy Instytut Maszyn Rolniczych: Poznań, Poland, 2017; pp. 75–84. ISBN 978-83-940788-8-1. [Google Scholar]
  27. Granitto, P.; Navone, H.; Verdes, P.; Ceccatto, H. Weed seeds identification by machine vision. Comput. Electron. Agric. 2002, 33, 91–103. [Google Scholar] [CrossRef]
  28. Giertych, M.J.; Suszka, J. Consequences of cutting off distal ends of cotyledons of Quercus robur acorns before sowing. Ann. For. Sci. 2011, 68, 433–442. [Google Scholar] [CrossRef]
  29. Jabłoński, M.; Tylek, P.; Walczyk, J.; Tadeusiewicz, R.; Piłat, A. Colour-based binary discrimination of scarified quercus robur acorns under varying illumination. Sensors 2016, 16, 1319. [Google Scholar] [CrossRef] [PubMed]
  30. Juliszewski, T.; Kiełbasa, P. Urządzenia Sygnalizacyjne Ciągników i Maszyn Rolniczych; Powszechne Wydawnictwo Rolnicze i Leśne (PWRiL): Poznań, Poland, 2010; ISBN 978-83-09-99034-5. [Google Scholar]
  31. Przybyło, J.; Kańtoch, E.; Jabłoński, M.; Augustyniak, P. Distant. Metrol. Meas. Syst. 2016, 23, 579–592. [Google Scholar]
  32. Złowodzki, M.; Juliszewski, T. Ergonomia Wobec Obciążeń measurement of plethysmographic signal in various lighting conditions using configurable frame-rate camera Praca Umysłową. In Obciążenie Psychiczne Pracą-Nowe Wyzwania Dla Ergonomii; Komitet Ergonomii PAN: Kraków, Poland, 2011; pp. 7–20. ISBN 978-83-61236-14-6. [Google Scholar]
  33. Grandjean, E. Physiologische Arbeitsgestaltung. Zeitschrift für Präventivmedizin 1958, 3, 253–260. [Google Scholar] [CrossRef]
  34. Tadeusiewicz, R.; Chaki, R.; Chaki, N. Exploring Neural Networks with C#; CRC Press, Taylor & Francis Group: Boca Raton, FL, USA, 2014; ISBN 978-1-4822-3339-1. [Google Scholar]
  35. Hagerer, P.; Köbsell, H. Erste systemergonomische Untersuchungen einer Arbeitsgestaltung beim Mähdrescher. Grundl. Landtech. 1986, 36, 87–93. [Google Scholar]
  36. Przybyło, J.; Jabłoński, M.; Pociecha, D.; Tadeusiewicz, R.; Piłat, A.; Walczyk, J.; Kiełbasa, P.; Szczepaniak, J.; Adamczyk, F. Application of model-based design in algorithms’ prototyping for experimental acorn scarification rig. J. Res. Appl. Agric. Eng. 2017, 62, 166–170. [Google Scholar]
  37. Jabłoński, M.P.; Tadeusiewicz, R. Vision-based detection of events using line-scan camera. In Proceedings of the 2016 Second International Conference on Event-based Control, Communication, and Signal Processing (EBCCSP), Krakow, Poland, 13–15 June 2016; pp. 1–3. [Google Scholar]
  38. Mangus, D.L.; Sharda, A.; Flippo, D.; Strasser, R.; Griffin, T. Development of high-speed camera hardware and software package to evaluate real-time electric seed meter accuracy of a variable rate planter. Comput. Electron. Agric. 2017, 142, 314–325. [Google Scholar] [CrossRef]
  39. Durand-Petiteville, A.; Vougioukas, S.; Slaughter, D.C. Real-time segmentation of strawberry flesh and calyx from images of singulated strawberries during postharvest processing. Comput. Electron. Agric. 2017, 142, 298–313. [Google Scholar] [CrossRef]
  40. Reyes, J.F.; Correa, C.; Zúñiga, J. Reliability of different color spaces to estimate nitrogen SPAD values in maize. Comput. Electron. Agric. 2017, 143, 14–22. [Google Scholar] [CrossRef]
  41. Tadeusiewicz, R.; Tylek, P.; Adamczyk, A.; Kiełbasa, P.; Jabłoński, M.; Pawlik, P.; Piłat, P.; Walczyk, J.; Szczepaniak, J.; Juliszewski, T.; et al. Automation of the acorn scarification process as a contribution to sustainable forest management. Case study: Common oak. Sustainability 2017, 9, 2276. [Google Scholar] [CrossRef]
  42. Smirnakou, S.; Ouzounis, T.; Radoglou, K.M. Continuous spectrum LEDs promote seedling quality traits and performance of quercus ithaburensis var. macrolepis. Front. Plant Sci. 2017, 8, 188. [Google Scholar] [CrossRef] [PubMed]
  43. International Organization for Standardization. Ergonomics of Human-System Interaction—Part 210: Human-Centred Design for Interactive Systems; ISO 9241-210:2010; International Organization for Standardization: Geneva, Switzerland, 2010. [Google Scholar]
  44. International Organization for Standardization. Tractors and Machinery for Agriculture and Forestry—Serial Control and Communications Data Network—Part 6: Virtual Terminal; ISO 11783-6:2004; International Organization for Standardization: Geneva, Switzerland, 2004. [Google Scholar]
  45. Załęski, A.; Aniśko, E.; Kantorowicz, W. Zasady oceny nasion w Lasach Państwowych. In Elementy genetyki i Hodowli Selekcyjnej Drzew Leśnych; Sabor, J., Ed.; Centrum Informacyjne Lasów Państwowych (CILP): Warszawa, Poland, 2006; pp. 317–326. ISBN 83-88478-21-4. [Google Scholar]
  46. Załęski, A. Zasady i Metodyka Oceny Nasion w Lasach Państwowych; Centrum Informacyjne Lasów Państwowych (CILP): Warszawa, Poland, 2000; ISBN 83-88478-14-1. [Google Scholar]
  47. Ch’ng, P.E.; Abdullah, M.H.R.O.; Mathai, E.J.; Yunu, N.A. Some physical properties of ginkgo nuts and kernels. Int. Agrophys. 2013, 27, 485–489. [Google Scholar] [CrossRef]
  48. Francisco, G.C.; Jordán, E.M.; Eustaquio, G.P. Influence of cotyledon removal on early seedling growth in Quercus robur L. Ann. For. Sci. 2003, 60, 69–73. [Google Scholar] [CrossRef]
  49. Hou, X.; Yi, X.; Yang, Y.; Liu, W. Acorn germination and seedling survival of Q. variabilis: Effects of cotyledon excision. Ann. For. Sci. 2010, 67, 711. [Google Scholar] [CrossRef]
  50. Liu, S.; Acosta-Gamboa, L.M.; Huang, X.; Lorence, A. Novel low cost 3d surface model reconstruction system for plant phenotyping. J. Imaging 2017, 3, 39. [Google Scholar] [CrossRef]
  51. Montagnoli, A.; Terzaghi, M.; Fulgaro, N.; Stoew, B.; Wipenmyr, J.; Ilver, D.; Rusu, C.; Scippa, G.S.; Chiatante, D. Non-destructive phenotypic analysis of early stage tree seedling growth using an automated stereovision imaging method. Front. Plant Sci. 2016, 7, 1–12. [Google Scholar] [CrossRef] [PubMed]
  52. Grinblat, G.L.; Uzal, L.C.; Larese, M.G.; Granitto, P.M. Deep learning for plant identification using vein morphological patterns. Comput. Electron. Agric. 2016, 127, 418–424. [Google Scholar] [CrossRef]
  53. Ramcharan, A.; Baranowski, K.; McCloskey, P.; Ahamed, B.; Legg, J.; Hughes, D. Deep learning for image-based cassava disease detection. Front. Plant Sci. 2017, 8, 1852. [Google Scholar] [CrossRef] [PubMed]
  54. Gongal, A.; Amatya, S.; Karkee, M.; Zhang, Q.; Lewis, K. Sensors and systems for fruit detection and localization: A review. Comput. Electron. Agric. 2015, 116, 8–19. [Google Scholar] [CrossRef]
  55. Banyon, D.; Murray, D. Applying user modeling to human-computer interaction design. Artif. Intell. Rev. 1993, 7, 199–225. [Google Scholar] [CrossRef]
Figure 1. A virtual three-dimensional (3D) model of the acorn seed sorting system. 1—reception basket; 2—transport channel; 3—sorting system frame.
Sustainability 09 02370 g001
Figure 2. The topology of a container, with seeds ready for sowing in the designated container cells, used in container cultures of oak seedlings.
Sustainability 09 02370 g002
Figure 3. Binary seed discrimination with respect to the average value of the normalized green channel (G) of the cross-sectional image: (a) a division into the training set (blue) and the test set (black), marker ‘o’—seeds that germinated; marker ‘+’—seeds that did not germinate; (b) the course of the quantitative indexes of health prediction as a function of the threshold, the marker ‘O’ indicates the threshold for achieving the maximum accuracy (ACC); the data come from a field experiment conducted in the spring of 2015.
Sustainability 09 02370 g003
Figure 4. The Emotiv EPOC neuroheadset.
Sustainability 09 02370 g004
Figure 5. A machine-vision based detector of changes in acorns: (a) view of the gripper above the camera module; (b) a sample cross-section of an acorn fixed by the gripper, as recorded by a camera.
Sustainability 09 02370 g005
Figure 6. The gripper and the receiving baskets of the separation unit.
Sustainability 09 02370 g006
Figure 7. The layout of user interface: (a) service menu screen; (b) main menu screen.
Sustainability 09 02370 g007aSustainability 09 02370 g007b
Figure 8. Sample ElectroEncephaloGram (EEG) waveform captured by Emotiv EPOC neuroheadset.
Sustainability 09 02370 g008
Figure 9. The degree of the operator’s involvement during the operation of the device interface.
Sustainability 09 02370 g009
Figure 10. The result of workstation geometry optimization for C50 (a) male; (b) female.
Sustainability 09 02370 g010
Table 1. Effectiveness of health prediction for different features. ACC: accuracy, PPV: precision; UZ: yield of seeds recognized as healthy; UZD: effective yield of seeds that were actually healthy.
FeatureTraining SetFeatureTest Set
ACCPPVUZ %UZS %ACCPPVUZ %UZS %
Gray0.850.805746Gray0.830.734936
R0.850.835343R0.830.764635
G0.850.805846G0.830.734936
B0.840.805645B0.820.735036
H0.820.795543H0.800.744332
S0.650.597746S0.530.468338
V0.850.835343V0.830.764635
ExR0.810.755945ExR0.790.685336
ExG0.850.815545ExG0.810.724834
Table 2. The checklist for the functional assessment of the user interface.
Item No.Interface Functionality AssessedAssessment Result
PositiveNegative
1Visual clarity—the information displayed on the screen should be clear, well-organized, unambiguous, and legibleX
2Dialogue consistency—the system’s behavior and appearance should be consistent throughout its operationX
3Conformity with expectations—the way it works should be consistent with the user’s habits and expectationsX
4Information confirmations—users should receive clear confirmations of what part of the system they are located in, what actions they had taken, whether the actions were successful, and what should be done nextX
5Transparency—the system and its structure should be transparent to the userX
6System functionality—thanks to suitably matched functionality the system should meet the needs and requirements of the user while performing tasksX
7Flexibility and control by the user—the system should be flexible in terms of structure, information presentation, and handling to meet the needs and requirements of different users and give them a sense of total control over the systemX
8The information displayed on the screen should be clear, well-organized, unambiguous, and legible; and the system should be designed so as to minimize the risk of user errors by using built-in mechanisms to detect and correct those errors that will occur. Users should be able to check the data entered, correct mistakes, or the information displayed on the screen should be clear, well-organized, unambiguous and legibleX
9User guide and support—the system should guide the user through the stages of the task and provide appropriate information support both on-line (from the system) and via printed documentationX