
The Influence of Natura 2000 Sites on Land-Taking Processes at the Regional Level: An Empirical Analysis Concerning Sardinia (Italy)


Abstract
:1. Introduction
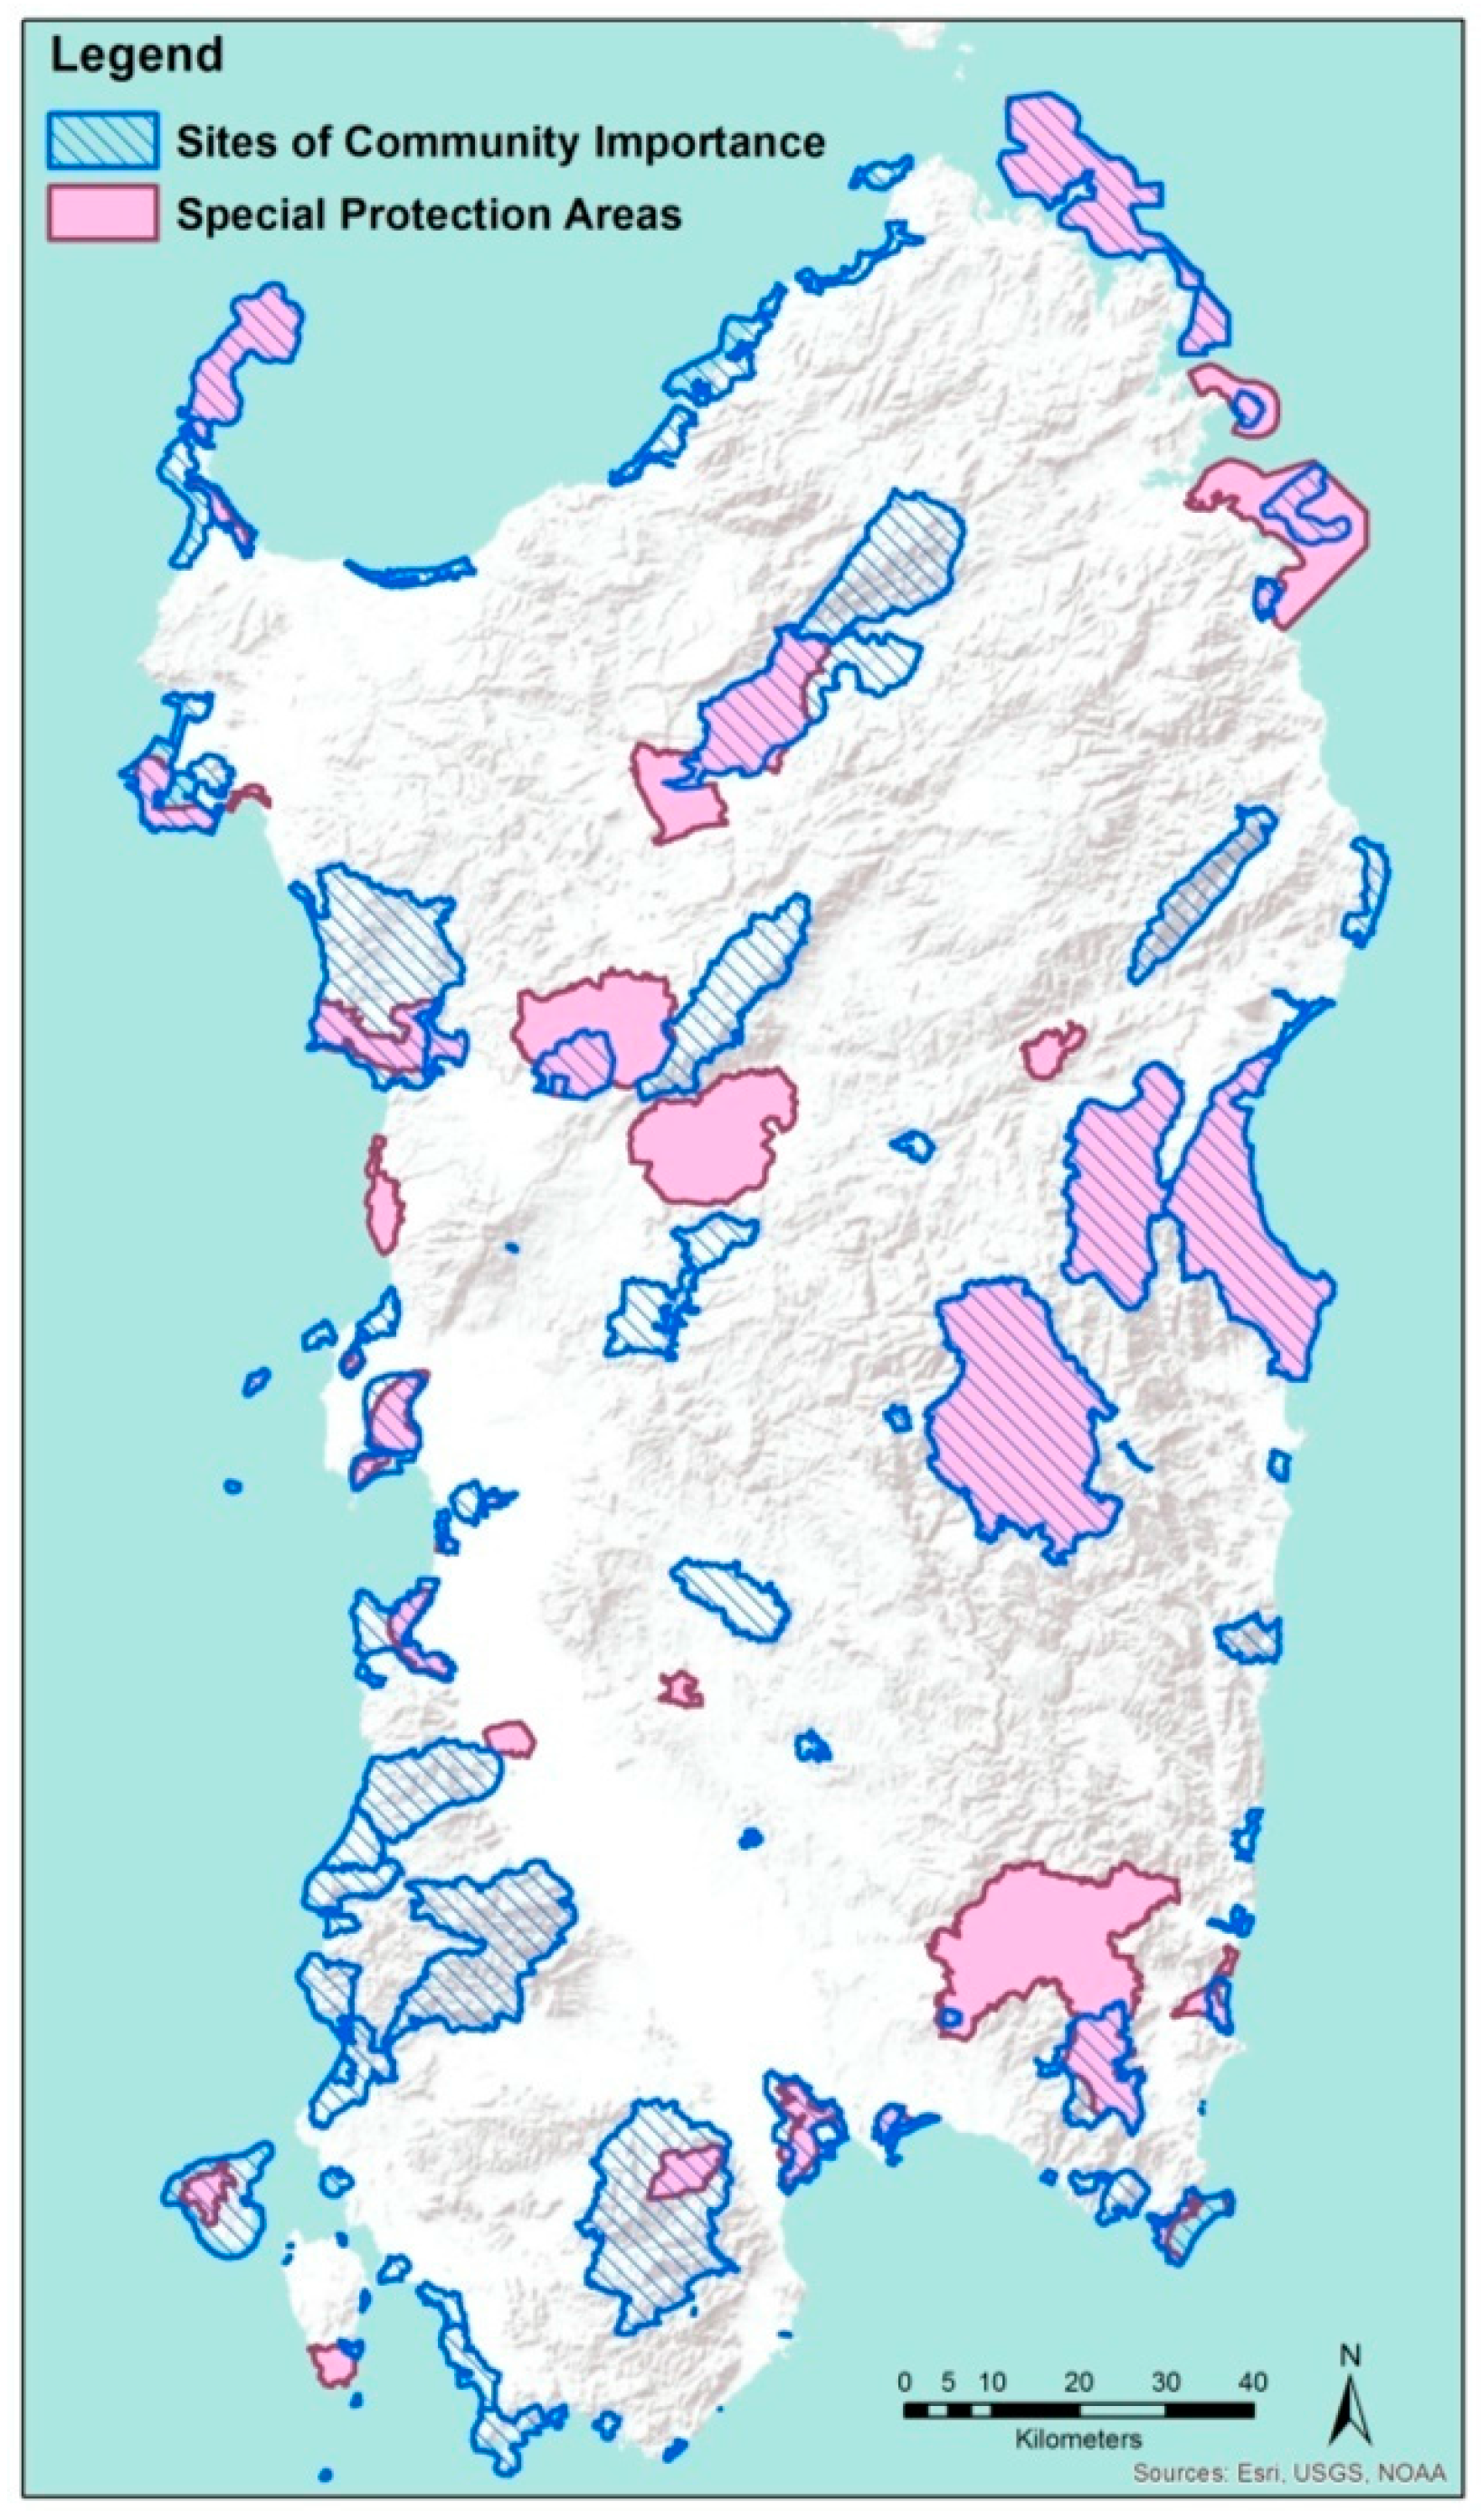
2. Study Area: The Sardinian Natura 2000 Network
3. Materials and Methods
3.1. Defining and Measuring Land Take
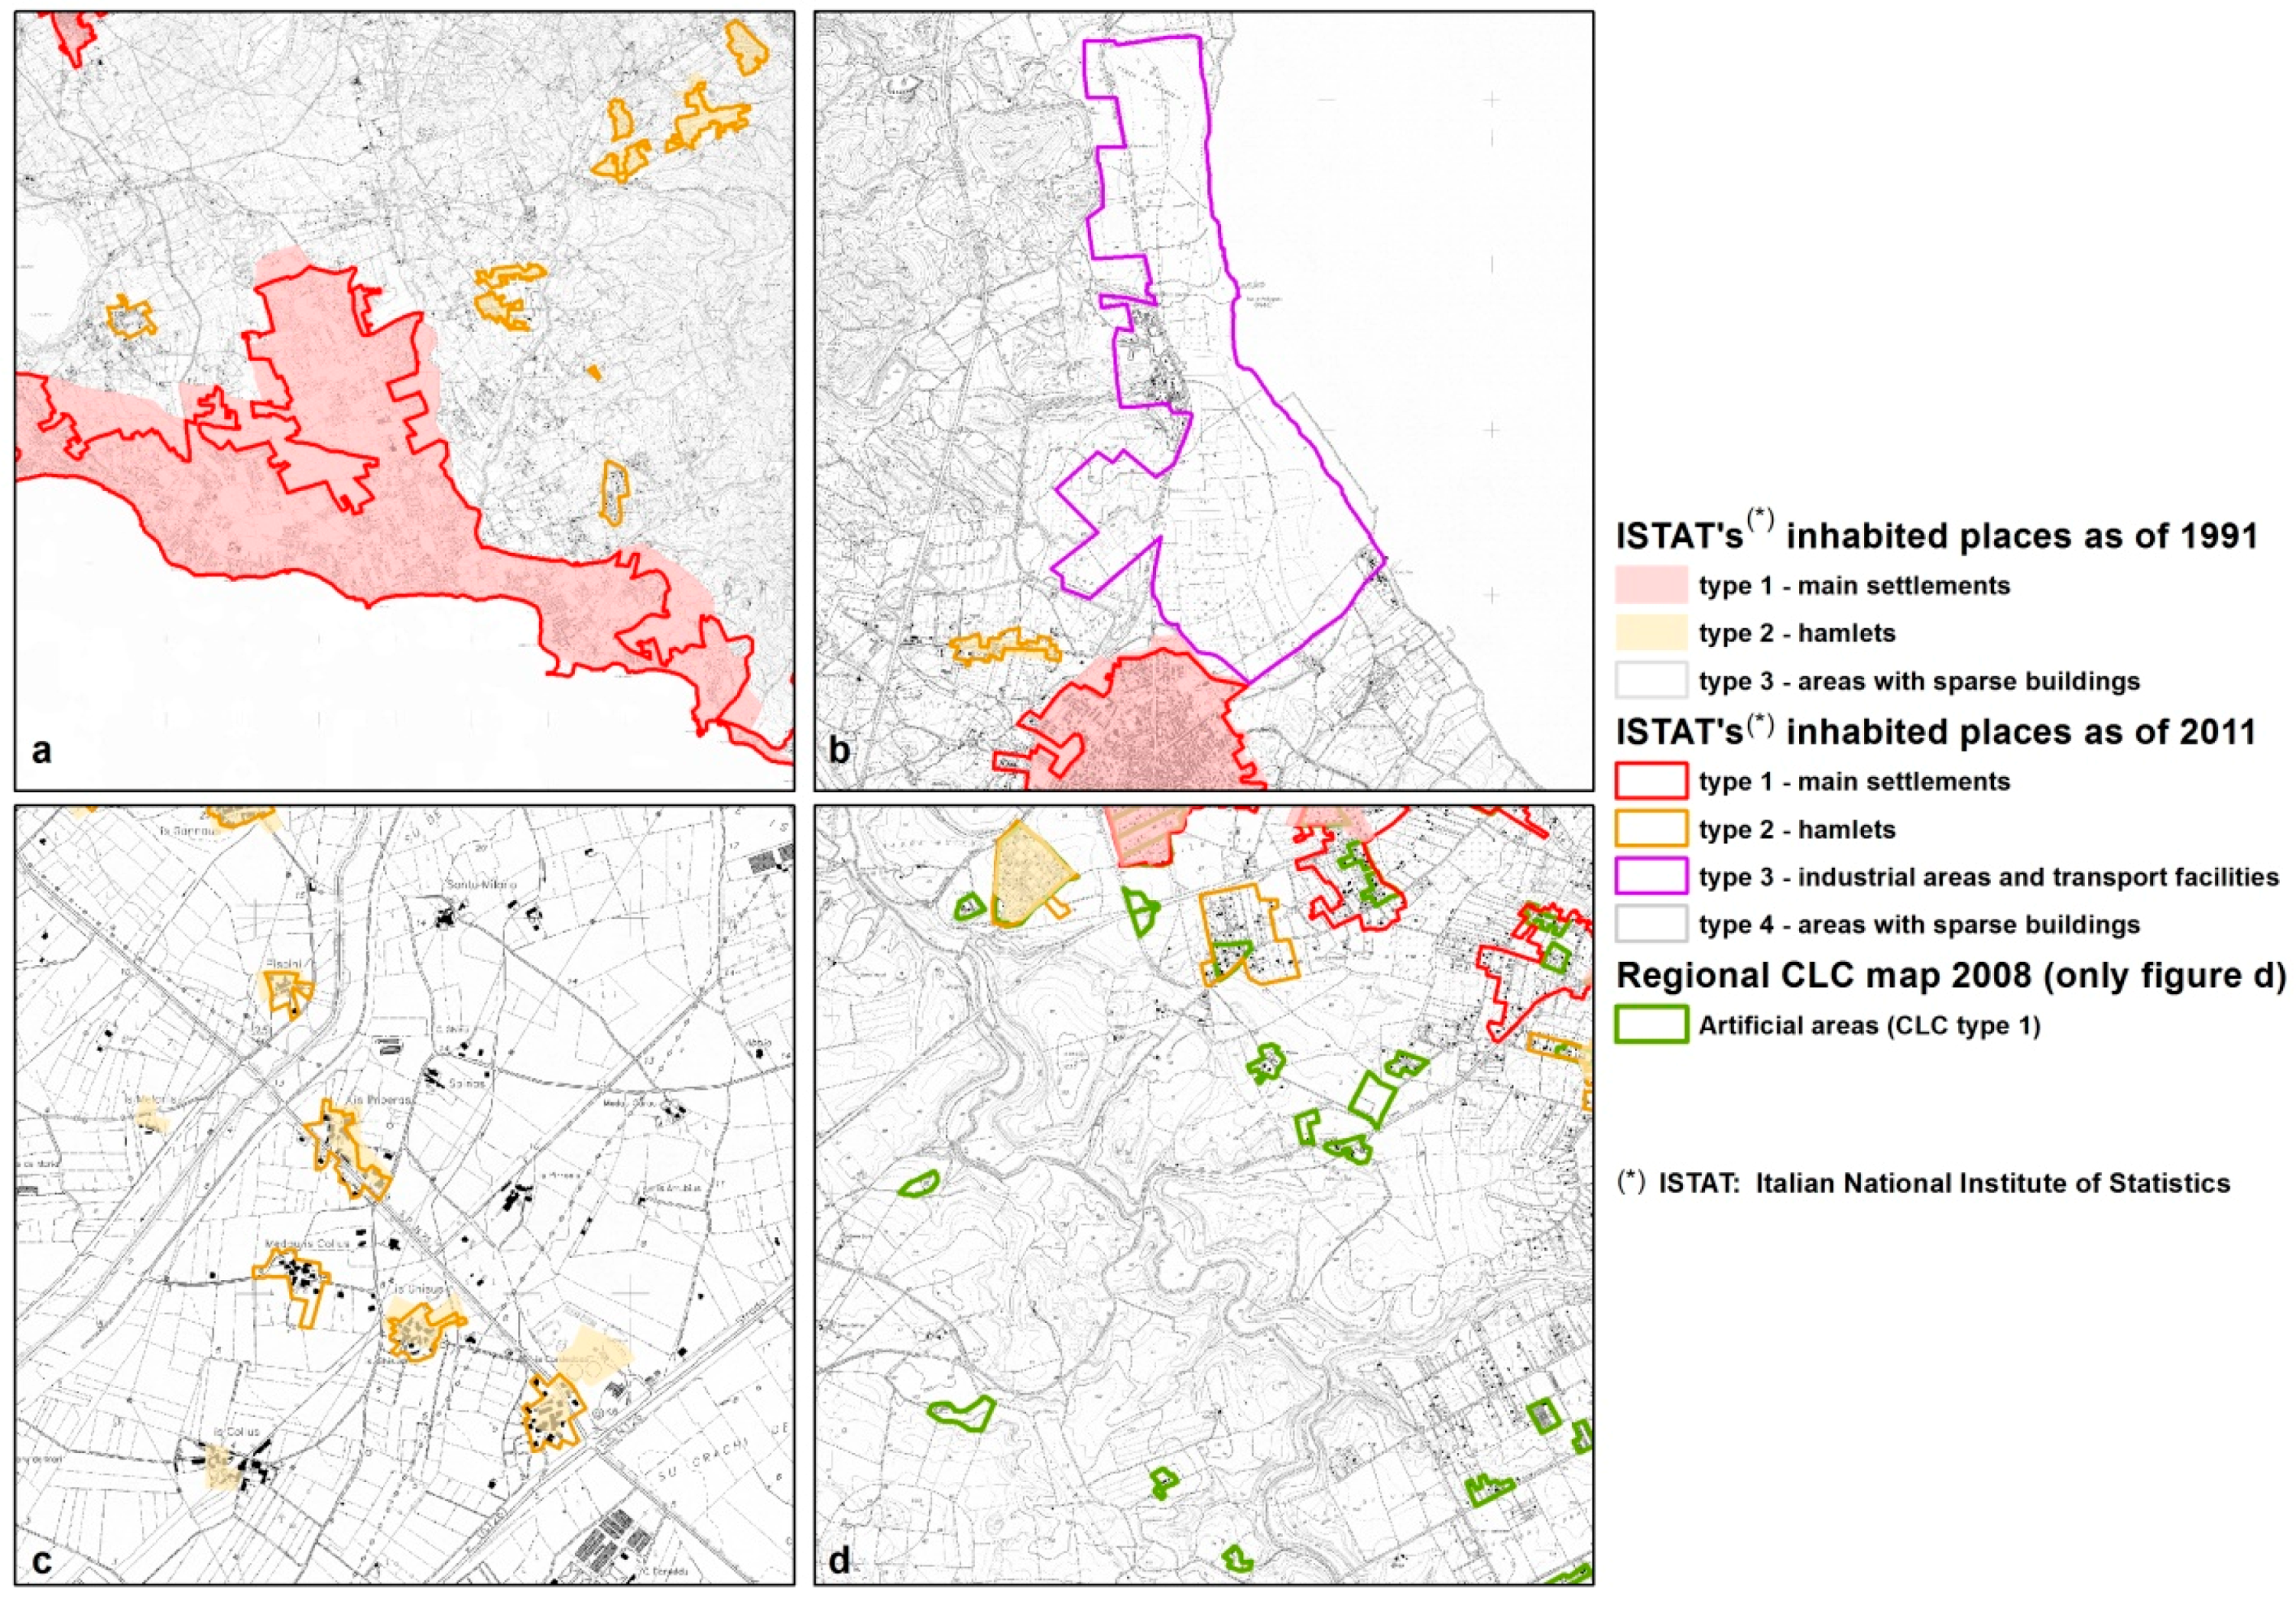
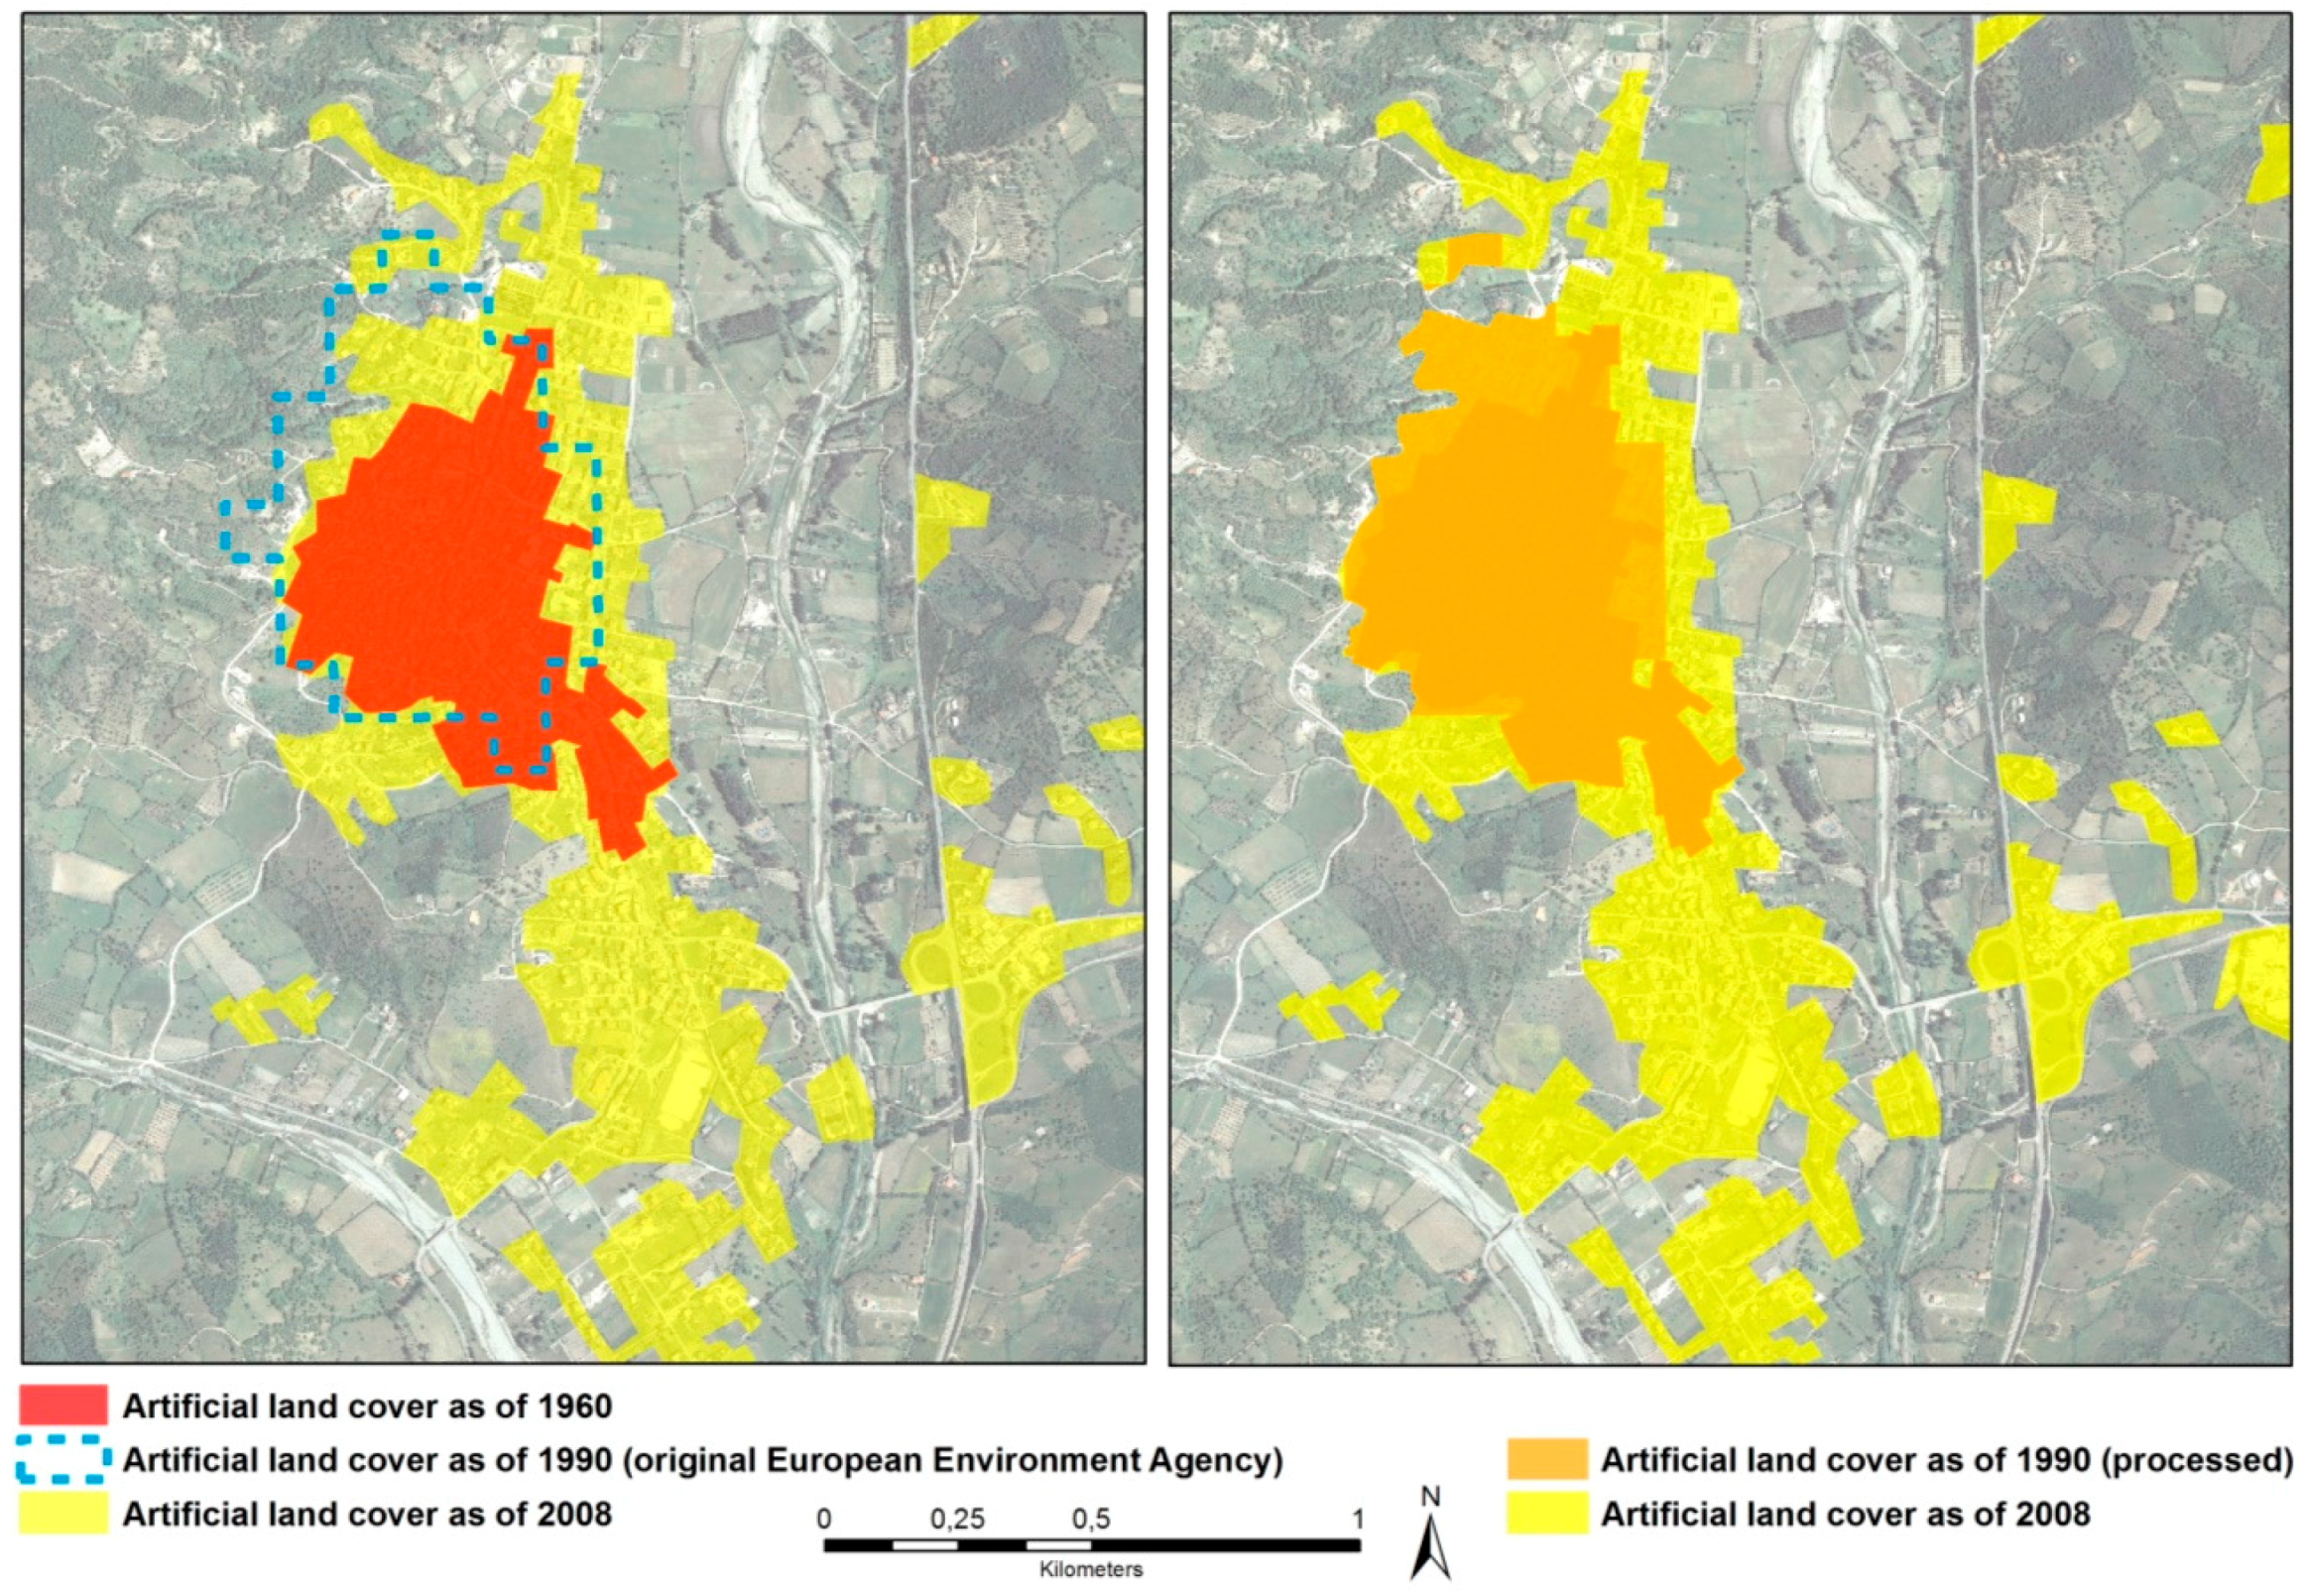
- the European Environment Agency’s Urban Morphologic Zones maps as of 1990 [39]; urban morphologic zones are “sets of urban areas laying less than 200 m apart”, and are defined as regards to appropriately selected subclasses of the CLC class named “artificial surfaces”, that feature urban tissues and their spatial frameworks;
- the regional CLC map implemented by the Sardinian administration, available from the geoportal of the Sardinian administration [40]; from this dataset we select polygons representing “artificial surfaces”, the first level class of the CLC.
3.2. Natura 2000 Sites and Other Factors Influencing Land Take
- two classes of the CLC classification, namely “Wetlands” and “Waterbodies” (first level, non-artificial-surface categories); this variable is almost invariant between 1990 and 2008, since very few parcels of land included in these non-artificial land cover types and in N2Ss have changed their status of non-artificial surface in the period 1990–2008;
- the average slope of the municipal land area included in N2Ss, which contributes to the stability of a N2S in terms of land take.
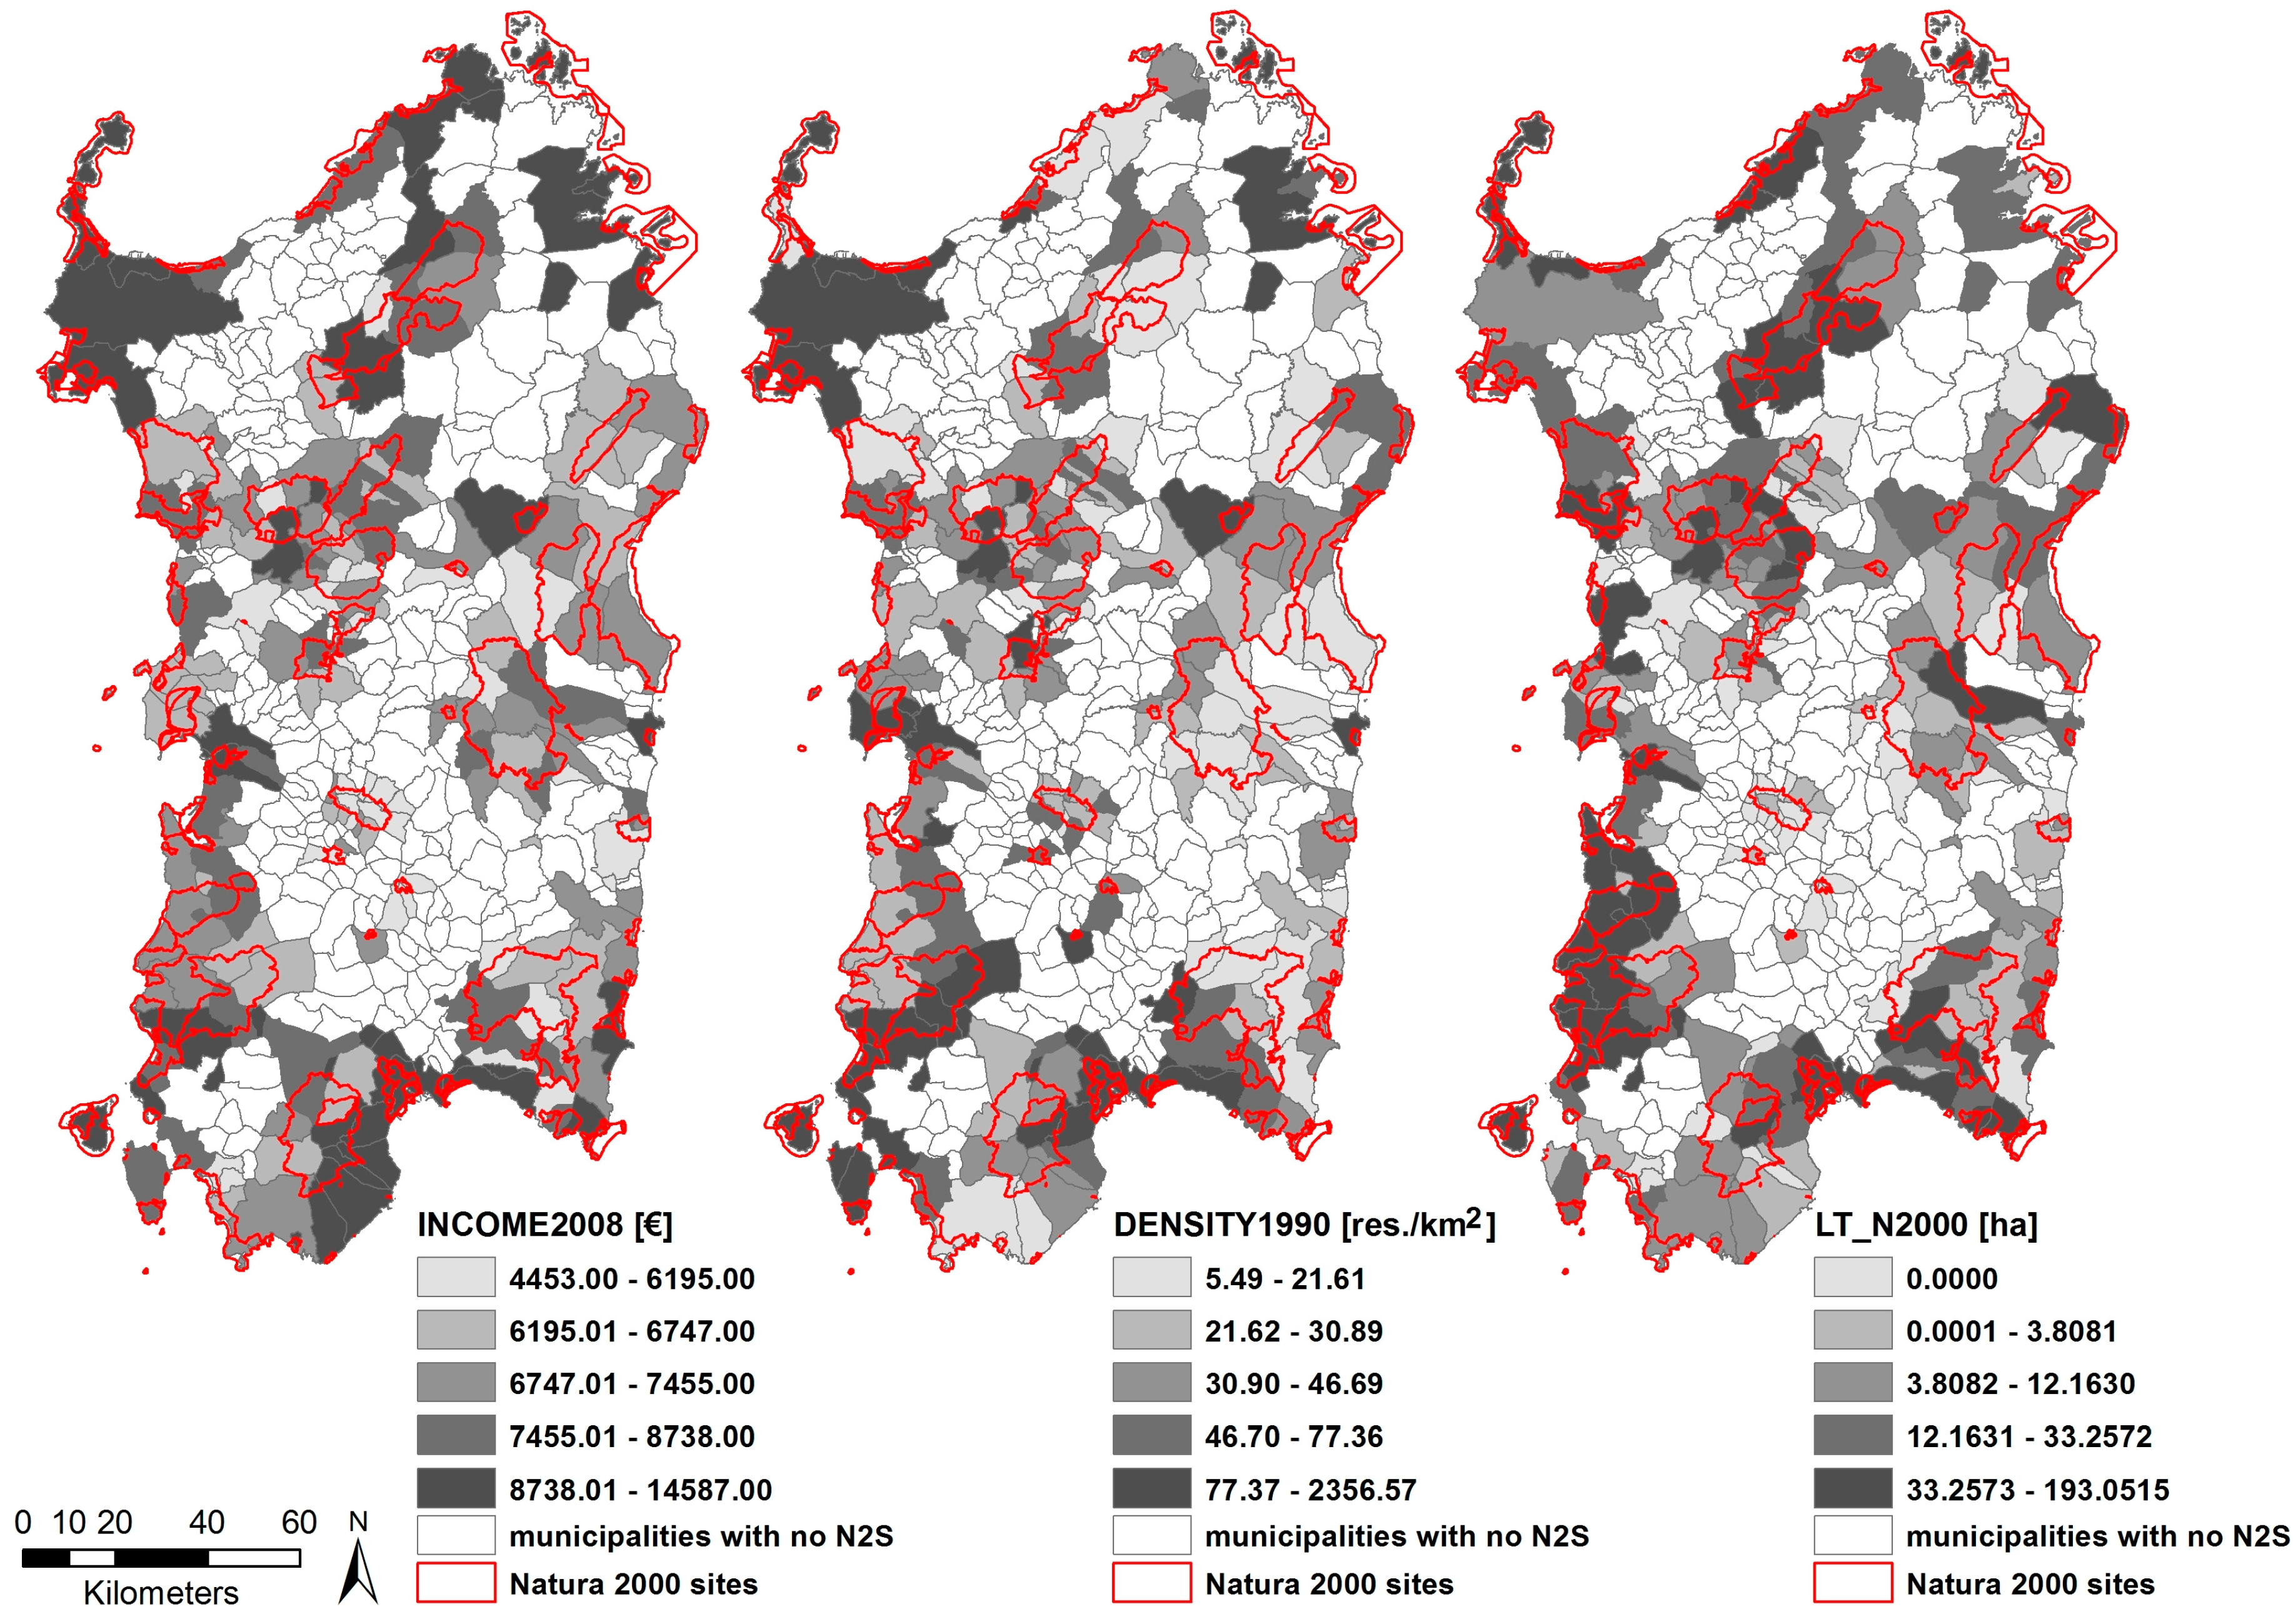
- per capita income, which may either be negatively correlated to land take, in case, for example, a comparatively high municipal per capita income pushes up investments in agriculture, or, to the contrary, investments are diverted to, say, new building developments [55].
4. Results
4.1. Analysing Correlations
4.2. The Outcomes of the Regression Model
4.3. Assessing the Influence of Proximity between N2Ss and Urban Areas
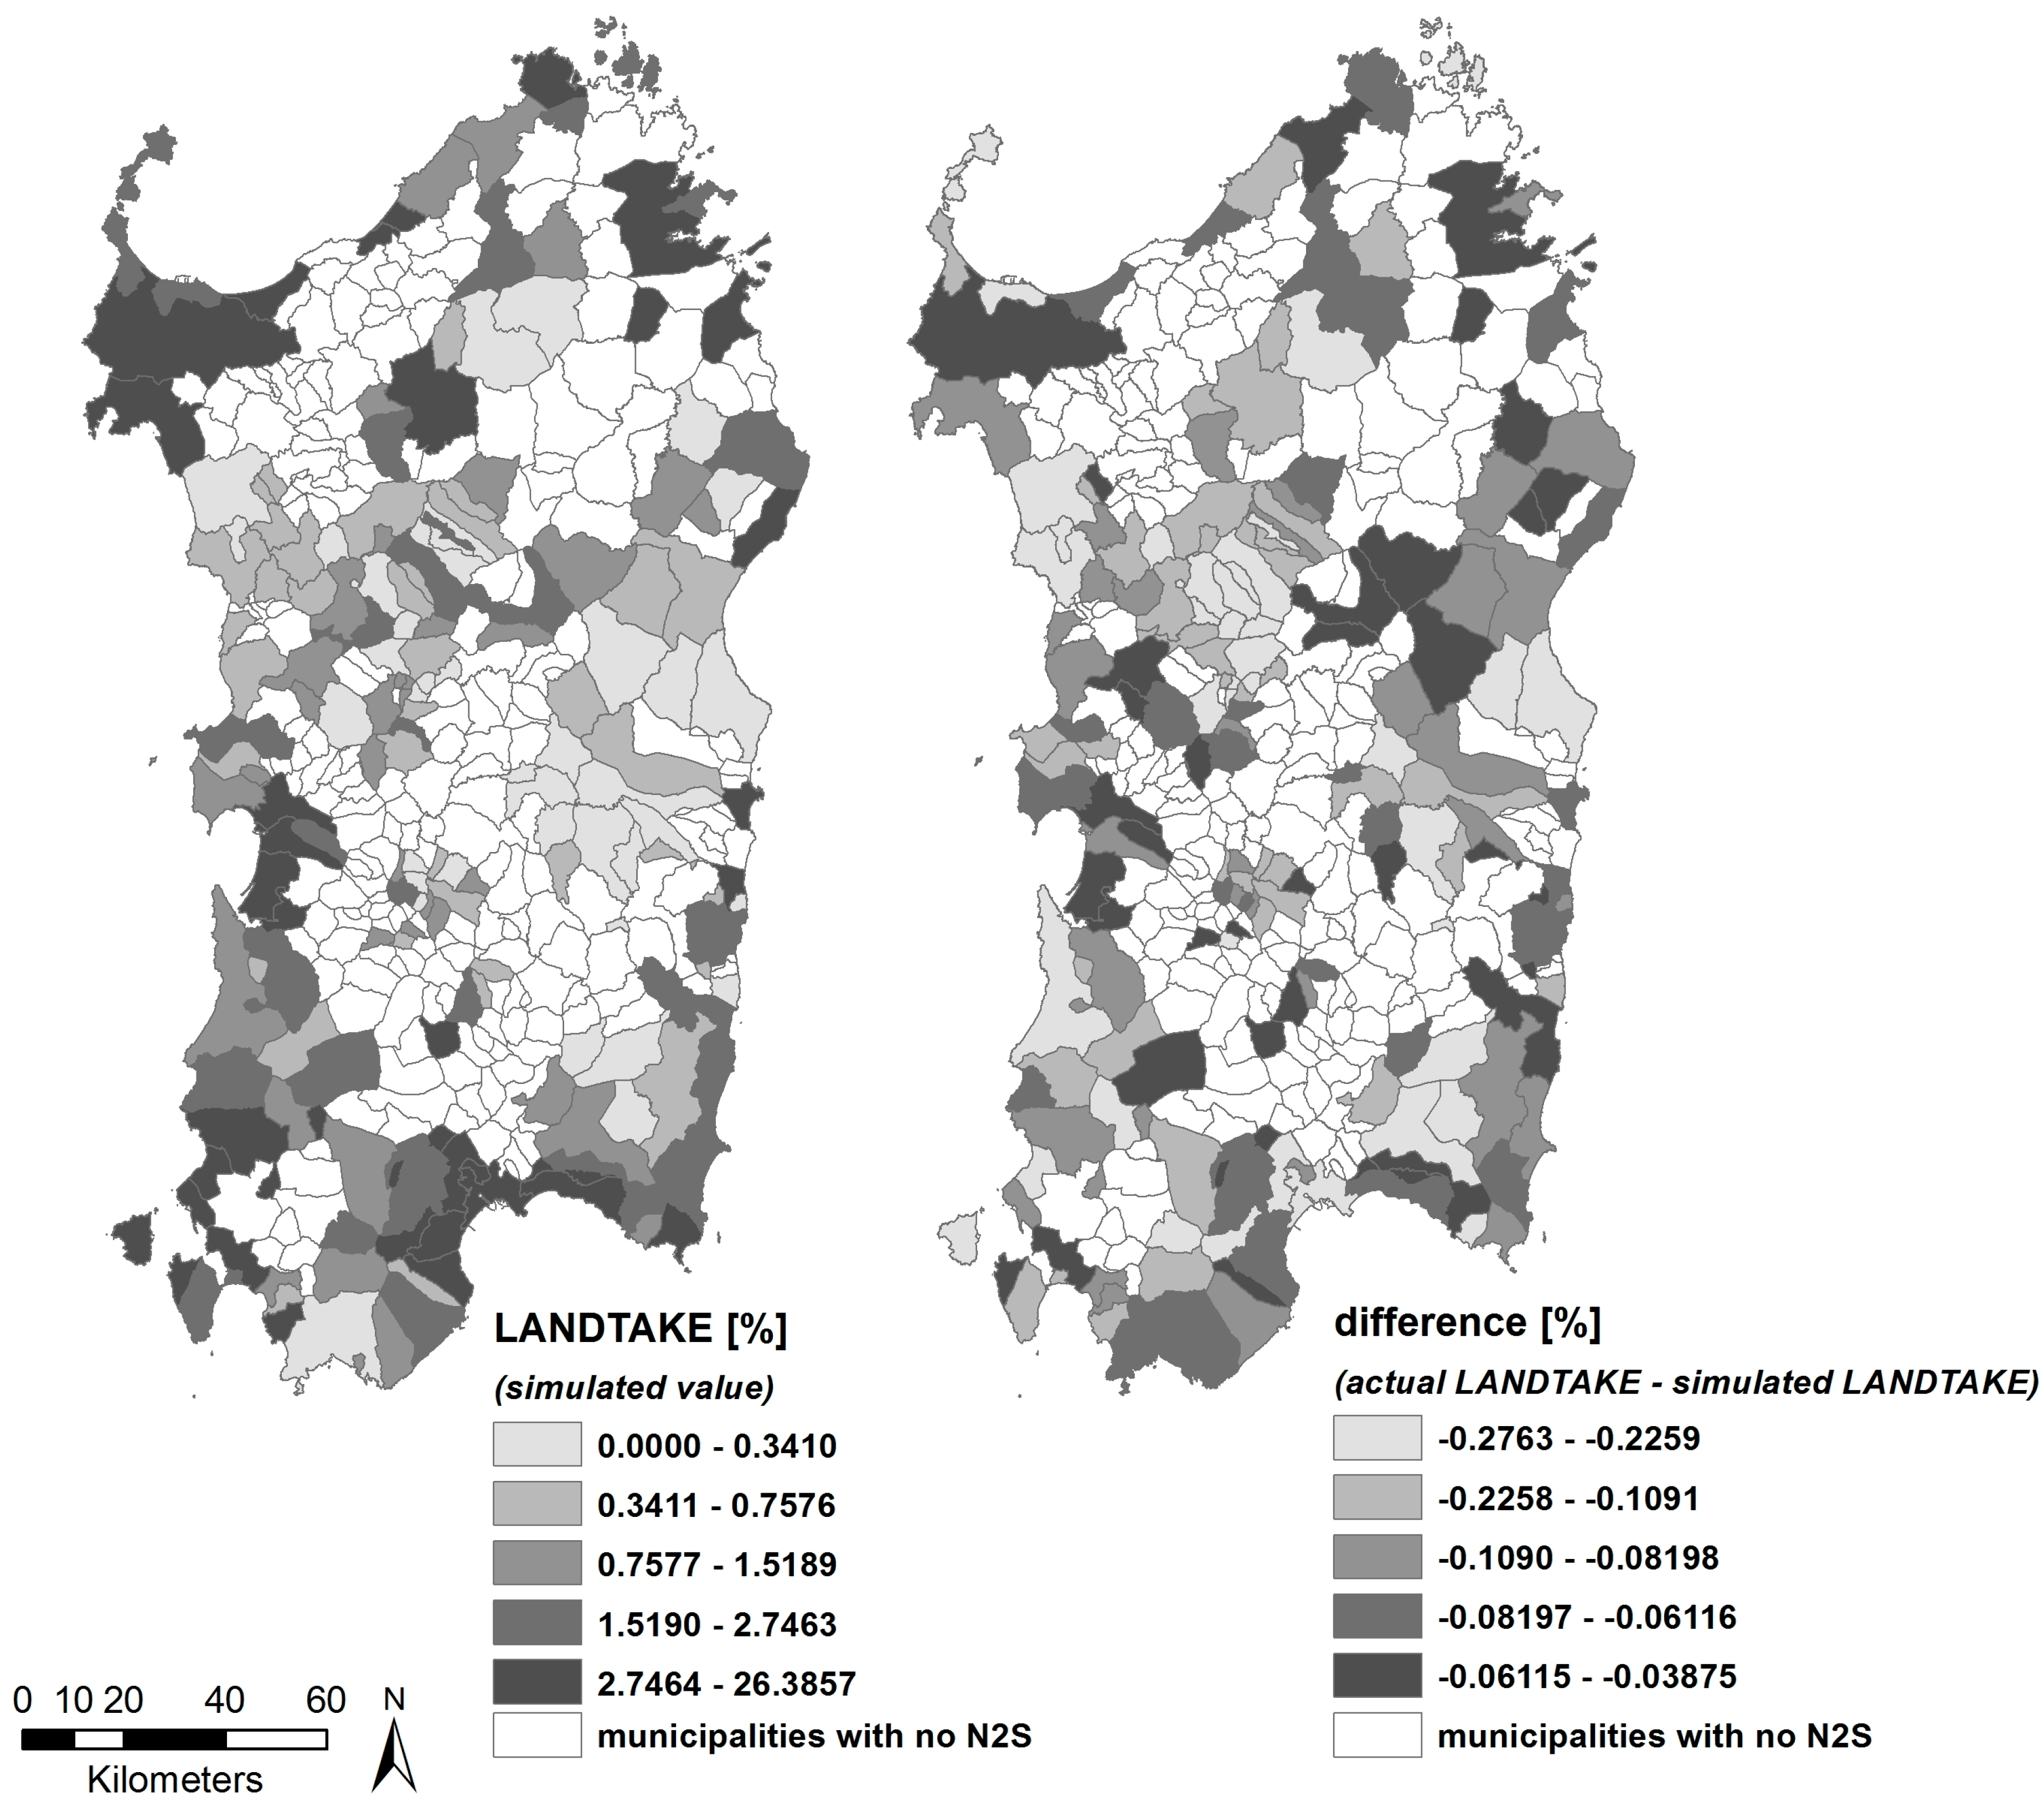
4.4. Scenario Building
5. Discussion and Conclusions
Acknowledgments
Author Contributions
Conflicts of Interest
Appendix A

| Variable | Coefficient | SE | t-Statistic | Hypothesis Test: Coefficient = 0 |
|---|---|---|---|---|
| Constant | −8.1773 | 2.4340 | −3.360 | 0.0010 |
| Log(NAT_2000) | −0.1222 | 0.0439 | −2.786 | 0.0060 |
| Log(LT_N2000) | 2.32 × 10⁻⁵ | 1.30 × 10⁻⁵ | 1.780 | 0.0771 |
| Log(COASTRIP) | 2.26 × 10⁻⁵ | 1.54 × 10⁻⁵ | 1.463 | 0.1456 |
| Log(OLDPLAN) | 6.82 × 10⁻⁶ | 1.41 × 10⁻⁵ | 0.482 | 0.6304 |
| Log(WATER) | 1.85 × 10⁻⁵ | 1.13 × 10⁻⁵ | 1.637 | 0.1037 |
| Log(SLOPE) | −0.0349 | 0.0438 | −0.796 | 0.4274 |
| Log(DENSITY1990) | 0.3236 | 0.0709 | 4.561 | 0.0000 |
| Log(INCOME2008) | 0.8541 | 0.2811 | 3.039 | 0.0028 |
| AUTOCORR | 0.1625 | 0.0581 | 2.796 | 0.0058 |
| Variable | Coefficient | SE | t-Statistic | Hypothesis Test: Coefficient = 0 |
|---|---|---|---|---|
| Constant | 0.0365 | 0.7945 | 0.046 | 0.9634 |
| NAT_2000 | −0.0148 | 0.0063 | −2.366 | 0.0192 |
| LT_N2000 | 0.0177 | 0.0048 | 3.663 | 0.0003 |
| WATER | −0.0023 | 0.0005 | −4.400 | 0.0000 |
| SLOPE | −0.0311 | 0.0107 | −2.898 | 0.0043 |
| DENSITY1990 | 0.0036 | 0.0011 | 3.121 | 0.0021 |
| INCOME2008 | 0.0002 | 0.0001 | 1.588 | 0.1142 |
| AUTOCORR | 0.7909 | 0.1634 | 4.842 | 0.0000 |
| Variable | Coefficient | SE | t-Statistic | Hypothesis Test: Coefficient = 0 |
|---|---|---|---|---|
| Constant | −0.0560 | 0.8099 | −0.069 | 0.9450 |
| NAT_2000 | −0.0141 | 0.0064 | −2.197 | 0.0295 |
| LT_N2000 | 0.0181 | 0.0049 | 3.707 | 0.0003 |
| COASTRIP | −0.0001 | 0.0001 | −0.619 | 0.5368 |
| WATER | −0.0022 | 0.0005 | −4.229 | 0.0000 |
| SLOPE | −0.0304 | 0.0108 | −2.807 | 0.0056 |
| DENSITY1990 | 0.0035 | 0.0011 | 3.063 | 0.0026 |
| INCOME2008 | 0.0002 | 0.0001 | 1.669 | 0.0972 |
| AUTOCORR | 0.7896 | 0.1637 | 4.824 | 0.0000 |
| Variable | Coefficient | SE | t-Statistic | Hypothesis Test: Coefficient = 0 |
|---|---|---|---|---|
| Constant | −0.1076 | 0.8085 | −0.133 | 0.8943 |
| NAT_2000 | −0.0130 | 0.0065 | −1.996 | 0.0476 |
| LT_N2000 | 0.0188 | 0.0050 | 3.786 | 0.0002 |
| OLDPLAN | −0.0001 | 0.0001 | −0.965 | 0.3359 |
| WATER | −0.0022 | 0.0005 | −4.274 | 0.0000 |
| SLOPE | −0.0266 | 0.0117 | −2.272 | 0.0245 |
| DENSITY1990 | 0.0034 | 0.0012 | 2.909 | 0.0042 |
| INCOME2008 | 0.0002 | 0.99 × 10⁻⁴ | 1.619 | 0.1075 |
| AUTOCORR | 0.8206 | 0.1663 | 4.936 | 0.0000 |
References and Notes
- In the words of the Habitats Directive (art. 1, letter k), an SCI is a “site which, in the biogeographical region or regions to which it belongs, contributes significantly to the maintenance or restoration at a favorable conservation status of a natural habitat […] and may also contribute significantly to the coherence of Natura 2000 […] and/or contributes significantly to the maintenance of biological diversity within the biogeographic region or regions concerned”.
- The Birds Directive (art. 4.1) states that “Trends and variations in population levels shall be taken into account as a background for evaluations. Member States shall classify in particular the most suitable territories in number and size as special protection areas for the conservation of these species in the geographical sea and land area where this Directive applies”.
- According to the Habitats Directive, natural habitats are “terrestrial or aquatic areas distinguished by geographic, abiotic and biotic features, whether entirely natural or semi-natural” (art. 1, letter b), conservation is “a series of measures required to maintain or restore the natural habitats and the populations of species of wild fauna and flora at a favorable status” (art. 1, letter a), and conservation status of a natural habitat is “the sum of the influences acting on a natural habitat and its typical species that may affect its long-term natural distribution, structure and functions as well as the long-term survival of its typical species within the territory” (art. 1, letter e).
- Art. 6, paragraph 3 of the Habitats Directive states that “any plan or project not directly connected with or necessary to the management of the site but likely to have a significant effect thereon, either individually or in combination with other plans or projects, shall be subject to appropriate assessment of its implications for the site in view of the site’s conservation objectives” and that “the competent national authorities shall agree to the plan or project only after having ascertained that it will not adversely affect the integrity of the site concerned and, if appropriate, after having obtained the opinion of the general public”.
- European Commission. Report on Best Practices for Limiting Soil Sealing and Mitigating Its Effects. 2011. Available online: http://ec.europa.eu/environment/archives/soil/pdf/sealing/Soil%20sealing%20-%20Final%20Report.pdf (accessed on 27 December 2016).
- European Environment Agency. The European Environment State and Outlook 2010—Land Use. 2010. Available online: http://www.eea.europa.eu/soer/europe/land-use/download (accessed on 27 December 2016).
- ISPRA. Il Consumo di Suolo in Italia [Land Take in Italy]. 2015. Available online: http://www.isprambiente.gov.it/files/pubblicazioni/rapporti/Rapporto_218_15.pdf (accessed on 27 December 2016). [Google Scholar]
- Foley, J.A.; de Fries, R.; Asner, G.P.; Barford, C.; Bonan, G.; Carpenter, S.R.; Chapin, F.S.; Coe, M.T.; Daily, G.C.; Gibbs, H.K.; et al. Global consequences of land use. Science 2005, 309, 570–574. [Google Scholar] [CrossRef] [PubMed]
- Turner, B.L.; Lambin, E.F.; Reenberg, A. The emergence of land change science for global environmental change and sustainability. Proc. Natl. Acad. Sci. USA 2007, 104, 20666–20671. [Google Scholar] [CrossRef] [PubMed]
- Martínez-Fernández, J.; Ruiz-Benito, P.; Zavala, M.A. Recent land cover changes in Spain across biogeographical regions and protection levels: Implications for conservation policies. Land Use Policy 2015, 44, 62–75. [Google Scholar] [CrossRef]
- Andam, K.S.; Ferraro, P.J.; Pfaff, A.; Sanchez-Azofeifa, G.A.; Robalino, J.A. Measuring the effectiveness of protected area networks in reducing deforestation. Proc. Natl. Acad. Sci. USA 2008, 105, 16089–16094. [Google Scholar] [CrossRef] [PubMed]
- Chape, S.; Harrison, J.; Spalding, M.; Lysenk, I. Measuring extent and effectiveness of protected areas as indicator for meeting global biodiversity targets. Philos. Trans. R. Soc. B 2005, 360, 433–455. [Google Scholar] [CrossRef] [PubMed]
- Ruiz-Benito, P.; Cuevas, J.A.; de la Parra, R.B.; Prieto, F.; Zavala, M.A. Land use change in a Mediterranean metropolitan region and its periphery: Assessment of conservation policies through CORINE Land Cover and Markov models. For. Syst. 2010, 19, 315–328. [Google Scholar] [CrossRef]
- Mücher, S.; Gerard, F.; Olschofsky, K.; Hazeu, G.; Luque, S.; Pino, J.; Gregor, M.; Wachowicz, M.; Halada, L.; Tompo, E.; et al. Spatial Impact of Conservation Sites (Natura 2000) on Land Cover Changes. In Proceedings of the 2nd Workshop of the EARSeL SIG on Land Use and Land Cover, Bonn, Germany, 28–30 September 2006; Braun, M., Ed.; European Association of Remote Sensing Laboratories and Center for Remote Sensing of Land Surfaces at the Rheinische Friedrich-Wilhelms-Universität Bonn: Bonn, Germany, 2006; pp. 386–393. [Google Scholar]
- CORINE is the acronym of COoRdination de l’INformation sur l’Environnement [Coordination of information concerning the environment].
- Hazeu, G.W.; Mücher, C.A.; Swetnam, R.; Gerard, F.; Luque, S.; Pino, J.; Halada, L. Historic Land Cover Changes at Natura 2000 Sites and Their Associated Landspaces Across Europe. In Proceedings of the 28th Symposium of the European Association of Remote Sensing Laboratories, Istanbul, Turkey, 2–5 June 2008; Maktav, D., Ed.; IOS Press: Amsterdam, The Netherlands, 2009; pp. 226–231. [Google Scholar]
- Pontius, R.G., Jr.; Shusas, E.; McEachern, M. Detecting important categorical land changes while accounting for persistence. Agric. Ecosyst. Environ. 2004, 101, 251–268. [Google Scholar] [CrossRef]
- Alo, C.A.; Pontius, R.G., Jr. Identifying systematic land-cover transitions using remote sensing and GIS: The fate of forests inside and outside protected areas of Southwestern Ghana. Environ. Plan. B Plan. Des. 2008, 35, 280–295. [Google Scholar] [CrossRef]
- MassGIS. 2002. Available online: http://www.mass.gov/anf/research-and-tech/it-serv-and-support/application-serv/office-of-geographic-information-massgis/datalayers/wbs2002.html (accessed on 27 December 2016).
- Zoppi, C.; Lai, S. Land-taking processes: An interpretive study concerning an Italian region. Land Use Policy 2014, 36, 369–380. [Google Scholar] [CrossRef]
- Zoppi, C.; Lai, S. Determinants of land take at the regional scale: A study concerning Sardinia (Italy). Environ. Impact Assess. 2015, 55, 1–10. [Google Scholar] [CrossRef]
- We focus on SCIs and SPAs only because at present no SACs have yet been established in Sardinia.
- For more details on the project, the reader can refer to the project’s website (in Italian only): http://www.bioitaly.casaccia.enea.it/wwwbioitaly/ (accessed on 31 March 2016).
- The list was approved with Decision of 19 July 2006—C(2006) 3261.
- Deliberation of the Regional Executive No. 52/19 of 15 December 2004. Available online: http://www.regione.sardegna.it/documenti/1_24_20050114100333.pdf (accessed on 27 December 2016).
- Deliberation of the Regional Executive No. 9/17 of 7 March 2007. Available online: http://www.regione.sardegna.it/documenti/1_73_20070326195223.pdf (accessed on 27 December 2016).
- The new format for the standard data forms was approved by the European Commission with Decision of 11 July 2011; standard data forms are available for every N2S through the European Environment Agency’s dedicated webpage: http://natura2000.eea.europa.eu/ (accessed on 27 December 2016).
- See for instance the raster map “Ecosystem Types of Europe”, available at http://www.eea.europa.eu/data-and-maps/data/ecosystem-types-of-europe (accessed on 27 December 2016).
- Information on this map (in Italian only) can be retrieved from the website of the Italian Superior Institute for Environmental Protection and Research: http://www.isprambiente.gov.it/it/servizi-per-lambiente/sistema-carta-della-natura/carta-della-natura-alla-scala-1–50.000/sardegna (accessed on 27 December 2016).
- This map is accessible through the Sardinian Regional Environmental Information System’s website (http://habitat.sardegnaambiente.it/). Registration and permits are required, because of the sensitivity of some information.
- European Environment Agency. Land Take. Available online: http://www.eea.europa.eu/data-and-maps/indicators/land-take-2/ (accessed on 27 December 2016).
- European Environment Agency. CORINE Land Cover. Available online: http://www.eea.europa.eu/publications/COR0-landcover (accessed on 27 December 2016).
- CORINE Land Cover 1990, 2000, 2006, 2012 raster maps (which concern respectively 25, 39, 37 and 33 countries) are available online: http://www.eea.europa.eu/data-and-maps/data/ (accessed on 27 December 2016); Italy is included in all of the databases.
- Diaz-Pacheco, J.; Gutiérrez, J. Exploring the limitations of CORINE Land Cover for monitoring urban land-use dynamics in metropolitan areas. J. Land Use Sci. 2014, 9, 243–259. [Google Scholar] [CrossRef]
- Bach, M.; Breuer, L.; Frede, H.G.; Huisman, J.A.; Otte, A.; Waldhardt, R. Accuracy and congruency of three different digital land-use maps. Landsc. Urban. Plan. 2006, 78, 289–299. [Google Scholar] [CrossRef]
- Aguilera-Benavente, F.; Botequilha-Leitão, A.; Díaz-Varela, E. Detecting multi-scale urban growth patterns and processes in the Algarve region (Southern Portugal). Appl. Geogr. 2014, 53, 234–245. [Google Scholar] [CrossRef]
- Siedentop, S.; Meinel, G. CORINE Land Cover 2000 in Nation-Wide and Regional Monitoring of Urban Land Use and Land Consumption. In UVA-Texte. 04/04 ISSN 0722–186X, Workshop CORINE Land Cover 2000; Leibniz-Institut für Ökologische Raumentwicklung e.V: Berlin, Germany, 2004; pp. 162–169. [Google Scholar]
- The spatial dataset is Available online: http://www.sinanet.isprambiente.it/it/sia-ispra/download-mais/consumo-di-suolo/carta-nazionale-consumo-suolo (accessed on 27 December 2016).
- European Environment Agency. Urban Morphological Zones 1990. Available online: http://www.eea.europa.eu/data-and-maps/data/urban-morphological-zones-1990-2 (accessed on 27 December 2016).
- SardegnaGeoportale. Land Use Map of Sardinia. Available online: http://www.sardegnageoportale.it/index.php?xsl=1598&s=291548&v=2&c=8831&t=1 (accessed on 27 December 2016). This dataset builds upon the so-called “2003 Land use map of Sardinia”, which is actually a land cover map that uses the CLC classification scheme at the 4th level (and, for some classes, the 5th level) in the hierarchy. Data were obtained mainly from photointerpretation of aerial photographs, satellite images, and orthoimages, but other vector data sets (e.g., regional digital cartography) were also used, together with onsite surveys. The scale of the dataset is 1:25,000 and the maps’ minimum mapping unit equals 0.5 ha in urban areas and 0.75 ha in rural areas.
- Feranec, J.; Jaffrain, G.; Soukup, T.; Hazeu, G. Determining changes and flows in European landscapes 1990–2000 using CORINE land cover data. Appl. Geogr. 2010, 30, 19–35. [Google Scholar] [CrossRef]
- Kallimanis, A.S.; Touloumis, K.; Tzanopoulos, J.; Mazaris, A.D.; Apostolopoulou, E.; Stefanidou, S.; Pantis, J.D. Vegetation coverage change in the EU: Patterns inside and outside Natura 2000 protected areas. Biol. Conserv. 2015, 24, 579–591. [Google Scholar] [CrossRef]
- Kuemmerle, T.; Olofsson, P.; Chaskovskyy, O.; Baumann, M.; Ostapowicz, K.; Woodcock, C.E.; Radeloff, V.C. Post-soviet farmland abandonment, forest recovery, and carbon sequestration in Western Ukraine. Glob. Chang. Biol. 2011, 17, 1335–1349. [Google Scholar] [CrossRef]
- Radović, A.; Bukovec, D.; Tvrtković, N.; Tepić, N. Corine land cover changes during the period 1990–2000 in the most important areas for birds in Croatia. Int. J. Sustain. Dev. World 2011, 18, 341–348. [Google Scholar] [CrossRef]
- ISTAT (Italian National Institute of Statistics). Basi Territoriali e Variabili Censuarie. Available online: http://www.istat.it/it/archivio/104317 (accessed on 27 December 2016).
- ISTAT (Italian National Institute of Statistics). Descrizione dei Dati Geografici e delle Variabili Censuarie Delle Basi Territoriali per i Censimenti: Anni 1991, 2001, 2011. [A Description of Geographic Data and Census Variables of Spatial Reference Datasets for National Census: Years 1991, 2001 and 2011], 2016. Available online: http://www.istat.it/it/files/2013/11/Descrizione-dati-Pubblicazione-2016.03.09.pdf (accessed on 27 December 2016).
- European Commission, DG Environment. Assessment of Plans and Projects Significantly Affecting Natura 2000 Sites. Methodological Guidance on the Provisions of Article 6(3) and (4) of the Habitats Directive 92/43/EEC. Subparagraph 5 of paragraph 3.2 and paragraphs 3.3 and 3.4. Available online: http://ec.europa.eu/environment/nature/natura2000/management/docs/art6/natura_2000_assess_en.pdf (accessed on 27 December 2016).
- Zoppi, C.; Lai, S. An Ontology of the appropriate assessment of municipal master plans related to Sardinia (Italy). Future Internet 2014, 6, 223–241. [Google Scholar] [CrossRef] [Green Version]
- Dewi, S.; van Noordwijk, M.; Ekadinata, A.; Pfund, J.L. Protected areas within multifunctional landscapes: Squeezing out intermediate land use intensities in the tropics? Land Use Policy 2013, 30, 38–56. [Google Scholar] [CrossRef]
- Meyfroidt, P.; Lambin, E.F.; Erb, K.H.; Hertel, T.W. Globalization of land use: Distant drivers of land change and geographic displacement of land use. Curr. Opin. Environ. Sustain. 2013, 5, 438–444. [Google Scholar] [CrossRef]
- Forster, D.L. An Overview of U.S. Farm Real Estate Markets. Working Papers of the Department of Agricultural, Environmental and Development Economics, Ohio State University. AEDE-WP-0042-06. 2006. Available online: http://ageconsearch.umn.edu/bitstream/28319/1/wp060042.pdf (accessed on 27 December 2016).
- Guiling, P.; Brorsen, B.W.; Doye, D. Effect of urban proximity on agricultural land values. Land Econ. 2009, 85, 252–264. [Google Scholar] [CrossRef]
- Huang, H.; Miller, Y.; Sherrick, B.J.; Gòmez, M.I. Factors influencing Illinois farmland values. Am. J. Agric. Econ. 2006, 88, 458–470. [Google Scholar] [CrossRef]
- Sklenicka, P.; Molnarova, K.; Pixova, K.C.; Salek, M.E. Factors affecting farmlands prices in the Czech Republic. Land Use Policy 2013, 30, 130–136. [Google Scholar] [CrossRef]
- Zoppi, C.; Lai, S. Empirical Evidence on Agricultural Land-Use Change in Sardinia, Italy, from GIS-Based Analysis and a Tobit Model. Cartographica 2012, 47, 211–227. [Google Scholar] [CrossRef]
- Anselin, L. Spatial Econometrics: Methods and Models; Kluwer Academic Publishers: Dordrecht, The Netherlands, 1988. [Google Scholar]
- Anselin, L. Spatial Econometrics. In A Companion to Theoretical Econometrics; Baltagi, B.H., Ed.; Blackwell Publishing: Oxford, UK, 2003; pp. 310–330. [Google Scholar]
- The CORINE Land Cover 1990 map is available at http://www.eea.europa.eu/data-and-maps/data (accessed on 27 December 2016).
- Available from the Regional Geoportal. Available online: http://www.sardegnageoportale.it/index.html (accessed on 27 December 2016).
- Calculated using population data available at http://www.comuni-italiani.it (official statistical website of the Italian municipalities) and at http://demo.istat.it/dat81-91/COMUNI/ind_pro.htm (official website of the Italian National Institute of Statistics—ISTAT) (accessed on 27 December 2016).
- Data retrievable from the official website of the Italian Ministry of Economy and Finance: http://www1.finanze.gov.it/finanze2/analisi_stat/v_4_0_0/contenuti/Redditi_e_principali_variabili_IRPEF_su_base_comunale_CSV_2008.zip?d= (accessed on 27 December 2016).
- University of Chicago—Center for Spatial Data Science. Software Downloads. Available online: https://spatial.uchicago.edu/software (accessed on 27 December 2016).
- Our findings are not entirely consistent with land take-related data made available by ISPRA at http://www.isprambiente.gov.it/files/comunicati-stampa/2014/Tabelle_consumo_di_suolo.pdf/at_download/file (accessed on 27 December 2016).
- Sander, H.A.; Zhao, C. Urban green and blue: Who values what and where? Land Use Policy 2015, 42, 194–209. [Google Scholar] [CrossRef]
- Akaike, H. A new look at the statistical model identification. IEEE Trans. Autom. Control 1974, 19, 716–723. [Google Scholar] [CrossRef]
- Fotheringham, A.S.; Brunsdon, C.; Charlton, M.E. Geographically Weighted Regression: The Analysis of Spatially Varying Relationships; John Wiley and Sons: West Sussex, UK, 2002. [Google Scholar]
- Yu, D.; Wei, Y.D.; Wu, C. Modeling spatial dimensions of housing prices in Milwaukee, WI. Environ. Plan. B 2007, 34, 1085–1102. [Google Scholar] [CrossRef]
- The “Geographically Weighted Regression (GWR) (Spatial Statistics)” section, related to Fotheringham et al. (2002), of ArcGIS Resources—ArcGIS 10.1, highlights that “GWR should be applied to datasets with several hundred features for best results. It is not an appropriate method for small datasets: http://resources.arcgis.com/en/help/main/10.1/index.html#/Geographically_Weighted_Regression_GWR/005p00000021000000/ (accessed on 27 December 2016).
- The reader can refer to the following notes released by the European Commission “Commission Note on Setting Conservation Objectives for Natura 2000 Sites” and “Commission Note on Establishing Conservation Measures for Natura 2000 Sites”, available at: http://ec.europa.eu/environment/nature/natura2000/management/docs/commission_note/commission_note2_EN.pdf and http://ec.europa.eu/environment/nature/natura2000/management/docs/commission_note/comNote%20conservation%20measures_EN.pdf (accessed on 27 December 2016).
- Zoppi, C.; Lai, S. Assessment of the Regional Landscape Plan of Sardinia (Italy): A participatory-action-research case study type. Land Use Policy 2010, 27, 390–405. [Google Scholar] [CrossRef]
- Leone, F.; Zoppi, C. Conservation measures and loss of ecosystem services: A study concerning the Sardinian Natura 2000 Network. Sustainability 2016, 8, 1061. [Google Scholar] [CrossRef]
- The prerogatives of the regional administration concerning the approval of local plans are laid down in Art. 9 of Sardinian Regional Law No. 28/98.
- Kovács, E.; Kelemen, K.; Kalóczkai, A.; Margóczi, K.; Pataki, G.; Gébert, J.; Málovics, G.; Balázs, B.; Roboz, A.; Krasznai Kovács, E.; et al. Understanding the links between ecosystem service trade-offs and conflicts in protected areas. Ecosyst. Serv. 2015, 12, 117–127. [Google Scholar] [CrossRef]
- Figueroa, F.; Sánchez-Cordero, V. Effectiveness of natural protected areas to prevent land use and land cover change in Mexico. Biodivers. Conserv. 2008, 17, 3223. [Google Scholar] [CrossRef]
- Nagendra, H. Do parks work? Impact of protected areas on land cover clearing. Ambio 2008, 37, 330–337. [Google Scholar] [CrossRef] [PubMed]
- Vasconcelos, M.J.P.; Mussá Biai, J.C.; Araújo, A.; Diniz, M.A. Land cover change in two protected areas of Guinea-Bissau (1956–1998). Appl. Geogr. 2002, 22, 139–156. [Google Scholar] [CrossRef]
- Joppa, L.N.; Loarie, S.R.; Pimm, S.L. On the protection of protected areas. Proc. Natl. Acad. Sci. USA 2008, 105, 667–6678. [Google Scholar] [CrossRef] [PubMed]
- Joppa, L.N.; Pfaff, A. Global protected area impacts. Proc. R. Soc. B Biol. Sci. 2011, 278, 1633–1638. [Google Scholar] [CrossRef] [PubMed]
- Geldmann, J.; Barnes, M.; Coad, L.; Craigie, I.D.; Hockings, M.; Burgess, N.D. Effectiveness of terrestrial protected areas in reducing habitat loss and population declines. Biol. Conserv. 2013, 161, 230–238. [Google Scholar] [CrossRef]


| Variable | Definition | Mean | SD. |
|---|---|---|---|
| LANDTAKE | Ratio of the total municipal area whose land cover changed from non-urbanized to urbanized between 1990 and 2008 to the municipal land area (%, ha/ha) (sources: CORINE Land Cover 1990, next CLC90 [58]; 2008 Regional CORINE Land Cover Map, level 1, next CLCMS08 [59]) | 1.86 | 2.45 |
| NAT_2000 | Ratio of the total municipal land area belonging to the Natura 2000 network in 2008 to the municipal land area (%, ha/ha) (source: Spatial Dataset of the Regional Geographic Information System of Sardinia, next SDRGISS [59]) | 31.16 | 24.65 |
| LT_N2000 | Total municipal area whose land cover changed from non-urbanized to urbanized between 1990 and 2008 within the Natura 2000 network (ha) (sources: CLC90; CLCMS08; SDRGISS) | 20.40 | 35.07 |
| COASTRIP | Municipal land area classed as Natura 2000 and included in the coastal strip (ha) (sources: SDRGISS; Regional Landscape Plan’s spatial dataset [59]) | 690.23 | 1785.09 |
| OLDPLAN | Municipal land area classed in planning code in force before 2006 as areas where land transformations and new developments were almost totally forbidden (ha) (source: SDRGISS) | 1357.25 | 2558.73 |
| WATER | Total municipal area classed as 4 “Wetlands” or 5 “Water bodies” in the 2008 regional land-use map and included in the Natura 2000 network (ha) (source: SDRGISS) | 114.83 | 388.38 |
| SLOPE | Municipality’s weighted average slope of areas included in the Natura 2000 network; weight = area of the share of the municipality designated as Natura 2000 site(s) (%) (source: SDRGISS) | 18.85 | 13.30 |
| DENSITY1990 | Municipality’s residential density in 1990 (residents/km2) [60] | 77.85 | 194.62 |
| INCOME2008 | Municipality’s per-capita income in 2008 (€) [61] | 7442.91 | 1727.64 |
| AUTOCORR | Municipality’s spatially lagged dependent variable 1990–2008 (ref: LANDTAKE) | 1.67 | 1.16 |
| Variable | ρ |
|---|---|
| NAT_2000 | −0.192 |
| LT_N2000 | 0.415 |
| COASTRIP | 0.054 |
| OLDPLAN | −0.038 |
| WATER | 0.172 |
| SLOPE | −0.279 |
| DENSITY1990 | 0.439 |
| INCOME2008 | 0.483 |
| AUTOCORR | 0.591 |
| Variable | Coefficient | SE | t-Statistic | Hypothesis Test: Coefficient = 0 |
|---|---|---|---|---|
| Constant | −0.1040 | 0.8137 | −0.128 | 0.8985 |
| NAT_2000 | −0.0130 | 0.0066 | −1.990 | 0.0484 |
| LT_N2000 | 0.0188 | 0.0050 | 3.774 | 0.0002 |
| COASTRIP | 6.52 × 10⁻⁶ | 0.0001 | 0.056 | 0.9551 |
| OLDPLAN | −6.46 × 10⁻⁵ | 8.74 × 10⁻⁵ | −0.740 | 0.4607 |
| WATER | −0.0022 | 0.0005 | −4.232 | 0.0000 |
| SLOPE | −0.0264 | 0.0121 | −2.191 | 0.0300 |
| DENSITY1990 | 0.0034 | 0.0012 | 2.890 | 0.0044 |
| INCOME2008 | 0.0002 | 0.0001 | 1.567 | 0.1192 |
| AUTOCORR | 0.8224 | 0.1698 | 4.843 | 0.0000 |
| Threshold 1: 250 m | Threshold 2: 500 m | Threshold 3: 750 m | Threshold 4: 1000 m | |||||
|---|---|---|---|---|---|---|---|---|
| Group 1 (D < 250 m) | Group 2 (D > 250 m) | Group 1 (D < 500 m) | Group 2 (D > 500 m) | Group 1 (D < 750 m) | Group 2 (D > 750 m) | Group 1 (D < 1 km) | Group 2 (D > 1 km) | |
| Mean | 2.35065 | 1.32240 | 2.21688 | 1.33790 | 2.16729 | 1.26354 | 2.08861 | 1.32390 |
| Variance | 9.59658 | 1.55960 | 8.65806 | 1.70335 | 8.28682 | 1.06572 | 7.91396 | 1.13303 |
| Observations | 88 | 79 | 100 | 67 | 111 | 56 | 118 | 49 |
| t stat | 2.86516 | 2.62639 | 2.95262 | 2.54632 | ||||
| p-value | 0.00247 | 0.00477 | 0.00182 | 0.00590 | ||||
© 2017 by the authors. Licensee MDPI, Basel, Switzerland. This article is an open access article distributed under the terms and conditions of the Creative Commons Attribution (CC BY) license ( http://creativecommons.org/licenses/by/4.0/).
Share and Cite
Lai, S.; Zoppi, C. The Influence of Natura 2000 Sites on Land-Taking Processes at the Regional Level: An Empirical Analysis Concerning Sardinia (Italy). Sustainability 2017, 9, 259. https://doi.org/10.3390/su9020259
Lai S, Zoppi C. The Influence of Natura 2000 Sites on Land-Taking Processes at the Regional Level: An Empirical Analysis Concerning Sardinia (Italy). Sustainability. 2017; 9(2):259. https://doi.org/10.3390/su9020259
Chicago/Turabian StyleLai, Sabrina, and Corrado Zoppi. 2017. "The Influence of Natura 2000 Sites on Land-Taking Processes at the Regional Level: An Empirical Analysis Concerning Sardinia (Italy)" Sustainability 9, no. 2: 259. https://doi.org/10.3390/su9020259
APA StyleLai, S., & Zoppi, C. (2017). The Influence of Natura 2000 Sites on Land-Taking Processes at the Regional Level: An Empirical Analysis Concerning Sardinia (Italy). Sustainability, 9(2), 259. https://doi.org/10.3390/su9020259