
Minimum Quantity Lubrication and Carbon Footprint: A Step towards Sustainability


Abstract
:1. Introduction
2. Literature Review
3. Mathematical Model
3.1. Assumptions
- This model considers an economic production quantity (EPQ) for multi type product with known demand and constant production rate, where the production rate is greater than demand rate such that there are no shortages in the model.
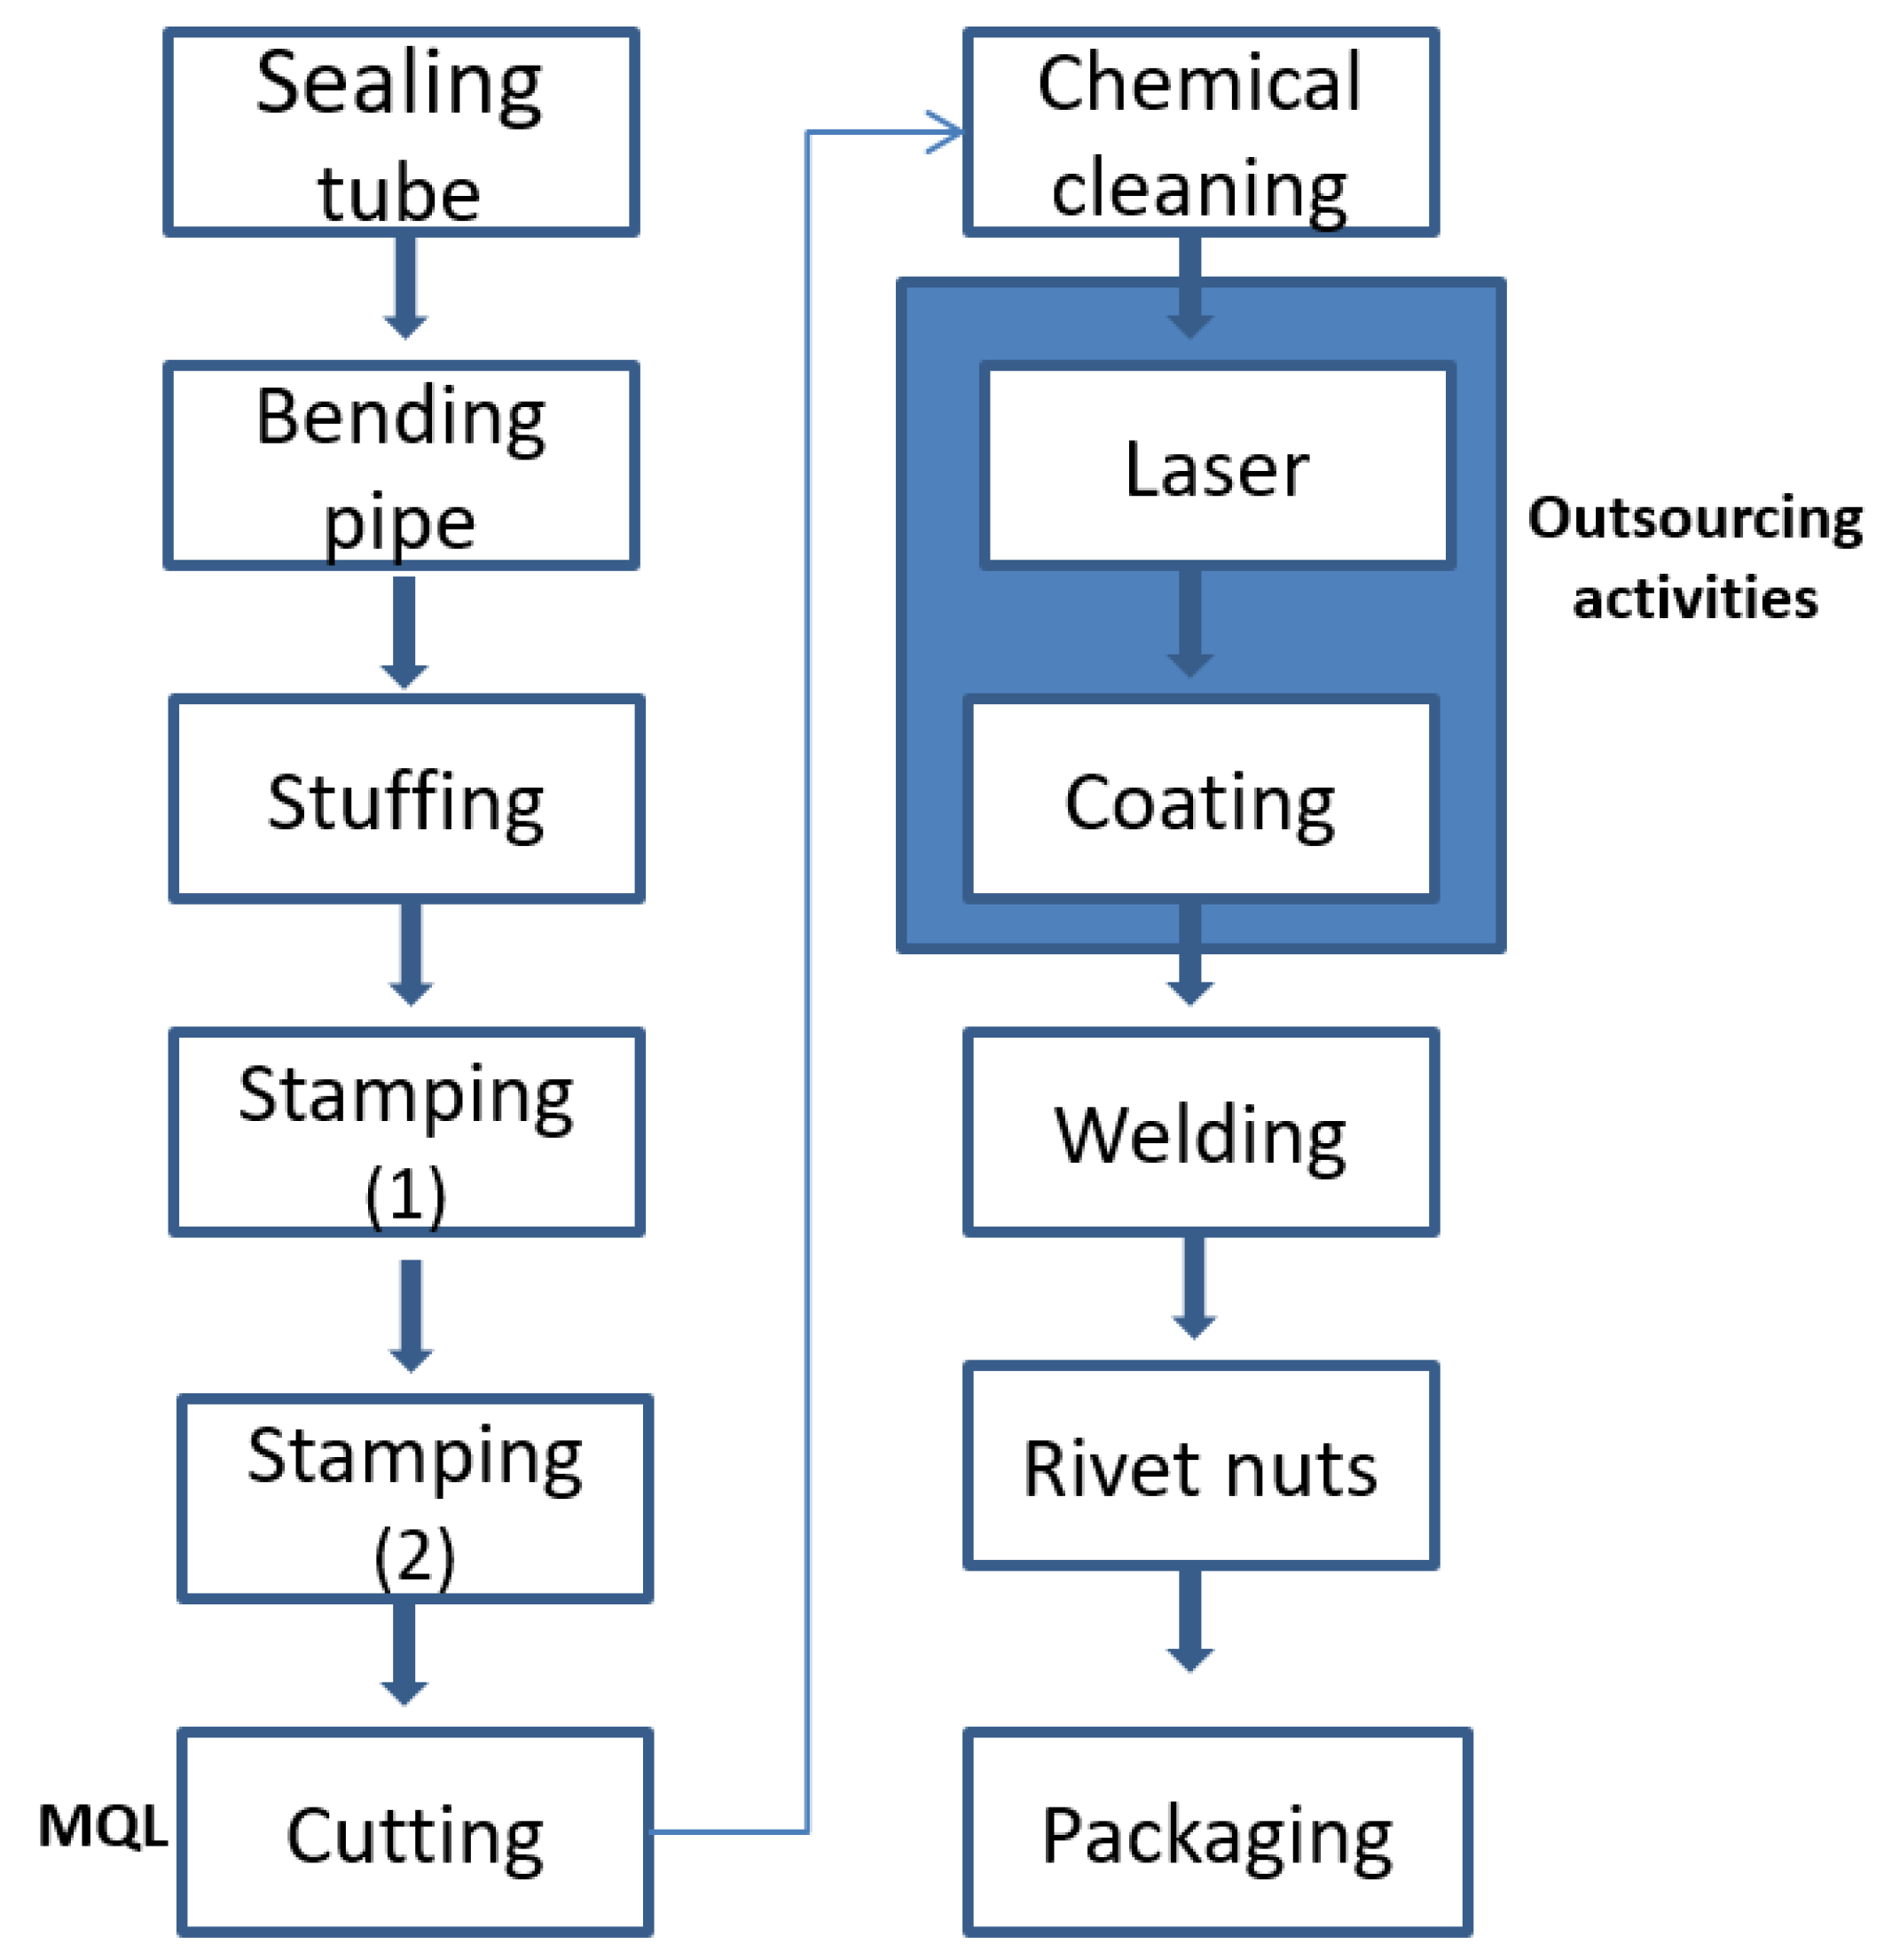
- Cost of production includes labor costs and energy costs, where energy sources include electricity, diesel, and gasoline. Other sources of carbon emission are neglected. Two processes of production flow i.e., laser and coating operations are outsourced. Furthermore, in house and outsourced manufacturing facilities have limited capacity.
- Vendors must satisfy quality and environmental laws.
- It is assumed that imperfect production can be reworked, but certain proportion in form of scrap are produced after quality inspection. Those items are sale out by scrap price.
- Carbon emissions and cost of MQL are considered. However, the cost of MQL is not included in the manufacturing cost.
3.2. Notation
3.3. Model Formulation
Fixed Cost (FC)
Manufacturing Cost (MC)
Crashing Cost (CC)
Holding Cost (HC)
Maintenance cost (mC)
Warehousing Cost (WC)
Energy Cost (EC)
Outsourcing Cost (OC)
Reworking Cost (RC)
Cost of MQL (MQLC) and Scrap (SC)
3.4. Constraints
4. Solution Methodology
5. Numerical Example
6. Numerical Results
7. Sensitivity Analysis
8. Conclusions
Author Contributions
Conflicts of Interest
Appendix A
| i | vendor index, i = 1,2,...I |
| j | product index, j = 1,2,...J |
| t | index for planned time period, t = 1,2,...T |
manufactured quantity of product j in period t (units) | |
product j outsourced to i vendor in t period (units) | |
quantity of product j, crashed in period t (units) |
manufacturing cost for product j in period t (US$/unit) | |
crashing cost for production of j item in period t (US$/unit) | |
outsourcing cost for product j in period t to vendor i (US$/unit/unit time) | |
fixed cost for production of product j in period t (US$) | |
holding cost for product j in period t (US$/unit) | |
cost of maintenance for product j in period t (US$) | |
warehousing cost (US$/unit) | |
demand for product j in period t (units) | |
cost of reworking for vendor i and product j in period t (US$/unit) | |
defective rate for product j, manufactured by i vendor in period t, percentage (%) | |
proportion of scrap produced in defective product j, manufactured by vendor i in period t (%) | |
utilized electricity to manufacture product j in period t (kWh/unit) | |
electricity used to rework product j in period t (kWh/unit) | |
units of electricity to manufacture product j from vendor i (kWh/unit) | |
diesel fuel used to manufacture product j (Lunit) | |
consumed diesel to rework product j in period t (L/unit) | |
diesel used to manufacture product j from vendor i (L/unit) | |
gasoline used to manufacture product j (m/unit) | |
volume of gasoline consumed to rework product j in period t (m/unit) | |
volume of gasoline consumed to manufacture product j from vendor i (m/unit) | |
cost of MQL for product j in period t (US$/unit) | |
electricity coefficient equivalent to carbon emissions | |
diesel fuel coefficient equivalent to carbon emissions | |
gasoline coefficient equivalent to carbon emissions | |
unit cost of electricity (US$/kWh) | |
cost of diesel unit (US$/L) | |
gasoline cost per unit (US$/m3) | |
scrap cost (US$/unit) | |
minimum number of product js in period t (units) | |
maximum quantity of product j in period t (units) | |
minimum available product j from vendor i in period t (units) | |
maximum product j from vendor i in period t (units) | |
maximum limit for crashing quantity of product j in period t (units) |
References
- Forza, C.; Filippini, R. TQM impact on quality conformance and customer satisfaction: a causal model. Int. J. Prod. Econ. 1998, 55, 1–20. [Google Scholar] [CrossRef]
- Miller, G.; Pawloski, J.; Standridge, C.R. A case study of lean, sustainable manufacturing. J. Ind. Eng. Manag. 2010, 3, 11–32. [Google Scholar]
- Sachs, J.D. From millennium development goals to sustainable development goals. Lancet 2012, 379, 2206–2211. [Google Scholar] [CrossRef]
- Jayal, A.D.; Badurdeen, F.; Dillon, O.W., Jr.; Jawahir, I.S. Sustainable manufacturing: Modeling and optimization challenges at the product, process and system levels. CIRP J. Manuf. Sci. Technol. 2010, 2, 144–152. [Google Scholar] [CrossRef]
- Mohammad, K.; Hassan, A.; Amin, F. Investigating the Relationship of Sustainability Factors with Project Management Success. Ind. Eng. Manag. Syst. 2016, 15, 345–353. [Google Scholar]
- Marques, R.C.; Da Cruz, N.F.; Pires, J. Measuring the sustainability of urban water services. Environ. Sci. Policy 2015, 54, 142–151. [Google Scholar] [CrossRef]
- Shrivastava, P. The role of corporations in achieving ecological sustainability. Acad. Manag. Rev. 1995, 20, 936–960. [Google Scholar]
- Omer, A.M. Energy environment and sustainable development. Renew. Sust. Eenergy Rev. 2008, 12, 2265–2300. [Google Scholar] [CrossRef]
- Samaras, C.; Meisterling, K. Life cycle assessment of greenhouse gas emission from plug-in hybrid vehicles: implications for policy. Environ. Sci. Technol. 2008, 42, 3170–3176. [Google Scholar] [CrossRef] [PubMed]
- Garcia, R.; Freire, F. Carbon footprint of particleboard: A comparison between ISO/TS 14067, GHG Protocol, PAS 2050 and Climate Declaration. J. Clean. Prod. 2014, 66, 199–209. [Google Scholar] [CrossRef]
- ISO/TS 14067. Greenhouse Gases: Carbon Footprint of Products Requirements and Guidelines for Quantification and Communication (Technical Specifications); International Organization for Standardization: Geneva, Switzerland, 2013. [Google Scholar]
- ISO 14040. Environmental Management: Life Cycle Assessment: Principles and Framework; International Organization for Standardization: Geneve, Switzerland, 2006. [Google Scholar]
- ISO 14044. Environmental Management—Life Cycle Assessment—Requirements and Guidelines; International Organization for Standardization: Geneva, Switzerland, 2006. [Google Scholar]
- ISO 14025. In Environmental Labels and Declarations e Environmental Labeling Type III: Principles and Procedures; International Organization for Standardization: Geneva, Switzerland, 2006.
- Finkbeiner, M. Carbon footprinting—opportunities and threats. Int. J. Life Cycle. Assess. 2009, 14, 91–94. [Google Scholar] [CrossRef]
- Hussain, M.; Naseem Malik, R.; Taylor, A. Carbon footprint as an environmental sustainability indicator for the particleboard produced in Pakistan. Environ. Res. 2017, 155, 385–393. [Google Scholar] [CrossRef] [PubMed]
- Hillman, T.; Ramaswami, A. Greenhouse Gas Emission Footprints and Energy Use Benchmarks for Eight U.S. Cities. Environ. Sci. Technol. 2010, 44, 1902–1910. [Google Scholar] [CrossRef] [PubMed]
- Rahim, E.; Ibrahim, M.; Rahim, A.; Aziz, S.; Mohid, Z. Experimental investigation of minimum quantity lubrication (MQL) as a sustainable cooling technique. Procedia CIRP 2015, 26, 351–354. [Google Scholar] [CrossRef]
- Skerlos, S.J.; Hayes, K.F.; Clarens, A.F.; Zhao, F. Current advances in sustainable metalworking fluids research. Int. J. Sust. Manuf. 2008, 1, 180–202. [Google Scholar] [CrossRef]
- Silva, L.; Bianchi, E.; Catai, R.; Fusse, R.; Franca, T.; Aguiar, P. Study on the behavior of the minimum quantity lubricant-MQL technique under different lubricating and cooling conditions when grinding ABNT 4340 steel. J. Brazil. Soc. Mech. Sci. Eng. 2005, 27, 192–199. [Google Scholar] [CrossRef]
- Attanasio, A.; Gelfi, M.; Giardini, C.; Remino, C. Minimal quantity lubrication in turning: Effect on tool wear. Wear 2006, 260, 333–338. [Google Scholar] [CrossRef]
- Adler, D.; Hii, W.-S.; Michalek, D.; Sutherland, J. Examining the role of cutting fluids in machining and efforts to address associated environmental/health concerns. Mach. Sci. Technol. 2006, 10, 23–58. [Google Scholar] [CrossRef]
- Dhar, N.; Ahmed, M.; Islam, S. An experimental investigation on effect of minimum quantity lubrication in machining AISI 1040 steel. Int. J. Mach. Tools Manuf. 2007, 47, 748–753. [Google Scholar] [CrossRef]
- Marksberry, P.; Jawahir, I. A comprehensive tool-wear/tool-life performance model in the evaluation of NDM (near dry machining) for sustainable manufacturing. Int. J. Mach. Tools Manuf. 2008, 48, 878–886. [Google Scholar] [CrossRef]
- Madu, C. Handbook of Environmentally Conscious Manufacturing; Springer: Berlin, Germany, 2012. [Google Scholar]
- Wang, Y.; Li, L. Time-of-use based electricity demand response for sustainable manufacturing systems. Energy 2013, 63, 233–244. [Google Scholar] [CrossRef]
- Rosen, M.A.; Kishawy, H.A. Sustainable manufacturing and design: Concepts, practices and needs. Sustainability 2012, 4, 154–174. [Google Scholar] [CrossRef]
- Dyllick, T.; Hockerts, K. Beyond the business case for corporate sustainability. Bus. Strateg. Environ. 2002, 11, 130–141. [Google Scholar] [CrossRef]
- Busch, T.; Hoffmann, V.H. Emerging carbon constraints for corporate risk management. Ecol. Econ. 2007, 62, 518–528. [Google Scholar] [CrossRef]
- Kannan, D.; Diabat, A.; Alrefaei, M.; Govindan, K.; Yong, G. A carbon footprint based reverse logistics network design model. Resour. Conserv. Recycl. 2012, 67, 75–79. [Google Scholar] [CrossRef]
- Kuhtz, S.; Zhou, C.; Albino, V.; Yazan, D.M. Energy use in two Italian and Chinese tile manufacturers: A comparison using an enterprise input–output model. Energy 2010, 35, 364–374. [Google Scholar] [CrossRef]
- Upham, P.; Dendler, L.; Bleda, M. Carbon labelling of grocery products: Public perceptions and potential emissions reductions. J. Clean. Prod. 2011, 19, 348–355. [Google Scholar] [CrossRef]
- Wang, E.-J.; Lin, C.-Y.; Su, T.-S. Electricity monitoring system with fuzzy multi-objective linear programming integrated in carbon footprint labeling system for manufacturing decision making. J. Clean. Prod. 2016, 112, 3935–3951. [Google Scholar] [CrossRef]
- Çalışkan, H.; Kurbanoğlu, C.; Panjan, P.; Čekada, M.; Kramar, D. Wear behavior and cutting performance of nanostructured hard coatings on cemented carbide cutting tools in hard milling. Tribol. Int. 2013, 62, 215–222. [Google Scholar] [CrossRef]
- Koné, F.; Czarnota, C.; Haddag, B.; Nouari, M. Modeling of velocity-dependent chip flow angle and experimental analysis when machining 304L austenitic stainless steel with groove coated-carbide tools. J. Mater. Process. Technol. 2013, 213, 1166–1178. [Google Scholar] [CrossRef]
- Glenn, T.F. Opportunities and market trends in metalworking fluids. Tribol. Lubr. Technol. 1998, 54, 31. [Google Scholar]
- Thepsonthi, T.; Hamdi, M.; Mitsui, K. Investigation into minimal-cutting-fluid application in high-speed milling of hardened steel using carbide mills. Int. J. Mach. Tools Manuf. 2009, 49, 156–162. [Google Scholar] [CrossRef]
- Fratila, D. Evaluation of near-dry machining effects on gear milling process efficiency. J. Clean. Prod. 2009, 17, 839–845. [Google Scholar] [CrossRef]
- Fratila, D.; Caizar, C. Application of Taguchi method to selection of optimal lubrication and cutting conditions in face milling of AlMg3. J. Clean. Prod. 2011, 19, 640–645. [Google Scholar] [CrossRef]
- Biswas, P.; Sarker, B.R. Optimal batch quantity models for a lean production system with in-cycle rework and scrap. Int. J. Prod. Res. 2008, 46, 6585–6610. [Google Scholar] [CrossRef]
- Tayyab, M.; Sarkar, B. Optimal batch quantity in a cleaner multi-stage lean production system with random defective rate. J. Clean. Prod. 2016, 139, 922–934. [Google Scholar] [CrossRef]
- Inderfurth, K.; Lindner, G.; Rachaniotis, N. Lot sizing in a production system with rework and product deterioration. Int. J. Prod. Res. 2005, 43, 1355–1374. [Google Scholar] [CrossRef]
- Sarkar, B. An inventory model with reliability in an imperfect production process. Appl. Math. Comput. 2012, 218, 4881–4891. [Google Scholar] [CrossRef]
- Sarkar, B.; Sana, S.S.; Chaudhuri, K. An imperfect production process for time varying demand with inflation and time value of money—An EMQ model. Expert Syst. Appl. 2011, 38, 13543–13548. [Google Scholar] [CrossRef]
- Sarkar, B.; Moon, I. Improved quality, setup cost reduction, and variable backorder costs in an imperfect production process. Int. J. Prod. Econ. 2014, 155, 204–213. [Google Scholar] [CrossRef]
- Soni, H.; Sarkar, B.; Mahapatra, A.; Majumder, S. Lost sales reduction and quality improvement with variable lead time and fuzzy costs in an imperfect production system. RAIRO Oper. Res. 2017. [Google Scholar] [CrossRef]
- Minjung, K. Planning Demand- and Legislation-Driven Remanufacturing for a Product Family: A Model for Maximizing Economic and Environmental Potential. Ind. Eng. Manag. Syst. 2015, 14, 159–174. [Google Scholar]
- Saedi, M.; Saghari, S. The Balancing of Disassembly Line of Automobile Engine Using Genetic Algorithm (GA) in Fuzzy Environment. Ind. Eng. Manag. Syst. 2016, 15, 364–373. [Google Scholar] [CrossRef]
- Chalmers, R. Global flavor highlights NAMRC XXVII. Manuf. Eng. 1999, 123, 205–209. [Google Scholar]
- Sardar, S.; Lee, Y.; Memon, M. A Sustainable Outsourcing Strategy Regarding Cost, Capacity Flexibility, and Risk in a Textile Supply Chain. Sustainability 2016, 8, 234. [Google Scholar] [CrossRef]
- Konak, A.; Coit, D.W.; Smith, A.E. Multi-objective optimization using genetic algorithms: A tutorial. Reliab. Eng. Syst. Saf. 2006, 91, 992–1007. [Google Scholar] [CrossRef]
- Keisuke, N.; Takashi, I.; Yosuke, M.; Shuling, L. Applying Genetic Algorithm for Can-Order Policies in the Joint Replenishment Problem. Ind. Eng. Manag. Syst. 2015, 14, 1–10. [Google Scholar]
- Gembicki, F.; Haimes, Y. Approach to performance and sensitivity multiobjective optimization: The goal attainment method. IEEE Trans. Autom. Control 1975, 20, 769–771. [Google Scholar] [CrossRef]


| Authors | Costs | Sustainability Factors | Imperfect Items | Techniques |
|---|---|---|---|---|
| Inderfurth et al. (2005) | Cost of rework | Rework and product deterioration | Lot sizing formulas | |
| Biswas and Sarkar (2008) | Total cost | CO | Experimental design | |
| Kannan (2012) | Cost of emissions | CO | Mixed integer linear modelling | |
| Tayyab and Sarkar (2016) | Cost of production | Rework | Analytical Optimization | |
| Wang et al. (2016) | Total cost of production | Rework Rework | Fuzzy multiobjective goal programming | |
| This paper | Total cost of production | CO emissions and MQL | Rework and scrap | Goal attainment and multiobjective GA |
| Period | Product Type | Fixed Cost | Manufacturing Cost/Unit | Crashing Cost/Unit | Holding Cost/Unit | Maintenance Cost | MQL Cost/Unit | Warehousing Cost/Unit |
|---|---|---|---|---|---|---|---|---|
| 1 | X | 2307 | 0.32 | 0.42 | 0.25 | 510.5 | 0.0725 | 0.067 |
| 2 | Y | 2307 | 0.29 | 0.39 | 0.21 | 255.26 | 0.0725 | 0.08 |
| Z | 2780 | 0.18 | 0.23 | 0.04 | 574.33 | 0.0725 | 0.13 |
| Period | Product Type | Rework Cost/Unit | Scrap Cost/Unit |
|---|---|---|---|
| 1 | X | 0.116 | 0.083 |
| 2 | Y | 0.116 | 0.083 |
| Z | 0.15 | 0.083 |
| Energy Source Type | Unit Cost ($) | Carbon Emissions Conversion Factor |
|---|---|---|
| Electricity (kWh) | 0.1 | 0.536 |
| Diesel fuel (L) | 1.06 | 2.615 |
| Gasoline (m) | 0.6 | 1.881 |
| Period | Product Type | Upper Capacity (Units) | Lower Capacity (Units) | Crashing Quantity Limit (Units) |
|---|---|---|---|---|
| 1 | X | 570 | 80 | 250 |
| 2 | Y | 290 | 80 | 125 |
| Z | 345 | 70 | 75 |
| Status | Product Type | Electricity (kWh) | Diesel Fuel (L) | Gasoline (m) |
|---|---|---|---|---|
| Manufacturing | X | 0.318 | 0.3184 | 0.0004 |
| Manufacturing | Y | 0.293 | 0.0937 | 0.0005 |
| Manufacturing | Z | 0.455 | 0.0005 | 0.0005 |
| Reworking | X | 0.675 | 0.0055 | 0 |
| Reworking | Y | 0.702 | 0.0055 | 0 |
| Reworking | Z | 0.757 | 0.011 | 0 |
| Outsourcing by A | X | 0.654 | 0.008 | 0 |
| Y | 0.637 | 0.008 | 0 | |
| Z | 0.72 | 0.015 | 0 | |
| Outsourcing by B | X | 0.723 | 0.007 | 0 |
| Y | 0.678 | 0.007 | 0 | |
| Z | 0.741 | 0.015 | 0 | |
| Outsourcing by C | X | 0.7 | 0.01 | 0 |
| Y | 0.655 | 0.01 | 0 | |
| Z | 0.683 | 0.015 | 0 |
| Period | Vendor | Product Type | Minimum Limit (Units) | Maximum Limit (Units) | Outsourcing Cost (US$) | Defective Rate (%) | Scrap (%) |
|---|---|---|---|---|---|---|---|
| 1 | A | X | 100 | 1000 | 0.666 | 1.35 | 1.2 |
| B | X | 100 | 1500 | 0.666 | 1.45 | 1.2 | |
| C | X | 150 | 2000 | 0.666 | 1.25 | 1.2 | |
| 2 | A | Y | 50 | 1000 | 0.6 | 1.45 | 1.2 |
| B | Y | 50 | 1200 | 0.6 | 1.55 | 1.2 | |
| C | Y | 100 | 1200 | 0.6 | 1.45 | 1.2 | |
| A | Z | 50 | 800 | 0.833 | 1.2 | 1.2 | |
| B | Z | 50 | 500 | 0.833 | 1.55 | 1.2 | |
| C | Z | 100 | 1000 | 0.833 | 1.3 | 1.2 |
| Period | Product Type | Manufacturing Status | Production Quantity (Units) | Crashing Quantity (Units) | Outsourcing Quantity (Units) |
|---|---|---|---|---|---|
| 1 | X | In-house | 215 | 135 | |
| Vendor A | 100 | ||||
| Vendor B | 150 | ||||
| Vendor C | 100 | ||||
| 2 | Y | In-house | 140 | 60 | |
| Vendor A | 50 | ||||
| Vendor B | 50 | ||||
| Vendor C | 100 | ||||
| Z | In-house | 135 | 65 | ||
| Vendor A | 100 | ||||
| Vendor B | 50 | ||||
| Vendor C | 50 |
| Objective Function | Single Objective GA | Computational Time (s) | Multi-Objective GA | Computational Time (Seconds) | Goal Attainment | Computational Time (s) |
|---|---|---|---|---|---|---|
| (US$) | 9925.655 | 33.74 | 9925.652 | 40.67 | 9925.6364 | 0.0838 |
| (Kg) | 817.4454 | 38.56 | 817.44 | 817.44 |
| Case | Product Type | Average diesel Cost (US$/kWh) | Adjustment (%) | Function | Result (US$ and kg) | % Change (%) |
|---|---|---|---|---|---|---|
| 1 | X | 0.10467 | 50 | 10030 | 1.05 | |
| Y | 0.03726 | 1018.6 | 24.61 | |||
| Z | 0.03834 | |||||
| 2 | X | 0.087225 | 25 | 9964.3 | 0.39 | |
| Y | 0.03105 | 917.9 | 12.29 | |||
| Z | 0.03195 | |||||
| 3 | X | 0.06978 | Initial values | 9925.65 | 0 | |
| Y | 0.02484 | 817.44 | 0 | |||
| Z | 0.02556 | |||||
| 4 | X | 0.052335 | −25 | 9887.1 | −0.39 | |
| Y | 0.01863 | 716.89 | −12.30 | |||
| Z | 0.01917 | |||||
| 5 | X | 0.03489 | −50 | 9848.6 | −0.78 | |
| Y | 0.01242 | 616.33 | −24.60 | |||
| Z | 0.01278 |
| Case | Product Type | Crashing Cost (US$/Unit) | Adjustment (%) | Function | Result (US$ and kg) | % Change (%) |
|---|---|---|---|---|---|---|
| 6 | X | 0.63 | 50 | 9971.5 | 0.46 | |
| Y | 0.585 | 818.66 | 0.15 | |||
| Z | 0.345 | |||||
| 7 | X | 0.525 | 25 | 9949.7 | 0.24 | |
| Y | 0.4875 | 817.44 | 0 | |||
| Z | 0.2875 | |||||
| 8 | X | 0.42 | Initial values | 9925.65 | 0 | |
| Y | 0.39 | 817.444 | 0 | |||
| Z | 0.23 | |||||
| 9 | X | 0.315 | −25 | 9901.7 | −0.24 | |
| Y | 0.2925 | 817.44 | 0 | |||
| Z | 0.1725 | |||||
| 10 | X | 0.21 | −50 | 9877.7 | −0.48 | |
| Y | 0.195 | 817.44 | 0 | |||
| Z | 0.115 |
© 2017 by the authors. Licensee MDPI, Basel, Switzerland. This article is an open access article distributed under the terms and conditions of the Creative Commons Attribution (CC BY) license (http://creativecommons.org/licenses/by/4.0/).
Share and Cite
Omair, M.; Sarkar, B.; Cárdenas-Barrón, L.E. Minimum Quantity Lubrication and Carbon Footprint: A Step towards Sustainability. Sustainability 2017, 9, 714. https://doi.org/10.3390/su9050714
Omair M, Sarkar B, Cárdenas-Barrón LE. Minimum Quantity Lubrication and Carbon Footprint: A Step towards Sustainability. Sustainability. 2017; 9(5):714. https://doi.org/10.3390/su9050714
Chicago/Turabian StyleOmair, Muhammad, Biswajit Sarkar, and Leopoldo Eduardo Cárdenas-Barrón. 2017. "Minimum Quantity Lubrication and Carbon Footprint: A Step towards Sustainability" Sustainability 9, no. 5: 714. https://doi.org/10.3390/su9050714
APA StyleOmair, M., Sarkar, B., & Cárdenas-Barrón, L. E. (2017). Minimum Quantity Lubrication and Carbon Footprint: A Step towards Sustainability. Sustainability, 9(5), 714. https://doi.org/10.3390/su9050714