4.1. Current Municipal Adaptation Response
Instigated by recurrent flood episodes, which are likely to become worse when considering climate change projections, Lisbon has been directing specific efforts towards urban flood adaptation. Urban climate change adaptation is a fairly recent subject, a matter accompanied by major questions about the processes of selection and design of adaptation measures.
Regardless of the existing examples of implemented adaptation measures through private initiatives or other current sorts of synergies, the following analysis will focus on assessing the essential municipal intentions within the accompanying elements of its corresponding Master Plan (PDM). The 2012 PDM is the most up-to-date land management tool, and the only document determining the classification and qualification of land use. Most importantly, it is the instrument that configures urban planning intentions for the Lisbon of the future.
As such, with the purpose of assessing Lisbon’s municipal adaptation response, a contrasting analysis between the specific types of adaptation measures identified within Lisbon’s PDM (2012) and the existence of other possible measures presented by the Conceptual Framework is undertaken. More specifically, in a first stage, and following the same methodology as the one conducted for the creation of the Conceptual Framework [
11], for each element of the PDM, all mentioned categories and types of adaptation measures, i.e., flood-tackling operational measures applicable in the design of a public space, are outlined. In a second stage, all the highlighted measures are synthetized into measures deemed essential. Finally, these measures are compared with the Conceptual Framework to identify additional, potentially relevant types of solutions.
Before assessing Lisbon’s municipal adaptation plans, it is important to note that the city’s Master Plan took into account findings from previously established strategies, reports and plans such as PVL—Green Master Plan for Lisbon (1997), PGDL 2006–2008—Drainage Master Plan 2006–2008, EEAL 2008—Lisbon’s Energy and Environment Strategy (2008), CEL 2012–2024—Lisbon Strategic Charter 2010–2024, and AAE 2011—Strategic Environmental Strategy’ (2011), among others. (Author’s translation from original text: “PVL—Plano Verde de Lisboa”; “PGDL 2006–2008—Plano Geral de Drenagem para Lisboa 2006–2008; “EEAL 2008—Estratégia Energético-Ambiental para Lisboa 2008”; “CEL 2012–2024—Carta Estratégica de Lisboa 2010–2024”; and “AAE 2011—Avaliação Ambiental Estratégica 2011”). In regard to climate change, ‘Lisbon’s Energy and Environment Strategy’ and the ‘Lisbon Strategic Charter 2010–2024,’ greatly influenced municipal adaptation undertakings by delineating the double approach to climate change of mitigation and adaptation.
In view of a comprehensive analysis in the identification of the specifically proposed flood adaptation measures, all constituent and accompanying elements of the PDM were analyzed, namely the Accompanying Documents: (1) Master Plan Report and (2) Environmental Report, Strategic Environmental Assessment (2011) and the Constituent Elements (3) Regulations, (4) Technical Guide and (5) Planning Maps. All information is accessible on the municipality website (
www.cm-lisboa.pt).
Possibly as a result of diverging definitions in the Master Plan Report, it was possible to identify direct references to adaptation measures as well as indirect references. Indirect references include measures that, regardless of being considered as mitigation measures or not considered as either mitigation or adaptation measures in the Master Plan Report, are viewed as adaptation measures since they refer to flood-tackling operational measures applicable in a public space design that has addressed present and future climatic changes. In accordance, among the 16 adaptation measures specifically mentioned in the Master Plan Report, only five were considered as adaptation measures in the scope of this research. For example, the endorsement of renewable energy technologies or the promotion of pedestrian and bicycle circulation were considered as mitigation measures in this study, while retention basins or the goal to promote the collection and storage of rainwater were considered adaptation measures. Following the same line of reasoning, among the 26 mitigation measures identified in the report, four were considered to be adaptation and not mitigation measures, including the goal to promote source control interventions within the existing drainage network and the implementation of new tree alignments. Furthermore, within the main and accompanying reports of the plan, ten additional adaptation measures were identified regardless of their not being explicitly mentioned or related to climate change adaptation or mitigation measures: such as leaky wells, infiltration trenches or green walls. In the Constituent Elements of Regulations, 11 adaptation measures were identified and an additional four were identified in the Technical Guide. Within the Planning Maps, only three adaptation measures were disclosed with spatial representation.
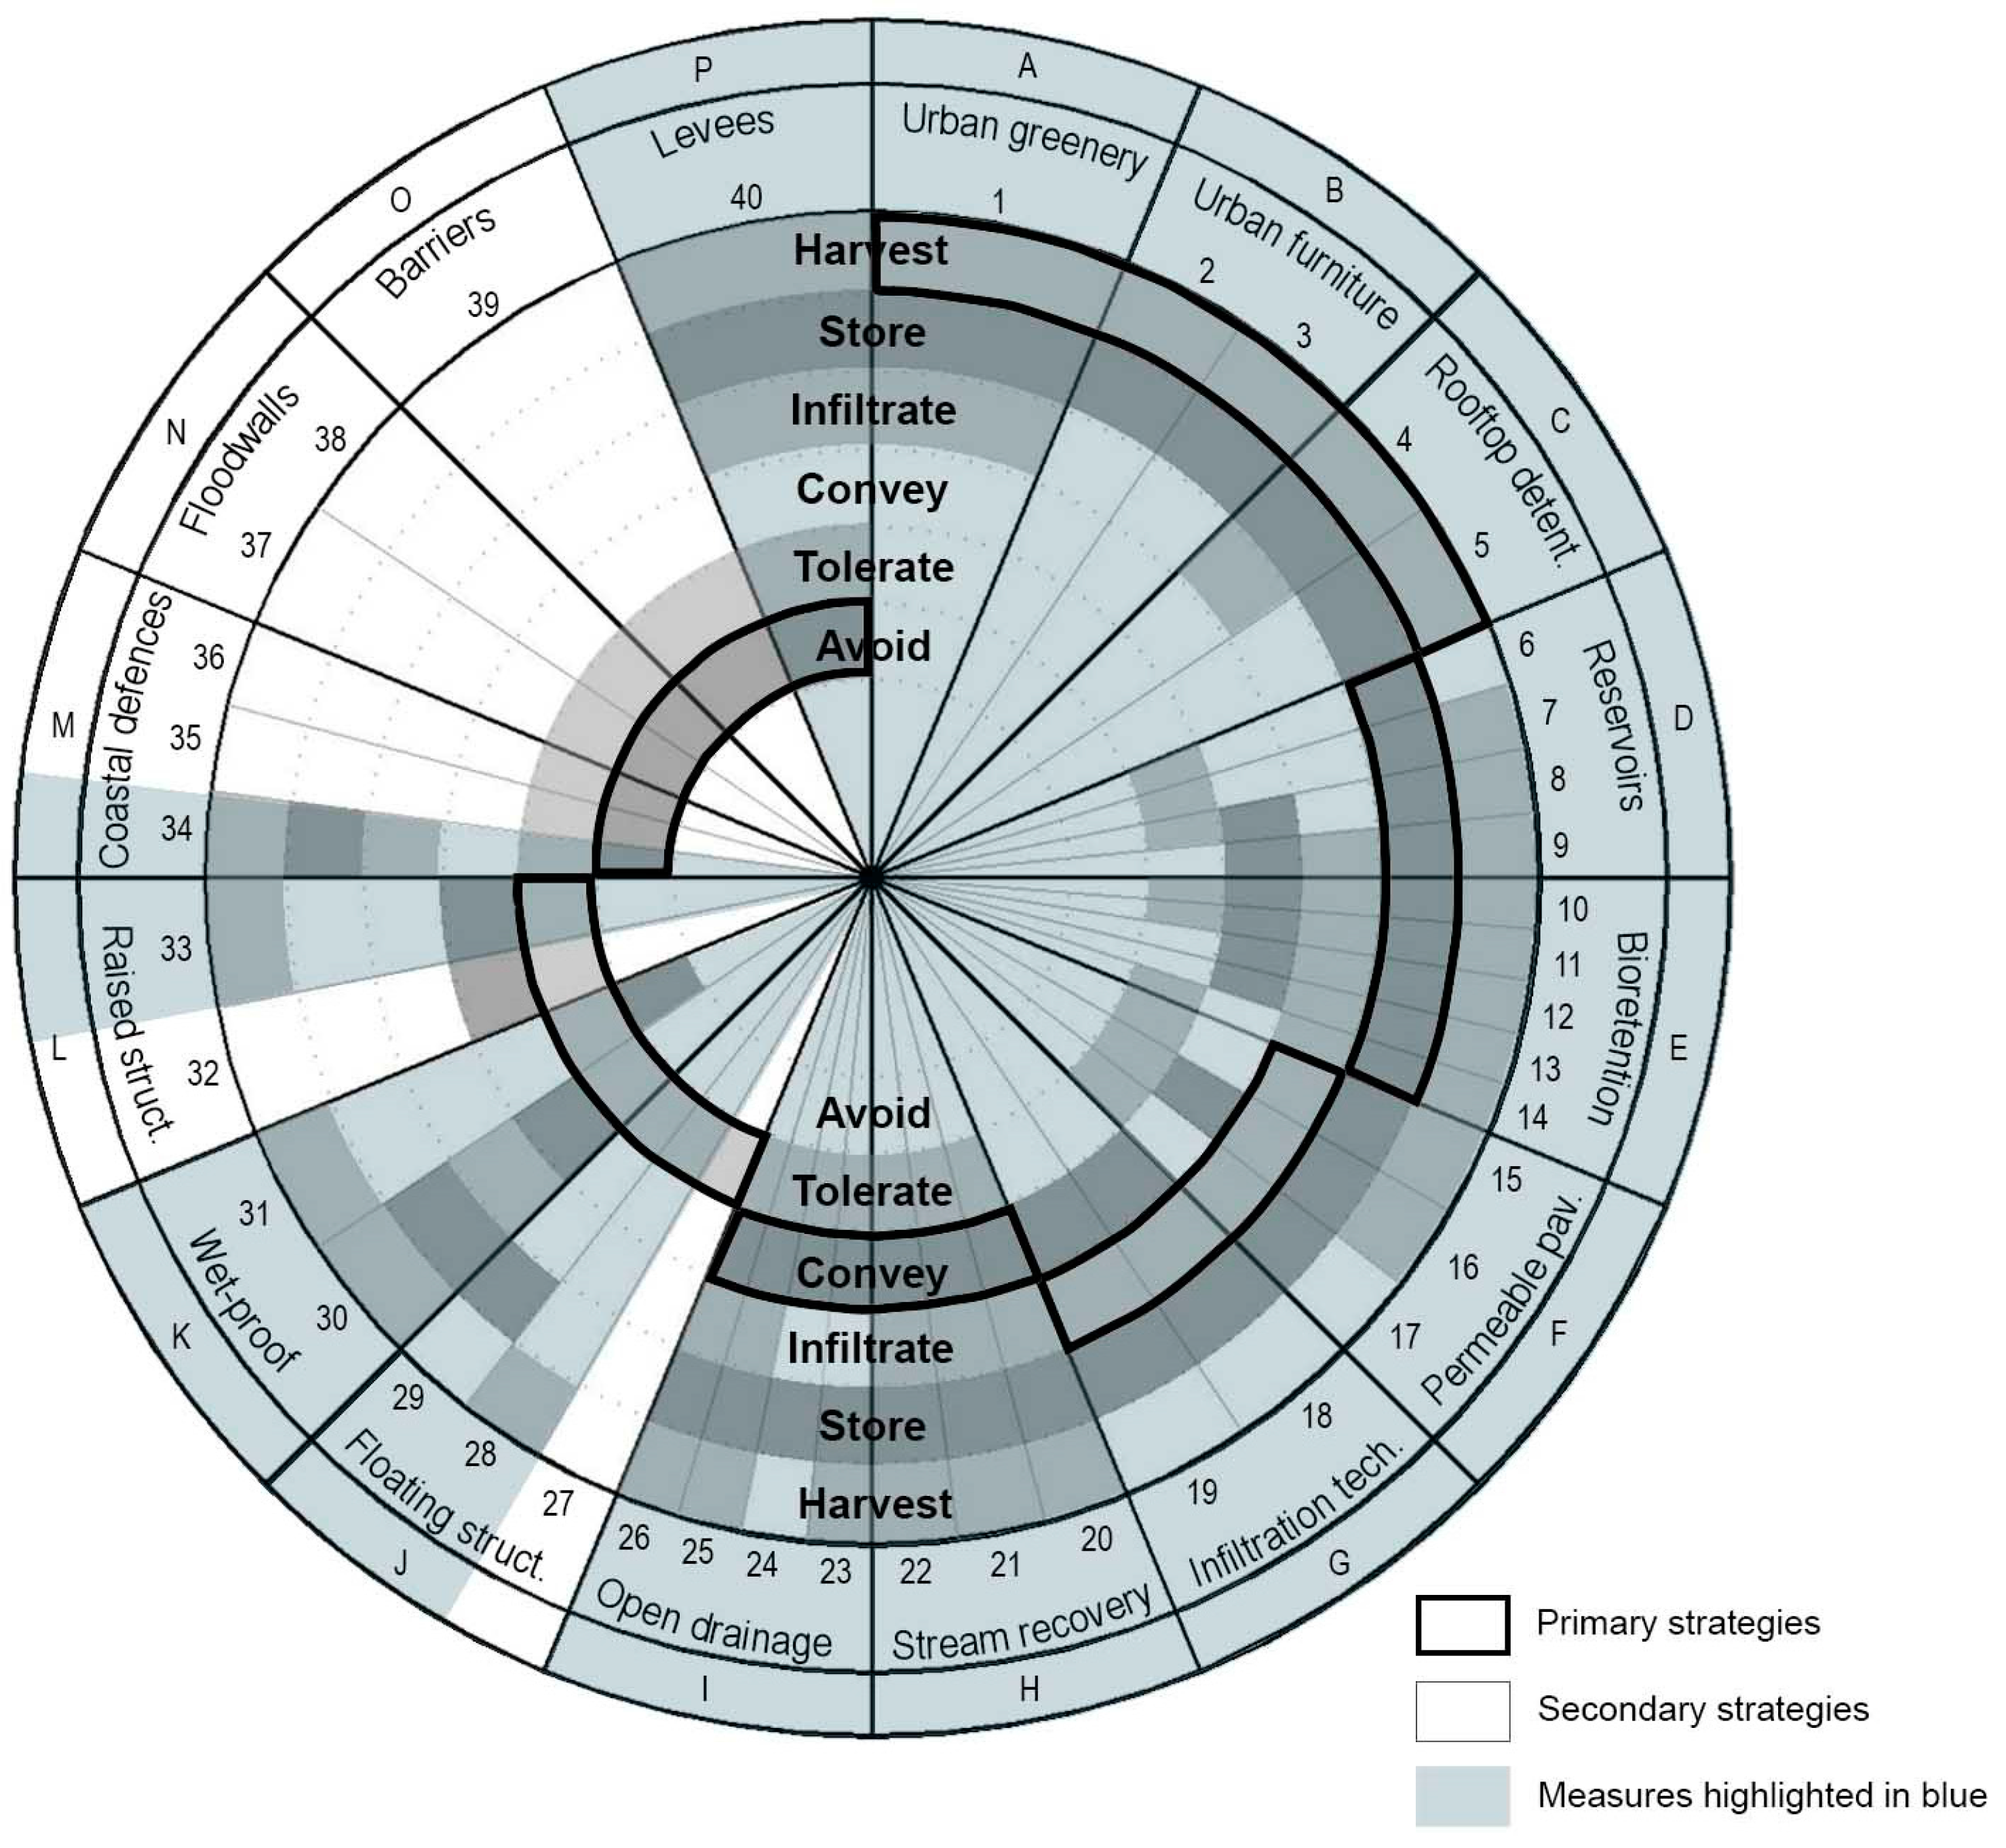
The strong emphasis given to the source control strategy is thus evident, i.e., the type of adaptation measure: (1) harvest (mentioned more than nine times throughout the analyzed documents) such as green walls, green roofs or tree alignments; (2) store (mentioned more than 12 times) such as bioretention basins, cisterns or underground reservoirs; or (3) infiltrate (mentioned more that 16 times) such as permeable paving, infiltration trenches or leaky wells.
Albeit more discreetly present, one other strategy that can be recognized throughout the PDM’s constituent and accompanying documents is the (4) Convey Strategy (mentioned more than six times). In light of the overall guiding principles of the general plan, this former strategy is associated with the need to preserve and increase superficial and underground drainage storm flows, together with the “requalification and valorization of water courses and their respective margins” ([
24], e.g., p. 93, author’s translation), here correlated to the types of measures of stream rehabilitation and restoration, within the previously mentioned Conceptual Framework. As a summary,
Table 1 and
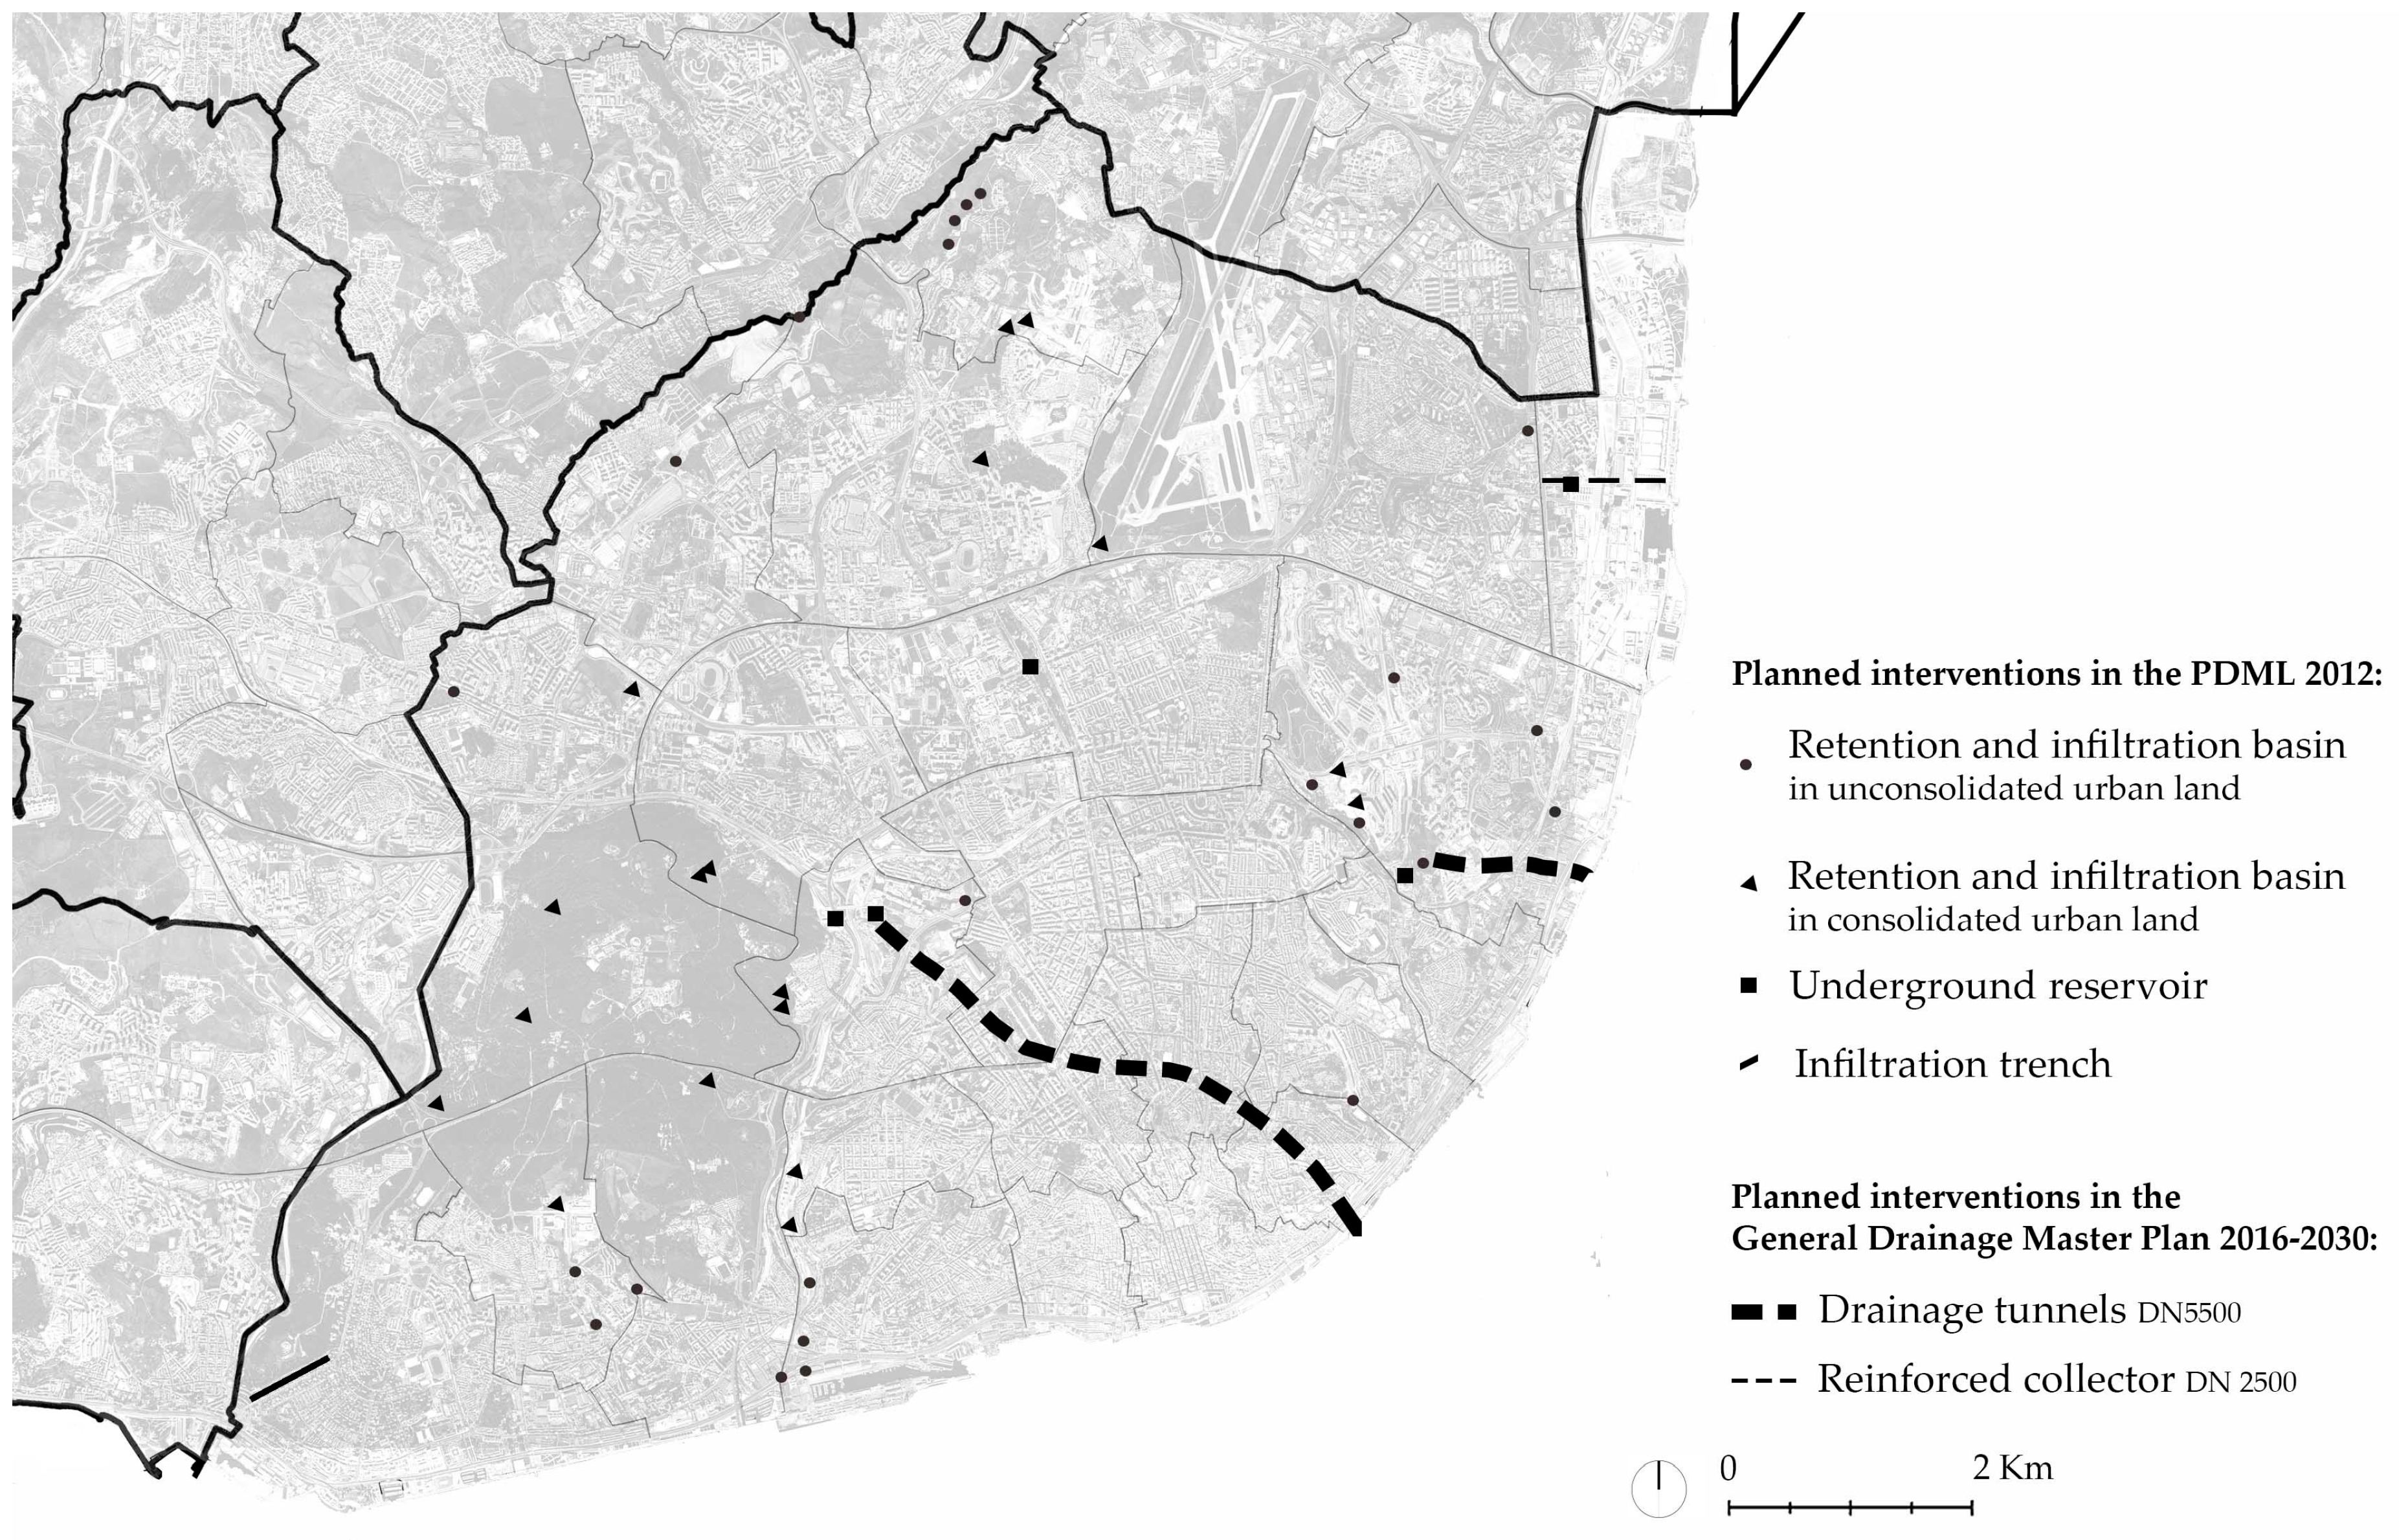
Figure 2 present the essential flood adaptation measures proposed by Lisbon’s PDM (2012) [
24].
When considering the most recent municipal climate change adaptation endeavors, one must also mention the updated Drainage Master Plan envisioned for 2017–2030, as well as the involvement of the municipality in the recent research project ClimAdapt.Local [
40]. In brief, the Drainage Master Plan 2017–2030 reinforces the Convey Strategy through the replacement of the underground reservoirs planned in the PDM with the construction of deviation tunnels that lead pluvial waters from the upper drainage basins towards the river (
Figure 2). On the other hand, the recent ClimAdapt.Local research project aims to develop the integration of municipal climate change adaptation strategies and measures that rather prioritize and bolster the source control strategy.
As can be noted, efforts continue mainly at the strategic level. With the exception of traditional solutions, such as underground reservoirs or deviation tunnels, the PDM is a long way off from concrete adaptation actions, specifically concerning detailed implementation designs.
Besides promoting action in line with municipal goals for more adapted cities, the following will focus upon the question of whether the highlighted Conceptual Framework can provide measures to be additionally considered.
4.3. Identification of Potential Implementation Areas
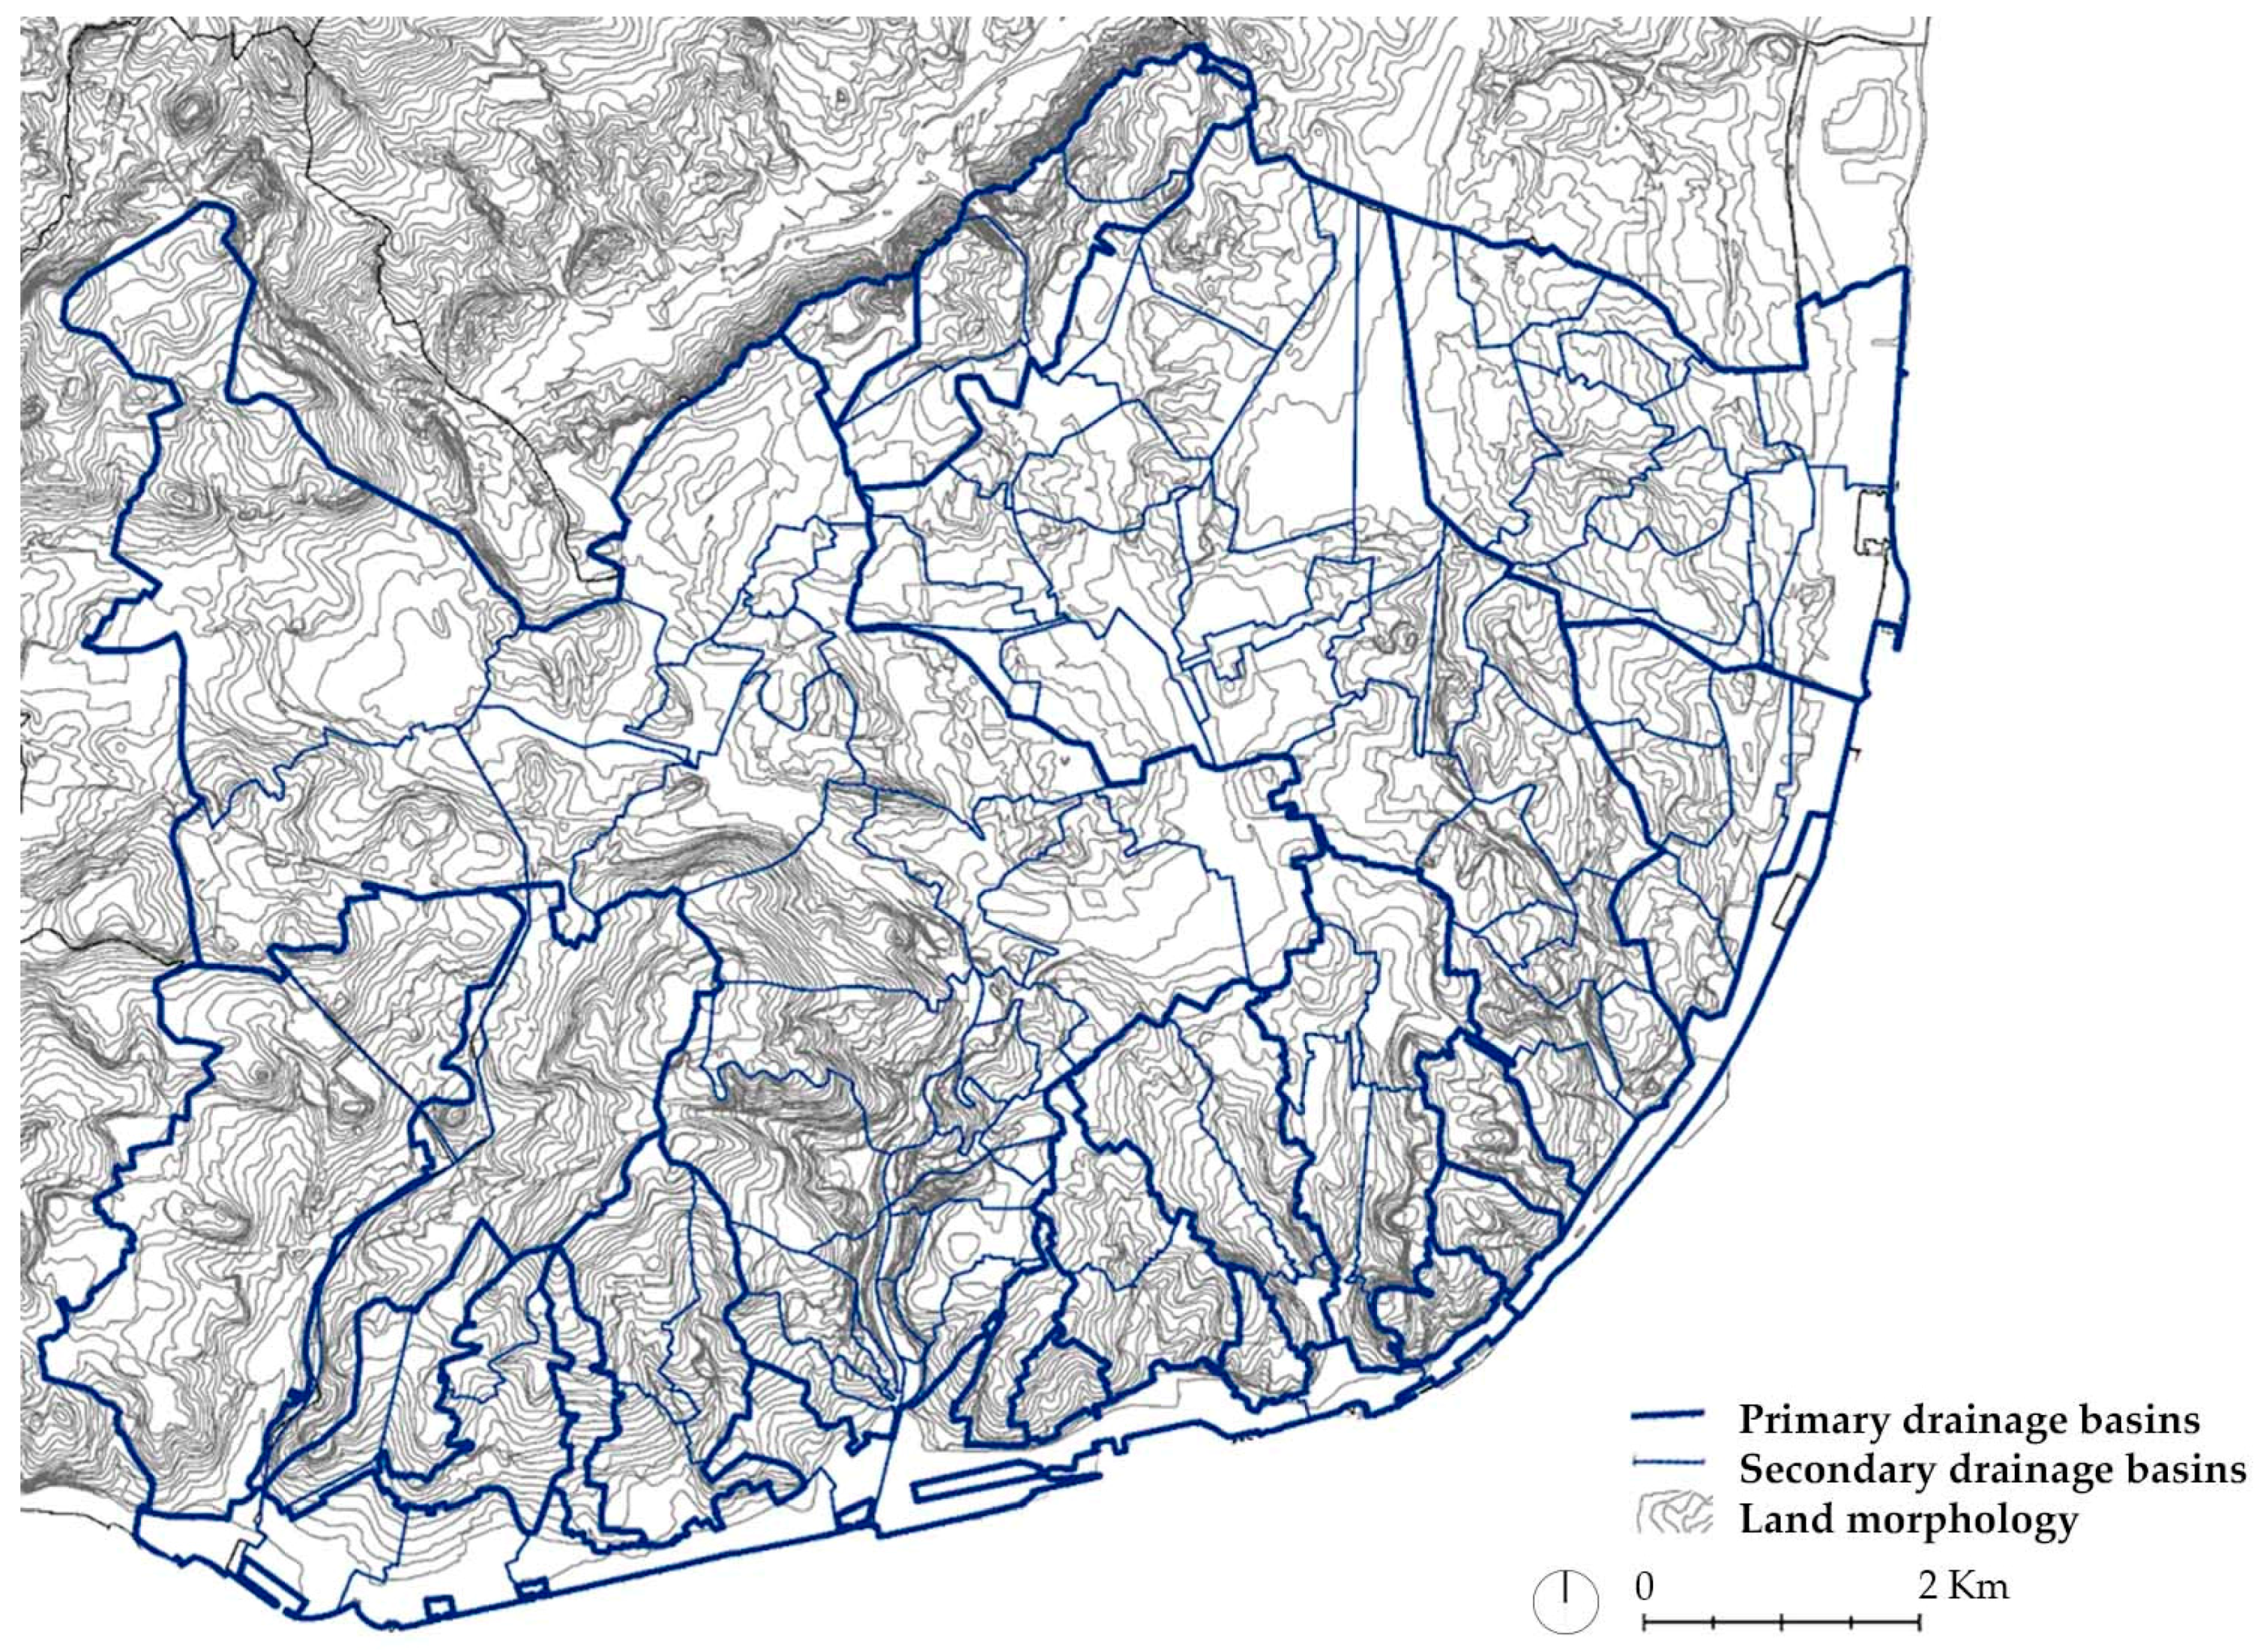
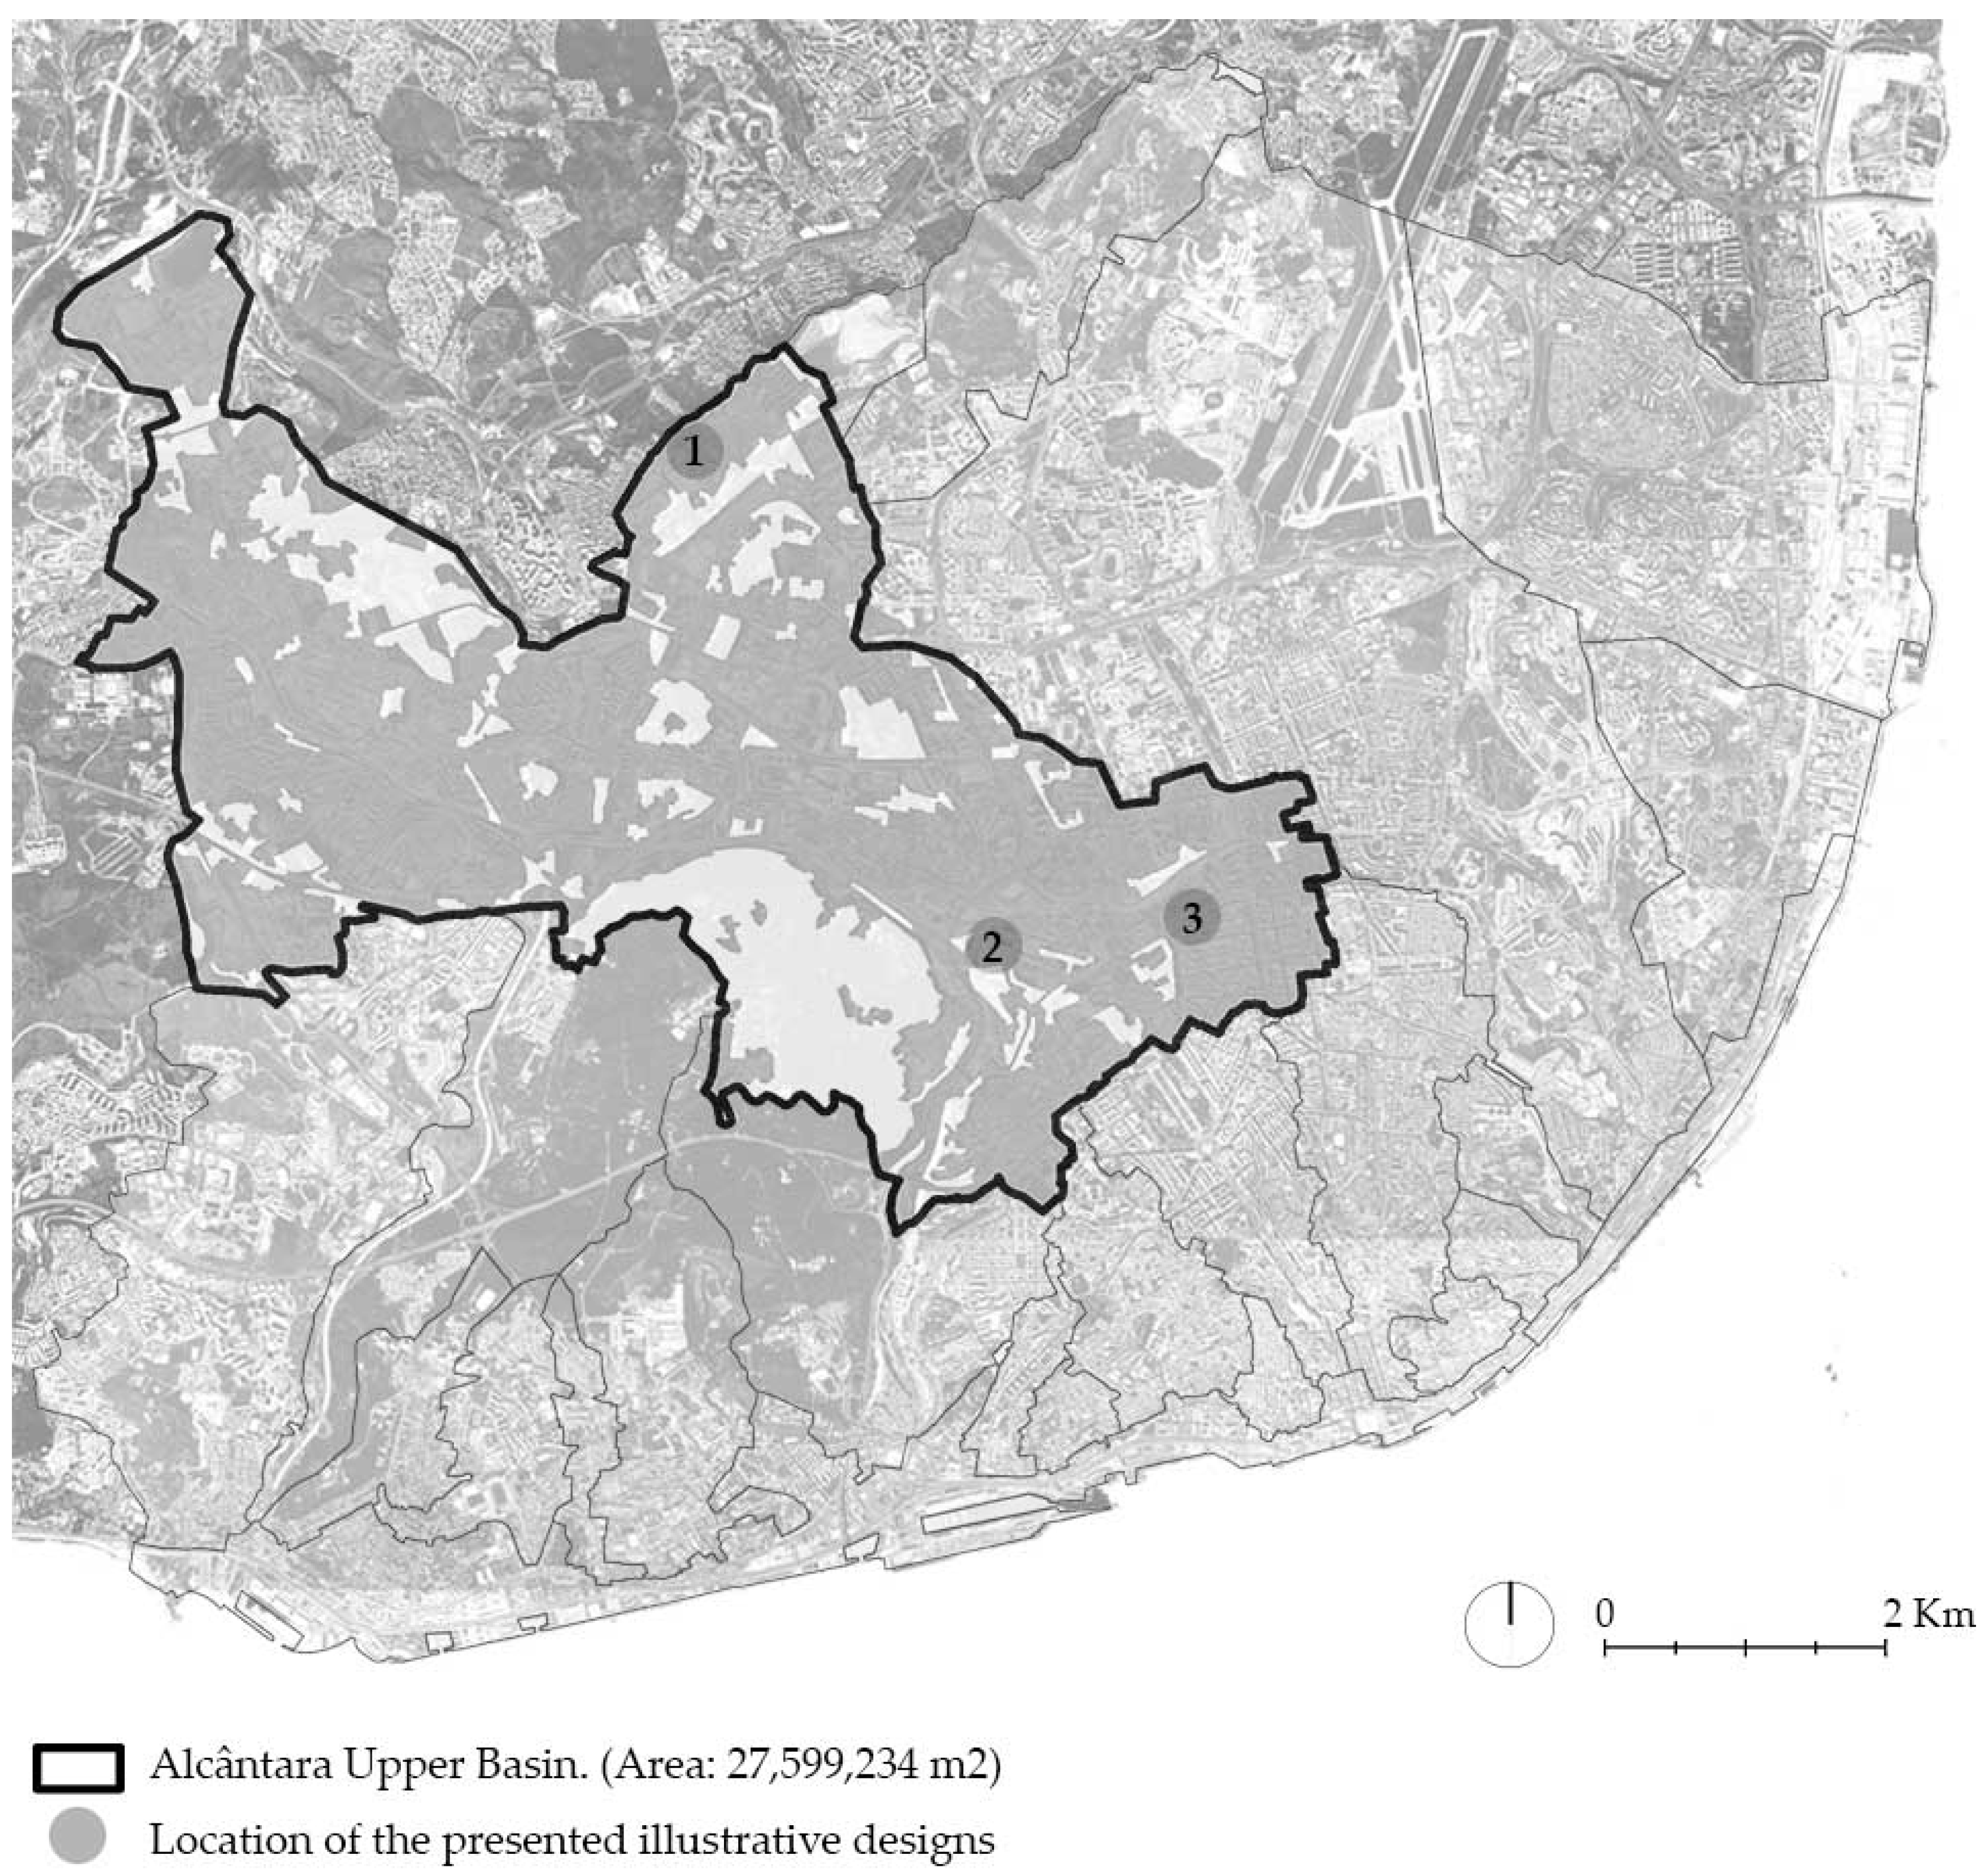
In order to assess the applicability of the additional alternatives previously mentioned in the Lisbon case, as well as their overall infrastructural significance, a particular representative area was chosen for subsequent analysis. The area corresponds to the “Alcântara Upper Basin” (AUB), covering and area of almost 3000 ha; topographically, it is the highest portion of the Alcântara valley and significantly contributes to severe periodic downstream flooding. Even without considering the Lower Alcântara Basin, the AUB is still the biggest hydrographic basin affecting the city of Lisbon.
To identify the potential area for public space adaptation, an in-depth analysis is made using the most comprehensive spatial data available. In the case of Lisbon, the most up-to-date and detailed analysis of land use occupation corresponds to the “Map of Land Use and Land Cover for Continental Portugal 2007” (COS 2007). Because it is specifically focused on the “ground plane of public spaces” (as in [
41]), the potential area of intervention is reduced, thereby contributing to the conservative nature of the developed estimate.
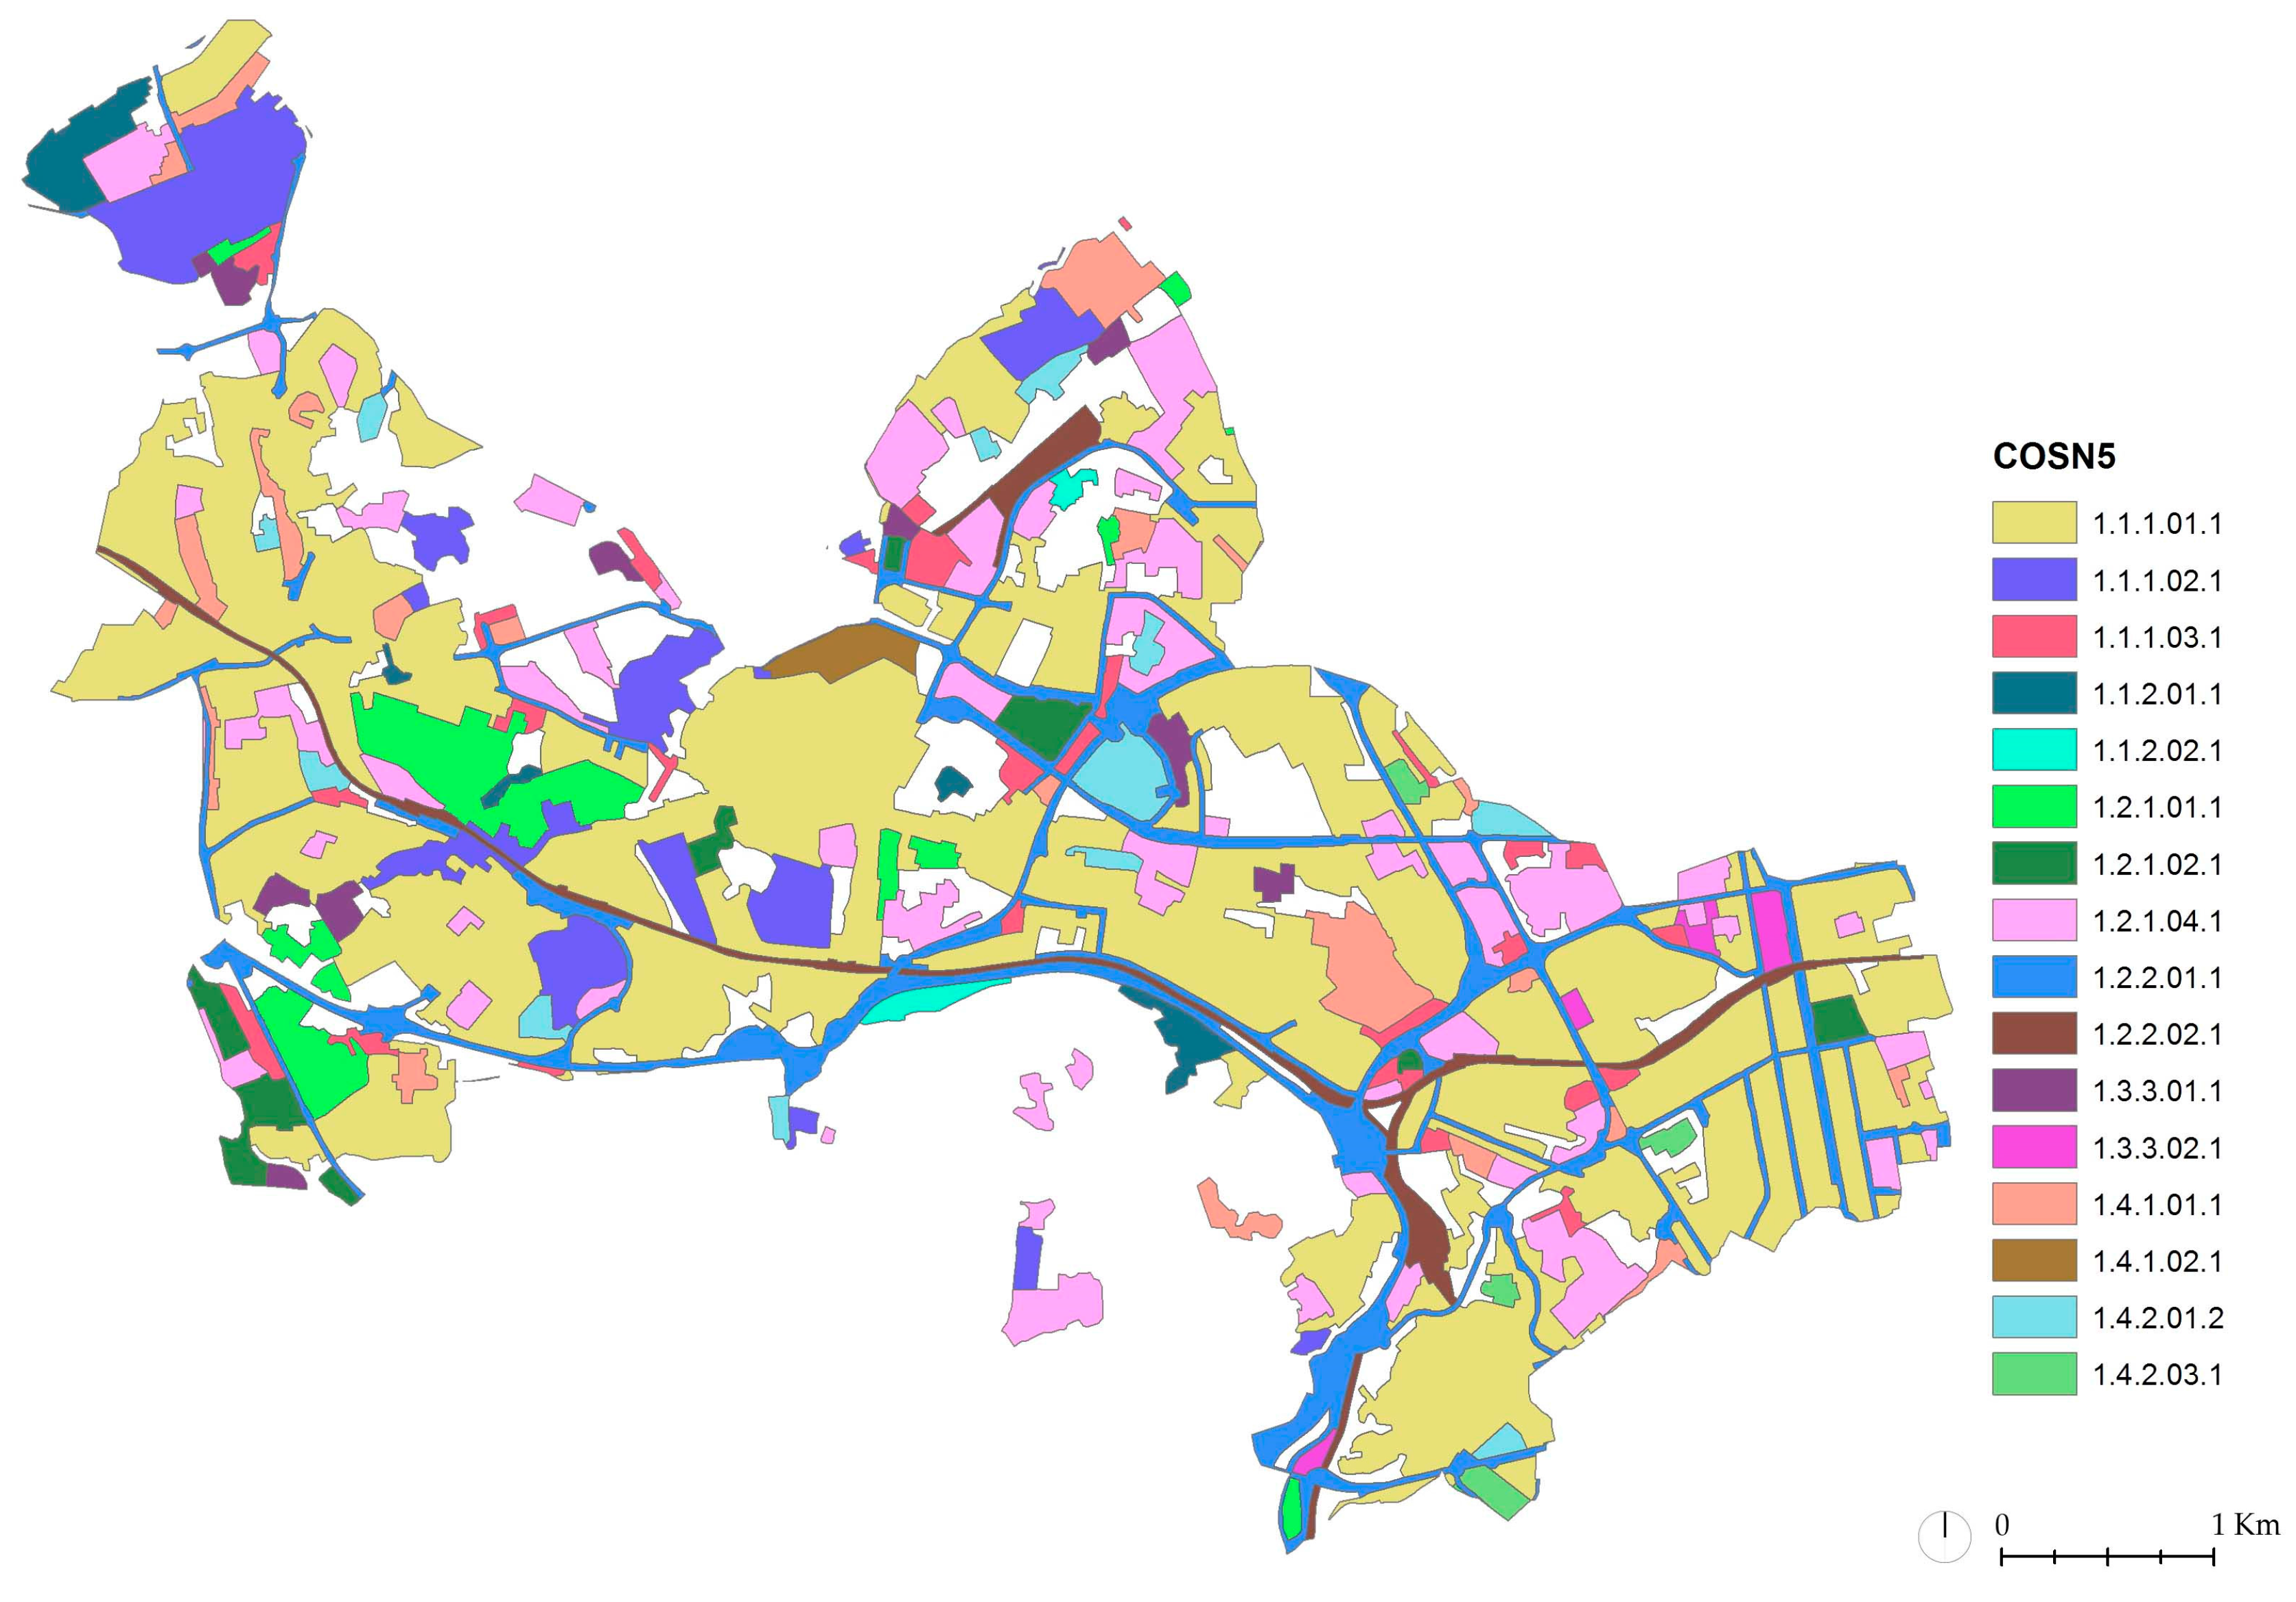
The nomenclature and structure of COS 2007 consists of a hierarchical system of occupation classes of land use at five levels of precision. However, as this analysis is focused on urban territories, only the occupation class, “1. Artificial territories”, is considered (
Figure 4).
In searching potential areas for public space adaptation—i.e., impermeable public spaces that contribute to the overload of the sewerage and drainage system—the following two-stepped analysis was developed: (1) impermeable areas within each of the 16 identified COS sub-classes are identified; and (2) considering the COS sub-classes with higher percentages of impermeable areas, an estimation of the corresponding impermeable public spaces is developed through a spatial two-dimensional analysis of representative study areas.
The first analysis was developed through the use of GIS software ArcMap 10.1 (Esri, Redlands, CA, USA). Within the study area of the AUB land use occupation, class “1. Artificial territories” was “intersected” with the 100% impermeable area as indicated in the latest European Environmental Agency (EEA) soil-sealing raster information [
23]. This raster data includes a continuous degree of soil sealing ranging from 0–100% in an aggregated spatial resolution of 20 × 20 m. The specific value of being 100% impermeable was used for the development of this research, and not “over 80%” or “over 90%”, to pursue the standards of a conservative analysis. Before the presented quantitative area results in
Table 2, only the seven COS sub-classes with greater impermeable rates (outlined in grey) were chosen for subsequent analysis.
To estimate the potential areas for public space adaptation within each of the seven outlined COS sub-classes, three representative study areas for each sub-class were spatially outlined, analyzed and compared. For each of these areas, the percentage of impermeable public spaces was calculated by subtracting the areas of buildings, roads and railway lines with the respectively identified 100% impermeable area. The resulting comparison among the three representative areas for each of the six COS sub-classes enabled the conservative generalization arising out of the lowest identified percentage of impermeable public space. For example, for the COS sub-class 1.2.2.01.1 designated “Roads and associated spaces,” the percentage of existing impermeable public space was calculated for the streets (1) Av. Berna, (2) Av. dos Combatentes and (3) Av. Dos Condes de Carnide (
Figure 5). Results corresponded to 12.95%, 27.23% and 16.41% of impermeable public spaces, respectively. As such, 13% was used as the general percentage of impermeable public spaces for all COS sub-class 1.2.2.01.1 “Roads and associated spaces”. Similarly, for the COS sub-class 1.2.1.04.1 designated “Public and private facilities”, the percentage of existing public space was calculated for three representative areas. Results corresponded to 81.41%, 69.04% and 71.60% of impermeable public spaces. Accordingly, 69% was used to determine the overall impermeable public spaces within COS sub-class 1.2.1.04.1 “Public and private facilities”. The same methodology was applied to the remaining sub-classes, giving rise to the impermeable public spaces for each class or, in other words, the “Potential Area for Public Space Adaptation” (
Table 2).
In light of the presented analysis, the land use sub-class “Parking lot and courtyard areas” (1.1.1.03.1) is where most opportunities for public space adaptation lie; 67.97% of its respective total analyzed area (507,111.25 m2) is likely to be adequate for intervention.
Further significant opportunities for public space adaptation are evidenced in the land use classes of “Predominantly horizontal continuous urban fabric” (1.1.1.01.1), “Predominantly vertical continuous urban fabric” (1.1.1.01.1) and “Public and private facilities” (1.2.1.04.1), with a potential adaptation area of 44.63%, 41.83% and 39.03%, respectively. Comparatively, reduced opportunities can be observed in the land use classes of “Roads and associated spaces” (1.2.2.01.1) and “Rail network and associated spaces” (1.2.2.02.1). Moreover, there are no obvious opportunities in areas occupied by industry. Overall, the 35.63% of total percentage of potential area for Public Space Adaptation in relation to the total analyzed area (18,714,796.78 m2), is significant enough to be considered when analyzing available assets and opportunities regarding flood adaptation action.
4.4. Possible Designs and Their Infrastructural Significance
In order to assess the infrastructural significance of some of the highlighted types of adaptation measures that entail source control strategies applicable to the ground plane of public spaces, a basic premise was followed. This premise is the capacity of the adaptation measures to retain a minimum of 25 mm height of rainfall from “first flush” precipitation on a given impermeable area. This methodology is somewhat similar to New York City’s “Green Infrastructure Plan”, Philadelphia’s “Green Streets Program” or London’s “Drain London Programme”.
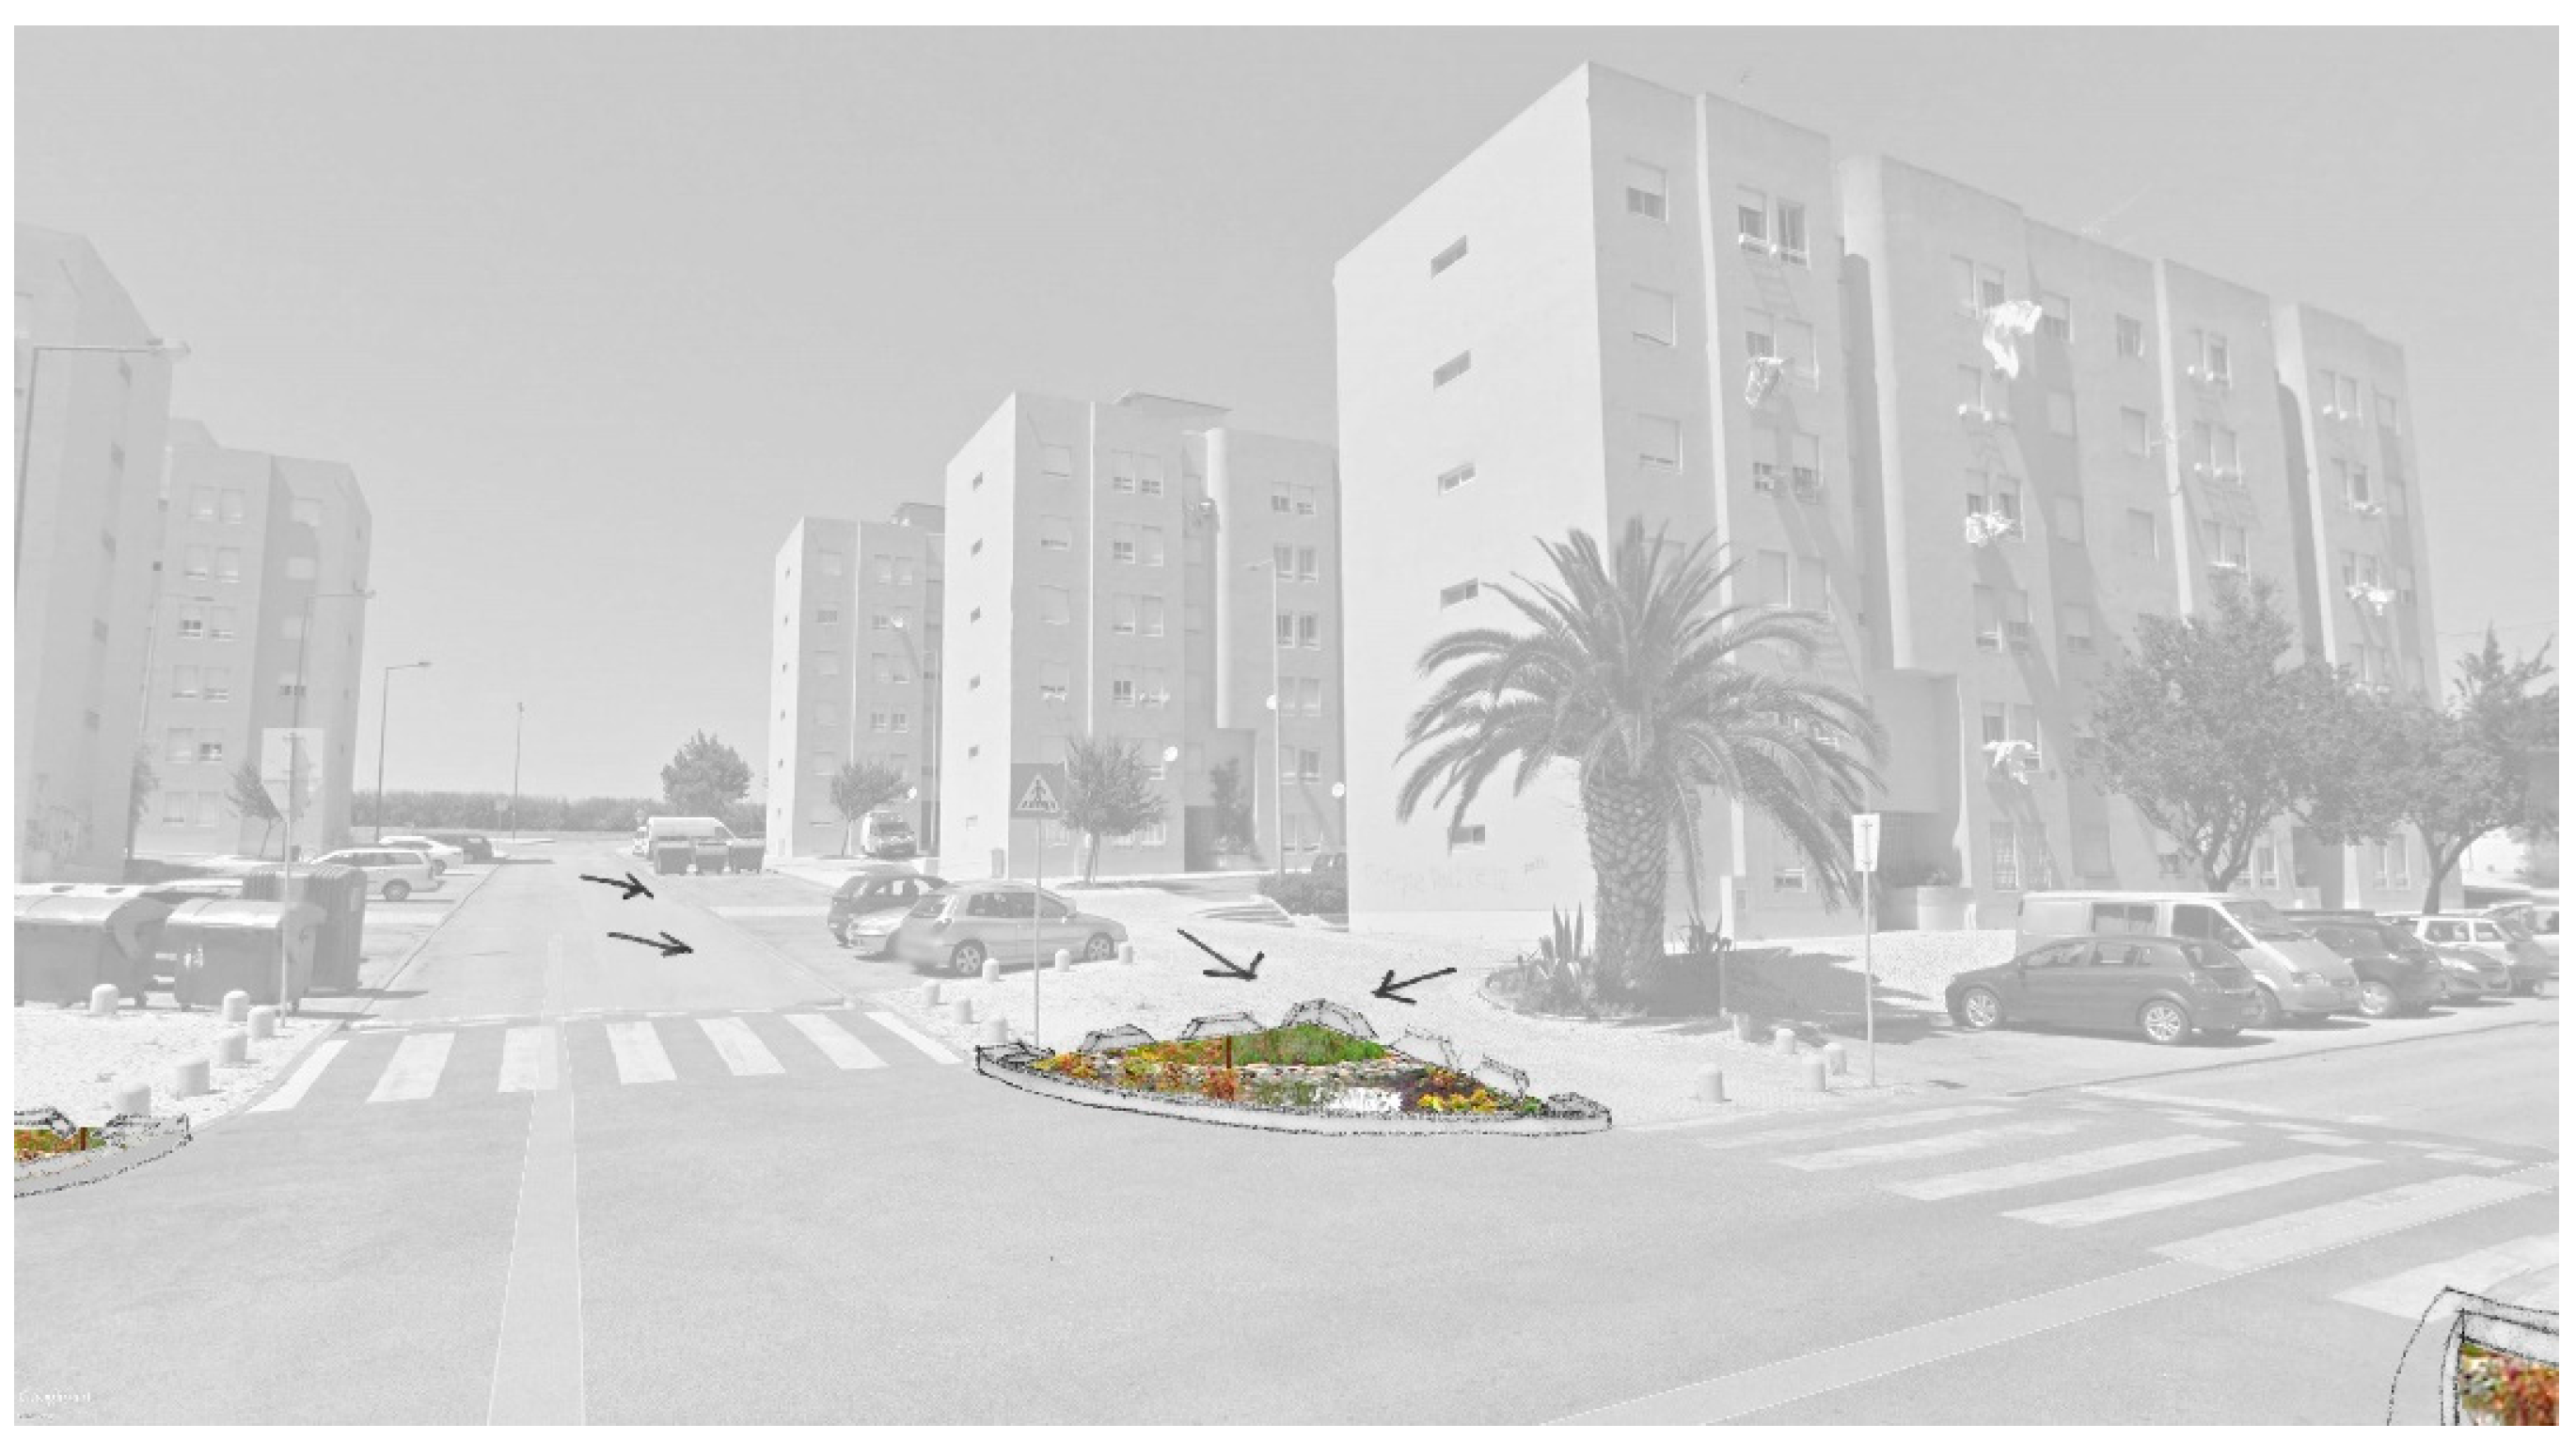
In the interest of verifying the applicability of the given premise in concrete situations within the city of Lisbon, and assess its infrastructural significance with quantifiable means, three preliminary study projects were developed. The first took place in a residential area at Carnide; the second, in a parking lot at Campolide; and a third, in part of the six-way street of Av. Berna (
Figure 5).
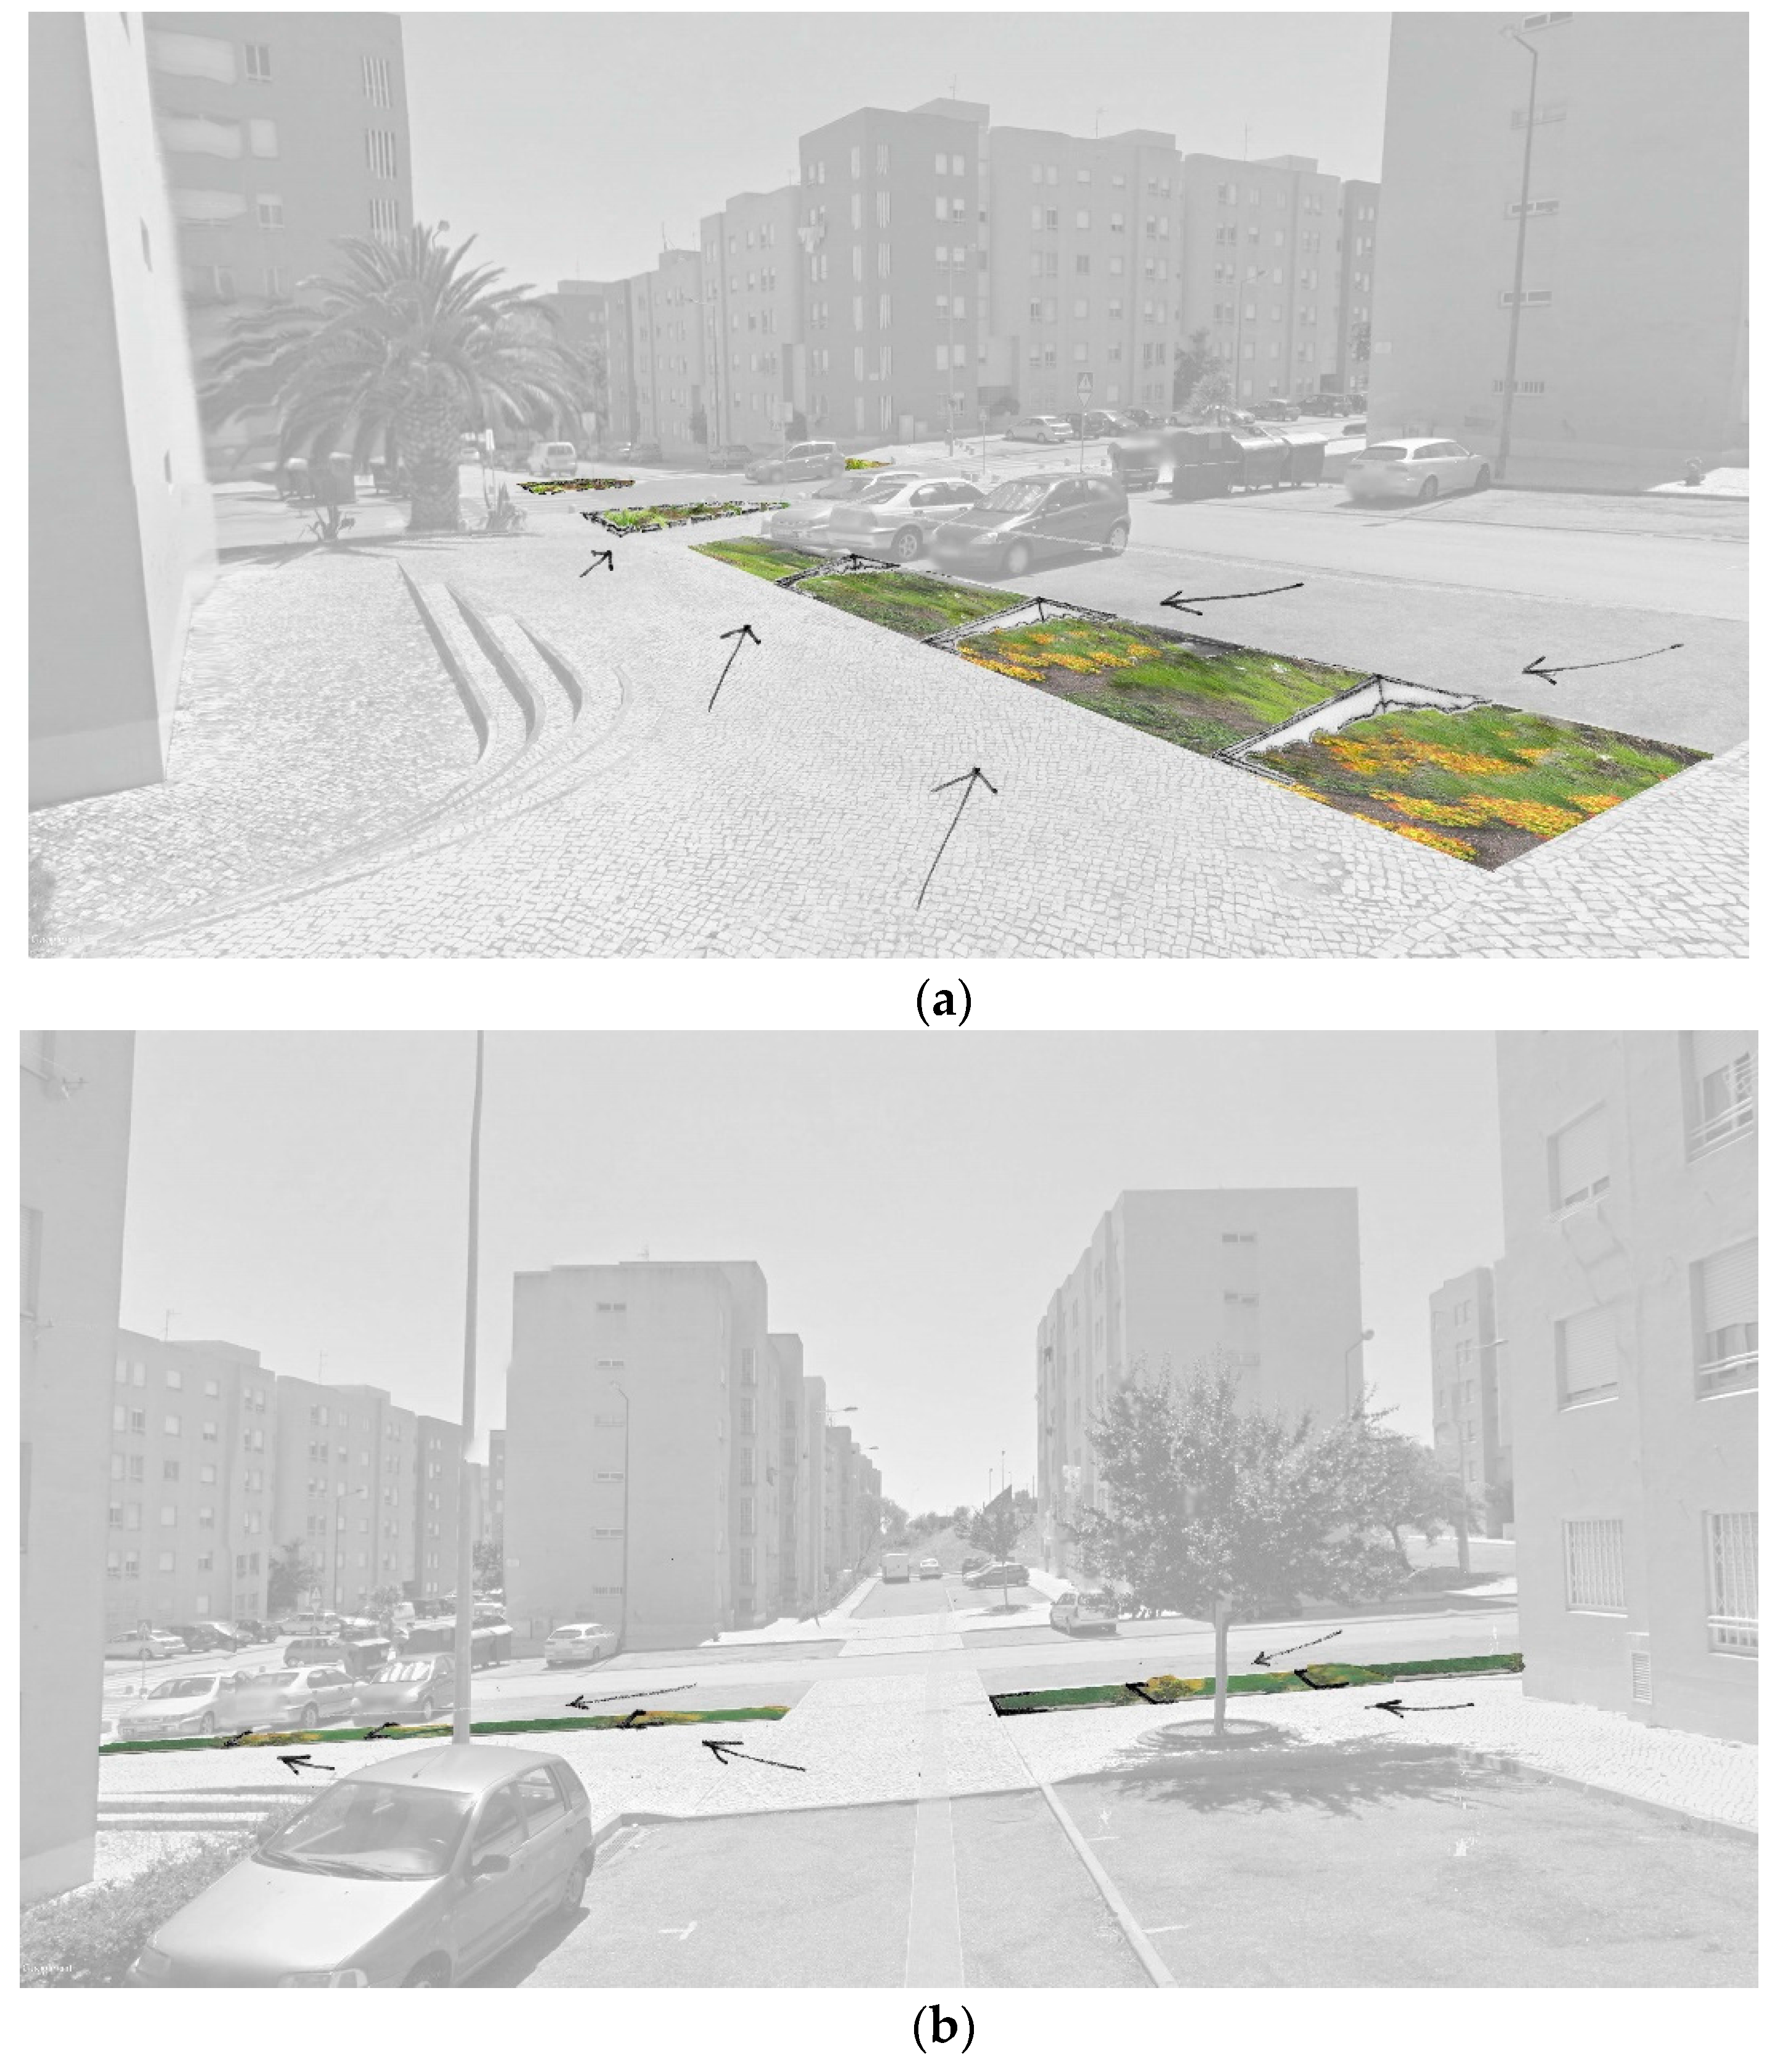
These projects have included some of the additional measures previously identified as potentially adequate for Lisbon’s flood adaptation undertakings, namely: bioretention planters, bioswales with check dams, rain gardens and green gutters. Other types of adaptation measures, with primary capacities for source control, could have been used, such as cisterns, art installations or water plazas. Most of these additionally highlighted adaptation measures are not limited to the existence of large, unbuilt territories to justify their application, especially when compared to retention and infiltration basins or underground detention reservoirs. Indeed, the options used in the following illustrative designs and subsequent analyses entail small interventions that may be applied to all urban territories, whether compact or disperse.
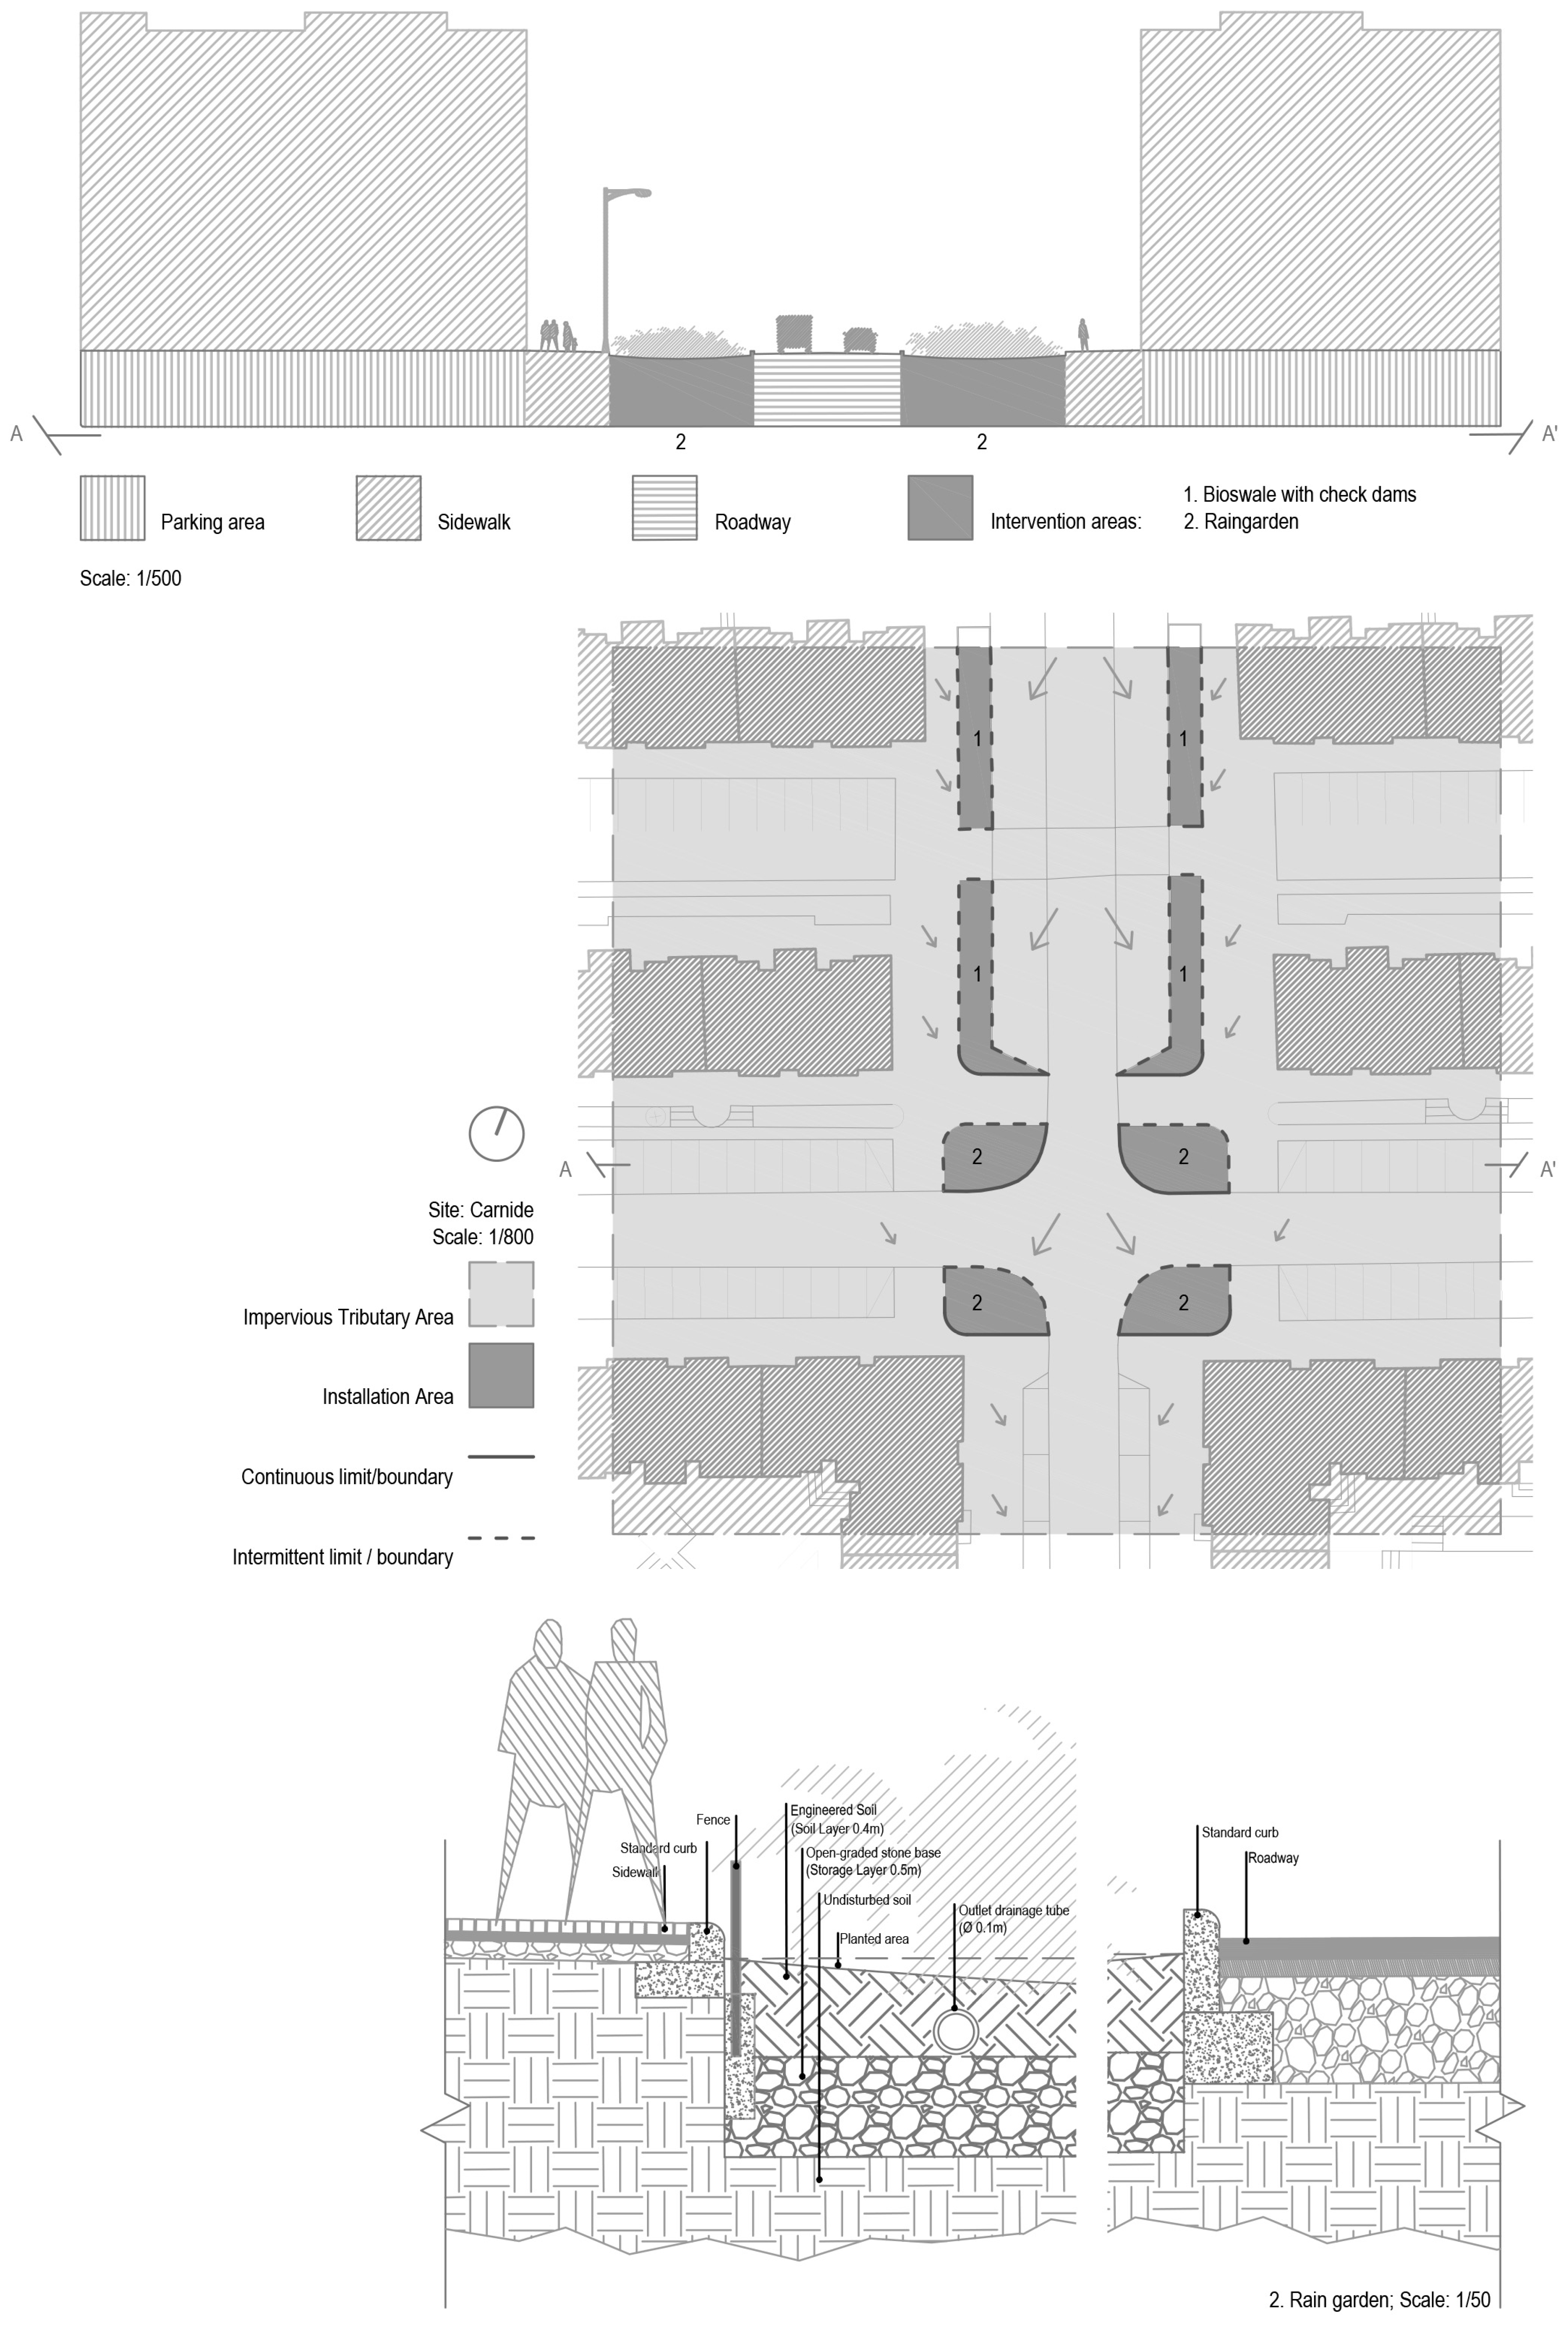
The first studied site consists of an impermeable tributary of 4581.43 m
2 in a residential area of Carnide. In accordance with the expected retention of the first 2.5 cm of stormwater falling within this area, adaptation measures must specifically manage at least 114.54 m
3 of stormwater volume. To this end, two adaptation measures are proposed: (1) bioswales with check dams and (2) rain gardens (
Appendix A.1 —Preliminary design 1). The bioswales with check dams are designed to comprise a soil layer with 0.3 m depth and a storage layer of 0.2 m, while the rain gardens are designed to have a soil layer with 0.4 m depth and a storage layer with a depth of 0.5 m. In accordance with the expected storage capacity volume of each layer and standardized infiltration rate [
42], the management of 119.20 m
3 of stormwater is estimated. As the sum of infiltration volume and all storage volumes is greater than “2.5 cm stormwater volume within impermeable tributary area”, this proposed intervention fulfills the proposed objective. In this case, measures are implemented in 9% of the total impermeable area.
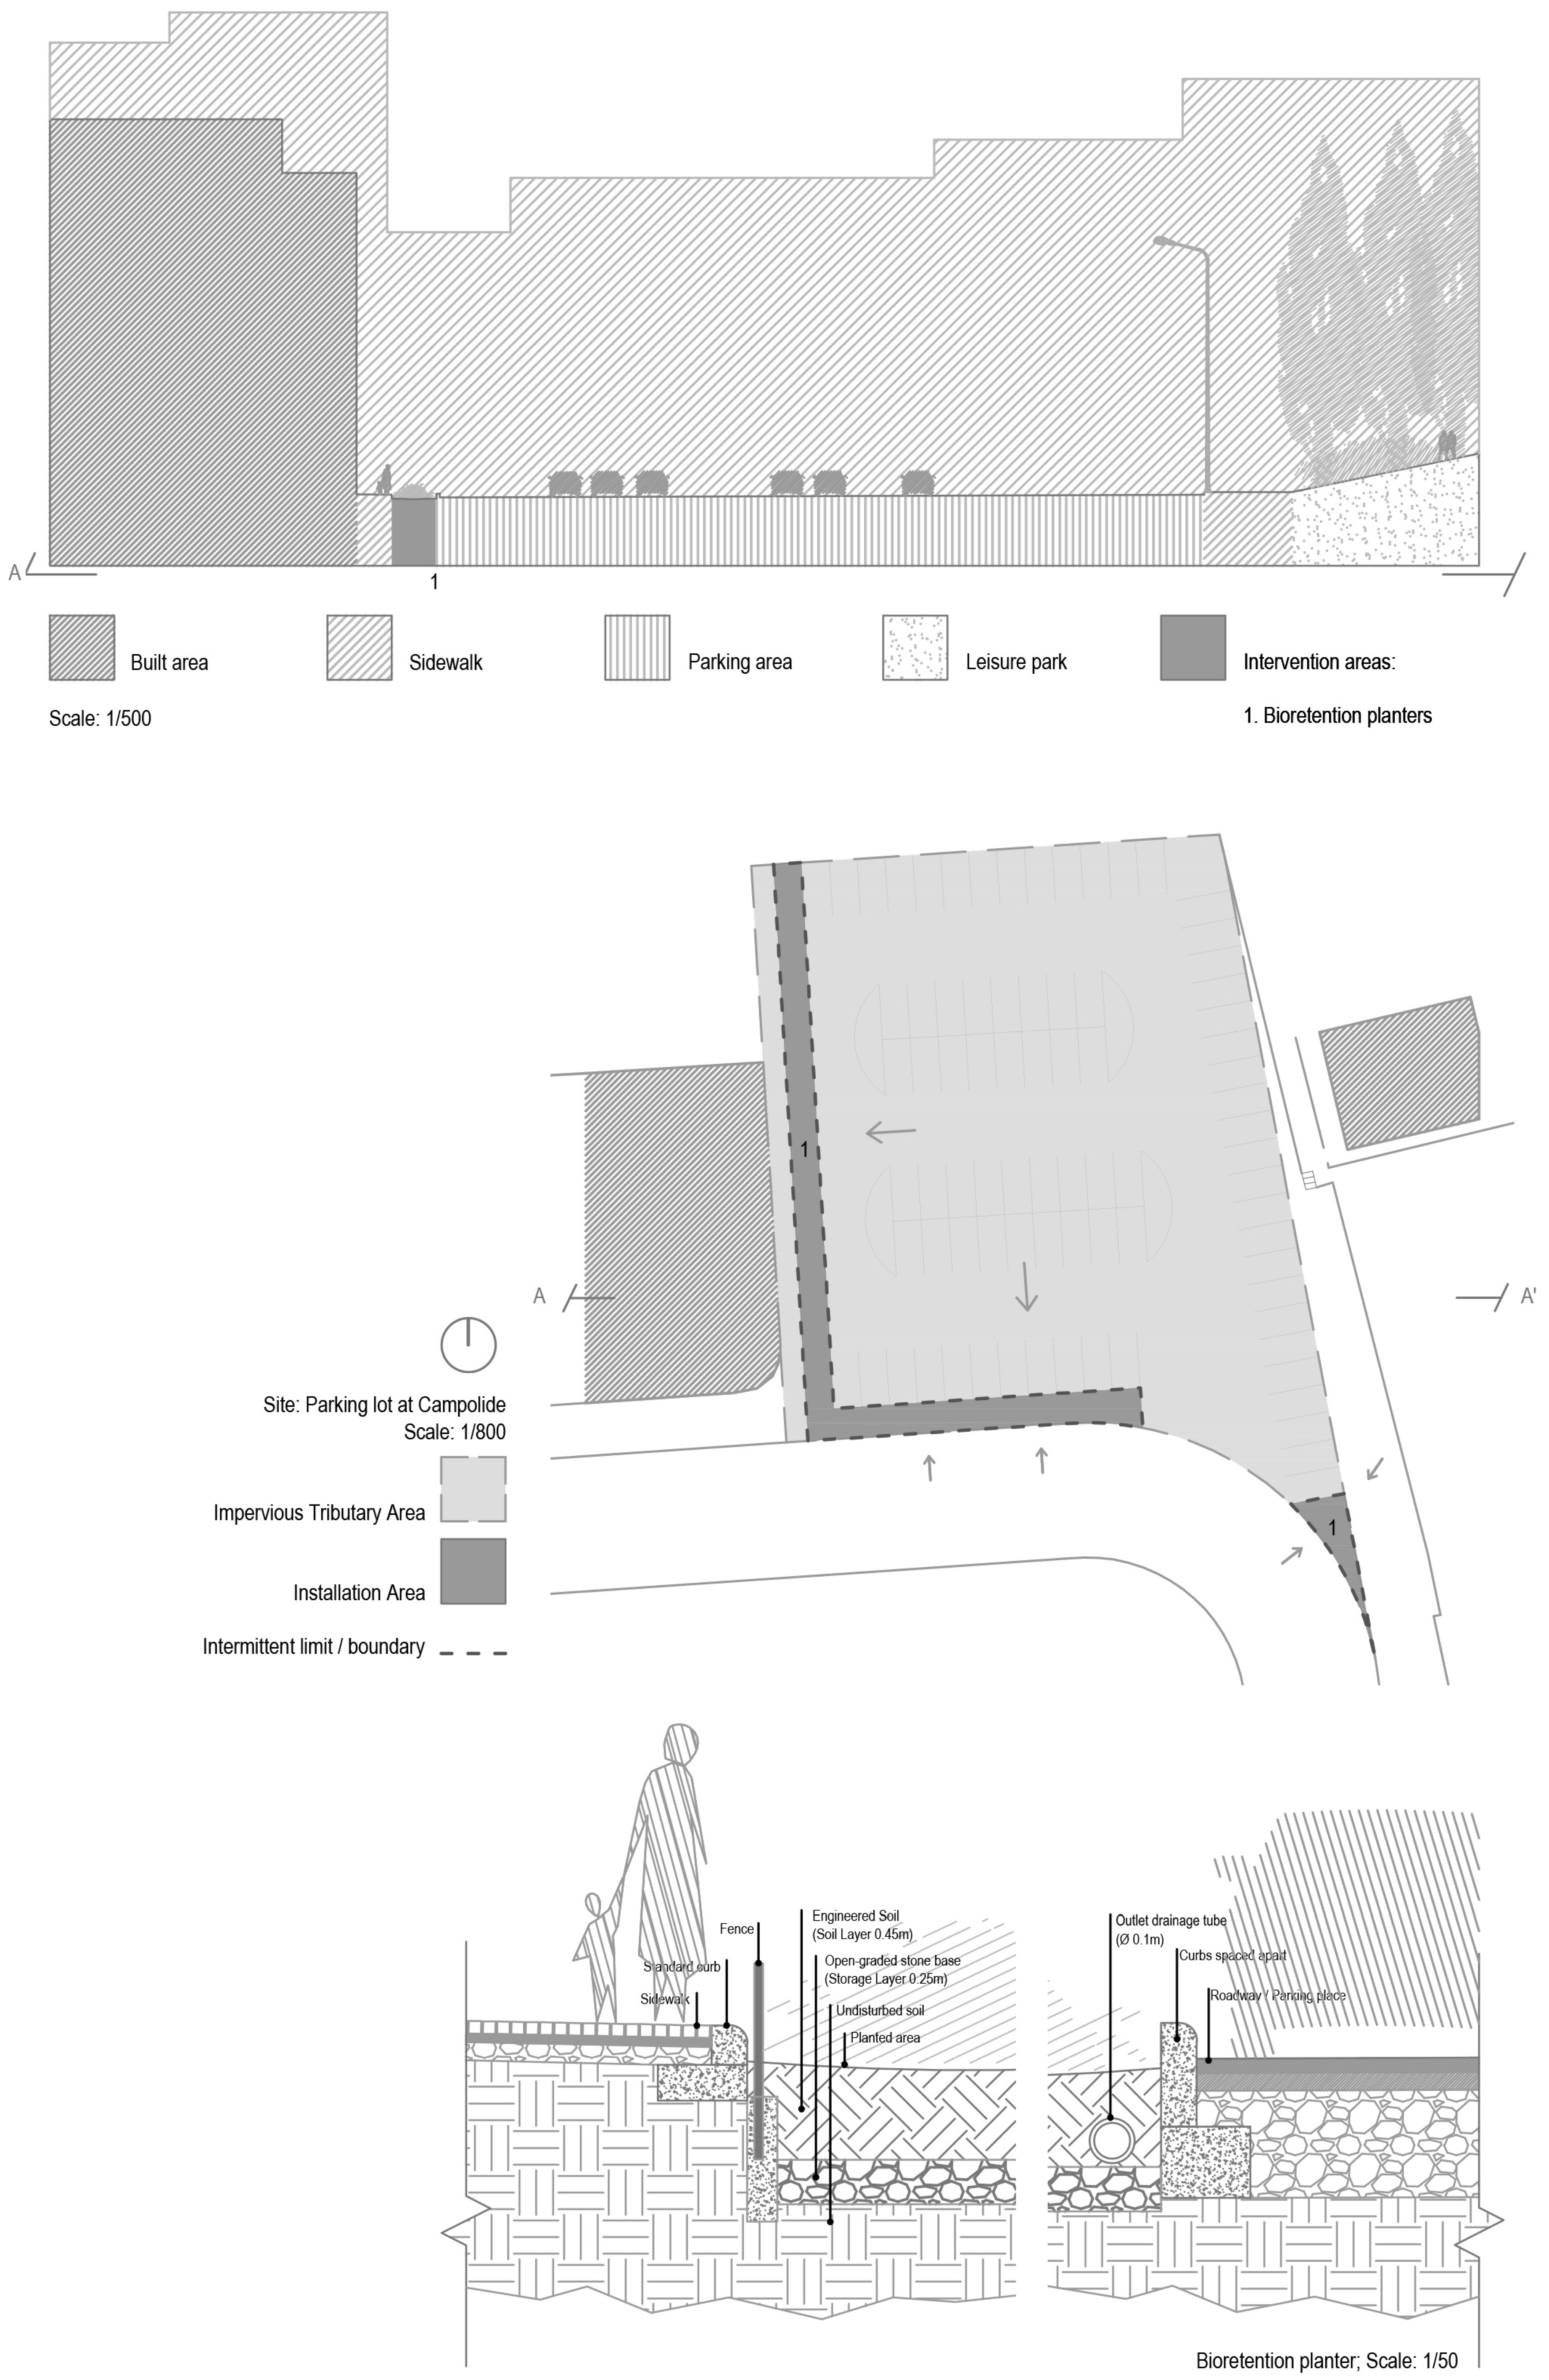
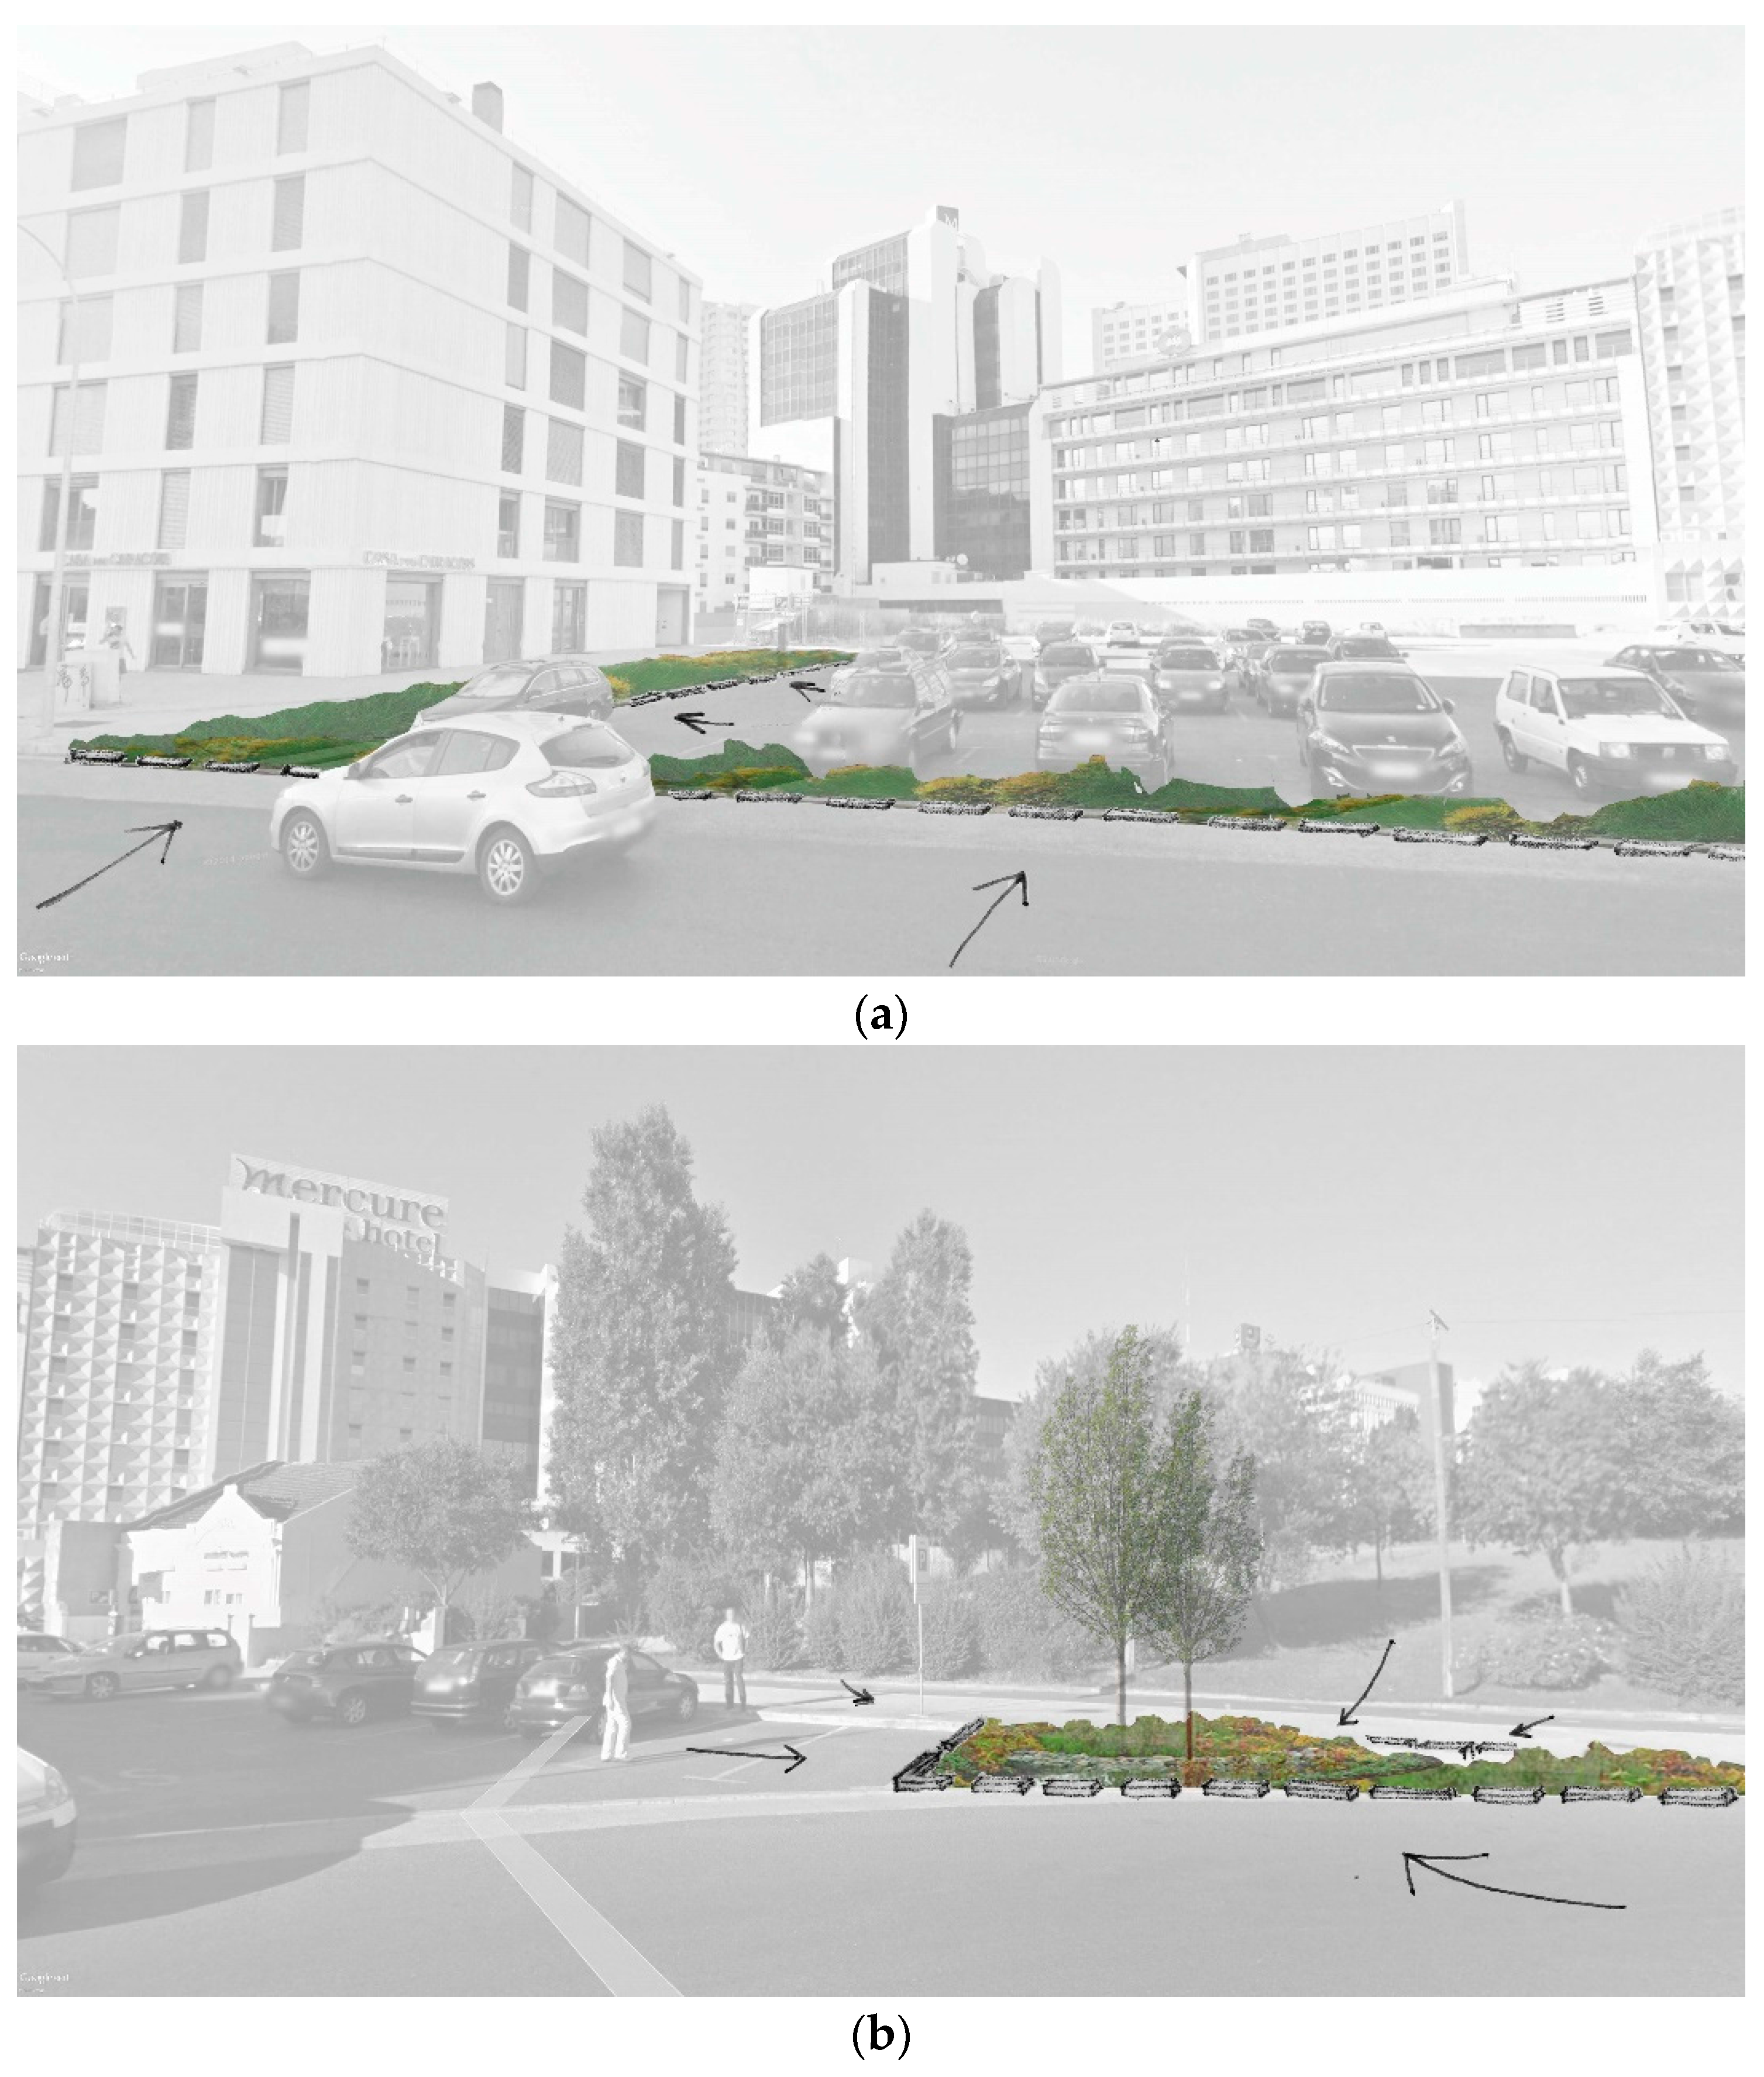
The second studied site encompasses a parking lot in Campolide with a total impermeable area of 2,456.41 m
2. In this situation, the goal consists of managing at least 61.41 m
3 of stormwater volume. For this purpose, bioretention planters are proposed in approximately half of the parking lot perimeter limit (
Appendix A.2—Preliminary design (2), in a total area of 225.71 m
2. More specifically it is proposed for the soil layer to have 0.45 m of depth and the storage layer 0.25 m. In accordance, it is estimated that 62.78 m
3 of stormwater could be managed. The proposed to manage 61.41 m
3 volume from first-flush stormwater at this site is thus accomplished by an intervention in solely 9% of the total impermeable area.
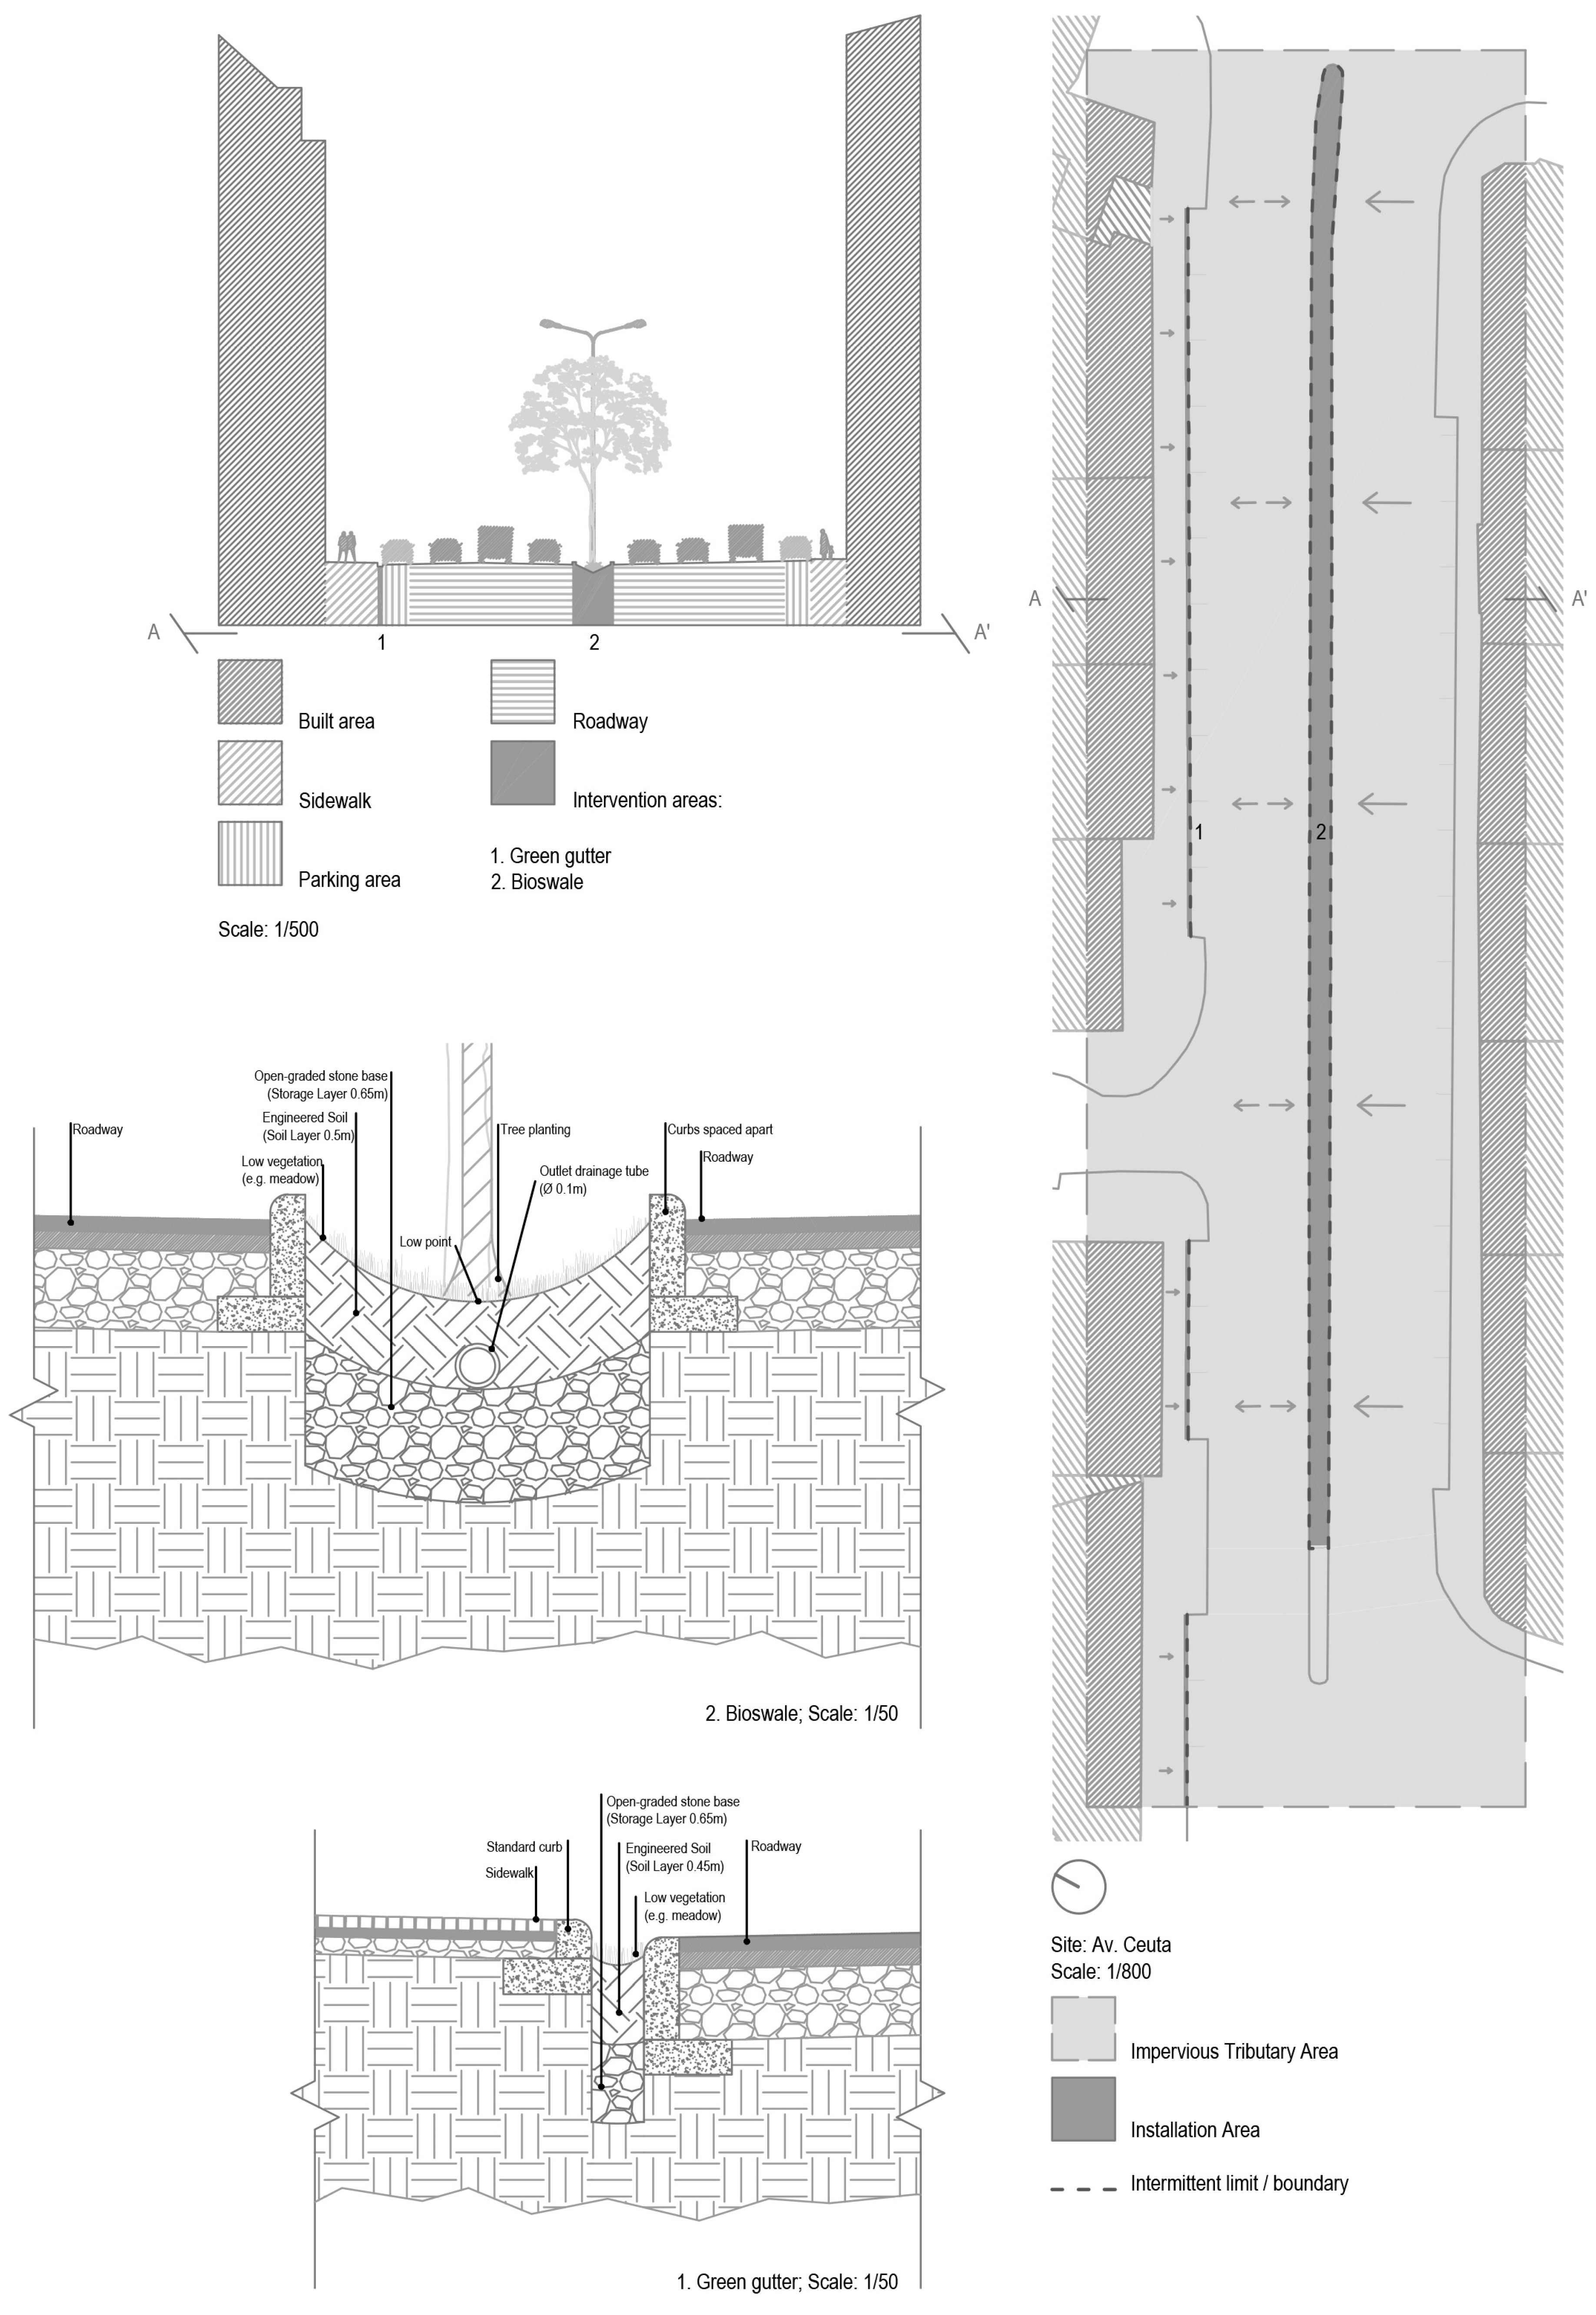
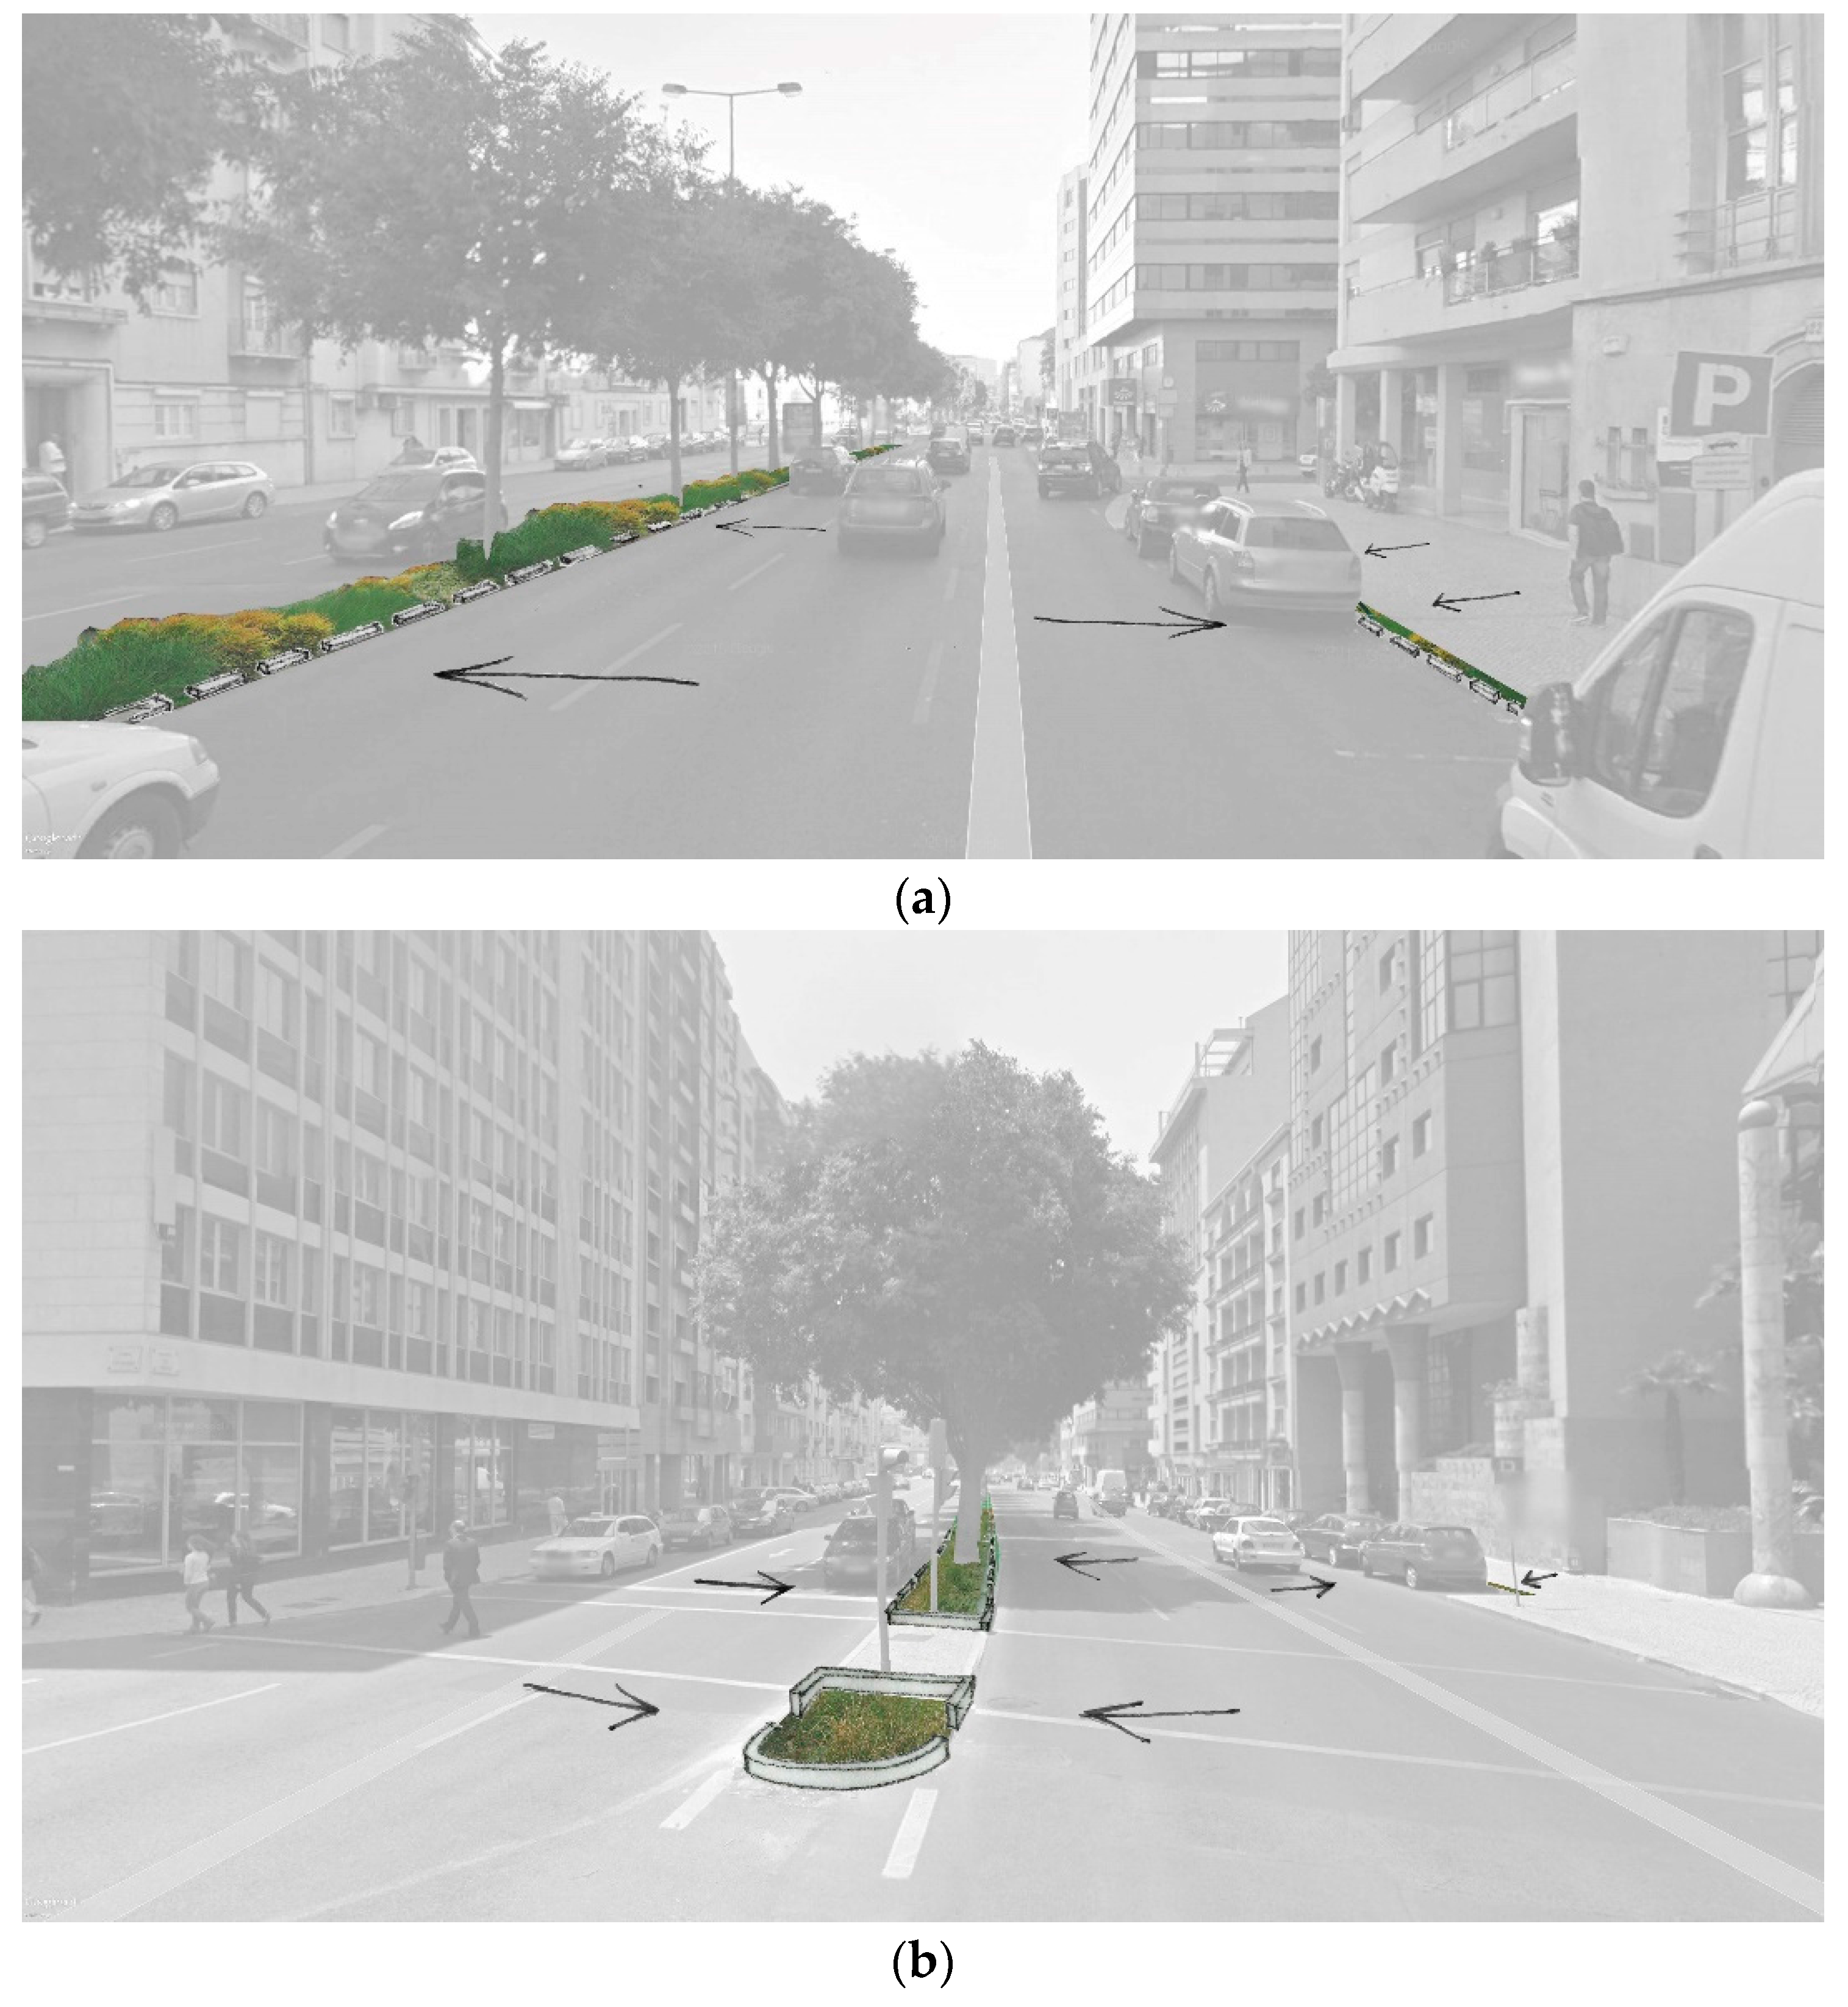
The third area corresponds to part of the six-way street of Av. de Berna and comprises an impermeable area of 5123.34 m
2. In line with the initially presented premise, the goal therefore corresponds to the retention of at least 128.08 m
3 of stormwater. In order to fulfill this objective, two types of adaptation measures are proposed: (1) bioswales and (2) green gutters (
Appendix A.3—Preliminary design (3)). Bioswales are specifically designed to enable stormwater management of 119.78 m
3, comprising a soil layer of 0.5 m of depth and a storage layer of 0.65 m. Green gutters are expected to manage 11.52 m
3 of stormwater, comprising a soil layer and storage layer of 0.45 m of depth each. The total estimated stormwater volume managed corresponds to 131.30 m
3, therefore achieving the proposed goal. In this intervention, measures are implemented in 5% of the total impermeable area.
When transposing the previously tested premise—i.e., to manage the first 25 mm of stormwater on a given impermeable area—into the entire study area of AUB, it can be seen that how a spatially and timely extensive approach of small scaled and conservative public space retrofits may have a considerable impact in urban flood adaptation undertakings. More specifically, if interventions are focused in solely 5% of all its impermeable public spaces, the management of around 8000.00 m
3 of stormwater can be estimated, i.e., a total volume that does not enter the sewerage system and that therefore does not contribute to its overload. In the same line of reasoning, and as seen in
Table 3, if interventions are applied to 15% of the existing impermeable public spaces, the volume of stormwater managed would be circa 24,500.00 m
3. Furthermore, if interventions are applied to 25% of the existing impermeable public spaces, the volume of stormwater managed would be around 41,500.00 m
3.
However, bearing in mind the known pressures and limitations of any urban system, and Lisbon in particular, the opportunity for a widespread implementation of these measures may only arise within a strategic approach that encompasses an extended timeframe. More specifically, the proposed types of measures must not only be extensively implemented along public space retrofits throughout the city, but are more likely to be implemented throughout and extensively within a timeframe. Accordingly, different scenarios were developed for the next 20, 50 and 100 years. The first 20 years were divided in four periods of 5 years and the next stages encompassed a period of 30 years (reaching the timeframe of 50 years from 2017) and a period of 50 years (reaching the timeframe of 100 years from 2017) (
Table 3).
In light of these timeframes, different percentages for public space adaptation retrofits were anticipated for each range. The proposed scenarios maintained the widespread conservative approach in this exercise. For example, for the next 20 years (2017–2037), it is envisioned as possible to retrofit 15% of the potential areas for public space adaptation, i.e., retrofits in 15% of impermeable public spaces within each analyzed COS class. This scenario is further divided in four periods of 5 years, each entailing a percentage of impermeable public space adaptation of 2%, 3%, 5% and 5%. For the subsequent 30 years (2017–2067), it is projected that adaptation measures can be applied to more than 10% of the potential area for intervention. In the following 50 years (2017–2117), it is projected that adaptation measures can be applied to more than 20% of the potential areas for intervention. Considering the entire time-lapse for the next 100 years, from 2017 to 2117, slowly, through small interventions within a wider strategy, 45% of the existing impermeable public spaces can be retrofitted.
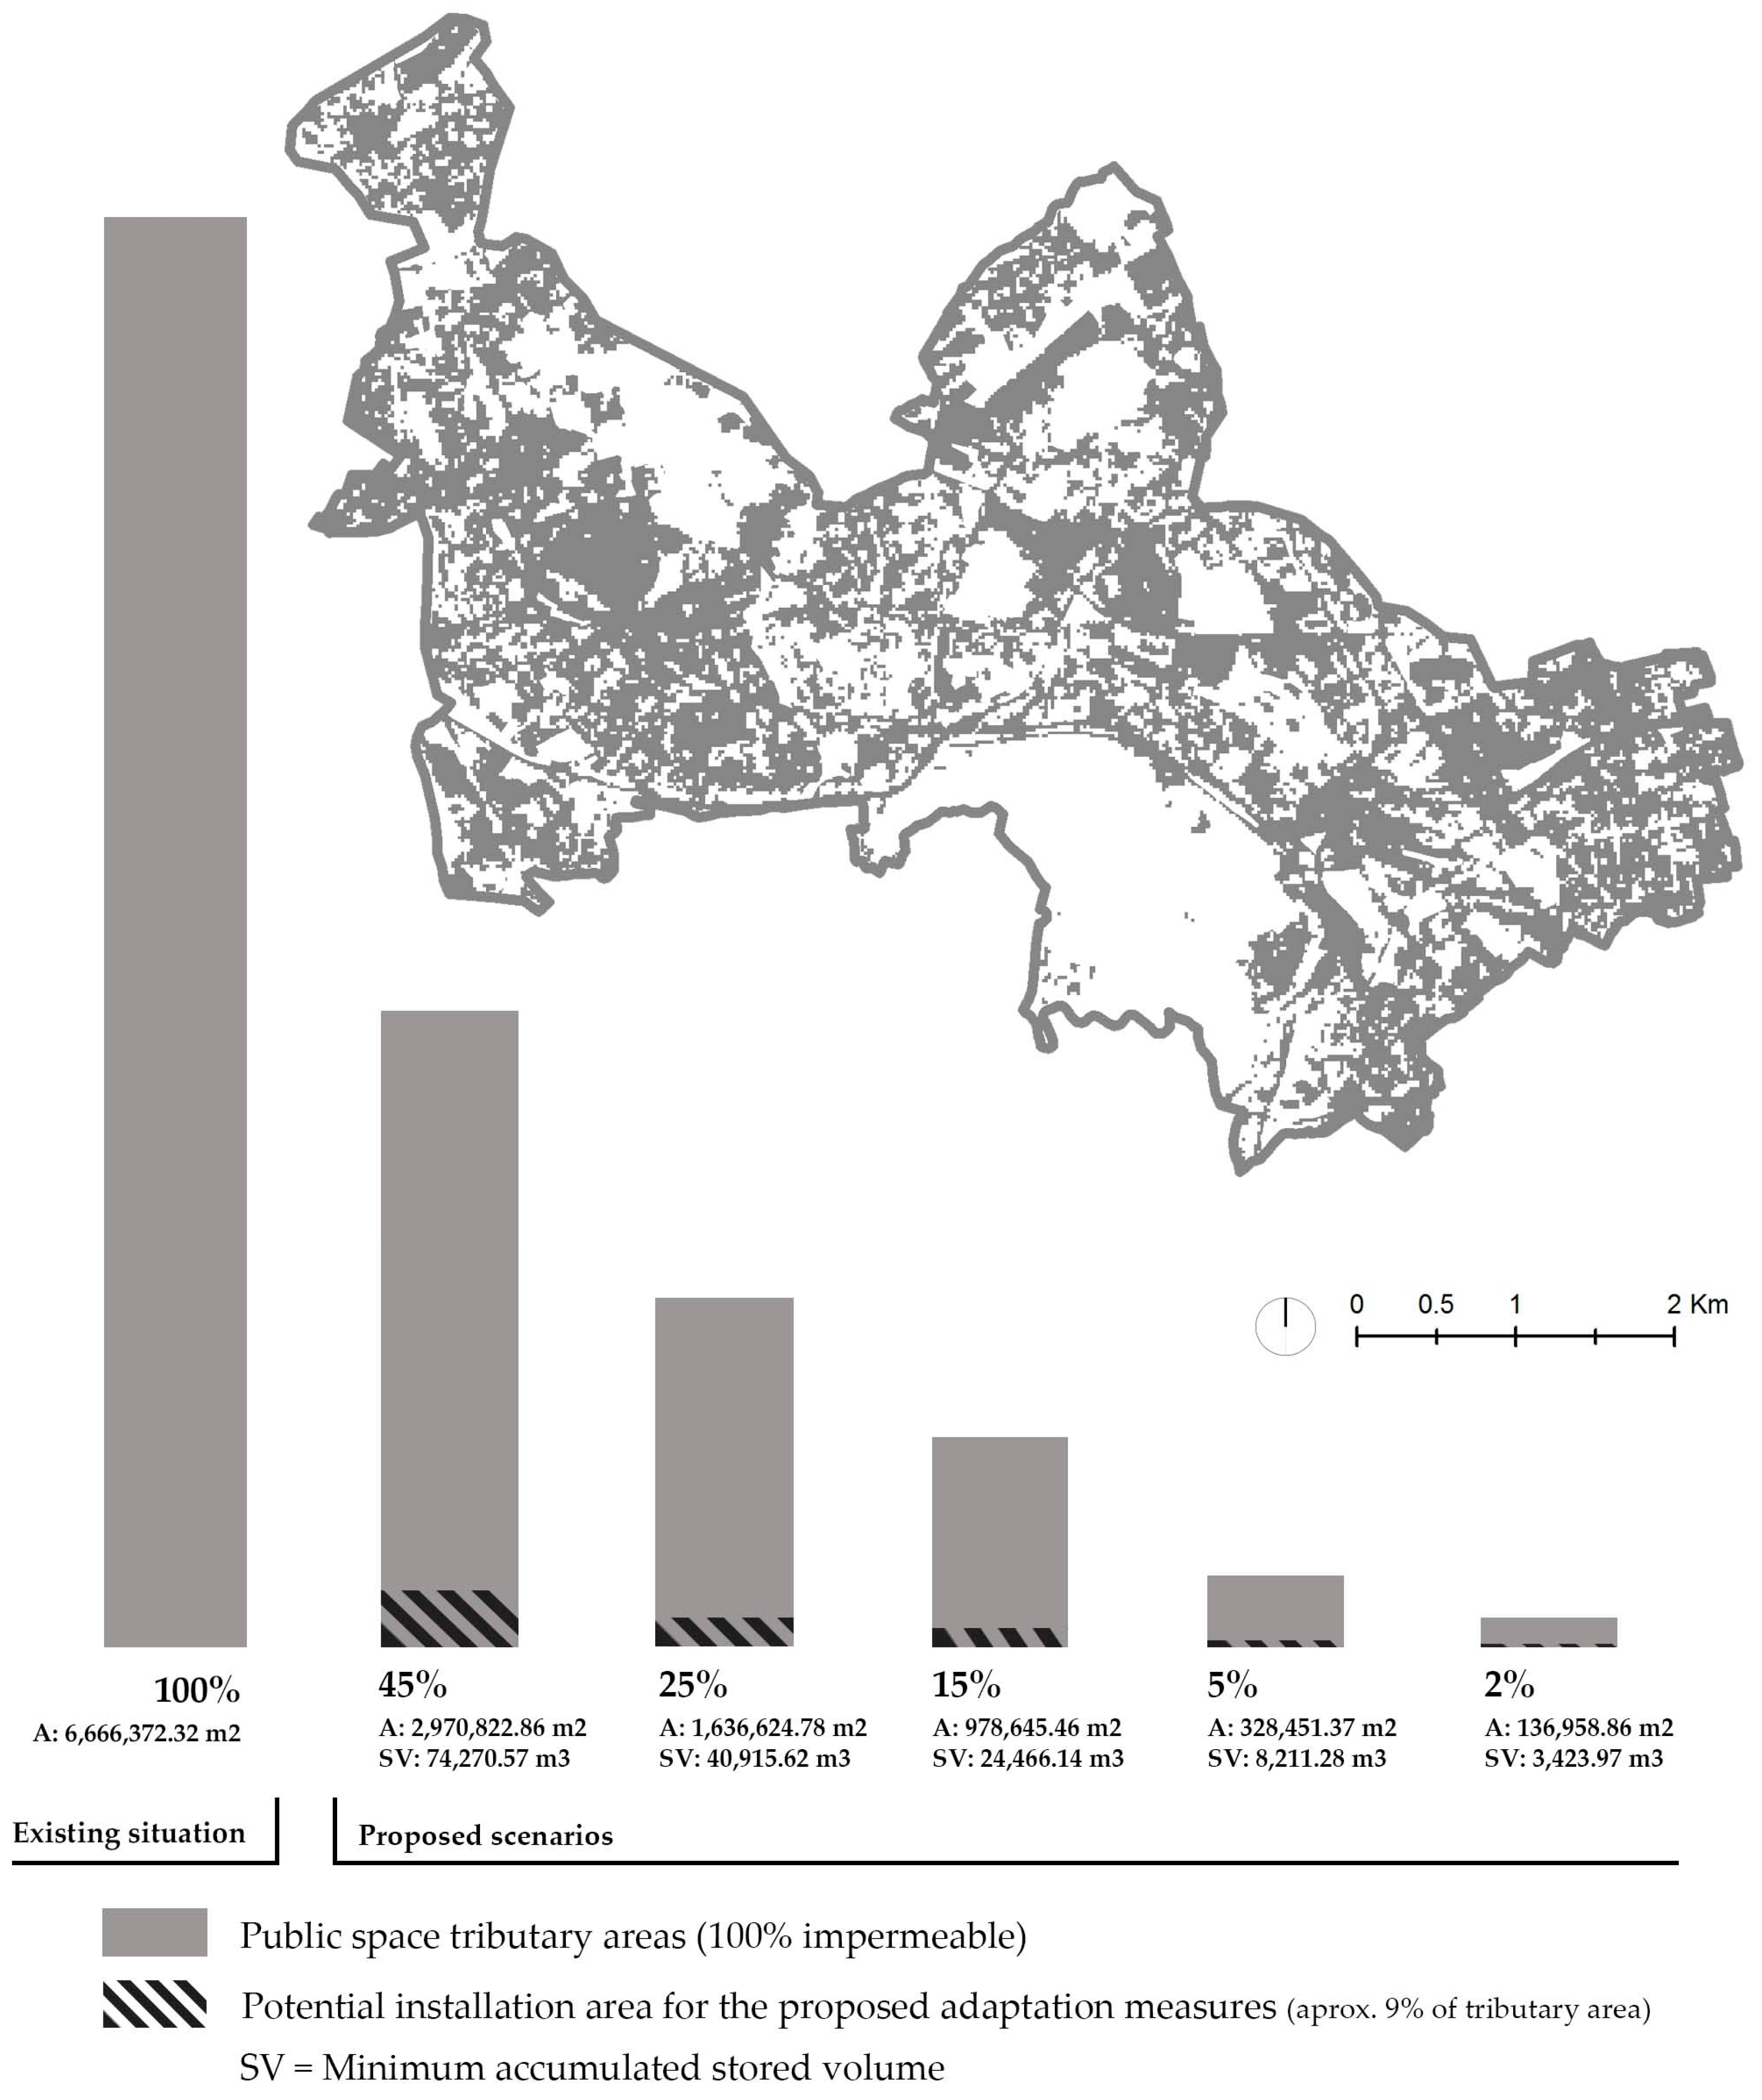
In addition, one must bear in mind that the percentage of adapted area does not correspond to the actual area of intervention, where adaptation measures are applied. In order to fulfill the premise to manage the first 25 mm of stormwater, the previous illustrative designs implied public space retrofits of around 9% of the total area under analysis. Recalling this fact, when adapting 45% of AUB impermeable tributary public spaces, only 9% of this area is expected to entail the concrete application of adaptation measures. In other words, as illustrated in
Figure 6, implemented adaptation measures may cover 45% of an impermeable area by merely implementing adaptation measures in 9% of the given area.
Considering the infrastructural source control significance of each of the abovementioned scenarios: if adapting 5% of the impermeable public spaces of AUB, then a minimum of 8161.92 m3 of stormwater volume can be managed; if 45% of potential impermeable public spaces are adapted, around 75,000.00 m3 of stormwater volume can be managed. Likewise, even though adapting only 5% of impermeable public spaces would appear to provide insignificant outcomes, adapting 5% extensively along impermeable public space tributary areas and over an extended timeframe can nevertheless engenders important achievements in Lisbon’s flood adaptation actions.


