The fifth step is to compute the environmental impacts. The proposed model computes time, life cycle cost, environmental impacts, and primary energy. Time is computed based on the quantity of work to be performed, the productivity of the crew in performing the task, the efficiency of the crew, and the number of the crews available for performing the task.
2.5.1. Computations of Environmental Impact Indicators
The overall environmental impacts of road construction project can be classified into three major categories: direct, indirect, and operational emissions. The overall environmental impacts equal the summation of the direct, indirect, and operational emissions. The direct emission can be defined as “the emissions that are directly related to on-site construction processes… computed based on the amount of fuel consumed from equipment during the construction process” [
1]. The direct emissions are equal to the construction emission in addition to transportation emissions, recycling, deconstruction emissions, and repair/maintenance emissions. The total direct emissions are computed based in Equation (1).
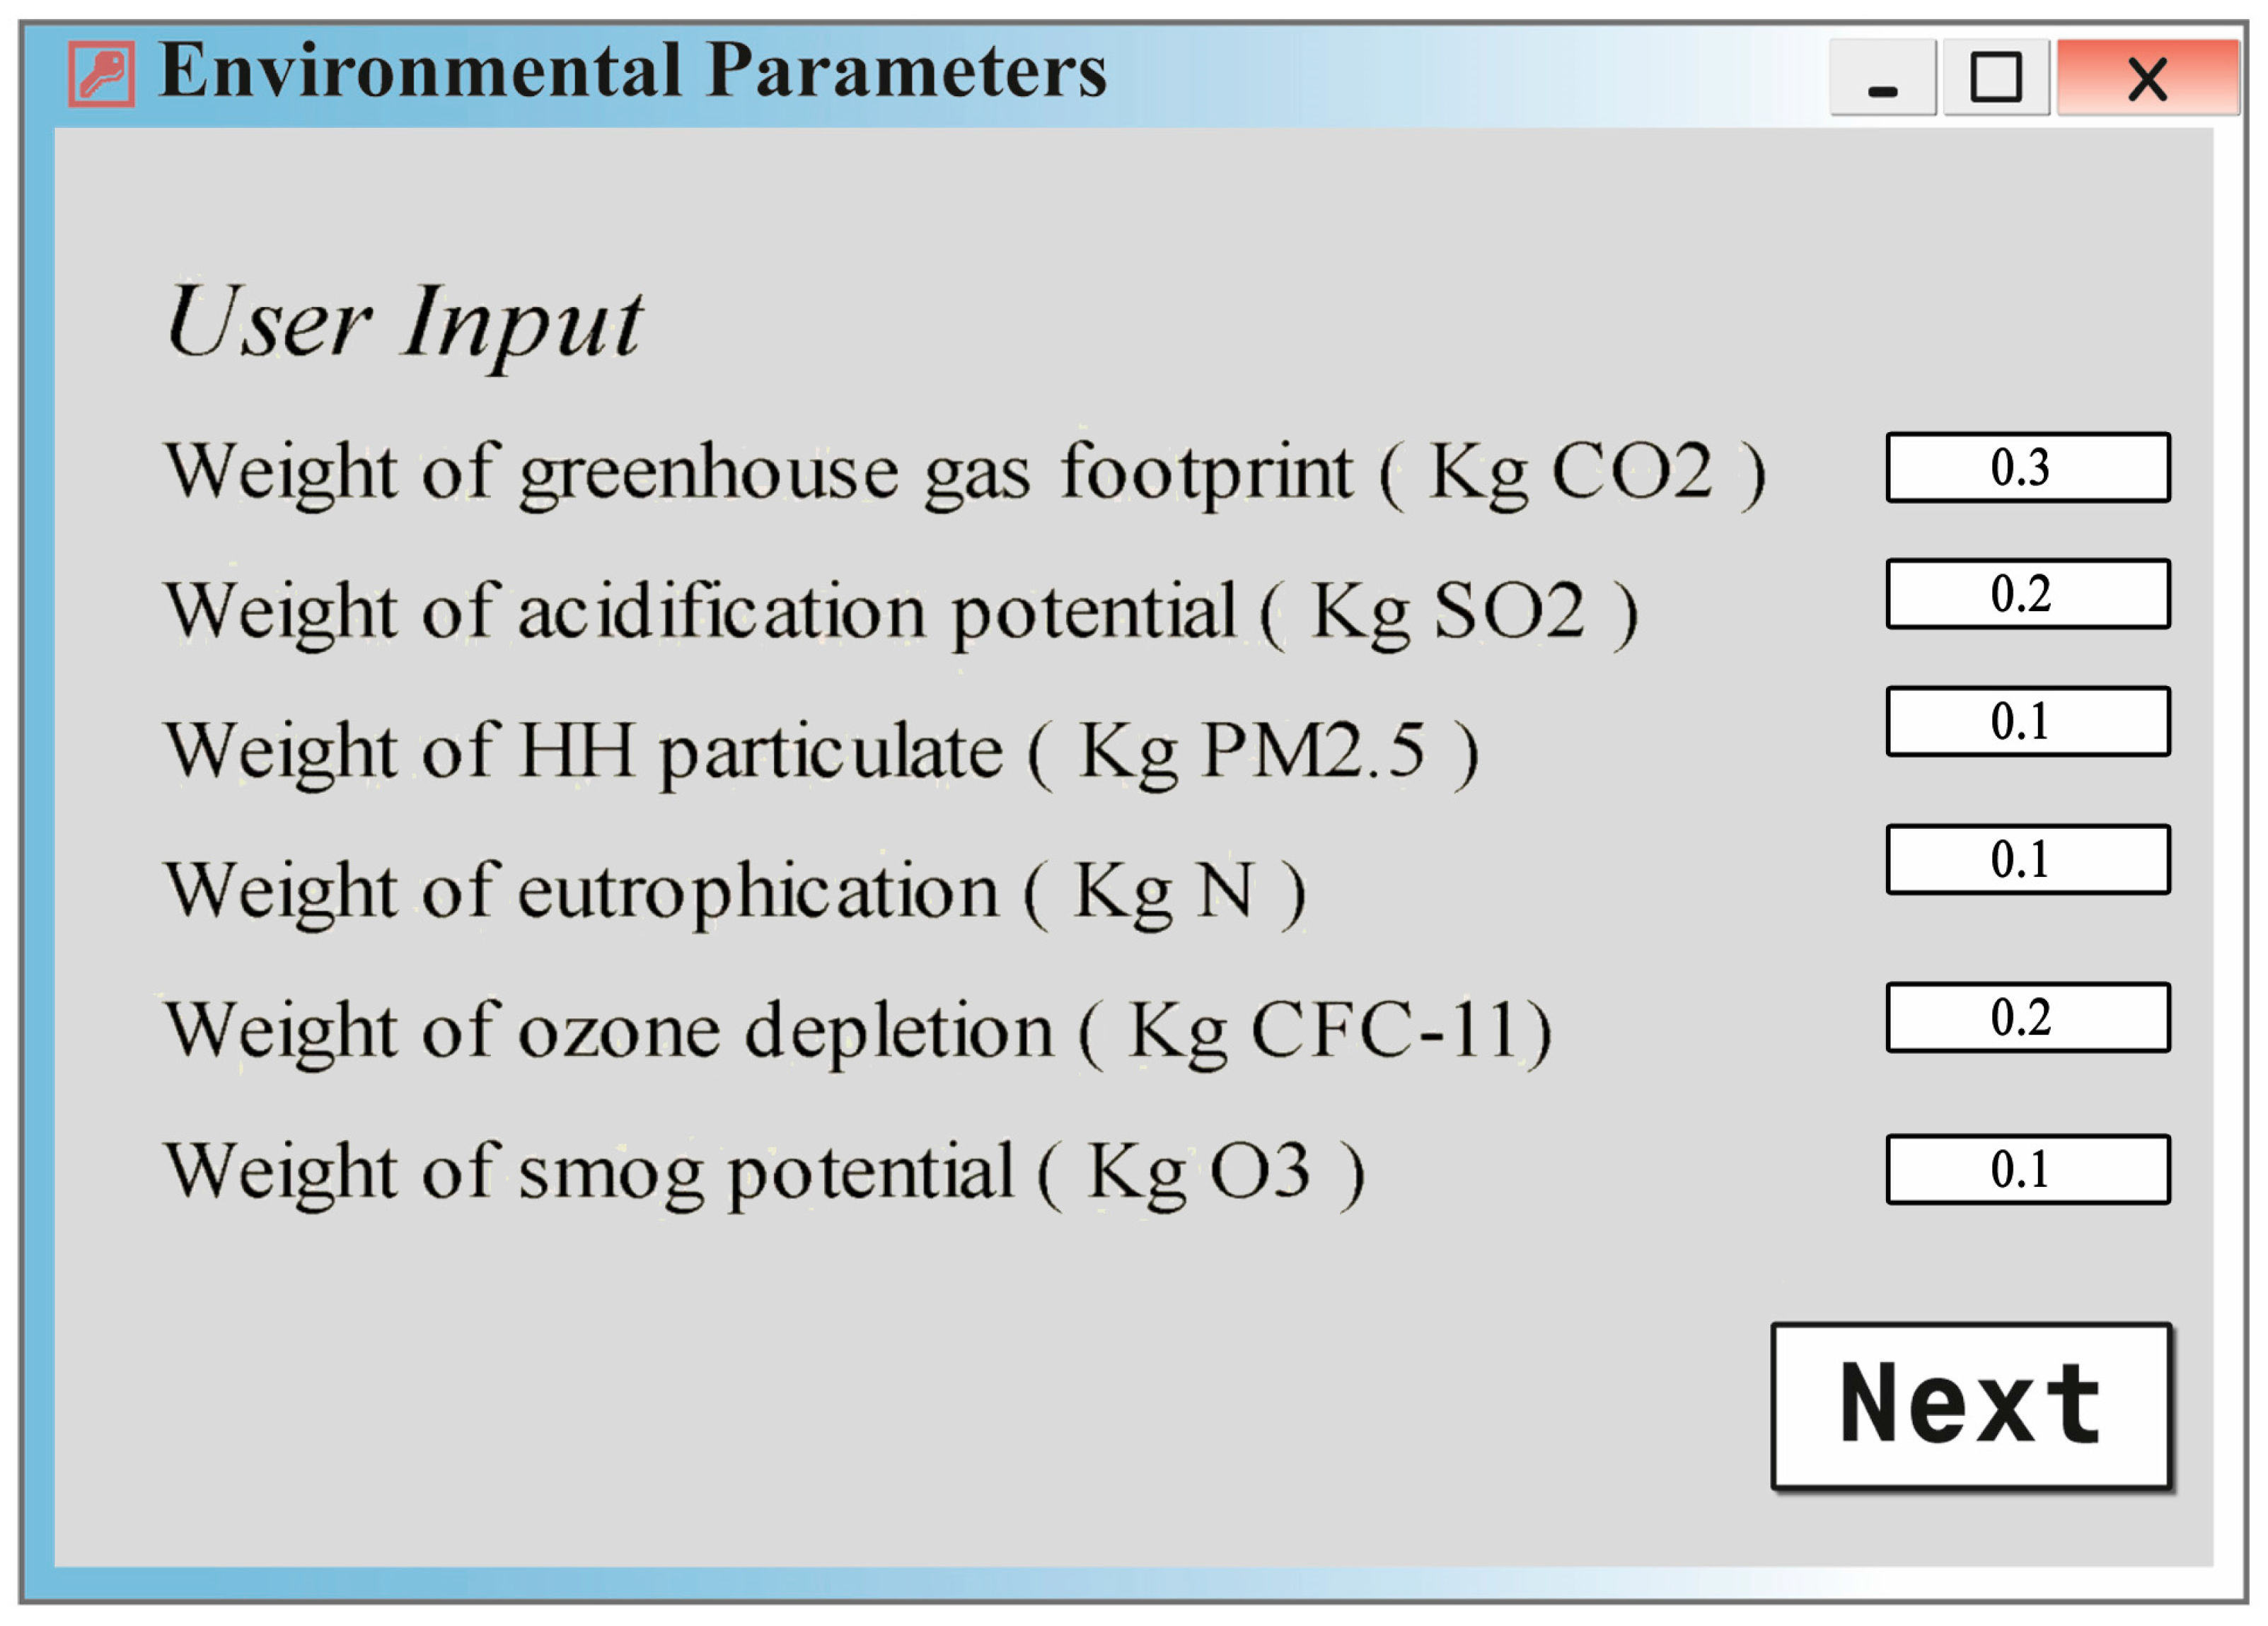
where; Ed refers to the total direct emissions, T1, T2, T3, T4, T5, and T6 refer to the modification index of impact on the greenhouse gas (GHG) footprint, impact on acidification potential (AP), impact on human health (HH) particulates, impact on eutrophication potential (EP), impact on ozone depletion, and impact on smog, respectively. Each modification index is equal to the severity index multiplied by corresponding weighted percentage. Eghg, Eap, Ehh, Eep, Eod, and Es represent potentials produced from the construction, transportation-on site, maintenance, deconstruction, and demolition phases of the construction project, respectively. Eghgsum, Eapsum, Ehhsum, Eepsum, Eodsum, and Es sum represent the potentials sums for the construction project, including the direct and indirect emissions for impact on the greenhouse gas (GHG) footprint, impact on acidification potential (AP), impact on human health (HH) particulates, impact on eutrophication potential (EP), impact on ozone depletion, and impact on smog, respectively. Six parameters weights (W1, W2, W3, W4, W5, and W6) are assigned to each type of the environmental impact indicators. These weighted percentages are the percentage of impact on greenhouse gas (GHG) footprint, impact on acidification potential (AP), impact on human health (HH) particulates, impact on eutrophication potential (EP), impact on ozone depletion, and impact on smog, respectively. The sum of the weighted percentages should equal to 1.
Table 1 lists the severity index of each environmental parameter on human health.
The above-mentioned figures in
Table 1 (severity index) will be used to compute the modification index (T) for different environmental impacts presented in Equation (1) by multiplying the severity index with the weighted percentage (W). The greenhouse gas (GHG) footprint produced from the construction site (Eghg
c), transportation (Eghg
t), deconstruction (Eghg
d), and maintenance (Eghg
m) is computed using Equations (2)–(5).
where j is the number of equipment used in construction for a specific construction element. I is the number of equipment used in transportation process in site. Cons AVG refers to the average consumption of certain equipment (liters/hour). Working hours are number of working hours of the equipment (typically 8 h/day). Act Work is the percentage of the equipment that will actually work, which is approximated to be 70% of the working hours of the equipment [
18,
19]. Ɣ diesel is the density of diesel, which is 0.832 Kg/I. CEF is the carbon emission factor for diesel, which is 4 Kg CO
2-Eq/Kg [
19]. T-
tra refers to transportation time for certain equipment for diesel. T refers to the time for executing the task.
Table 2 illustrates the average consumption (Cons AVG) of some equipment [
20]. A conversion factor is used to convert from gallons to liters, where 1 gallon = 3.785 L.
T is the time need to execute the construction activity, which is computed using Equation (6) [
1].
where efficiency is assumed to be 80% [
21,
22].
Indirect emissions refer to “emissions that are produced off-site construction processes” [
1]. They include manufacturing, transportation off site emissions, and operation. The indirect emissions are computed using Equation (7):
where Eghg
i, Eap
i, Ehh
i, Eep
i, Eod
i, and Es
i represent potentials produced from material production, and transportation off-site phases for impact on the greenhouse gas (GHG) footprint (equivalent carbon dioxide), impact on acidification potential (AP), impact on human health (HH) particulates, impact on eutrophication potential (EP), impact on ozone depletion, and impact on smog, respectively.
Operational emissions are the emissions produced from daily operation of the facility after being constructed till the end of its remaining life cycle [
23]. They are produced from four main sources: electricity, natural gas, diesel, and gasoline. The operational emissions resulted from the consumption of electricity used for lighting the road, and from the consumption of different types of fuels used by passenger cars, and construction equipment during the operational stage. The total operational emissions are the sum of the operational emissions resulting from the impact on greenhouse gases (GHGs), impact on sulfur dioxide, impact on particulate matter, and impact on smog. The total quantity of carbon dioxide can be computed by multiplying quantity of each greenhouse gas by global warming (g) of the potential. Operational emissions can be calculated using Equation (8). Operational emissions of sulfur dioxide can be calculated using Equation (9). Operational emissions of particulate matter can be calculated using Equation (10). Operational emissions of smog can be calculated using Equation (11) [
1].
Table 3 lists the global warming potential over a 100-year period.
Table 4 lists the emissions factors of different emissions from electricity consumption.
Table 5 lists the emissions factors of different emissions from natural gas consumption.
where Cons elec, and Cons nags are the total amount of electricity consumption and natural gas consumption, respectively, over the life span of the construction project, which is equal to the average consumption of electricity, and natural gas consumption multiplied by the area of the construction project and lifespan of the facility, which is assumed to be 50 years. EF ELEC (j)
ghg, EF ELEC
pm, EF ELEC
ap, and EF ELEC
s represent potential emissions factors produced from electricity consumption of impact on the greenhouse gas (GHG) footprint, impact on human health (HH) particulate matter, impact on acidification potential (AP), and impact on smog, respectively. EF NAGS (j)
ghg, EF NAGS
pm, EF NAGS
ap, and EF NAGS s represent potential emissions factors produced from natural gas consumption with respect to the impact on the greenhouse gas (GHG) footprint, impact on human health (HH) particulate matter, impact on acidification potential (AP), and impact on smog, respectively. The total operational emissions are the sum of emissions produced from potential emissions of impact on the greenhouse gas (GHC) footprint, impact on human health (HH) particulate matter, impact on acidification potential (AP), and impact on smog.
In order to cope with the problem of electricity grid mix varies from one country to another, the International Energy Association IEA [
27] stated that the energy balance of a country can be used to suggest a rough estimate of emission factors generated from energy consumption in conjunction with the share of electricity industry generating air pollutants. For example, the Misr State Environmental Association MSEA [
28] reported that 60% of CO
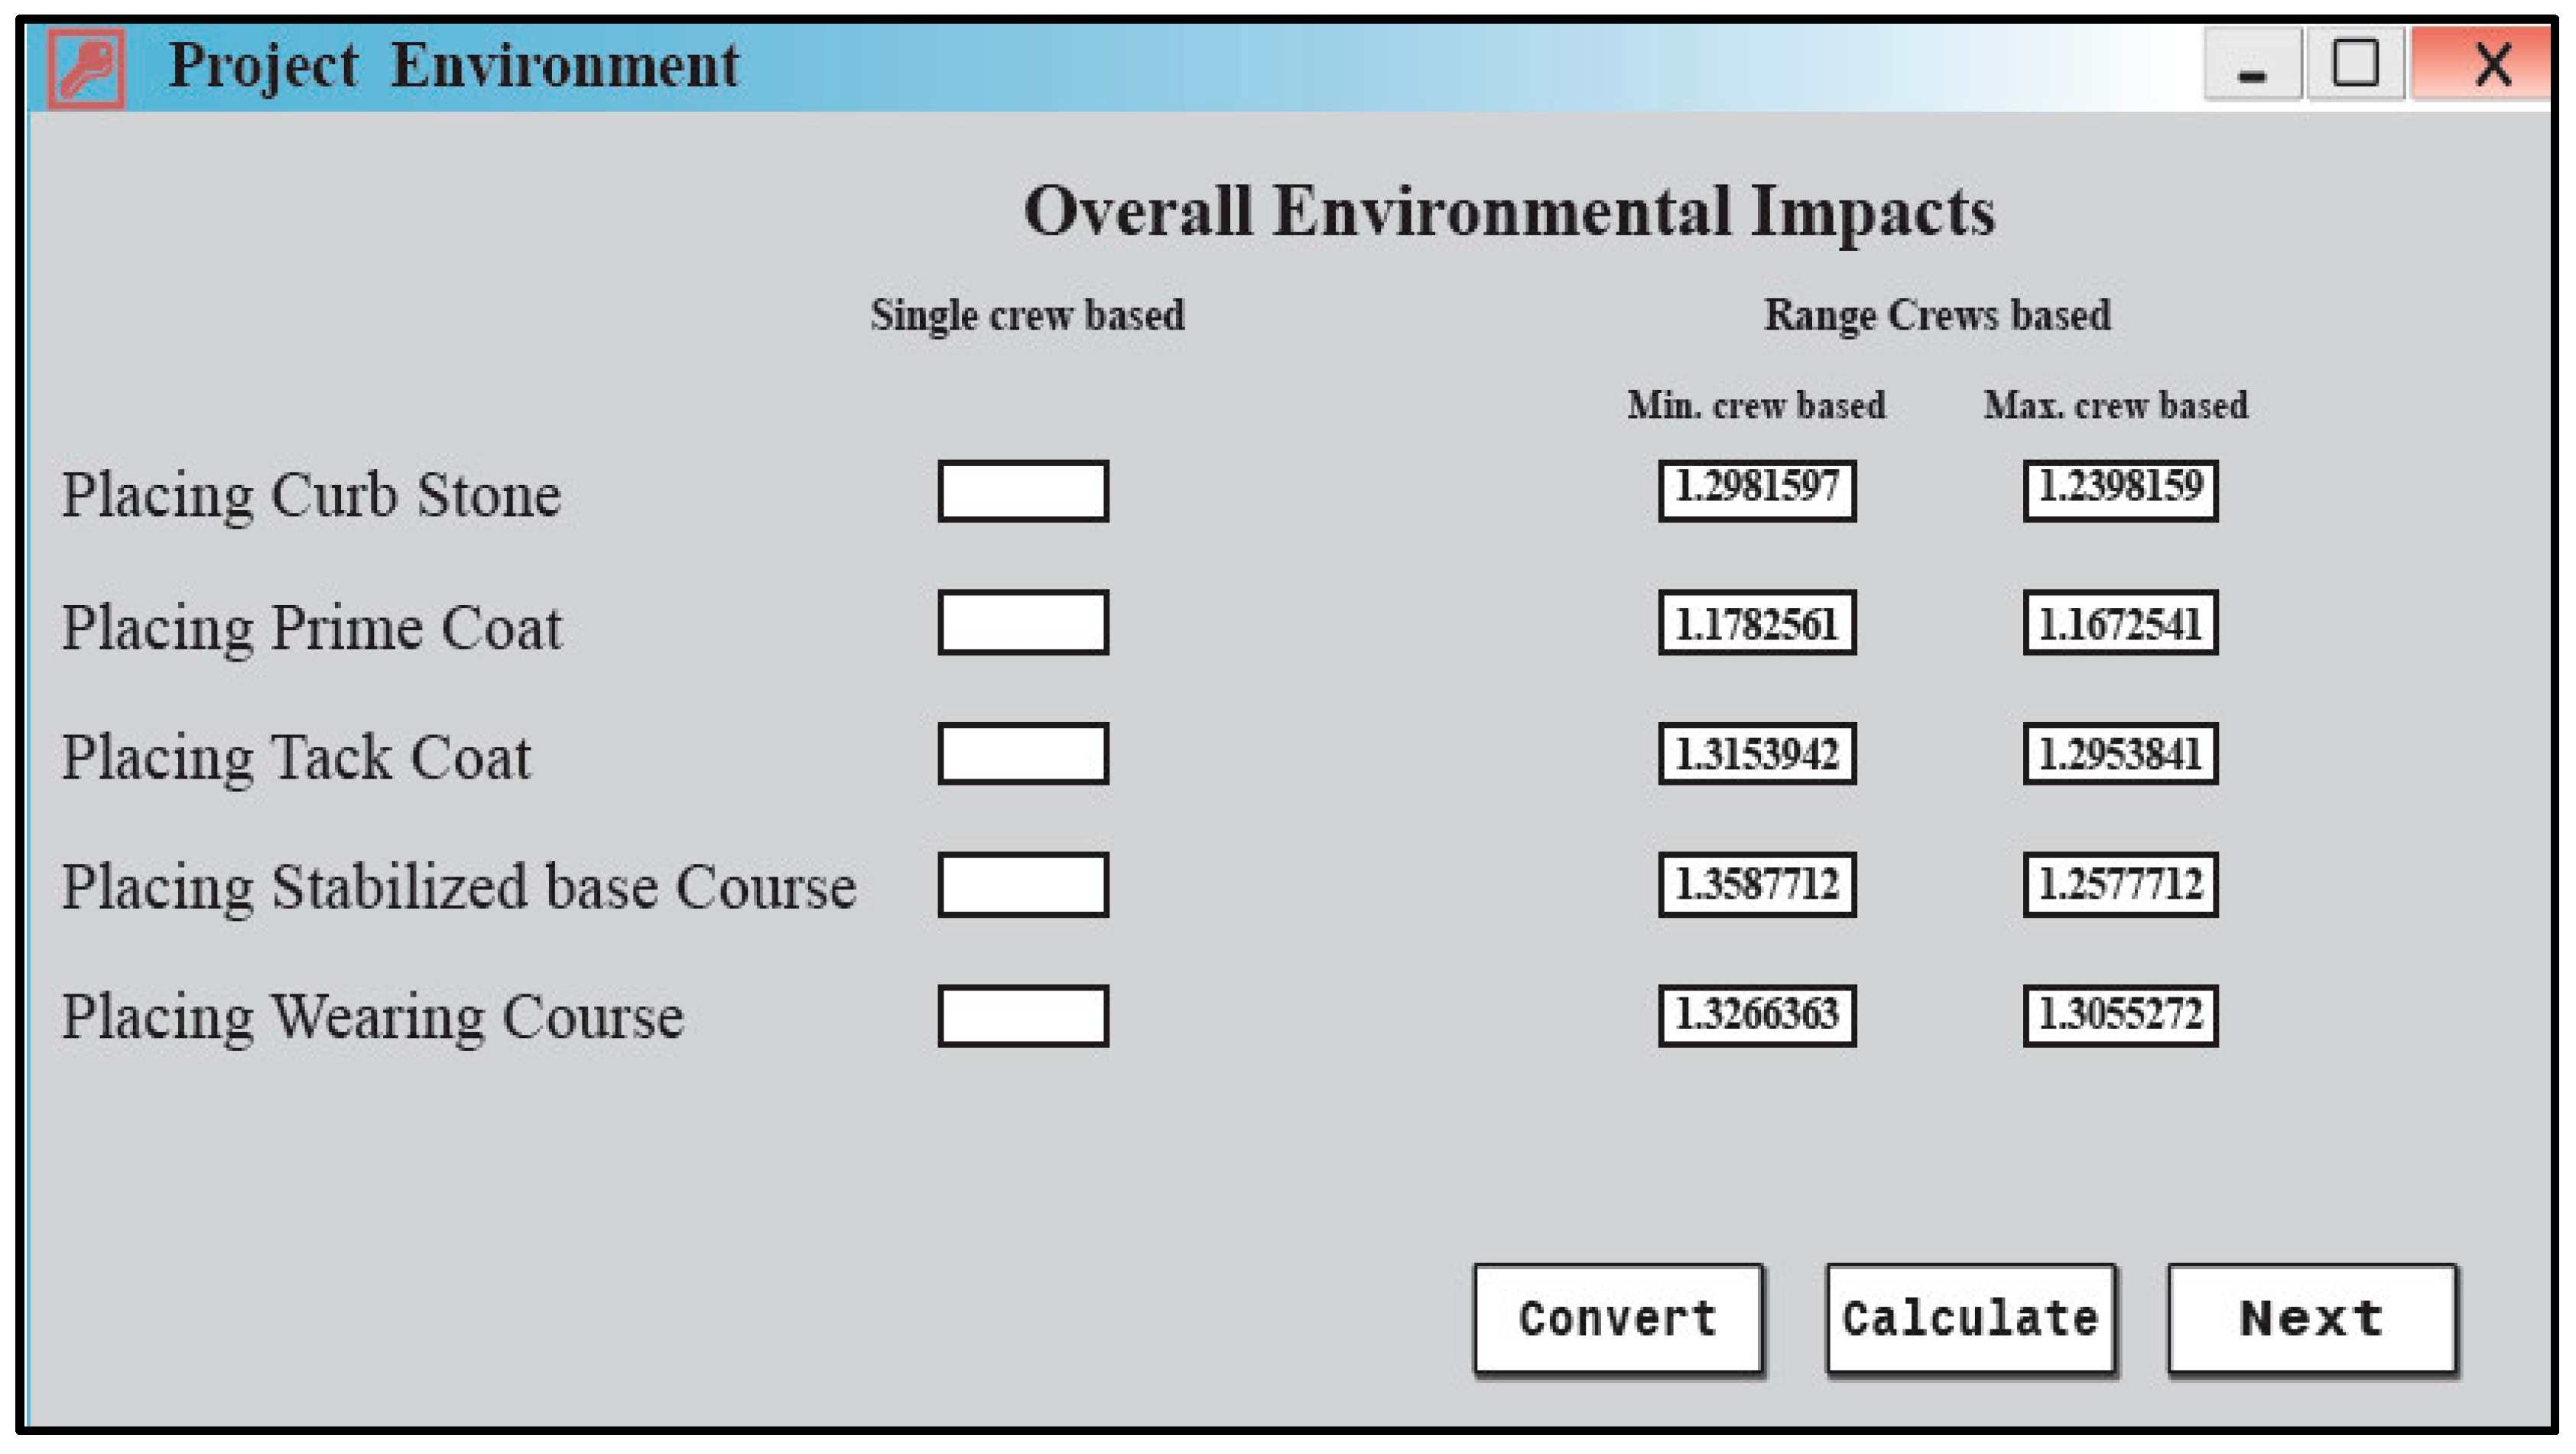
2 emissions in Egypt (as an example of developing country) is generated by the electricity industry. Therefore, the energy balance can be used as a method to determine emission factors in the case that there is not sufficient data. The overall environmental impacts for each single phase in construction can be calculated using Equation (12).
where Ed, and Ed
i represent the direct and indirect emissions, respectively.
The global environmental impacts can be computed using Equation (13).
where Ed, Ed
i, and Edo
p represent the direct, indirect, and operational emissions, respectively.
2.5.3. Computations of Primary Energy
The primary energy is the sum of the primary energy consumed resulted from electricity, natural gas consumptions, and the consumption of oil during the different stages of the project, which is measured in megajoule (MJ) units. The overall primary energy is computed using Equation (15) [
29]:
where TPE refers to the total primary energy. PE manu, PE tra-off, PE cons, PE tra-on, PE oper, PE dec, and PE rec refer to primary energy consumed in manufacturing stage, transportation off-site stage, construction stage, transportation on-site stage, operation and maintenance stage, deconstruction stage, and recycling and reuse stage, respectively. There are two main sources for primary energy in the operational stage: electricity consumption, natural gas consumption, and the consumption of oil during different stages of the project. The total electricity consumption during operational stage can be computed using Equation (16) [
2]. The total natural gas consumption during the operational stage can be determined using Equation (17) [
2].
where TEC, TNGC refer to the total electricity and natural gas consumption produced during the operational stage, respectively. SA refers to the total surface area of the construction project. The annual electricity consumption is assumed to be 200 KW/m
2 [
29]. The annual natural gas consumption is assumed to be 28 m
3/m
2 (this amount was computed based on data on the amount of natural gas production in Egypt in 2013, the percentage of natural gas consumed in electricity generation in Egypt, and the total surface area of paved and unpaved roads) [
30]. TEC, and TNGC are measured in megajoules. A conversion factor is used to convert from m
3/m
2 of natural gas to KWh/m
2 where 1 m
3/m
2 of natural gas equals 10.55 KWh/m
2 [
31,
32].
2.5.4. Numerical Example
The following data was obtained during the site visit for project 1 (Asyut/Sohag/Red Sea) presented in
Table 6 in the case study section. The length of the project is 180 Km with a total cost of 1.156 billion L.E., and the project is estimated to finish on 31 March 2016. In this case, W1 = 0.4, W2 = 0.1, W3 = 0.1, W4 = 0.2, W5 = 0.1, and W6 = 0.1. The severity index from
Table 1 of T1 = 8 (high), the severity index of T2 = 6 (medium), the severity index of T3 = 4 (low), the severity index of T4 = 4 (low), the severity index of T5 = 2 (very low), and the severity index of T6 = 10 (very high). Therefore:
The amount of Eghg produced from project 1 (construction, and transportation on-site phase) in performing the earthworks activity is 598.8 Kg CO2Eq, Eghg sum is 80,140 Kg CO2-Eq, Eap is 297 Kg SO2, Eap sum is 11,360 Kg SO2, Ehh is 128 Kg PM2.5, Ehh sum is 9100 Kg PM2.5, Eep is 100 Kg N, Eep sum is 9520 Kg N , Eod is 100 Kg CFC-11, Eod sum is 550 Kg CFC-11, Es is 400 Kg O3 , and the Es sum is 37,885 Kg O3. Then, by applying Equation (1):
The amount of earthworks to be performed is 1000 m
3/day, the productivity of the single excavator is 70 m
3/day, and the number of items of equipment used is 6, applying Equation (6):
If the quantity of waste that will be dumped is 2000 m3/day, the productivity of single equipment is 70 m3/day, efficiency = 0.8, and number of items of equipment = 5, then,
Assume that the average consumption of fuel (gallon/ hour) from
Table 2 is 3.5 gallons/hour and this amount is converted to 13.25 L. The number of working hours is 8 h/ day, and the actual work hours represent 70% of this. Ɣ diesel is 0.832 kg/I, and the carbon emission factor (CEF) = 4 kg CO
2-Eq/Kg, Tis 6 days. By applying Equations (2) and (3):
In order to compute the total in direct emissions, W1 = 0.4, W2 = 0.1, W3 = 0.1, W4 = 0.2, W5 = 0.1, and W6 = 0.1; the severity index from table of T1 = 8 (High), the severity index of T2 = 6 (medium), the severity index of T3 = 4 (low), the severity index of T4 = 4 (low), the severity index of T5 = 2 (very low), and the severity index of T6 = 10 (very high). Then:
The amount of Eghg produced from project 1 (manufacturing, and transportation off-site phase) is 17,000 Kg CO2-Eq, Eghg sum is 80,140 Kg CO2-Eq, Eap is 7850 Kg SO2, Eap sum is 11,360 Kg SO2, Ehh is 7550 Kg PM2.5, Ehh sum is 9100 Kg PM2.5, Eep is 7950 kg N, Eep sum is 9520 Kg N, Eod is 8820 Kg CFC-11, Eod sum is 10,530 Kg CFC-11, and Es is 19,250 Kg O3, and Es sum is 37,885 Kg O3, then by applying Equation (7):
Total of direct emissions:
Based on data gathered from interviews in the project, Global Warming Potential GWP is 1 from
Table 3, Cons-elec for carbon dioxide is 700 g/kwh from
Table 4 and
Table 5, Cons-elec for sulfur dioxide is 0.09 g/kwh, Cons-elec for particulate matter is 2 g/kwh, Cons-elec for smog is 1.44 g/kwh, Cons-Ngas for carbon dioxide is 55.5 g/kwh, Cons-Ngas for sulfur dioxide is 0.001 g/kwh, Cons-Ngas for particulate matter is 0.001 g/kwh, and Cons-Ngas for smog is 0.175 g/kwh. These amounts should be multiplied by the life span of the project, which is 50 years.
By applying Equations from (6) to (9):
By applying Equation (11):
The equivalent annual worth for labor cost, material cost, equipment cost, maintenance cost per year, maintenance cost per period of time, and number of single payments are 500,000 L.E/year, 2,000,000 L.E/ year, 10,000,000 L.E/year, 500,000 L.E/year, 40,000 L.E/year, and 1, respectively. Then, by applying Equation (14):
For project 1, the surface area of the project is 3240 km
2, the life span of the project is 50 years, and the annual electricity consumption is 295.4 kwh/m
2 (from interviews). Then, by applying Equations (16) and (17):
The total primary energy (PE) is computed based on Equation (15), where PE during manufacture, and transportation off-site phase is 77,890 megajoules, PE during the maintenance phase is 59,890 megajoules, PE during operational is 32,400 megajoules, PE during deconstruction, and demolition phase is 1628.2 megajoules, PE during the recycling and reuse phase is 84.24 megajoules, PE during the construction, and transportation on-site phase is 1890.8 megajoules (interviews, and AbdelKader [
1]), then by applying Equation (15):


