1. Introduction
Human activities in recent decades have made tremendous impacts on environmental changes [
1]. Among them, environmental quality deterioration and pollution incidents are the problems highlighted by most scientists concerned. In order to prevent the occurrence of pollution incidents, scientific and effective risk assessment results can be used to provide both scientific and reasonable technical supports for water environment management, thereby reducing the risk of pollution.
The plain river network area, different from the common water area, has several unique properties such as the complex water system, the low flow rate, and the insufficient pollutant degradation ability, which resulted in water pollution incidents occurring frequently [
2,
3], especially featured by cumulative pollutions. The cumulative pollutions in the plain river network area always refer to multiple pollutants and pollution sources, which would generate cumulative risks on water environment in temporal and spatial scales. So, the cumulative risk assessment method has become the focus of risk assessment. Due to the above area properties, the range of possible occurrence of cumulative pollution is great in the plain river network area. It is difficult to achieve a comprehensive and accurate risk assessment with the watershed or administrative district scale. Therefore, the reasonable scale unit is the basis of risk assessment. The control unit is the smallest unit of environmental management [
4], so the control unit could be selected as the basic unit of the cumulative risk assessment. How to reasonably divide the control unit in the plain river network area becomes the basic work.
Water environment management on the basis of the control unit is mainly the current development tendency in the water environment protection field at home and abroad [
5,
6,
7]. In recent years, the control unit plays a positive and essential role in basin management and gradually becomes a common unit in the domestic and overseas basin water environment management field. Through taking the control unit as the minimum carrier of water environment management, this paper organically combines the basin management with the administration management. In the field of water environment management, the main purpose of the control unit division is to disassemble the complicated water environment problems into each control unit [
8,
9,
10,
11], so as to effectively implement both the concrete basin water environment management measures and policies and improve the basin water environment quality [
12]. Li et al. [
13] regarded the control unit as the management core to put forward some improvement suggestions for the supervisory control of section layout and the effective monitoring technology for water quality supervision objectives in the cross-border section of first-order stream in the Ganjiang basin. Although the control unit has been widely used in water quality planning and management, it is seldom used in the risk assessment.
The cumulative risks refer to the water environment risks caused by the cumulative pollution in the basin [
14,
15,
16,
17]. It could be divided into spatial cumulative risks and temporal cumulative risks. The former means the cumulative risks caused by the over-discharge pollutant flow from the external basin, in which the spatial cumulative risk value could be analyzed through the measurement results of contaminant flux over standard. The latter means the risks caused by the constant accumulation of regional pollutants, which mainly attribute to some factors such as the regional industry categories, remaining environmental capacity, the assessment of regional water ecology conditions and the response levels of both the government and the public to the environment. At present, the research works concentrating on risk assessment are mainly focused on the research of the sudden risks. Taking the “Danube Emergency Response System” for example, it is the emergency response system for shipping accident pollution. Recently, the cumulative risk assessment has been paid more and more attention as the cumulative pollution happens frequently. Meanwhile, the existing assessment methods have poor applicability, especially the cumulative risk assessment method for the characteristics of the plain river network area. Peng et al. [
18] summarized cumulative environmental risk assessment methods at domestic and overseas locationsand point out the imperfections of assessment and the insufficiencies of the basic science and the research work. Wang Bingquan et al. [
19] pointed out that the basin cumulative environment risk assessments are excessively macroscopic and the exposure methods of health risk assessment proved to be unilateral. Alves et al. [
20] used cumulative risk assessment as the basis for developing data in support of environmental decision-making. Teuschler et al. [
21] developed the cumulative relative potency factors (CRPF) approach, combining exposure modeling and physiologically. In general, the existing research did not take into account the characteristics of the water environment in the plain river network area. Therefore, it is necessary to set up a complete risk assessment system of the plain river network area in order to fully manage the water environment. The probability of cumulative risks occurrence will be significantly slashed.
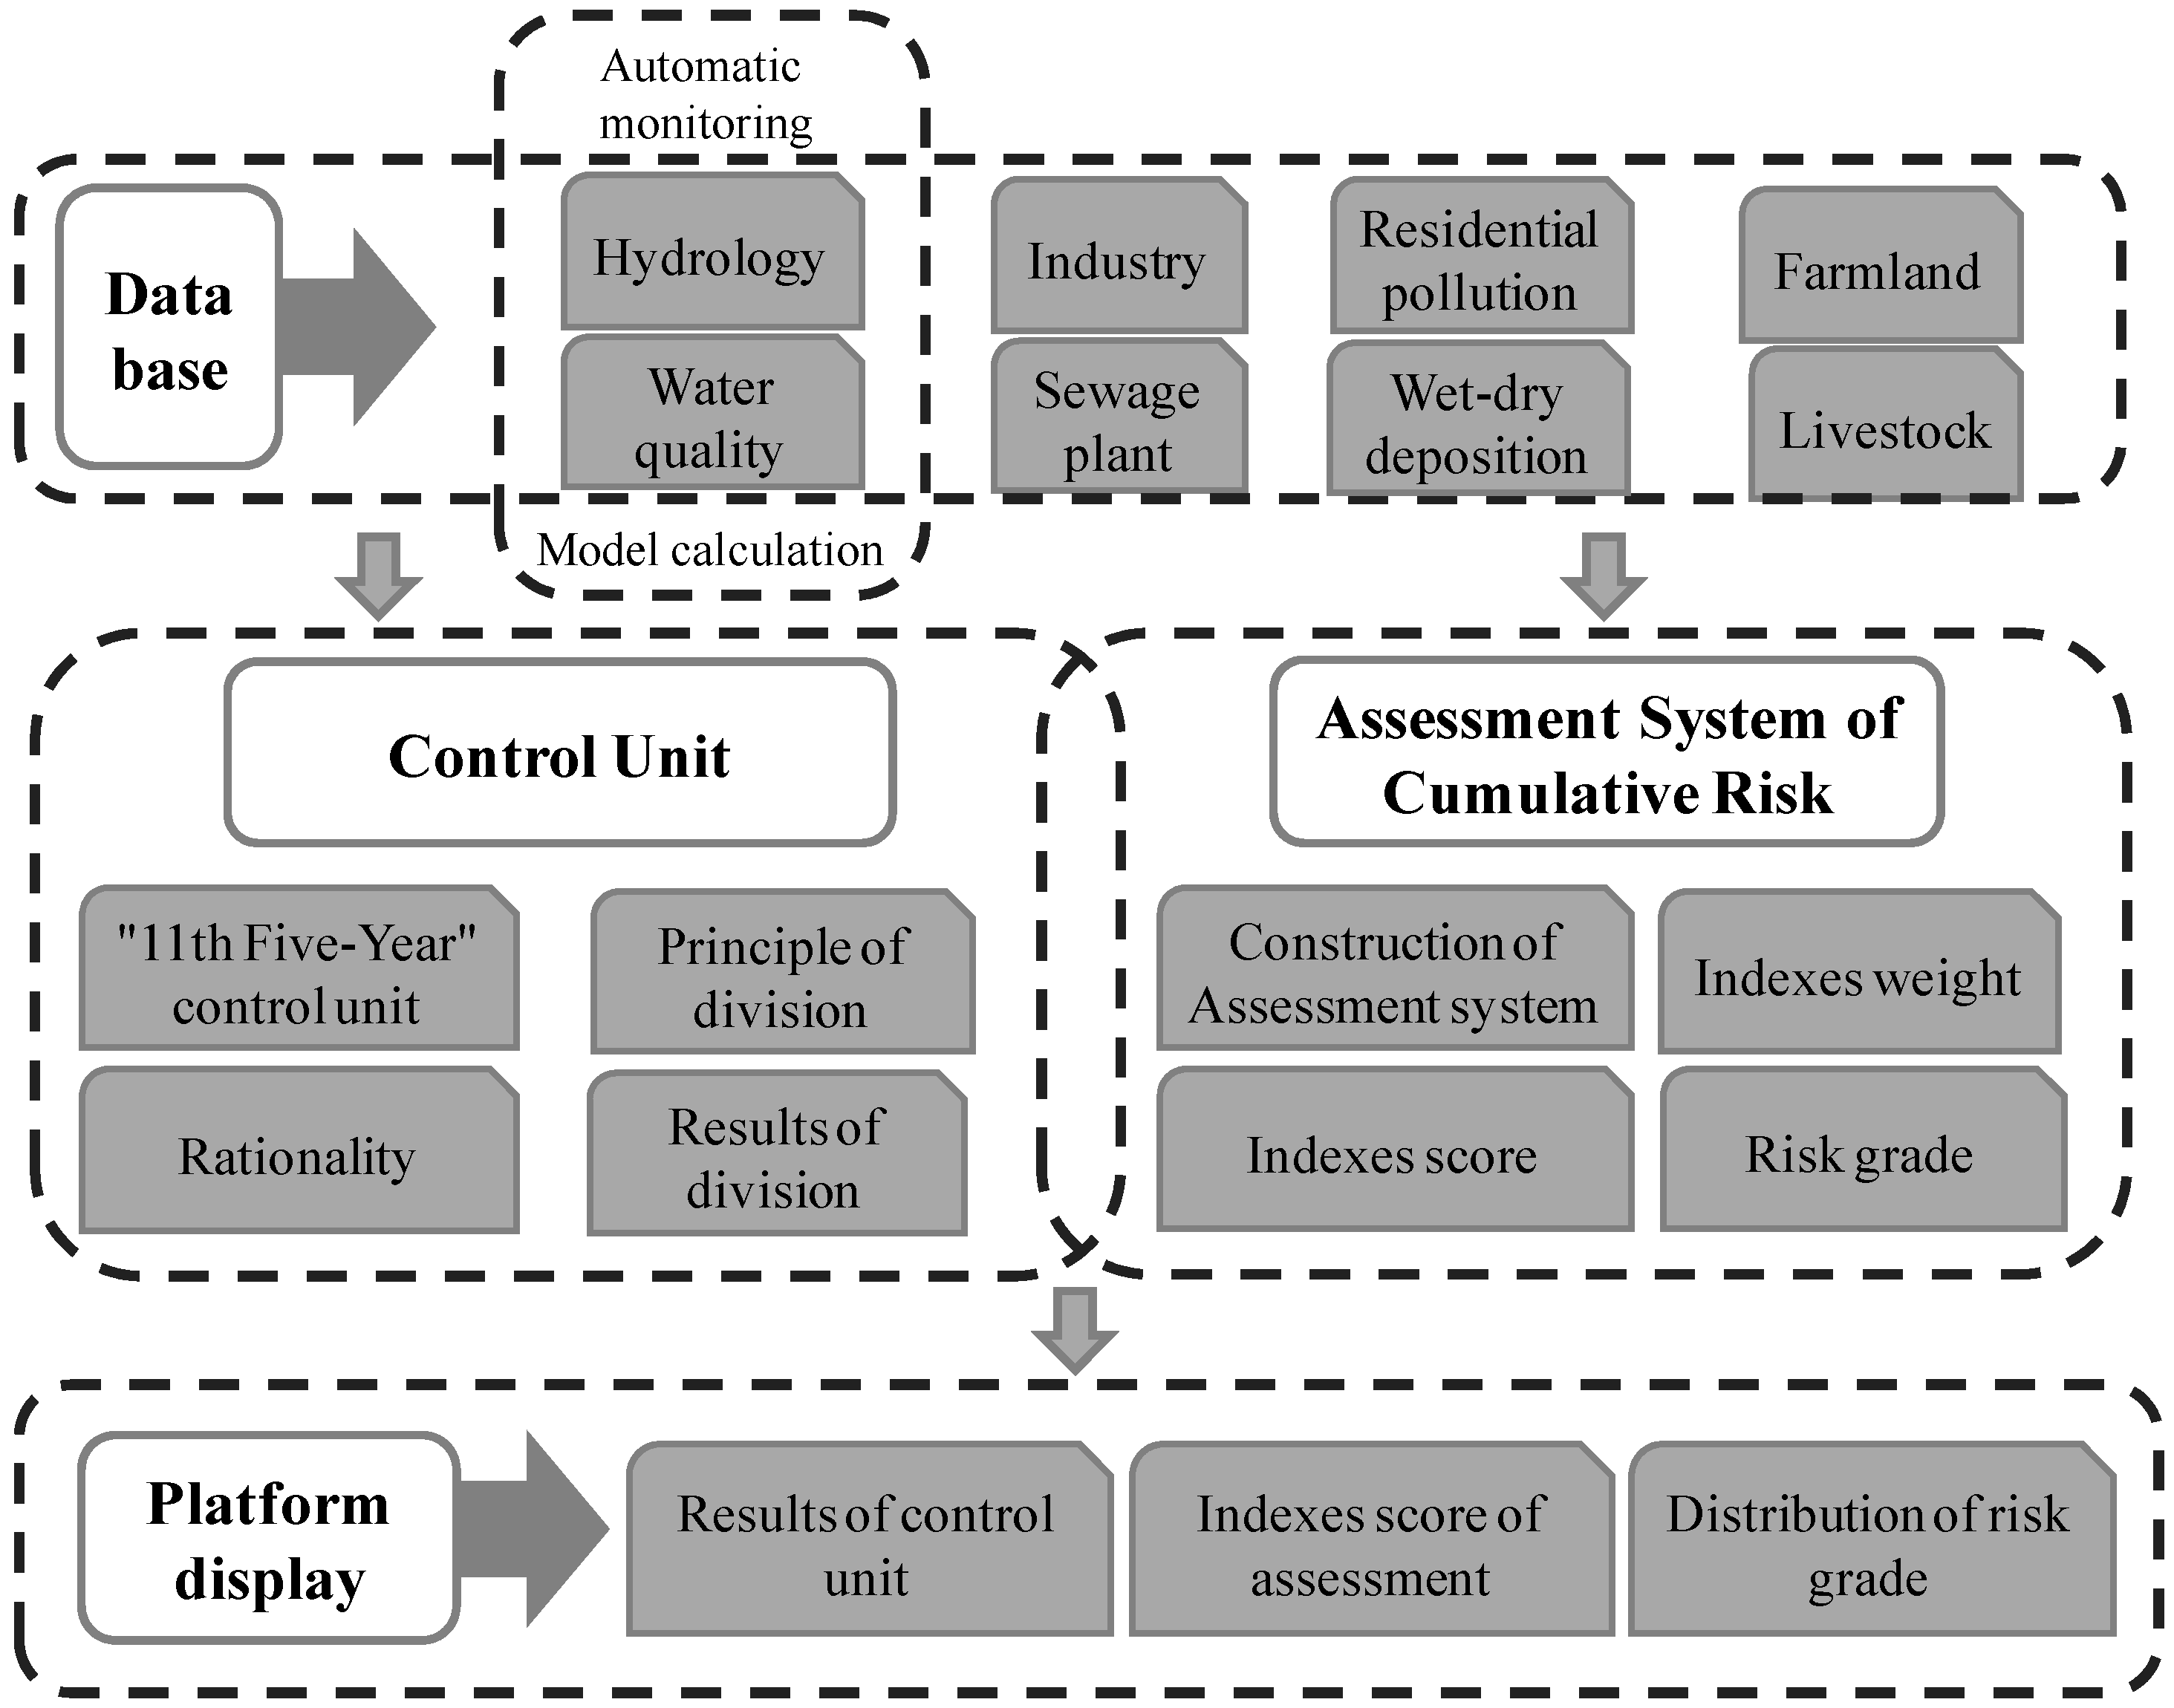
Some factors, whether the control unit division is reasonable or not, whether the cumulative risk assessment method is perfect or not, and whether the basic scientific research work is insufficient or not, are essential to provide technical supports for water environment risk warning. Therefore, the key problem is to solve how to divide the control unit reasonably and establish a complete risk assessment method. According to the characteristics of water environment in the plain river network area, control units suitable for the water environment management of the plain river network area were divided and analyzed in order to ensure the rationality in this paper. Taking the control units as the basic management units, the Pressure-State-Response (PSR) framework model is introduced into the cumulative risk assessment system under the influence of various factors. Integrating the risk assessment system with the basic database and the mathematical model [
22] established by the Environmental Monitoring Center of Zhejiang Province, the high- and medium-risk control units are calculated through the cumulative risk assessment method and are regarded as the primary basis for water environment management. Control unit division results and cumulative risk assessment technology systems are integrated into the water environment management platform in the Zhejiang area of Taihu Basin established in the
12th Five-Year Plan in order to realize the cumulative risk grading in different temporal and spatial scales, thus more effectively preventing the real-time water environment risks of each control unit. It symbolizes a beneficial attempt of basin digital environment management.
2. Study Area
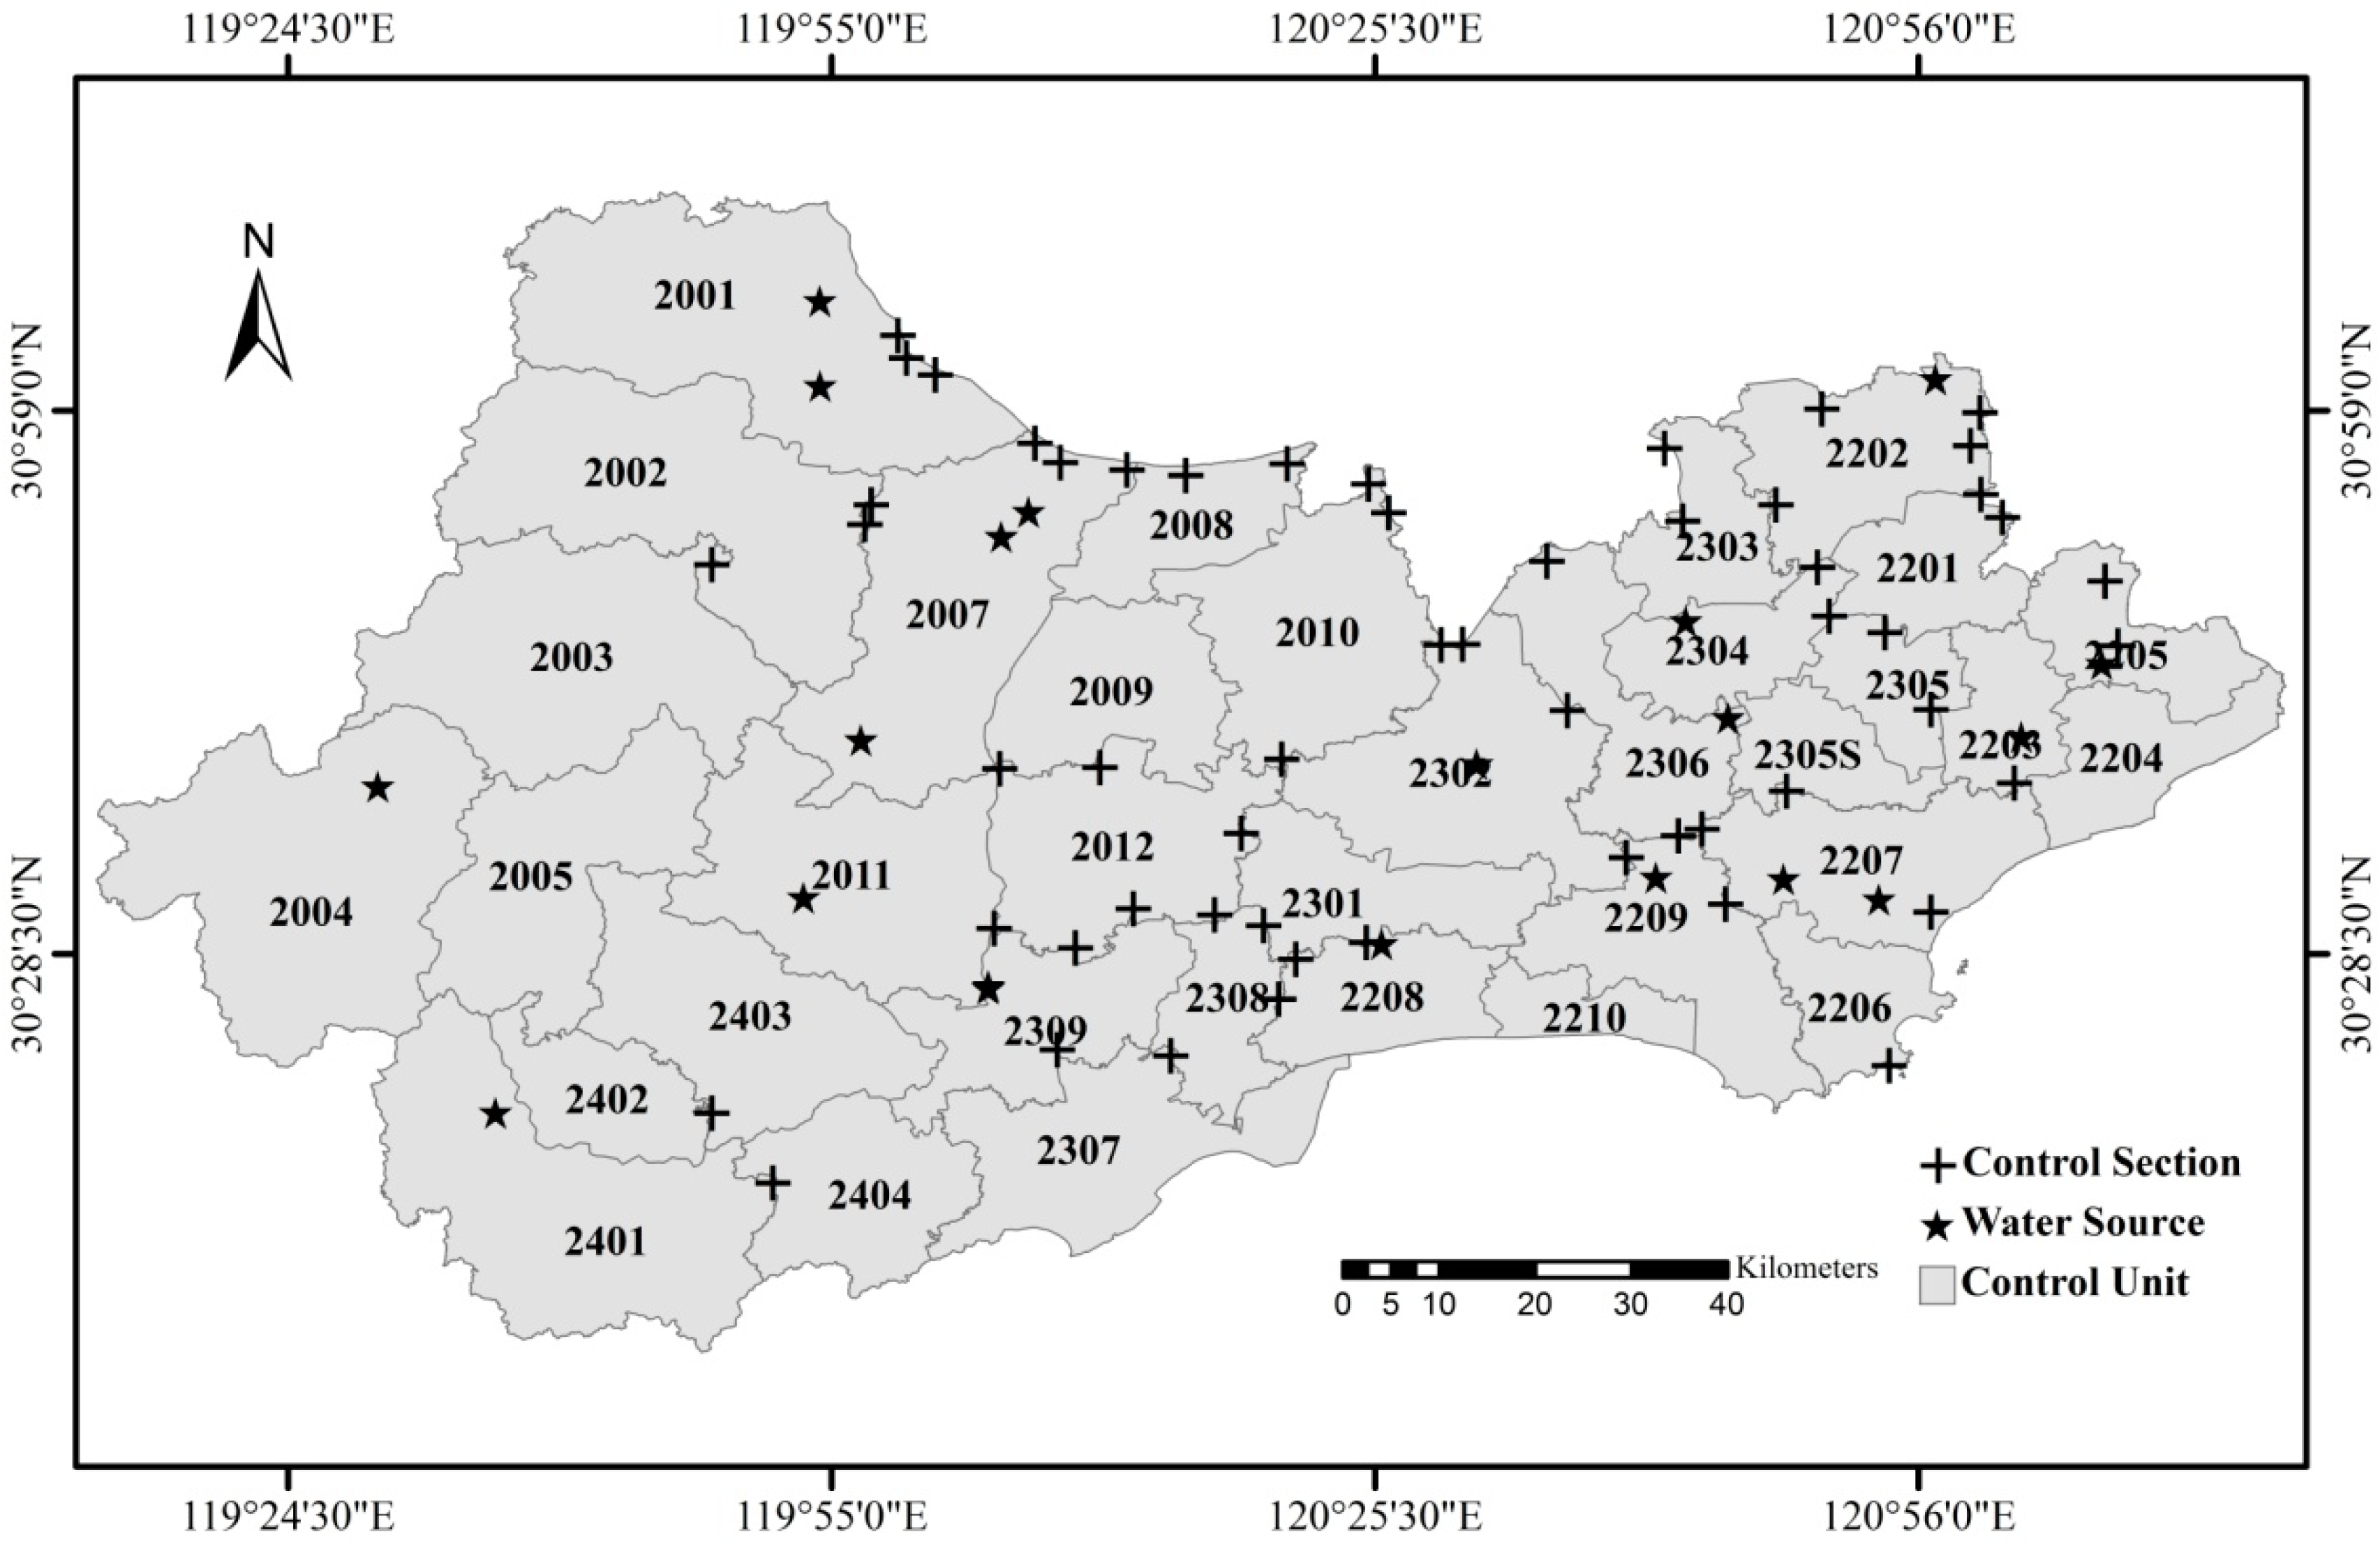
The Zhejiang area of Taihu Basin is located in the northern Zhejiang Province, adjacent to Jiangsu Province in the north, and Shanghai City in the east. As for the longitude and latitude, the basin is situated between 30°10’ and 31°8’N, 119°12’ and 121°11’E. Covering an area of 12,272 km
2, this basin crosses over thirteen administration districts, as shown in
Figure 1. The western part of the study area is Tiaoxi basin and the eastern part is the Hangzhou–Jiaxing–Huzhou plain river network area. The actual river flows of the total research area are 79.2 billion m
3. Limited by geographical conditions, the water naturally flows from southwest to northeast into Taihu Lake and Huangpu River. Moreover, influenced by the tide at the junction of the eastern part and Shanghai City, the reciprocating flow happens from time to time. The tide is mainly caused by the tide of the tributaries of the Huangpu River. Due to river bed resistance and runoff blocking, it is an irregular semidiurnal tide. The river flow in the junction of the eastern part and Shanghai City is directly affected by the tide. The annual flood volume is about 69.6 billion m
3, and the ebb volume is about 12.4 billion m
3. The average annual rainfall in the study area is about 1336 mm. Under the influence of atmospheric circulation, the variation of precipitation in the basin is relatively large, and the annual distribution is uneven. The rainfalls in May and June are affected mainly by the rainy season while the rainfalls in August and September are affected by typhoon rain. Precipitation from May to October accounted for more than 2/3 of the annual precipitation. Due to the high temperature and the evaporation in the plain area, the average annual evaporation of surface water is about 800~900 mm.
The water quality of the study area is much worse. Based on the water quality data (including COD, NH
3-N, TP) in 140 conventional water quality monitoring stations from 2011 to 2012 provided by the Environmental Monitoring Center of Zhejiang Province, the water quality categories of the study area are mainly Grade III and Grade V. According to the “Environmental quality standards for surface water (GB3838-2002)” standard, all the surface water can be divided into five categories deteriorating from Grade I to Grade V. In December 2005, the people’s government of Zhejiang Province approved the “Classification scheme of water functional area and water environment functional area in Zhejiang Province”, in which all important cross-sections in Zhejiang Province were required to achieve the relevant standard. Based on the water monitoring data of all important cross-sections from 2011 to 2012, the water quality exceeding rate has reached 70% or more, as shown in
Table 1. The main reason for the decline of the regional water environmental quality is the pollution sources in this area. The types of pollution sources include industry, sewage plant, residential pollution, farmland and livestock. According to Environmental Protection Bureau statistics data of the pollutant discharge, there were 1452 industrial enterprises in the area, with more than 200 types of industry, and the discharge of wastewater was 73.593 million t in 2011. The top five industries discharging wastewater are textile industry, paper making and paper product industry, metal smelting and rolling processing industry, leather, fur and feather products, shoemaking industry, rubber and plastic manufacturing industry. The primary pollutant of concern from those is COD, and the COD discharge constitutes more than 70% of the total industries.
4. Results and Discussion
4.1. Control Unit Division Results
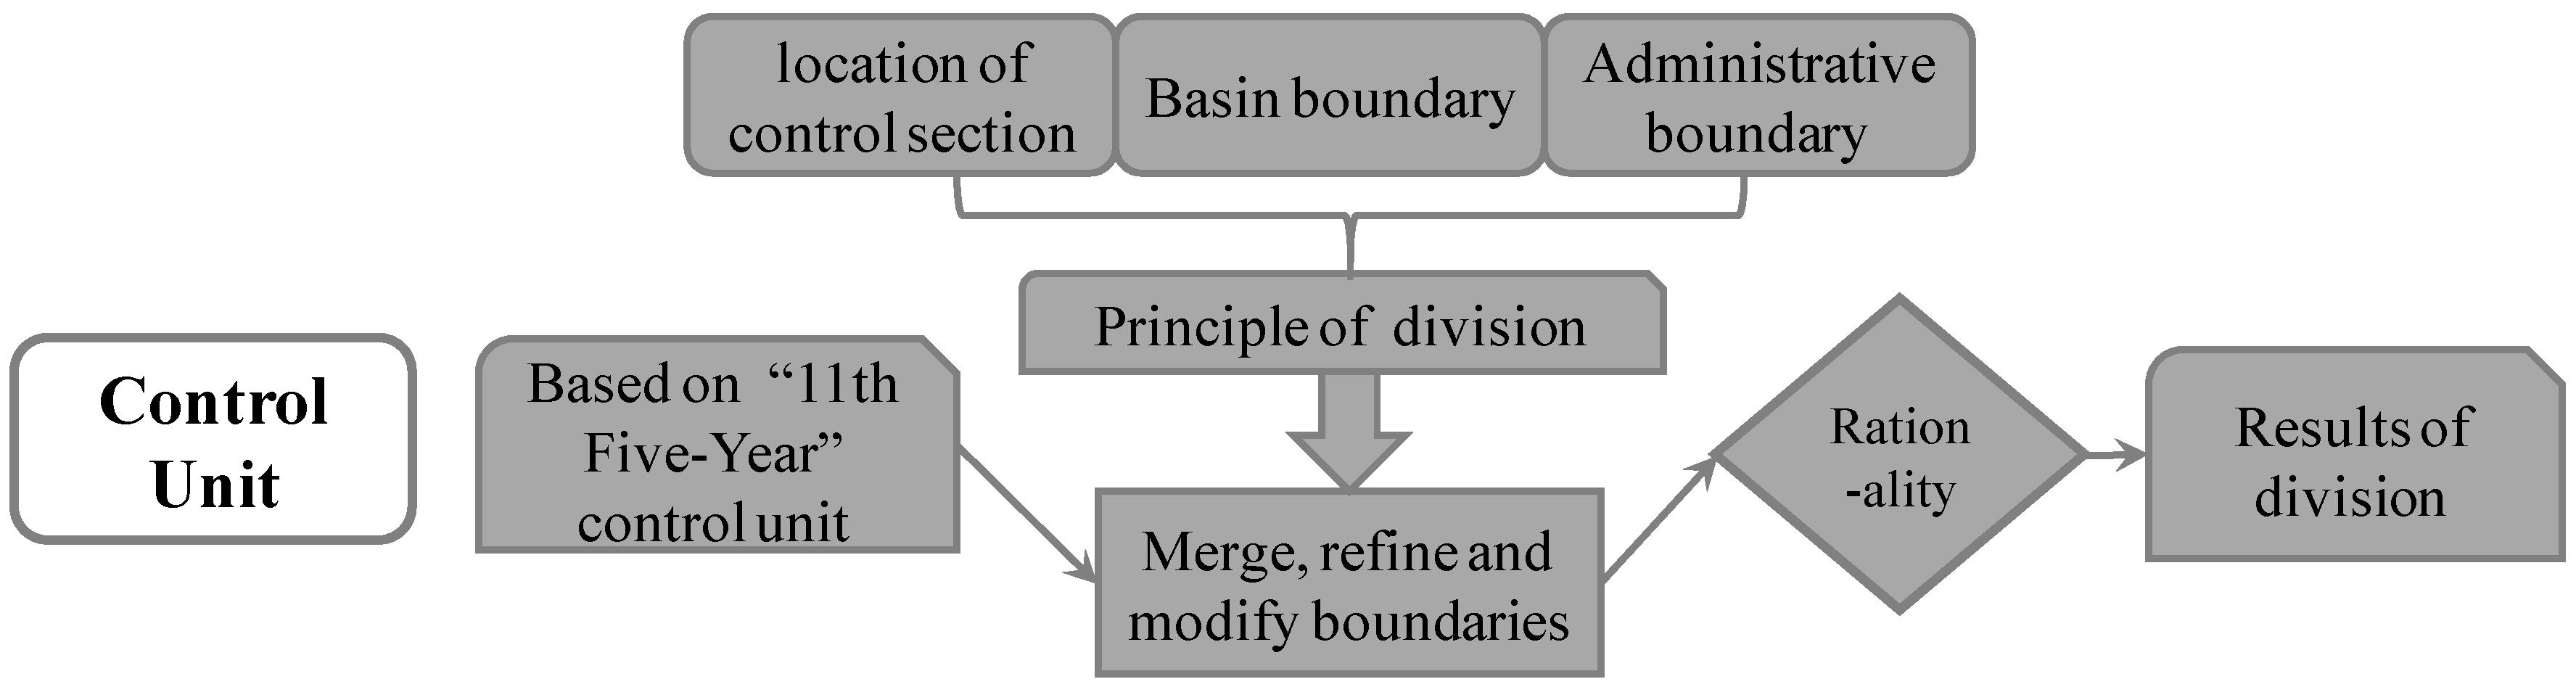
Based on the divided results of the control units in Taihu Basin during the
11th Five-Year Plan, this paper adopts the division method to further improve control unit division in the study area, which takes the country and district administration boundary, automatic monitoring system, drinking water source, basin and water conditions into consideration. After combination, refinement and modification of the boundary, this paper derives 35 control units in the study area. The results of control unit division are shown in
Figure 5.
On the premise of having clarified the location of assessment sections and drinking water sources, this paper makes adjustments and improvements on the existing division results of the control unit in the study area. Moreover, it is significant to make sure that each control unit has one control section. Compared with the control unit division results during the 11th Five-Year Plan, the result in this paper is more convenient to the environmental management.
4.2. Rationality Analysis of Control Unit Division Results
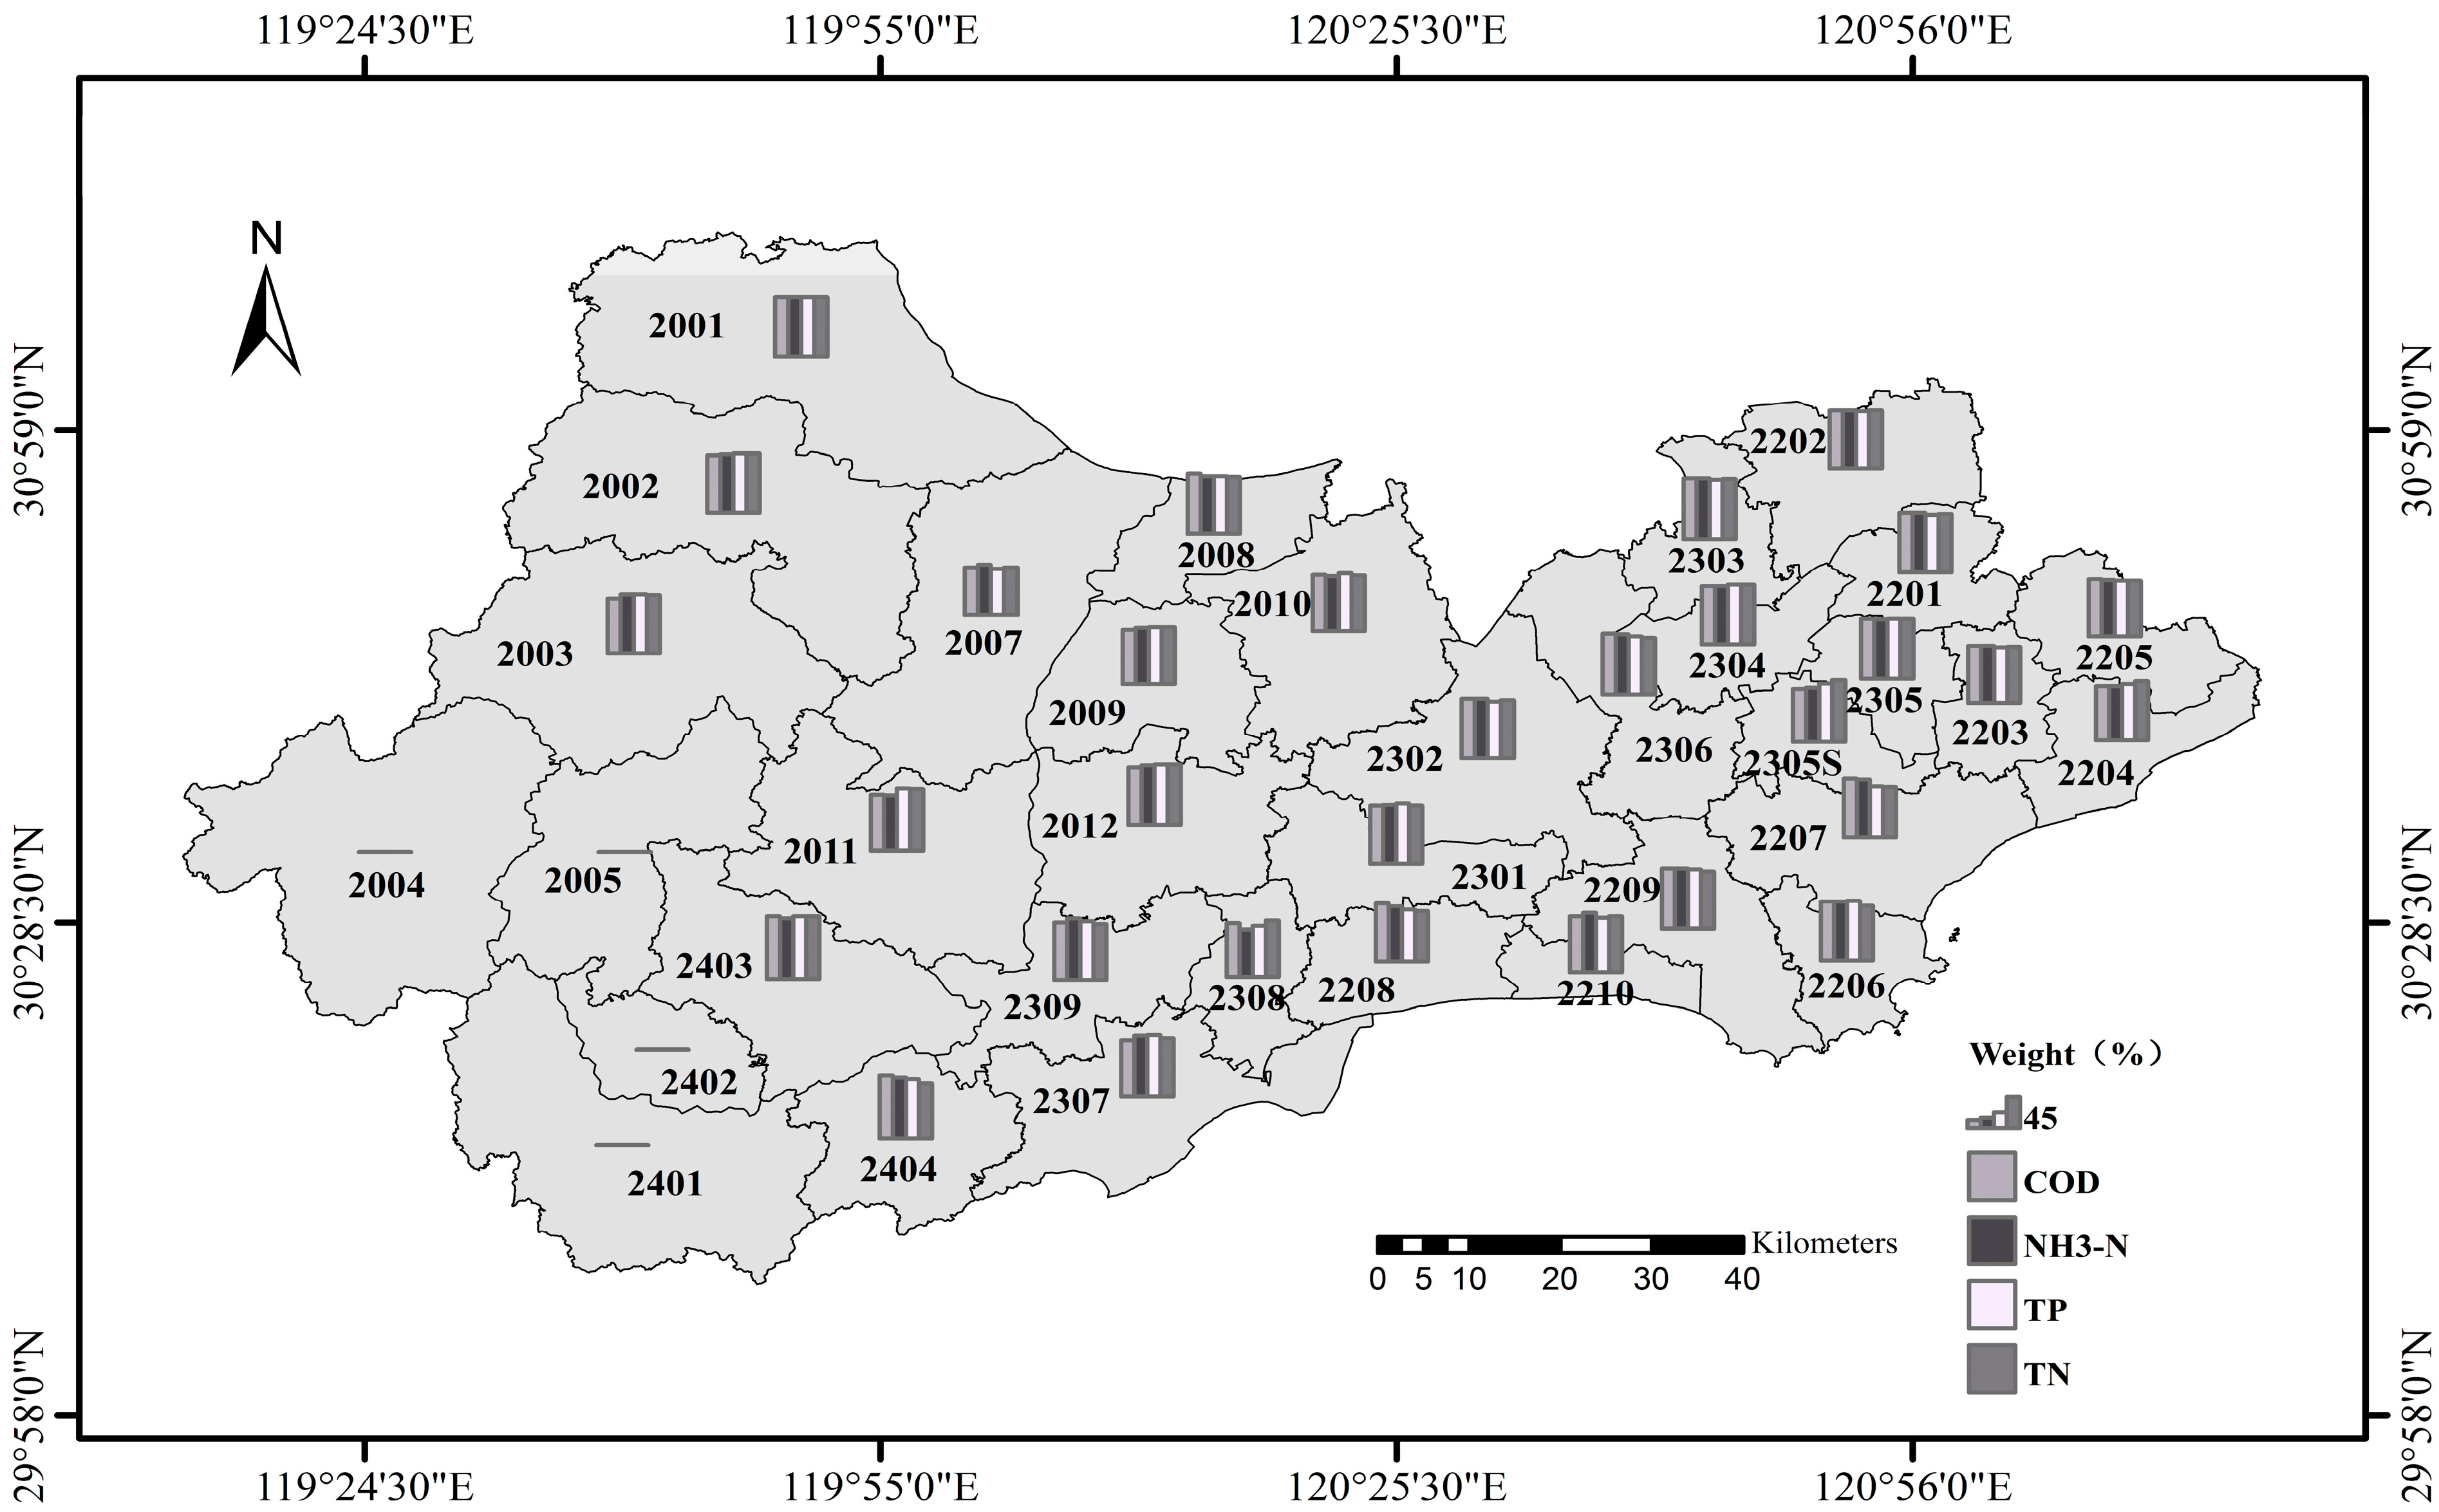
The control unit is the area where the main pollution has the prominent influences on the water quality of the control section. Through calculating the influential weight of control unit internal pollution load against control section water quality, the rationality of control unit division could be determined. According to the pollution load materials, the water condition materials, control section information in the study area, the influential weight of control unit internal pollution against control section water quality could be calculated. The calculation results are as shown in
Figure 6. Based on the maximizing integrity of the water system, the scale of the divided control unit can be used to reflect the pollution status in the area. According to the calculation results, the influential weight of each control unit internal pollution against control section water quality ranges between 65% and 89%. This implies that the internal pollution source in the control unit is the main influential source of control section water quality. Besides, the control of internal pollution sources could effectively guarantee the improvement of water quality. Among others, the internal rivers of the four control units, with codes as 2004, 2005, 2401 and 2402, all belong to river sources. There does not exist any pollution load outside of the control unit.
The area of control unit after being improved ranges between 112 km2 and 770 km2. Due to the consistency with five-class hydrological unit basin size (163~1013 km2), the complete drainage and the pollutant impact weight with in the allowable range, the division of each control unit is basically rational.
4.3. Index Weight Calculation Results
There are no objective index thresholds for the secondary and the primary index weight, and the weight coefficient is determined through AHP. The tertiary indexes of the pressure and state layers are quantitative indexes, and the weight is determined by entropy method. The ecological landscape index and the tertiary indexes of the response layer are qualitative indexes, and the weight is determined relying on the experts. Fifteen questionnaires were collected and all regained, and then validated by consistency test. The questionnaire mainly involved experts in the field of water environment as well as the relevant personnel of the management agency in the study area. The experts need to determine its priorities between every two indexes in the primary index, secondary index and tertiary index, so as to establish the matrix to determine the weight coefficient of each index. The calculation result is shown in
Table 4.
4.4. Cumulative Risk Assessment Results
Based on the results of the control unit division, this paper adopts pollution source and the hydrology data of Zhejiang Province environmental statistics in 2011, pollution source data of the Zhejiang Province Yearbook in 2012 (2011 statistics) [
32],the water quality data of water environment normal monitoring in 2011, hydrology and water quality statistics data from 55 automatic stations in the study area and the hydrology and water quality data from the water environment mathematical model of the Zhejiang area of Taihu Basin to assess the water environment cumulative risks in the study area. The data of the environment capacity, pollutant flux and threshold value are adopted from the results of the National Water Pollution Control and Treatment Science and Technology Major Project in the Zhejiang area of Taihu Basin during the
12th Five-Year Plan. Pursuant to the above materials, the tertiary indexes of the pressure and response layer in each control unit were scored, and 15 relevant experts give the score to the indexes of ecological landscape index and tertiary indexes of the responding layer. The cumulative risk grading comprehensive score in 35 control units in the study area could be calculated through comprehensive risk assessment method. The range of grading score is varied between 1.277~3.185. Accordingly, there will be 13 high-risk control units, 12 medium-risk control units, 5 low-risk control units, and 5 extremely low-risk control units. The distribution of control unit cumulative risk grading is as shown in
Figure 7.
According to the cumulative risk grading division results of the control unit, there are 13 high-risk control units mainly distributed in the downstream area of the study area. Besides local pollution discharge, this area also bears the cumulative pollution from the upstream area. As a consequence, the prior control status of this area needs to be concerned. There are 12 medium-risk control units. For most control units, there exist potential pollution risks with various degrees. Therefore, it is necessary to enhance risk monitoring and prevention warning management and effectively prevent the transition to high-risk layer.
4.5. System Integration
With the help of the water environment management platform in the Zhejiang area of Taihu Basin established by DHI Shanghai company Limited during the
12th Five-Year Plan period, this paper adopted B/S and C/S deployment method [
33] and system interconnection technology to insert the results of control units division and the cumulative risk assessment technology system into the existing management platform. The risk grade threshold and the cumulative risk grading scoring method were integrated into this management platform. Making use of the platform function of dynamically updating basic database, the new integrated platform could not only judge but also manifest the real-time cumulative risk grading in the control unit.
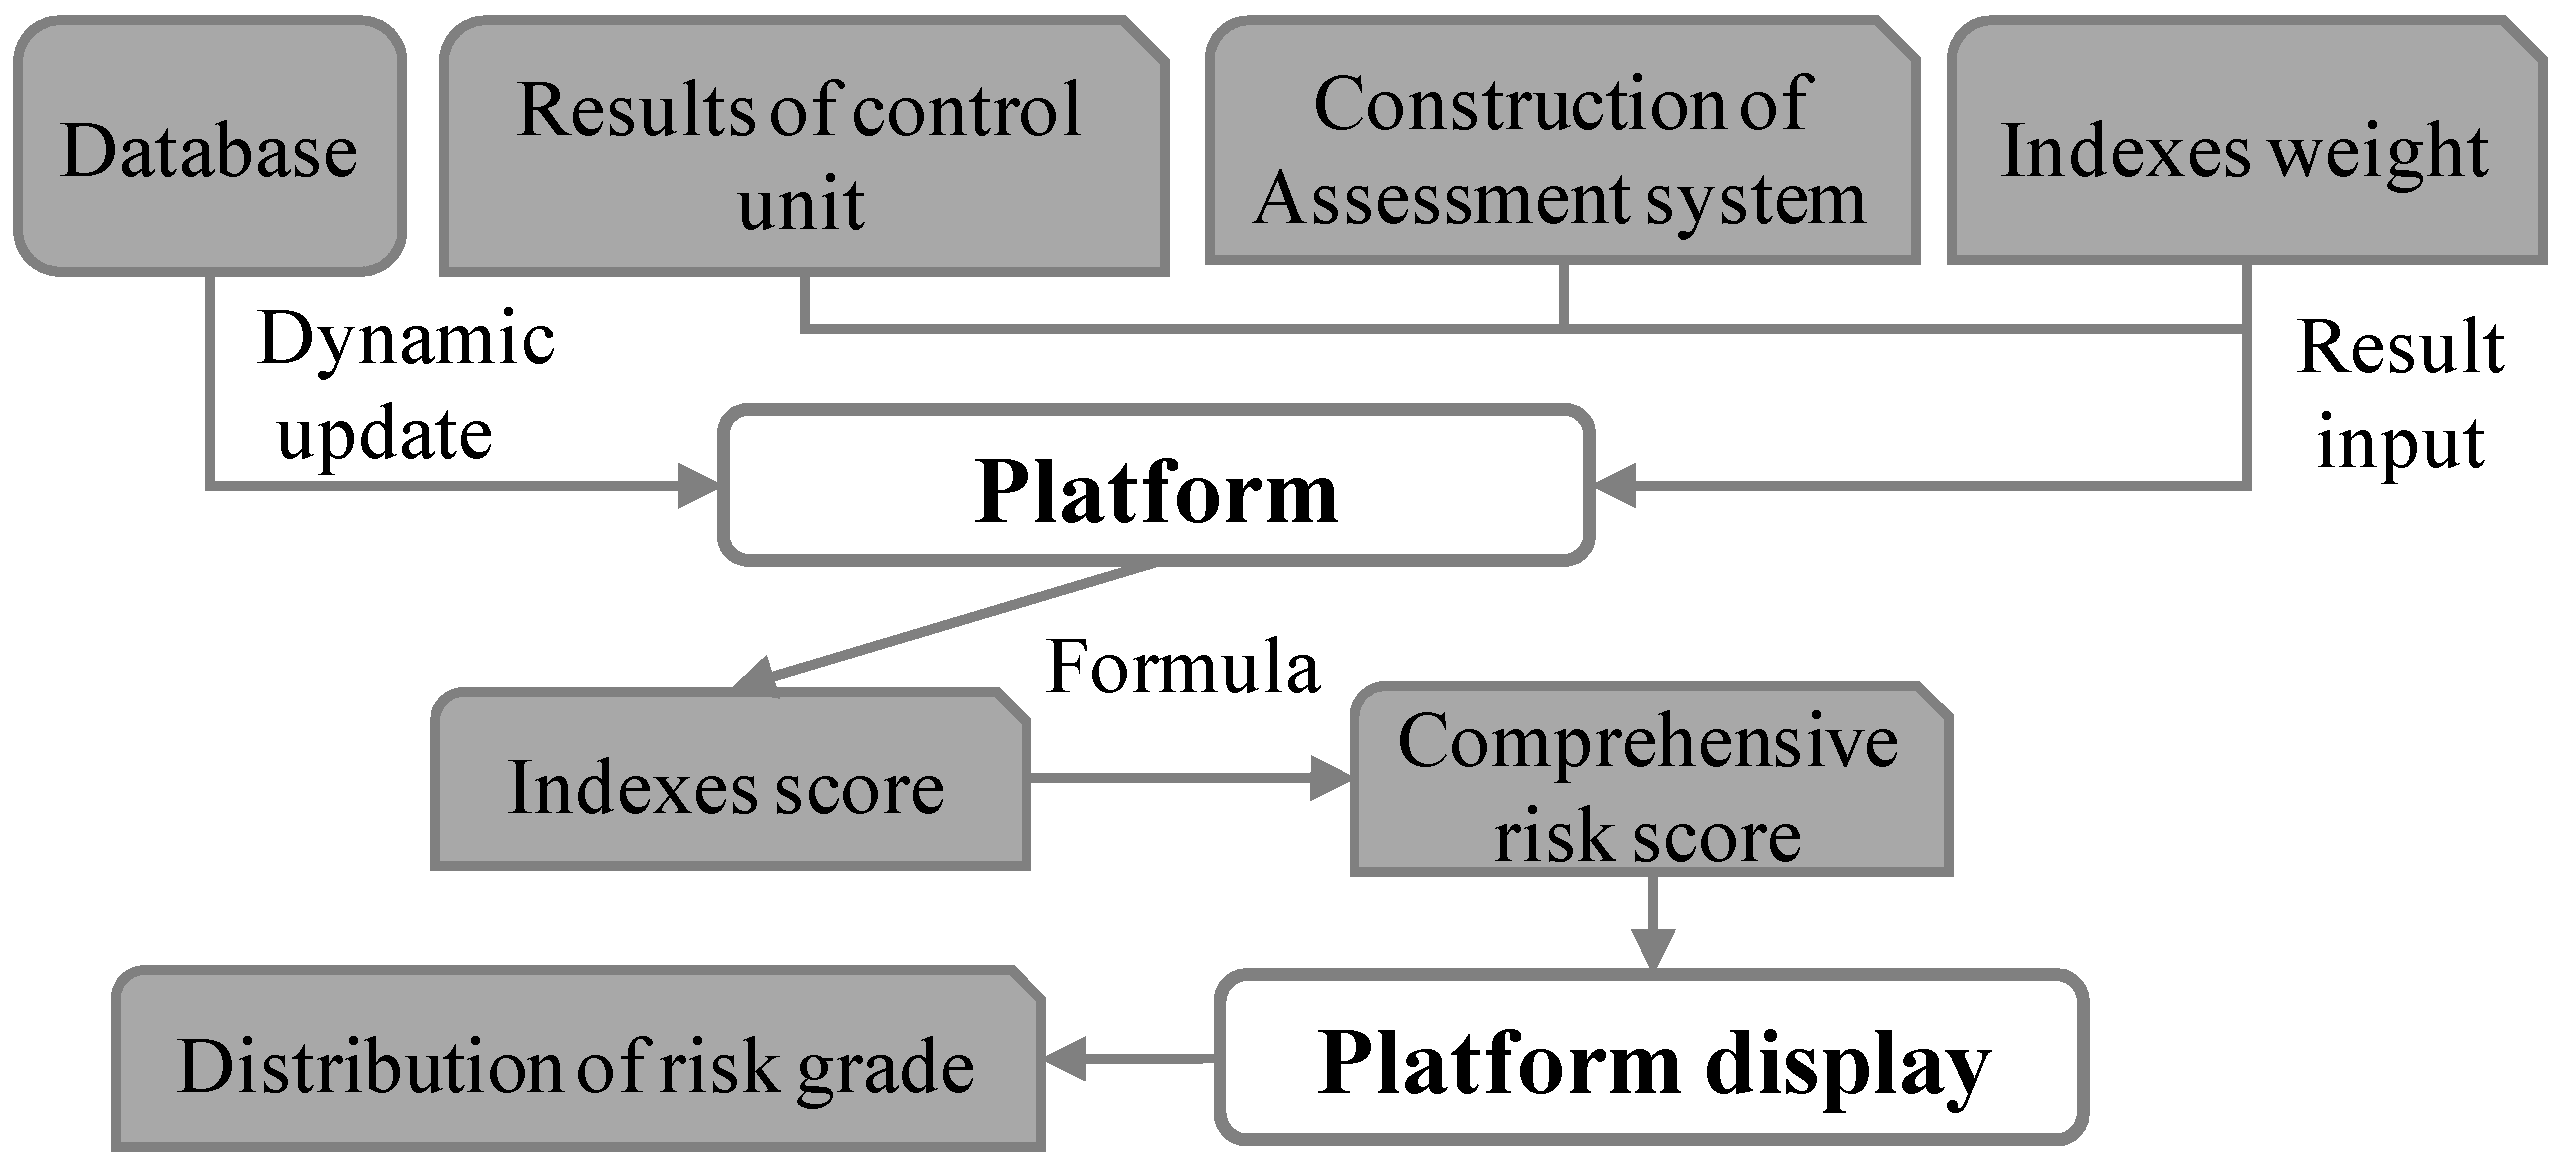
According to the risk grading judgment index system, the risk grading judgment function module could demonstrate the assessment area, the index system and index weight. In the front part of the interface, users could select the time period and realize risk assessment results inquiry, presentation and derivation functions. The presentation function takes the control unit as the presentation unit and presents statistics with different colors according to different risk grades. The export function could assess different time steps with identical assessment unit (year, month, day) and identical time steps with different units to export results. The platform structure is shown in
Figure 8.
The cumulative risk assessment technology module of the management platform in the Zhejiang area of Taihu Basin combines the exiting hydrology and water quality statistics from 55 automatic monitoring stations in Zhejiang Province and takes the existing water environment mathematics model in the Zhejiang area of Taihu Basin as a reference, so as to realize the dynamic calculation of cumulative risk assessment. Each type of data is connected with the interface established by the exiting platform. The management platform could satisfy the management requirements of users to exert real-time calculation and presentation functions in the study area and offer policy supports for cumulative risk monitoring warning in the study area. It is also a beneficial attempt in basin digital environmental management.
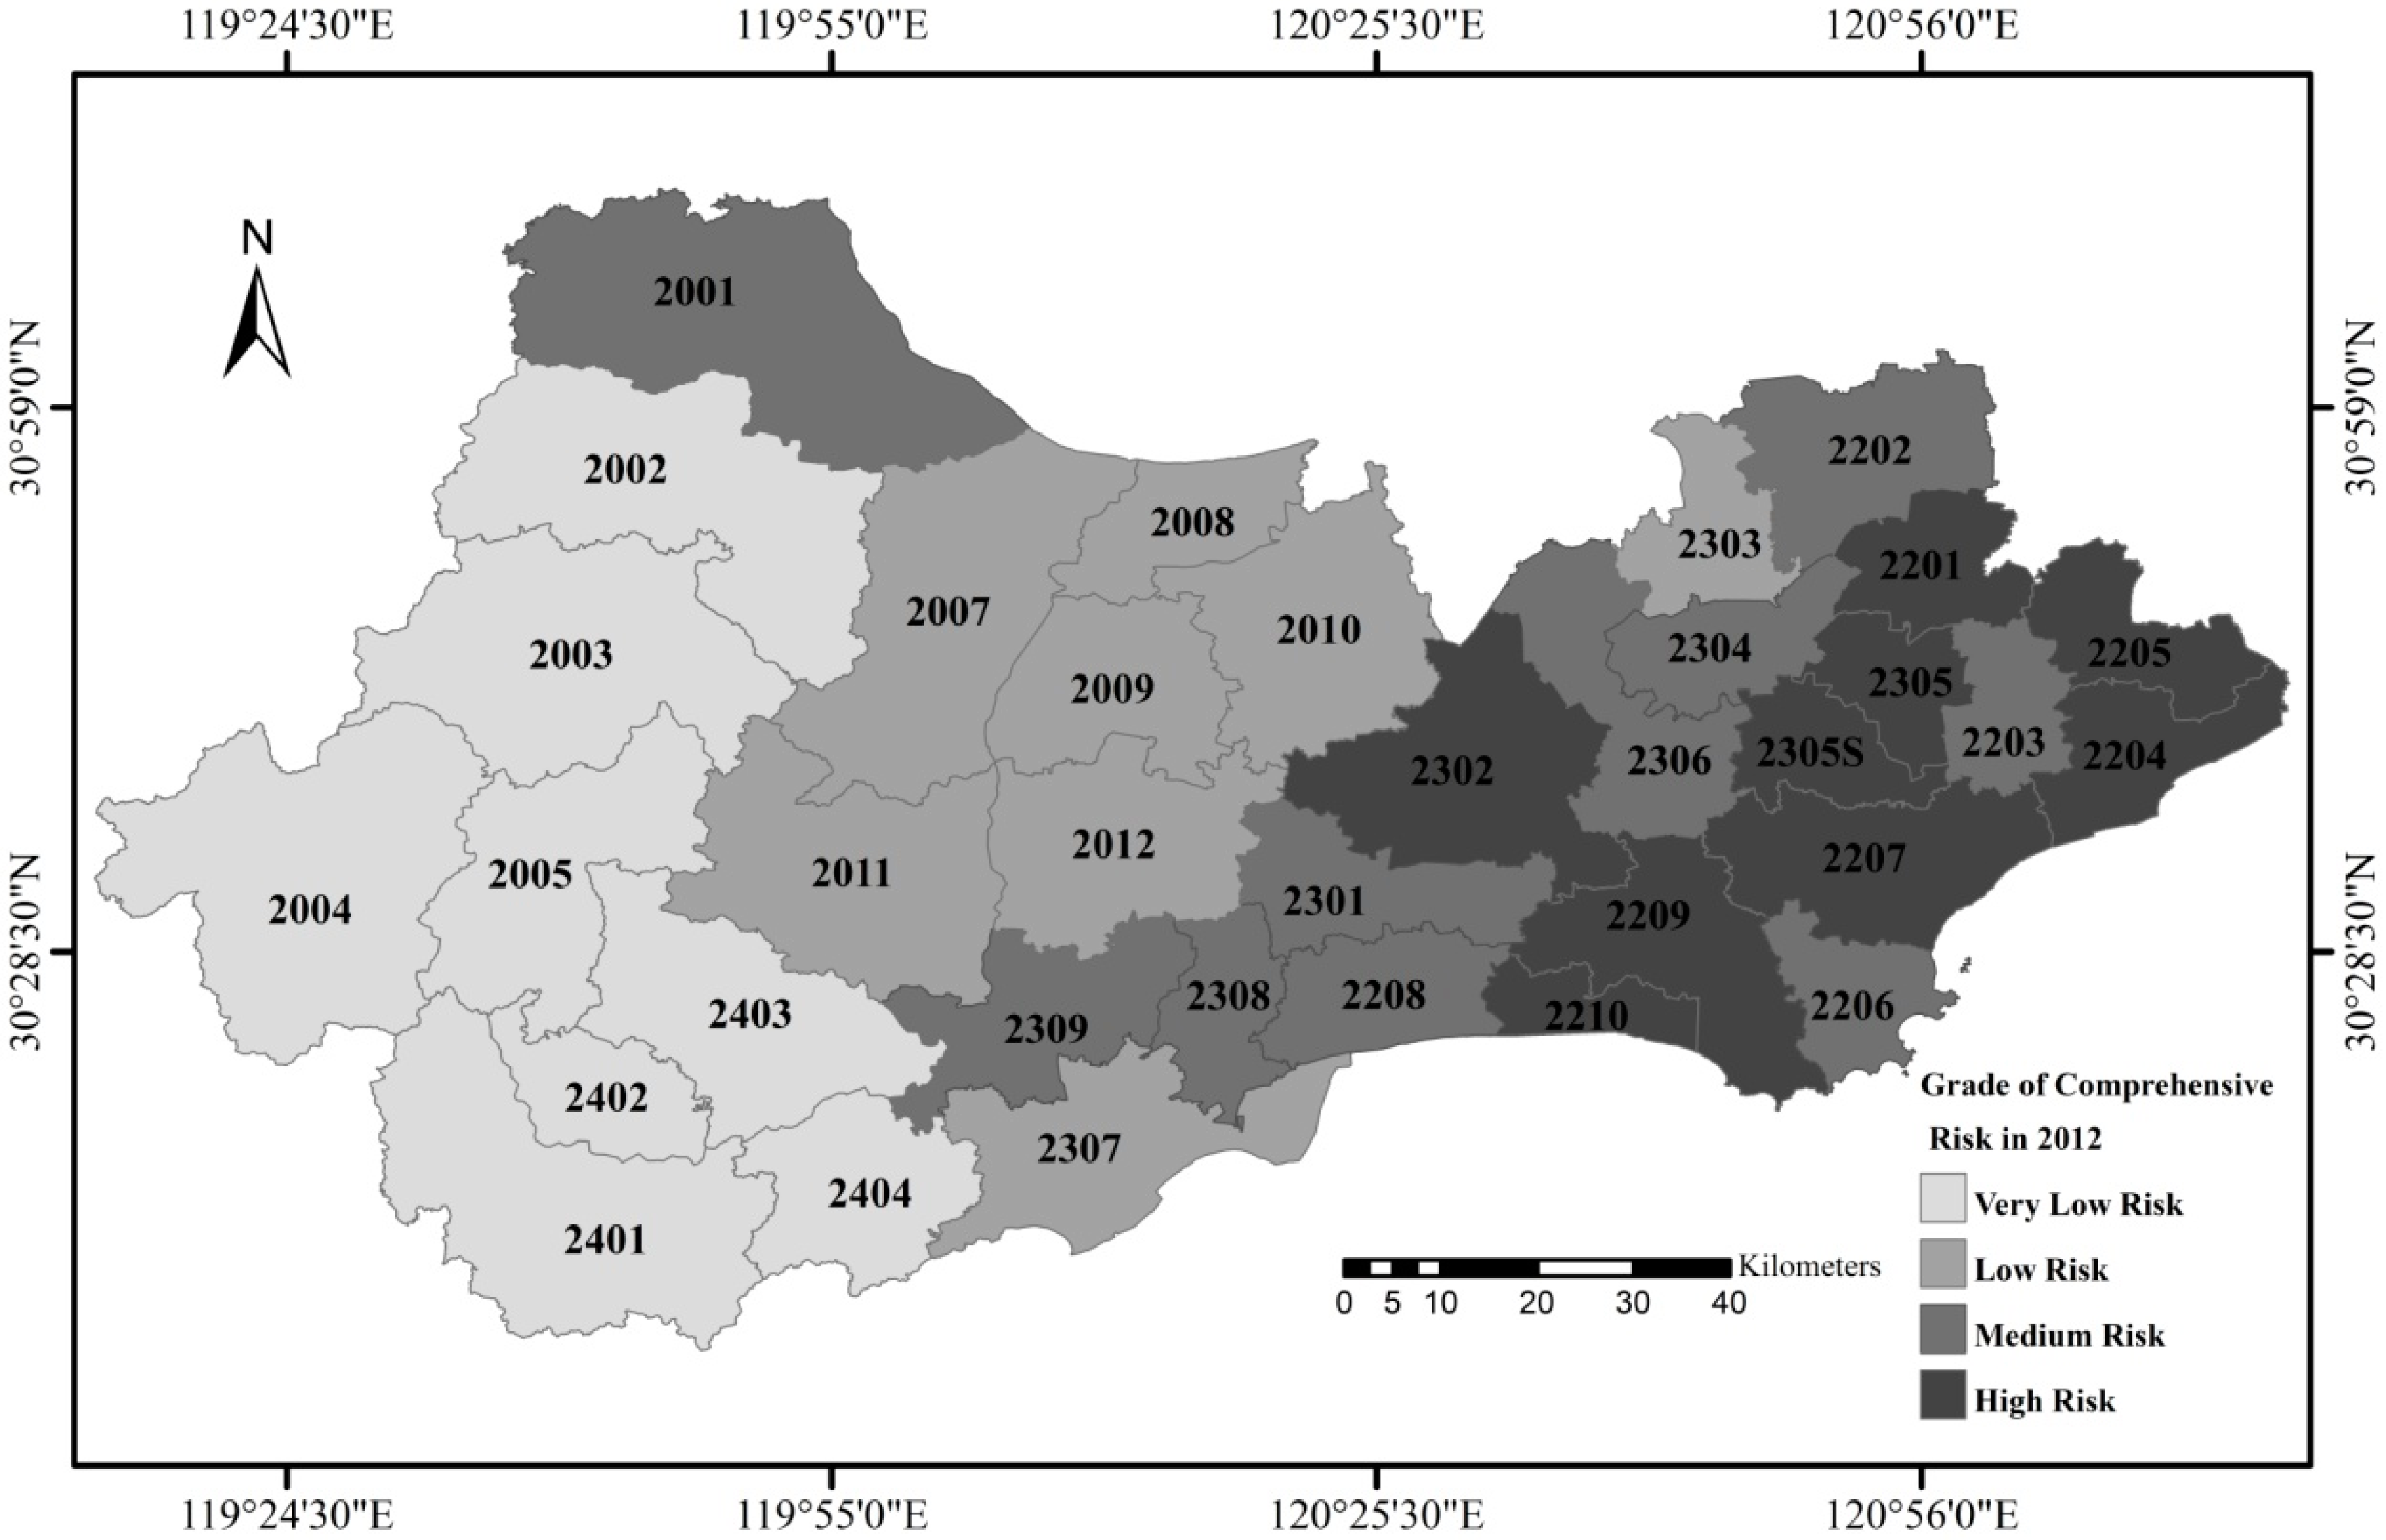
By way of the dynamic calculation function in the management platform, this paper selects the statistics in 2012 to make cumulative risk assessment. The system automatic calculation and the presentation results are as shown in
Figure 9. In comparison with the cumulative risk assessment results in 2011, the number of high-risk control units decreases to nine,which proves that the water environment pollution conditions in 2012 have achieved prominent progress. The high-risk control unit requires a further rational control so as to completely improve the water environmental conditions.
5. Conclusions
Firstly, the division of control unit regarded as the basic unit of water pollution control has to fully take the river direction and water system integrity characteristics of water systems in the plain river network area into consideration. Based on control unit division methods, this paper divided 35 control units in the Zhejiang area of Taihu Basin with a coverage of 112~770 km2. The divided control unit is basically consistent with five-degree division scale in America. The influential weight of control unit internal pollution load against control section water quality ranges between 65% and 89%. Thus, the division results of control units are basically rational.
Secondly, according to the water environmental characteristics in the study area, this paper established a water environment cumulative risk assessment technology system in the Zhejiang area of Taihu Basin. Cumulative risk grading judgment is conducted on 35 control units on the basis of the automatic monitoring data, the model assessment data and the pollution source database in 2011 in the study area, reaching a conclusion that there are 13 high-risk control units, 12 medium-risk control units, 5 low-risk control units and 5 extremely low-risk control units.
There are 13 high-risk control units mainly distributed in the downstream area of the study area. Besides local pollution discharge, this area also bears the cumulative pollution from the upstream area. As a consequence, the prior control units of this area need to be concerned. There are 12 medium-risk control units. For most control units, there exist potential pollution risks with various degrees. Therefore, it is necessary to enhance the risk monitoring and prevention warning management so as to effectively prevent the transition to high-risk control unit.
Thirdly, combine the divided control unit results and water environment cumulative risk assessment technology system with the management platform. By using the database, geographical information system and the visual programming technologies, this platform simplified the binding conditions, the calculation methods and the results analysis into the visual interface, and realized the real-time display of the dynamic calculation results.
In the future when the automatic monitoring system could be applied comprehensively, and the water environment risk grading could be judged according to the retrieval of water environment materials, it is available to effectively prevent the real-time water environment risks in each control unit. This method could be improved as for the cumulative risk assessment in random scope range. It is a beneficial attempt of basin digital environment management.


