1. Introduction
R&D collaborative efforts between large firms and small and medium-sized enterprises (SMEs) are increasingly recognized as central to innovation for sustainable growth. It is now commonly admitted that inter-firm collaboration can be beneficial to each firm due to the high possibility of accessing new knowledge, new markets, additional resources, and improving management skills [
1,
2]. In addition, to maintain the balance of the strength of SMEs and large firms, greater emphasis is placed on the differences between their strengths and weaknesses. Considering the importance of a win-win approach in the R&D collaboration of large firms and SMEs, it may be useful to investigate their characteristics. SMEs considerably differ from large firms in a variety of ways that effect fundamental organizational change [
3,
4,
5,
6]. In terms of firm size, while smaller firms have strengths in enabling rapid learning and development, as they have a narrow knowledge base, large firms have a wider knowledge base and focus on internal learning [
7,
8]. Furthermore, SMEs generally experience additional difficulties in managing R&D projects in comparison with large firms [
9]. In particular, the effect of R&D collaboration for SMEs is greater than that for large firms [
10]. Hence, new capitalism has recently emerged in the business environment, in which greed is controlled because of the deepening inequality and economic instability caused by the global financial crisis [
11]. The aim of this study is therefore to determine whether technological collaboration can optimize the technological strengths of SMEs and large firms, and how this, in turn, could facilitate a successful R&D partnership between SMEs and large firms.
Several previous research works proposed the terminologies such as SME-oriented supply chain [
12], SME-oriented innovation support [
13] and SMEs-oriented technology [
14] to define the specific capability of SMEs, considering their business environment. However, such terminologies have been barely utilized in practical fields of building strategies or policies. In general, the concept of SME-suitable industry has been suggested to identify industries that need to be protected from the indiscriminate business expansion of large companies [
15,
16]. Business expansion to new markets is influenced by firm size. In addition, incumbent firms could even have difficulty in competing with others even if they have all resources and advantages [
17]. Since the notion of the SME-suitable industry focuses on the perspectives of products and services, the activities of technology development have been not considered on the table for discussing the protection of SMEs. Among others, SME-only areas that limit the entrance of large companies under the laws is a frequently used terminology [
15]. In particular, appropriate technology for SMEs has been broadly utilized to elevate the technological capability of SMEs for the purpose of supporting undeveloped countries and disadvantaged social groups [
18]. Since this paper deals with technology areas rather than business fields, the terminology SME-suitable technology will be selected to define specific technologies that SMEs have a considerable competence to develop in competition with large companies and which need to be protected from the invasion of them.
Concern about selecting the appropriate SME-suitable technology has surfaced as a serious issue in several countries because of the increasing conflicts between SMEs and large firms, in which knowledge embodied in the dynamic capabilities of SMEs can unintentionally flow to the larger partner [
19]. It is essential that the knowledge of SMEs is not disclosed to the larger partner [
20]. Curiously, despite the increase in the number of studies on the asymmetric relationship between large firms and SMEs, few have attempted to address a systematic method that identifies SME-suitable technology in R&D collaboration. In order to overcome the asymmetric nature of the partnership, the autonomous market penetration of large firms needs to be controlled by identifying SME-suitable technology as a public policy. In light of the important role played by SMEs in the economy, policy makers need to consider that the nature of the firm, especially its size, and the feature of technology should be simultaneously reflected for efficient R&D activities [
21].
Recent studies have tended to deal with the effects of firm size on technological innovation. At a fundamental level, there is a similar consensus on the nature of related research, both in terms of theoretical arguments and empirical evidence. When opportunities are more uncertain, small-sized start-up firms have entrepreneurship to quickly respond to business opportunities for innovation with first mover advantages [
22]. As Holgersson [
23] points out, recent surveys have revealed different insights into the way that patenting is used in SMEs and large firms. In addition, many researchers have included firm size in their business innovation-related models [
24].
However, minimal research has been carried out on the relation between fields of technology and size of company for win-win R&D collaboration. Previous studies conducted analyses of the relationship between R&D cooperative types and technology sectors without the consideration on the distinction between large enterprises and SMEs. In particular, the papers scarcely considered open innovation, although large firms and SMEs should be engaged in win-win collaboration. Although the relationship between firm size and innovation has been considerably examined in the earlier studies, theoretical frameworks and empirical evidence of this area remain far from a fully answered situation. Therefore, it will be necessary to relate company size to the characteristics of technology that influence the effectiveness of R&D partnerships between SMEs and large firms. Additionally, although existing studies concentrate on qualitative analysis based on business development, little research has been performed on quantitative analysis to classify a specific technology into large firms and/or SME-suitable categories.
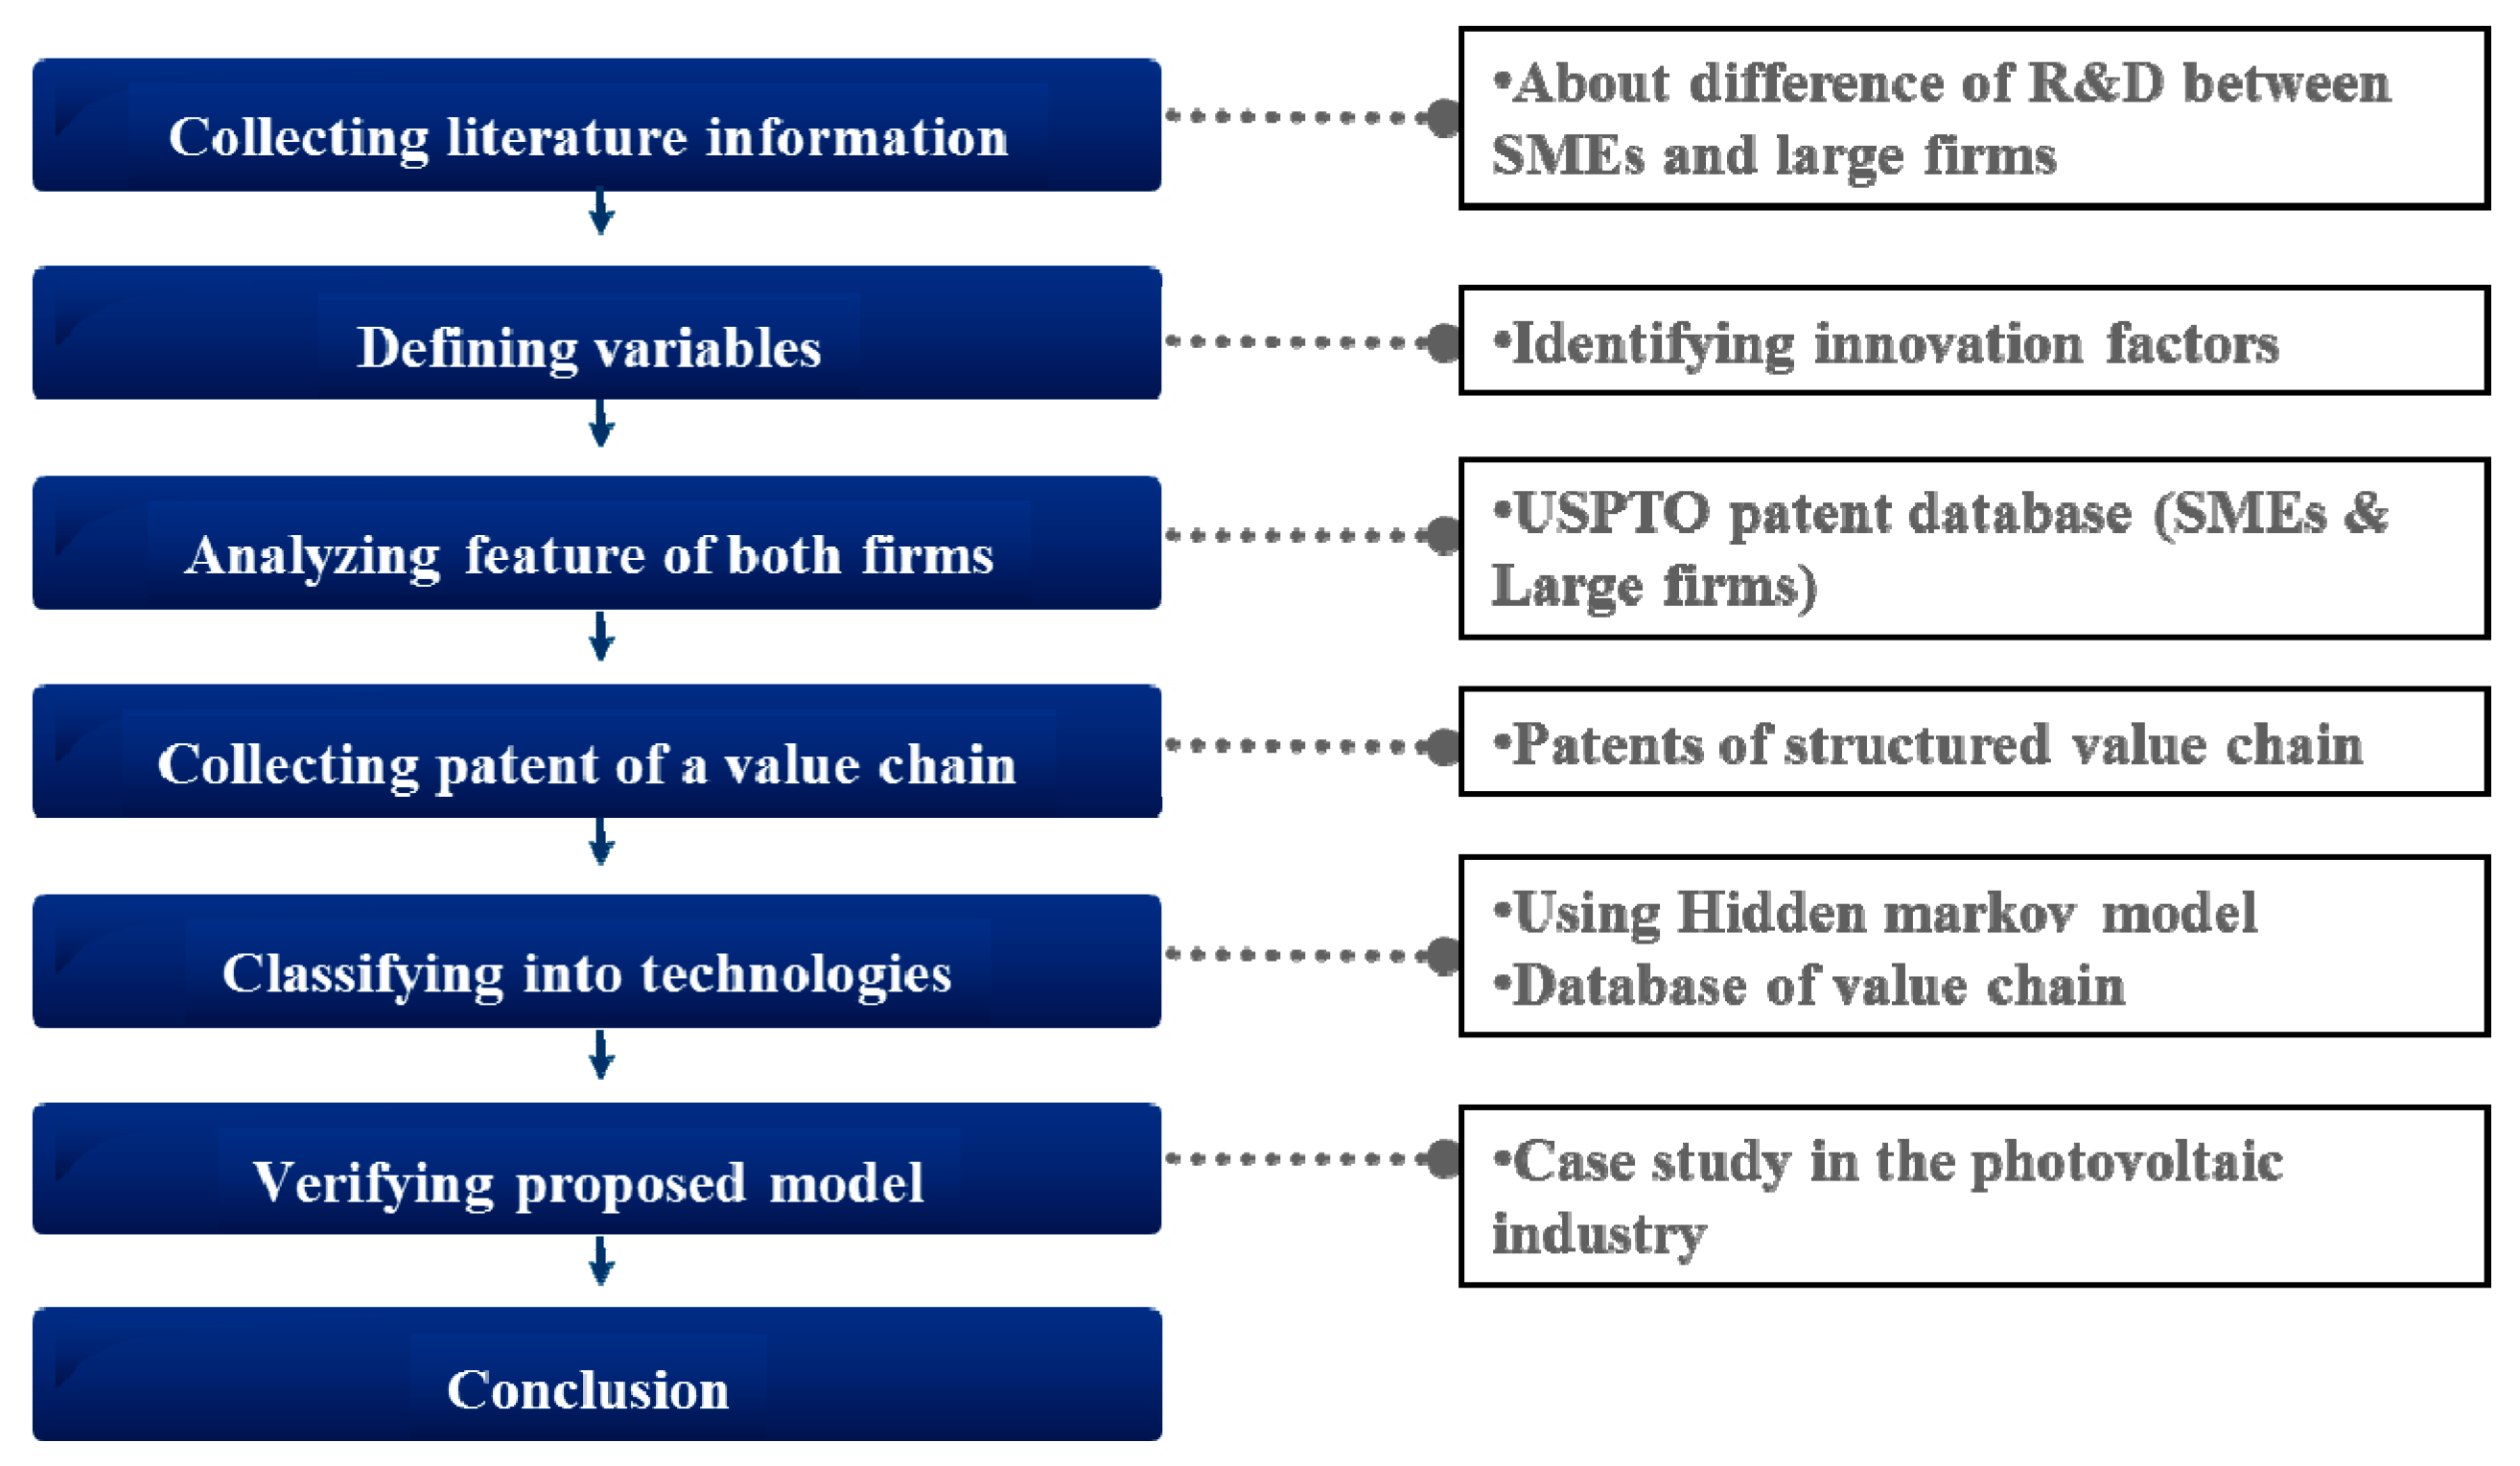
To overcome these limitations, this paper aims to propose a method for identifying SME-suitable technology in a win-win innovation for SMEs and large firms through empirical analysis. To accomplish this, this research first identifies the types of enterprises and constructs a value chain model using patent data in the United States Patent and Trademark Office (USPTO) and descriptive statistics of enterprises. Second, the collected data of technology and value chain is analyzed using the Hidden Markov Model (HMM). Finally, all technologies in a value chain are classified into two areas (large firms and SMEs), determining the field of technology that is well fitted for core competence of SMEs. From the results of this paper, useful implications can be offered for managers in the R&D collaboration, as well as for policy makers. It is understood that using objective data and methodology can extract a competitive advantage on technology sectors of SMEs from a neutral standpoint without political bias.
The remainder of this paper is structured as follows. In
Section 2, the theoretical background behind the promising fields for the small business, called an SME-suitable area in this research, and a win-win cooperation strategy between SMEs and large firms is described.
Section 3 explains the methodological aspects of this study for empirical analysis. In
Section 4, the results and implications of the statistical analysis are discussed. The concluding remarks and future research are presented in
Section 5.
4. Case Study
4.1. Background
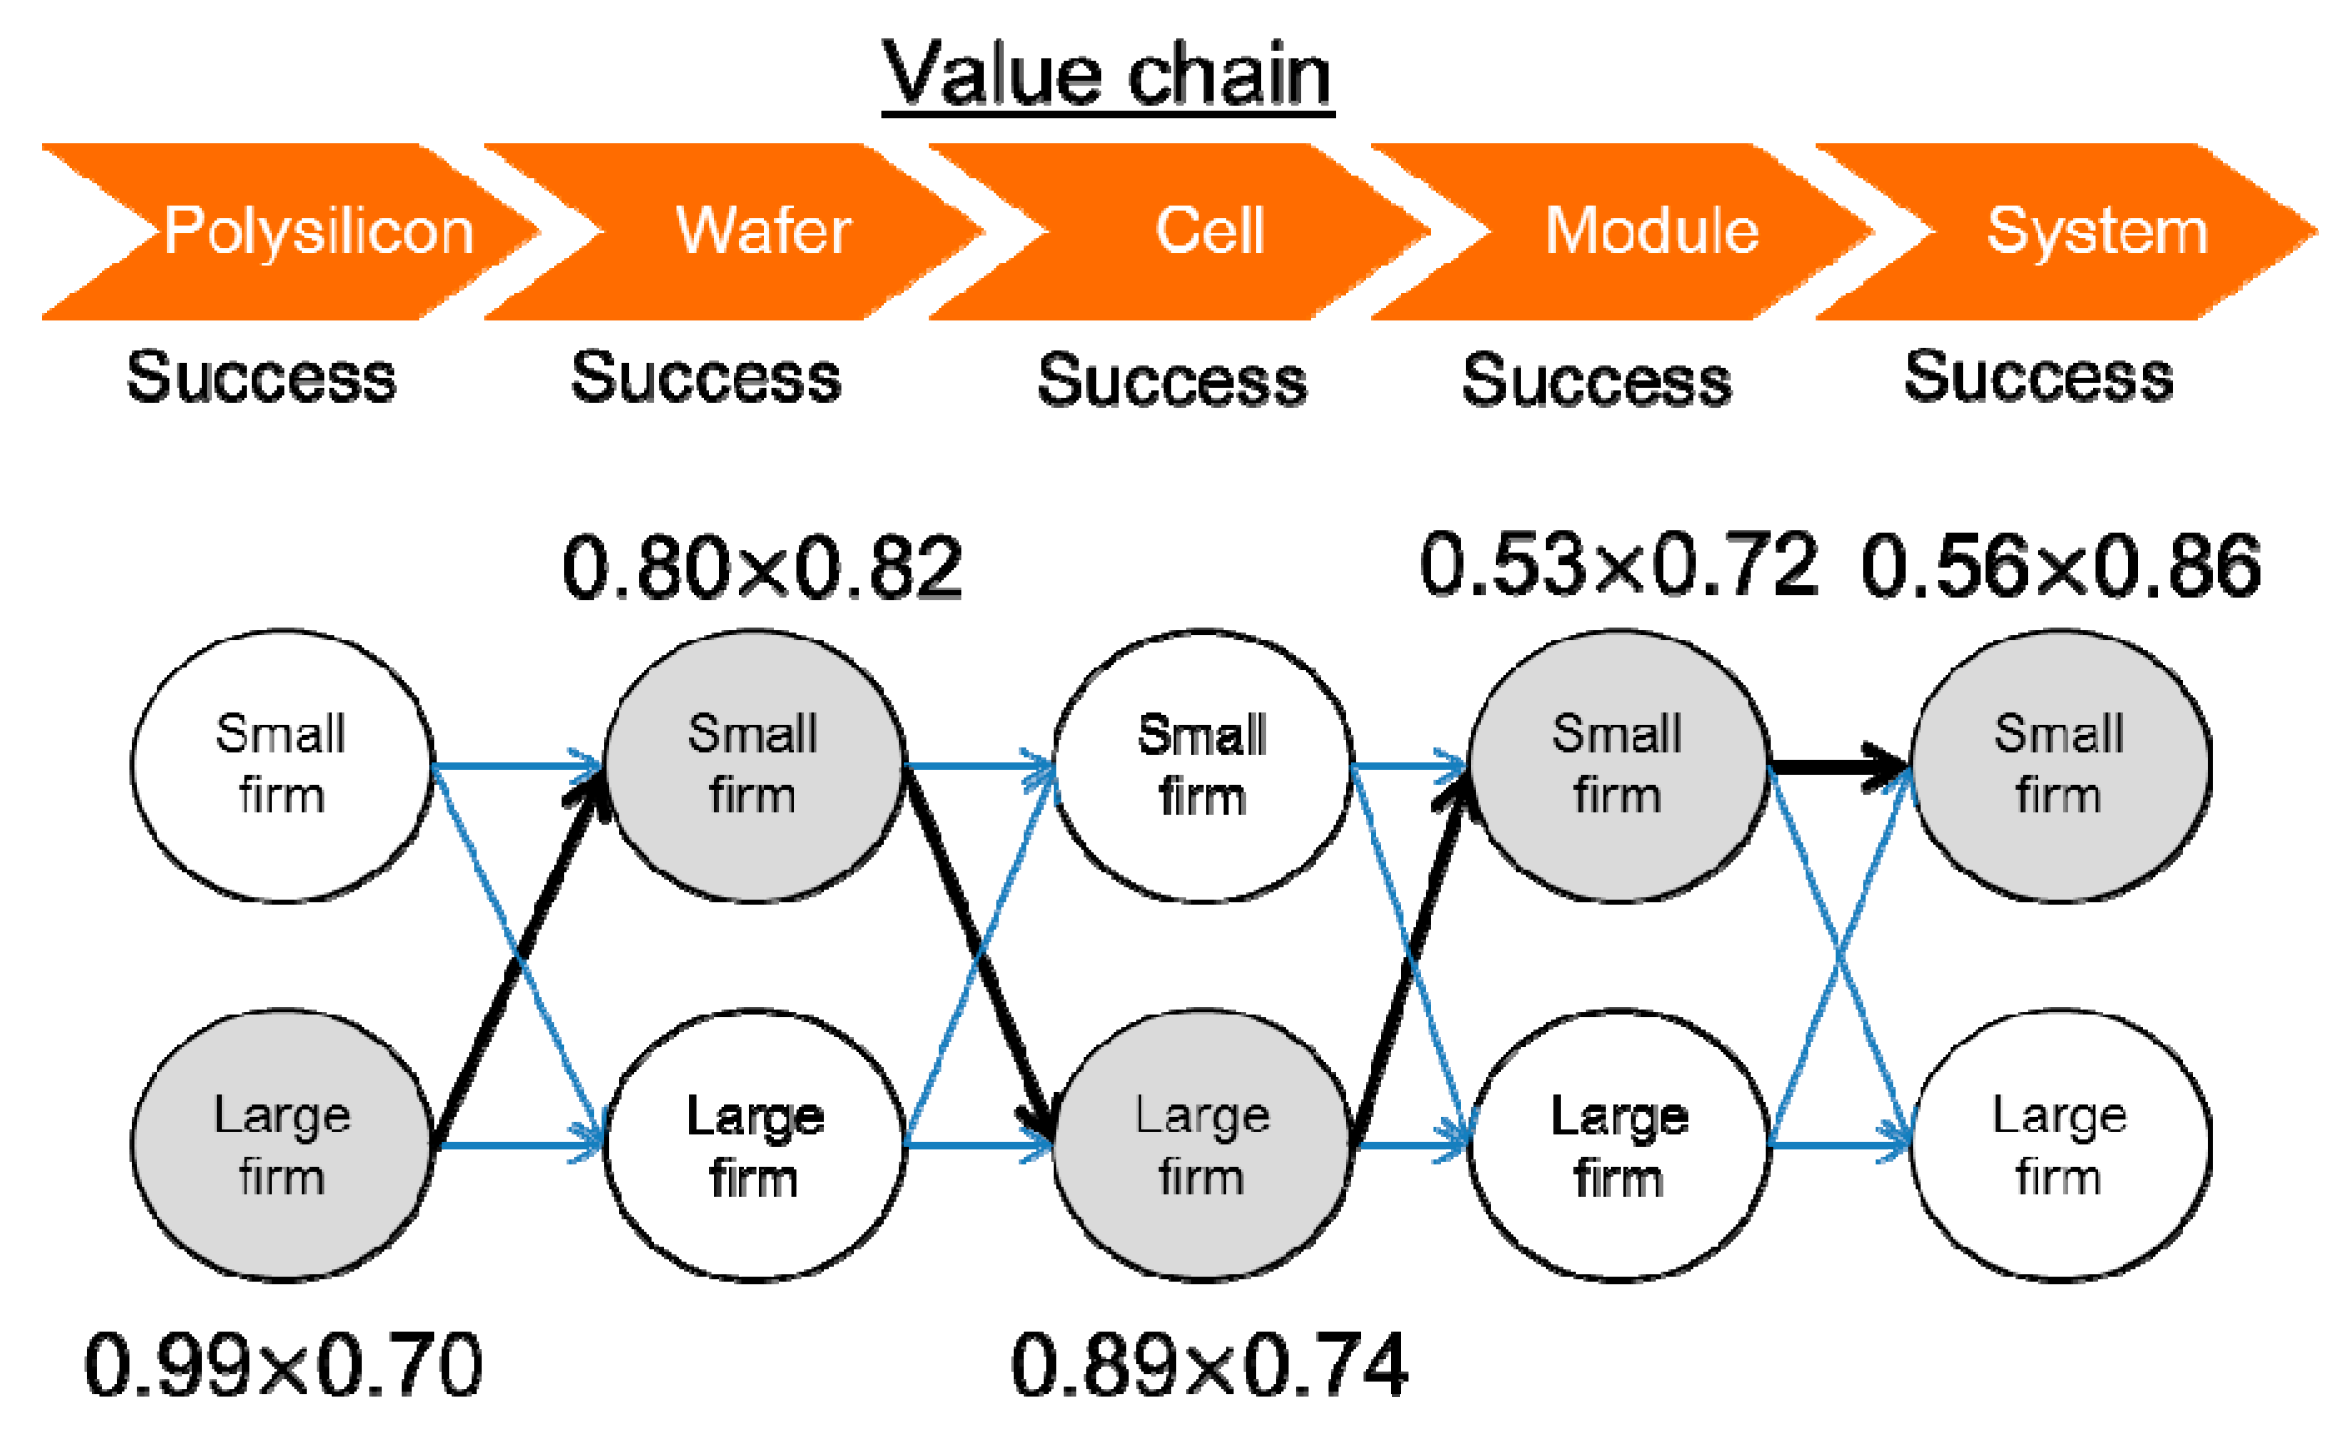
The types of manufactured solar cells include thin film type and crystal type; especially, the crystal type represents 80% of the world market. The value chain of the solar cell for the crystal type consists of five technologies: (1) material (polysilicon), (2) components (wafer), (3) cell, (4) module, and (5) system, as shown in
Figure 6. The thin film type has easier manufacturing processes than the crystal type and it involves only one procedure, apart from making the material.
The value chain of the crystal solar cell has more complex processes than the thin film type and is used in various industries. Upstream groups include the polysilicon and wafer and downstream groups include the cell, module, and system. In particular, upstream groups require detailed technology capability and have a severe entry barrier because of the high investment cost in facilities, while it can involve a high operating income. The ratio of SMEs producing copper indium selenide (CIS) thin film solar cell systems is (50%) in the first item (end goods), board (0%), CIS thin film solar cell module (10%), and power converter (48%) in the second item, process equipment for the solar cell (63%), process material for the solar cell (10%), and equipment for modular (100%), and modular material and components (33%) in the value chain of thin film type. These percentages are based on the volume of manufacture and the ratio of SMEs is similar to that of large firms. Especially, small firms produce 100% of equipment for modular systems and large and small firms manufacture 50%. This means that SMEs are in the competition with large firms in this industry, and it is important to detect SME-suitable technology for training small firms.
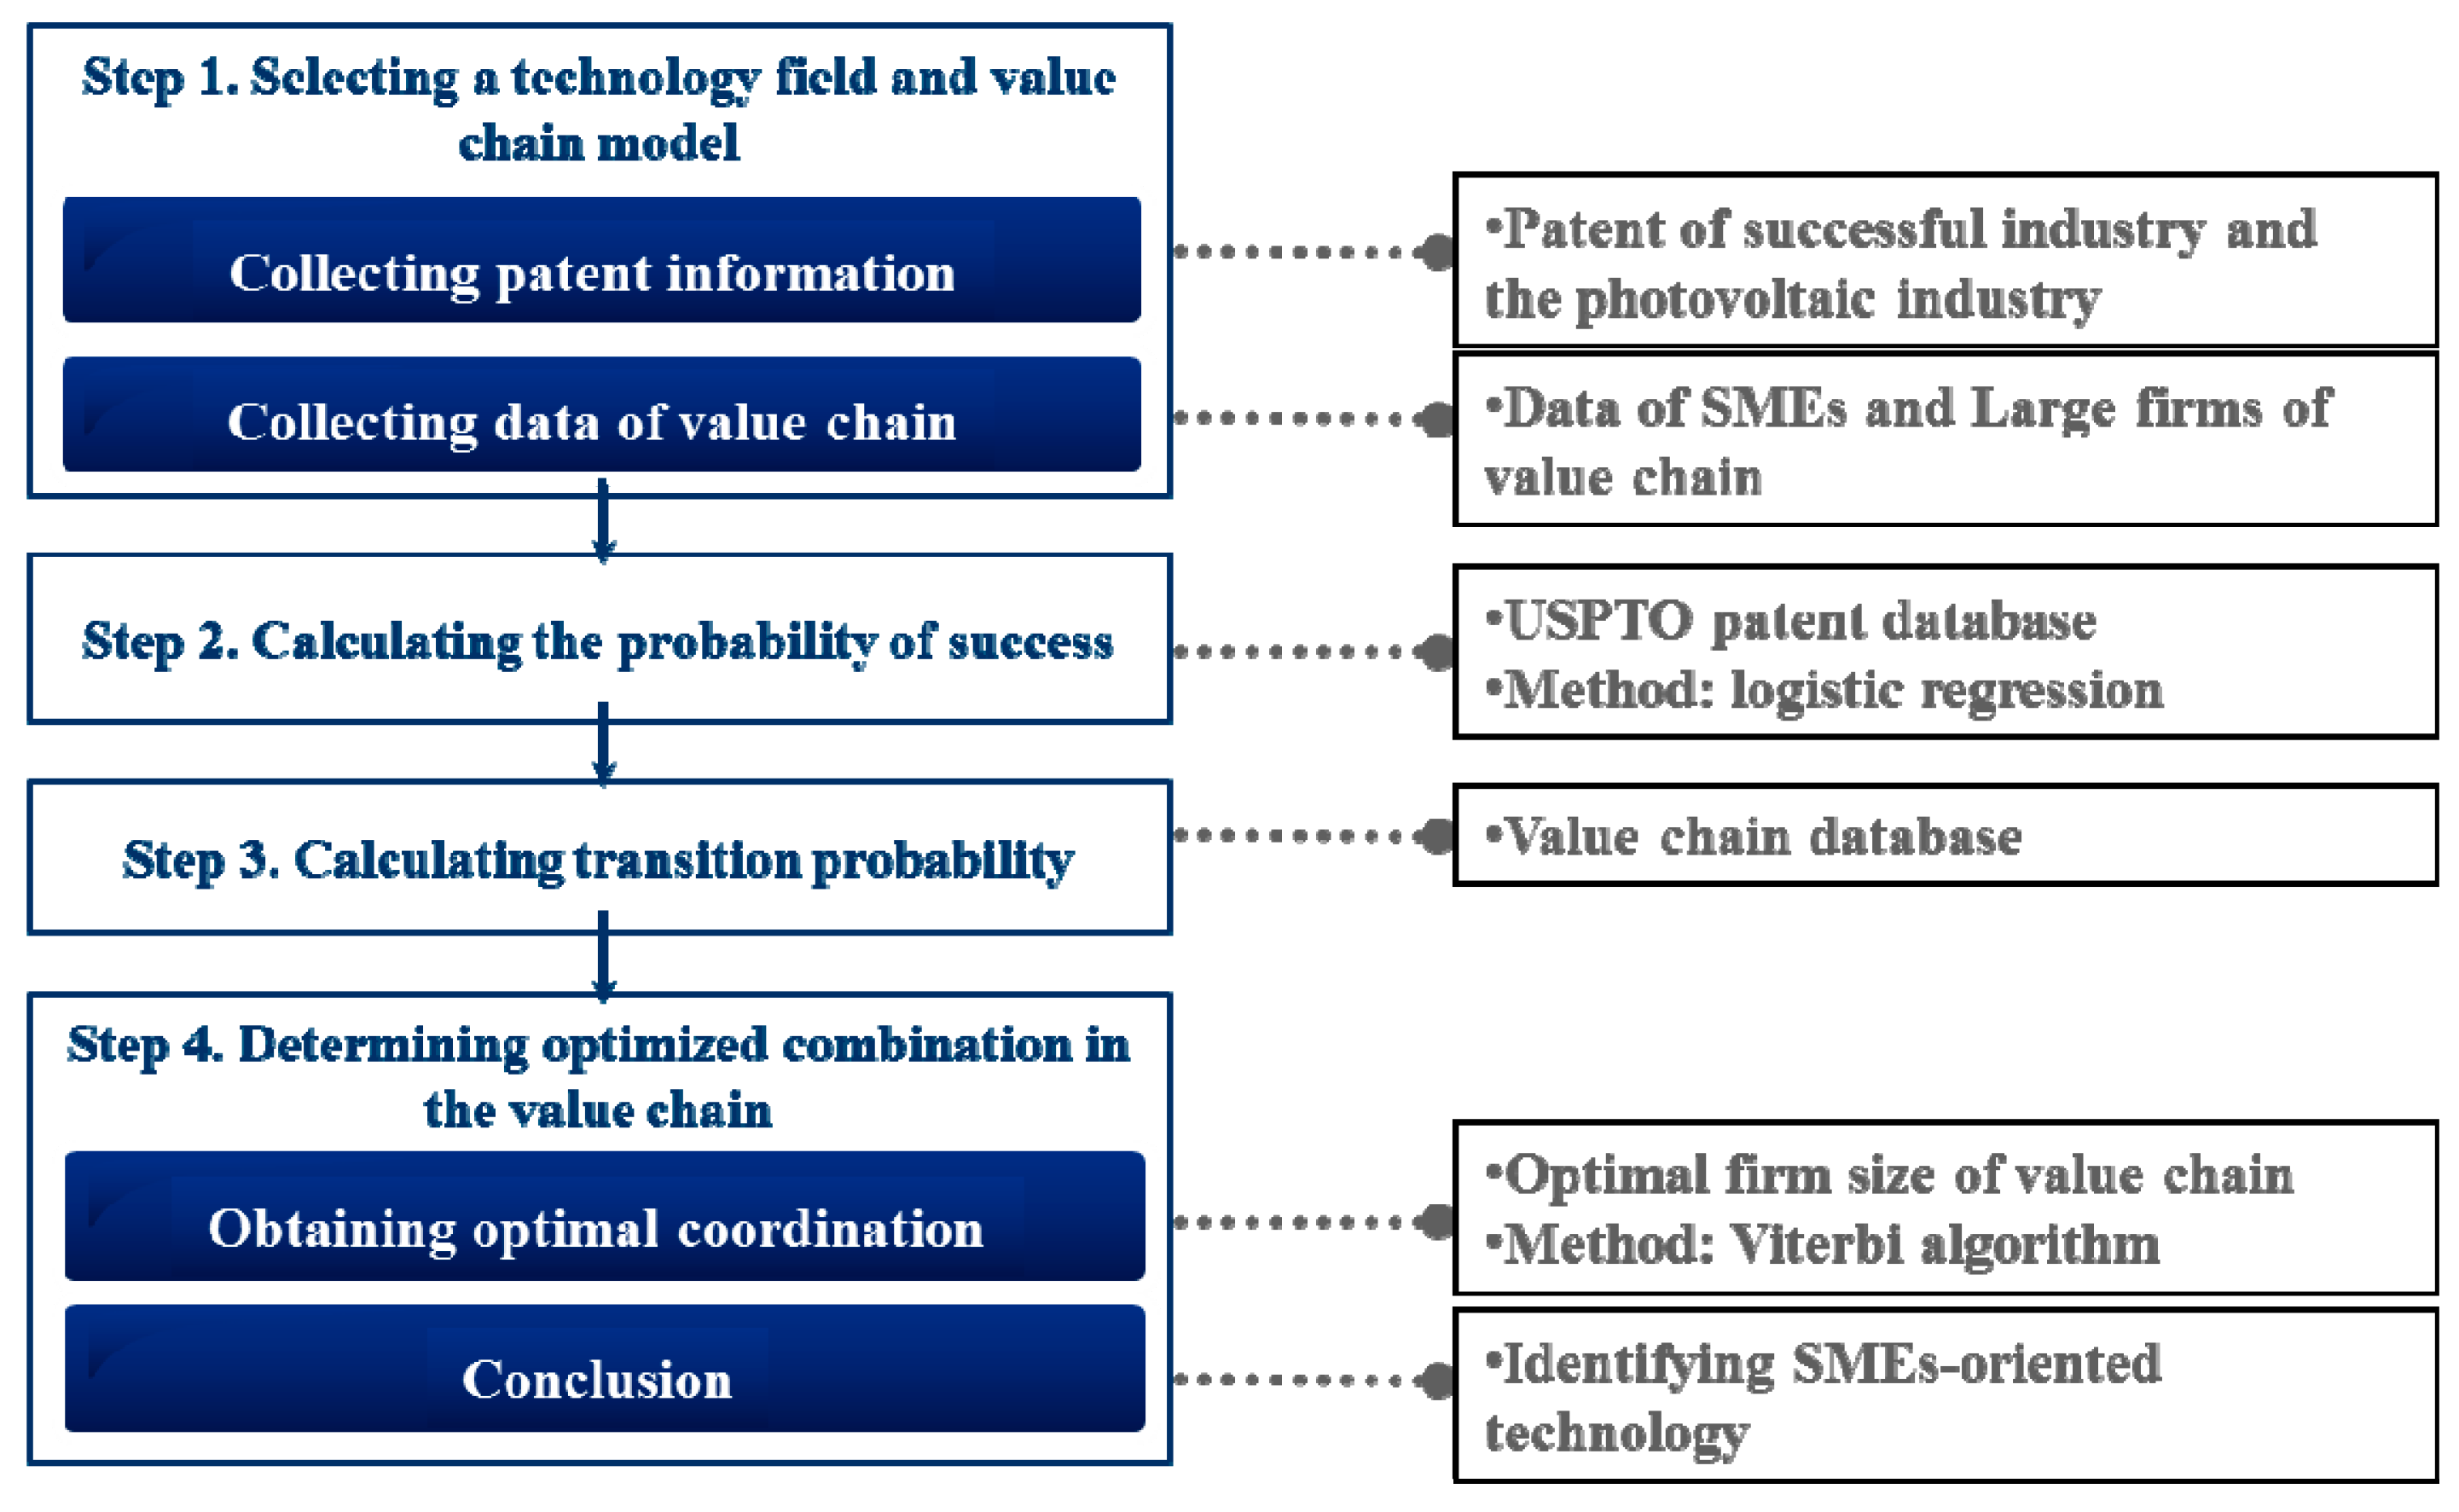
4.2. Step 1. Selecting a Technology Field and Value Chain Model
In this study, the solar cell industry was selected as a case study and information was collected from the value chain in series. This case is based on the solar photovoltaic industry, including five technologies: polysilicon, wafer, cell, module, and system. The case is suitable for analysis because the solar photovoltaic industry is a key emerging industry, as it provides energy that is clean, safe, convenient, and highly efficient. In addition, large and small firms exist in all value chains and intense competition between firms is shown in some technologies.
The search keywords for solar photovoltaic technology are based on the analysis of the patent-based technology of report-alternative energy. If the applicant has more than 500 employees, their company is classified as a large firm. This study examines a number of granted patents in large or small firms using quantitative analysis and citation analysis is used in terms of qualitative analysis.
4.3. Step 2. Calculating the Probability of Success
The data include patent portfolios of 80 firms in the USPTO database, 40 of which are successful firms and 40 are unsuccessful firms. The successful firm refers to a company that is 1st to 2nd market share in each field of the world and has R&D activities for more than 15 years until over 2010 years to identify innovative SMEs. In order to distinguish between successful firms and unsuccessful firms, the successful SMEs were selected by domain experts and patent analysis to define duration of R&D activities. In addition, the unsuccessful companies have relatively low global market share in the same type of IPC code, and a short period of R&D activities. For example, Baader, a successful company, applied the first patents in 1974 and the final application in 2011 at the area of cutting fish (IPC code = A22C – 025/16), and has 35 years in innovation. Meanwhile, Systemate Holland has patent applications from 1984 to 1999, and is currently defined as an unsuccessful corporation in this study. For another example, Gallagher is a successful firm and Dare Products is an unsuccessful firm in the electric fence manufacturing industry. This is because Dare Products have not undertaken R&D activity since 1988 and Gallagher has performed R&D activities since 1983, for more than 20 years. The descriptive statistic and correlation matrix for our criterion is shown in
Table 2.
Prior to conducting a logistic regression, the tolerance was used to examine the correlation analysis between independent variables to measure multicollinearity. High multicollinearity refers to a problem that causes the coefficients to be unreliable in the regression analysis, since the relationship between the input variables exists and the variance of regression coefficients increases. As a result, the tolerance was found to be higher than 0.8 in the maximum 1 value and the multicollinearity was low. The results of logistic regression are shown in
Table 3. Model 1 in
Table 3 is the baseline model with only control variables and Model 2 adds independent variables to the analysis. The variables are significant for success of the company and while BCI, CRP, and TCT have a positive effect on the dependent variable, CII appears to have a negative impact. From the results of logistic regression, the probability of success formula is measured.
Applying the formula to the solar photovoltaic industry, the data include 6018 patents in the USPTO dataset. The probability of success in the value chain is identified in
Table 4.
4.4. Step 3. Calculating Transition Probability
One hundred and twenty-four cases of value chains were collected by searching information on materials and contracts in reports and news. For example, the first case of small enterprises is in all of the value chains and the second case consists of large firms in polysilicon and cell manufacturing.
The results of transition probability are explained below. Initially, small companies moved 1% to polysilicon while major companies had a 99% difference. This means that the technology of polysilicon is monopolized by major companies, rendering access by small companies challenging. The probability of transition from polysilicon to wafer shows that 80% of major companies manufacturing polysilicon deal with small companies in wafer manufacturing, while 20% of major companies deal with major companies of wafer manufacturing. This demonstrates that small companies have access to wafer technology and that they have developed sufficient techniques to run their business. Meanwhile, small and large companies of wafer technology deal with major companies of cell technology, each comprising 89% and 92%. While cell technology can be judged as a difficult field for small companies without large capital, small companies need to identify success probability using the data. The probability of cooperation between major cell companies and small companies possessing module technology is 53%. In addition, the probability of cooperation between major companies, each possessing cell and module technology, is 47%. Considering that most of the cell technologies are owned by major companies, almost half of the cooperation in the module is performed between small companies and major companies. At this point, this statistic cannot be used to determine whether small or major companies have strengths in the module fields; in order to examine success probability further, finding and selecting proper fields is necessary. Finally, the cooperative probability between small companies of module fields and system fields is 56% and the probability for cooperation between major companies of module fields and major companies of system fields is also 50%. As well as module fields, system fields need additional analysis to determine the size of company that is apt to develop this type of technology.
4.5. Step 4. Determining Optimized Combination in the Value Chain
The best combination is large–small–large–small–small and the optimal arrangement is wafer, module, and system technologies that are appropriate for SMEs to support R&D as shown in
Figure 7. The technological success probability for a major company in the polysilicon field is 70% and the transition probability is 99%. Thus, we can say that major companies that are currently monopolizing the value chain are fit for approaching this technology. Overall, transition probability for small companies in wafer technology is 80% and success probability is 82%. Thus, in terms of technological consideration and current businesses, it seems that small companies are suitable to follow this field. Since major companies in cell fields have 89% of transition probability and 74% of success probability, major companies seem more appropriate than small firms. In module fields, the transition probability of small companies is 53% and the probability of transition to major companies is also 47%, making a 50 to 50 situation. However, the technological skills of small companies are 72% higher than those of major companies, which makes it probable for small corporates to lead technology successfully in the module industry. Lastly, in system fields, similar to module fields, the transition probability for small companies is 56%, while the success probability is 86%; thus, it seems that SMEs are fit to survive the system fields.
5. Results and Discussion
Depending on the complexity of technology, role allocation and strategic collaboration are important to improve the coexistence between large and small firms. This study shows the SME-suitable technology in the solar industry, including the manufacturing of wafers, modules, and systems. Otherwise, large firms are suitable for developing the technology of polysilicon and cells, of which SMEs find it difficult to enter. The selected optimal arrangement has a high impact of transition probability because of the probability gap. The sum of transition probability regardless of prior state is shown in
Table 5. The transition probabilities of SMEs is 180%, 122%, and 106% for wafer, module, and system technology, respectively, which are higher than the transition probabilities of large firms of 20%, 78%, and 94%, respectively.
However, in technology within similar transition probability of such a system, it is confirmed that the appropriate company type for corresponding technology is different, depending on the observation probability. In
Table 6, rankings 1 through 6 are all large firms in polysilicon and cell manufacturing because these companies produce these items already. This means that, in this technology, it is difficult to enter a new market according to the minimum efficient scale. The minimum efficient scale is the level of minimum costs for entry to a new market. Thus, low minimum efficient scale in a technology field means that SMEs can enter easily in the field. Even if SMEs produce most of the wafers, the entry of large companies needs to be regulated in order to protect SMEs because the minimum efficient scale is low. Otherwise, module and system manufacturing are in competition because the capability of SMEs is similar to large firms’ technology in modules and systems. If a government establishes a policy to support SMEs, it is necessary to encourage firms to manufacture modules and systems to improve their advantage.
6. Conclusions
This study tackles suggesting a methodology and measureable factors to determine the appropriate SME-suitable technology. In order to overcome the limitations of prior research, in which the opinions of experts were employed, it is more reasonable to use patent information and the HMM. To calculate transition probability, the information for the value chain is collected and logistic regression is used to measure the coefficient of observation probability in components of HMM. This study differs from previous research in reflecting reality using value chain analysis. In the last step, this paper verified the proposed method by applying it to technologies related to solar cells. The proposed method would show remarkable performance to identify appropriate technologies in the framework of R&D ambidexterity, technology and commercialization. The findings suggest that some technologies—wafer, module, and system—in the solar industry are SME-suitable technology from the case study. In the case of technology in the field of system, large companies and SMEs have a similar probability of success. From these results, SMEs can compete successfully with large enterprises by developing their technology in specific fields.
Despite several contributions, this research has some limitations. First, even though many types of companies were examined, firm size is considered as a factor for classification. Second, this study did not detect detailed technology because the parallel value chain was not considered. This is because the value chain, consisting of primary, secondary, third steps, etc., needs not only one technology but also two or more technologies at each step concurrently. For example, in the case of a value chain for a thin film solar cell, the end goods are copper indium gallium selenide (CIGS) thin film solar cell systems, and it requires equipment and material for modularization as well as for the solar cell in the previous step, having a parallel relation. Third, there is a lack of more reasonable variables in logistic regression, and it is difficult to determine whether or not the assignee is an SME.
Even though this research has some limitations, it also makes key contributions to support strategic decision-making for large and small firms. This research helps strategic businesses of SMEs and government policy by discovering the appropriate technology for SMEs. In addition, in previous study, SME-suitable industries were selected utilizing a survey method, which is limited by a lack of objectivity. However, this research uses the value chain and the SMEs’ relative technological competitiveness over large firms by patent analysis to overcome the aforementioned limitations. To promote the selected SME-suitable technology, considerable assistance is necessary in developing a sound corporate ecosystem and a win-win company culture. Since the concept of competition changes from inter-enterprise competition to inter-network competition, the SME-suitable technology simultaneously increases the large firm’s competitiveness by improving small business.


