1. Introduction
As the global concern about environmental care increases, countries are led to seek sustainable growth in their economies, for it is a widely acknowledged fact that the use of renewable energy sources plays an important role in this process. Indeed, these sources are the fastest-growing ones in the electricity sector, with expectations of a 2.9% per year increase between 2012 and 2040 [
1]. Brazil is one of the major renewable electricity producers and 74.6% of its domestic electricity supply was provided by renewable sources, mostly from hydropower plants, in 2014 [
2]. Nonetheless, some of the country’s states do not own such a clean energy mix.
Despite having the second greatest Gross Domestic Product (GDP)and the third largest population among the Brazilian States [
3,
4], Rio de Janeiro had only 19.67% of its installed electric power supplied by renewable sources in 2015 [
5]. With the aim of adapting its energy grid to international standards, the state established some goals, including the increase of 40% in the generation of clean or low carbon energy with an emphasis on photovoltaic energy, from 2010 to 2030. Furthermore, since 2008, for each new fossil thermal plant installed in the state, a percentage of its power has been compulsorily invested in energy efficiency and renewable energy sources.
However, integrating solar, hydro, and wind energy into a traditional power-system—designed to operate with a constant electricity input—is not simple, as those sources depend on weather conditions and may vary significantly over a monthly, daily, and even hourly scale, which requires system operators to be flexible, so as to have a reliable energy supply and controlled energy costs [
6,
7].
To mitigate the impacts of this variability, Ref. [
7] suggest some options such as interconnecting grid systems, storing energy, and assessing complementarity between renewable energy sources. In fact, the last one supports the decision-making process of the first two options, as it evaluates whether two or more renewable resources are able to compensate the variability of each other, in spite of the former belief that fossil-fuel plants were vital to enable the use of intermittent and unpredictable renewable technologies [
8,
9].
Diverse methodologies can be chosen to conduct a complementarity study, according to the power-system design and to the study context and objectives [
6]. In general, authors apply a statistical analysis—such as Pearson correlation coefficient [
8,
10,
11,
12,
13], graphical analysis [
6,
8,
11,
12], cross-correlation analysis [
14], coherence analysis [
10], Spearman correlation coefficient [
13]—and/or a method to minimize functions, e.g., storage costs and mismatch energy [
11,
15] or the standard deviation of the renewable mix generation [
8].
Those studies have been carried out for different countries and energy sources. For example, Ref. [
7] analyzed the complementarity of wind, photovoltaic, and hydro energy in Portugal, Ref. [
11] focused on small hydropower plants and photovoltaic generation in Italy, Refs. [
8,
16] assessed solar and wind resources in the United Kingdom and China, respectively, and Ref. [
15] sought an optimal mix of photovoltaic and wind energy for the whole continent of Europe. In Brazil, Ref. [
14] evaluated the correlation between wind speeds and solar radiation in Fernando de Noronha Archipelago, Ref. [
10] studied the relationship between hydropower generation and offshore wind potential for the country, and Ref. [
13] considered hydro and onshore wind in their analysis. No study focusing on Rio de Janeiro State was found.
Given Rio de Janeiro’s plans for increasing its renewable generation and, on the other hand, the lack of complementarity studies for the state, such an analysis is relevant in order to support this ambitious agenda that targets an optimized energy mix. Therefore, the aim of this paper is to assess the complementarity of hydro, wind, and photovoltaic (PV) energy—the intermittent sources included in the state’s goals—in Rio de Janeiro.
2. Rio de Janeiro’s Context
Currently, more than 95% of the electricity generation capacity of Rio de Janeiro is composed of fossil fuel, nuclear, and large hydroelectric power plants. There is only one wind farm installed in the state and there are two biomass generators (fueled by sugarcane bagasse and charcoal) and several small hydropower plants (SHP). All solar power generation comes from distributed generation—PV panels located in residences or commercial buildings that send overproduced energy to the grid.
Table 1 presents the contribution of each source to the energy mix.
The costs of electricity generation for different sources in Brazil were summarized by [
19], based on 2005–2015 average fixed costs and on variable costs from March 2015. According to them, hydro generation had the lowest costs, followed by wind, small hydro, nuclear, solar, and thermal (coal, sugarcane refuse, wood residues, other biomass sources, natural gas, fuel oil and diesel) energy [
19].
It has been estimated that 54% of Rio de Janeiro’s hydroelectric potential is not being used yet, which corresponds to 0.912 GW [
20]. Although large hydro generation was considered the least expensive, the environmental and social impacts associated with it, mainly during the power plant construction, turn it into a less-desirable renewable energy source. In contrast, as SHPs have much smaller reservoirs or even do not need them, they have been receiving more investment in the last years. The state’s estimated wind potential is 0.746 GW, considering minimum wind speeds of 7 m/s, but if wind speeds greater than 6.5 m/s are exploited, it increases to 1.956 GW [
21]. The photovoltaic residential potential was assessed at 2.685 GW in the state [
22].
3. Power Modelling
It was not possible to use electricity generation time series from existing power plants, for there is no historical record of PV generation in Rio de Janeiro and, although there are available data of six SHPs and the wind farm located in the state, their series have a monthly resolution, thus not enabling hourly or daily analysis. Alternatively, the power output can be approached through wind speed, solar radiation, and river flow time series. However, choosing specific technologies for generating energy (e.g., a PV panel model or a turbine’s manufacturer) could restrict the results to those options, creating a technological frontier.
For this reason, it was assumed that, as the essential point is how power varies with time and not its scale (absolute values), it is enough to consider only the non-constant variables that affect the power generation for each source. For the optimization process, those values were normalized to become dimensionless and comparable.
3.1. Wind Energy
A wind turbine with A
w rotor swept area extracts a P
w power from wind according to Equation (1) [
23].
where C
p is an efficiency factor,
ρw is the air density at site, and v is the wind speed. The air density, the efficiency and the area A
w, which depends on the equipment design, can be considered constant for the same installation in a fixed site [
6]. For this reason, the power of a wind turbine may be expressed as
where K
1 is a constant given by the product
C
pρwA
w.
The wind speed v must be measured at the rotor height (h), but if the available data were collected at a different altitude (h
0), Ref. [
6] shows that the wanted velocity (v) can be approximated as the product of a constant and the known velocity (v
0), not changing the Equation (2) sense.
3.2. Hydro Energy
The expression of a watercourse power, P
h, is deducted from Bernoulli’s Equation and is given by [
24]:
where
ρh is the water density, g is the gravitational acceleration, h is the utilizable head and Q is the water flow rate. The
ρhg product is the specific weight of water, which depends on the water temperature, but varies very little over the temperature range that a watercourse usually presents and is approximately constant [
25]. For complementarity studies, the head h can be considered constant, especially because SHP plants have a small or even null water storage capacity [
12,
13,
26]. Consequently, the product
ρhgh can be understood as a constant (K
h) and the Equation (3) can be rewritten as
3.3. Photovoltaic Energy
A PV panel with area A generates power (P
pv) according to [
6]
where η is the total system efficiency and R
s is the incident solar radiation. The efficiency is affected by the panel temperature [
24] and its influence depends on each cell material and on the system organization [
27]. However, it can be assumed that η does not vary too much and is a constant [
6]. As the area has a fixed value, Equation (5) is reduced to
where K
pv is a constant.
From Equations (2), (4) and (6) it can be inferred that, to understand the behavior of wind, hydro and PV power, one only has to analyze series of the cube of the wind velocity (pw), of river flows (ph), and of solar radiation (ppv), respectively. Those simplified series will be represented by lower-case letters: pw, ph, ppv.
4. Database
The National Institute for Space Research (Instituto Nacional de Pesquisas Espaciais—INPE) [
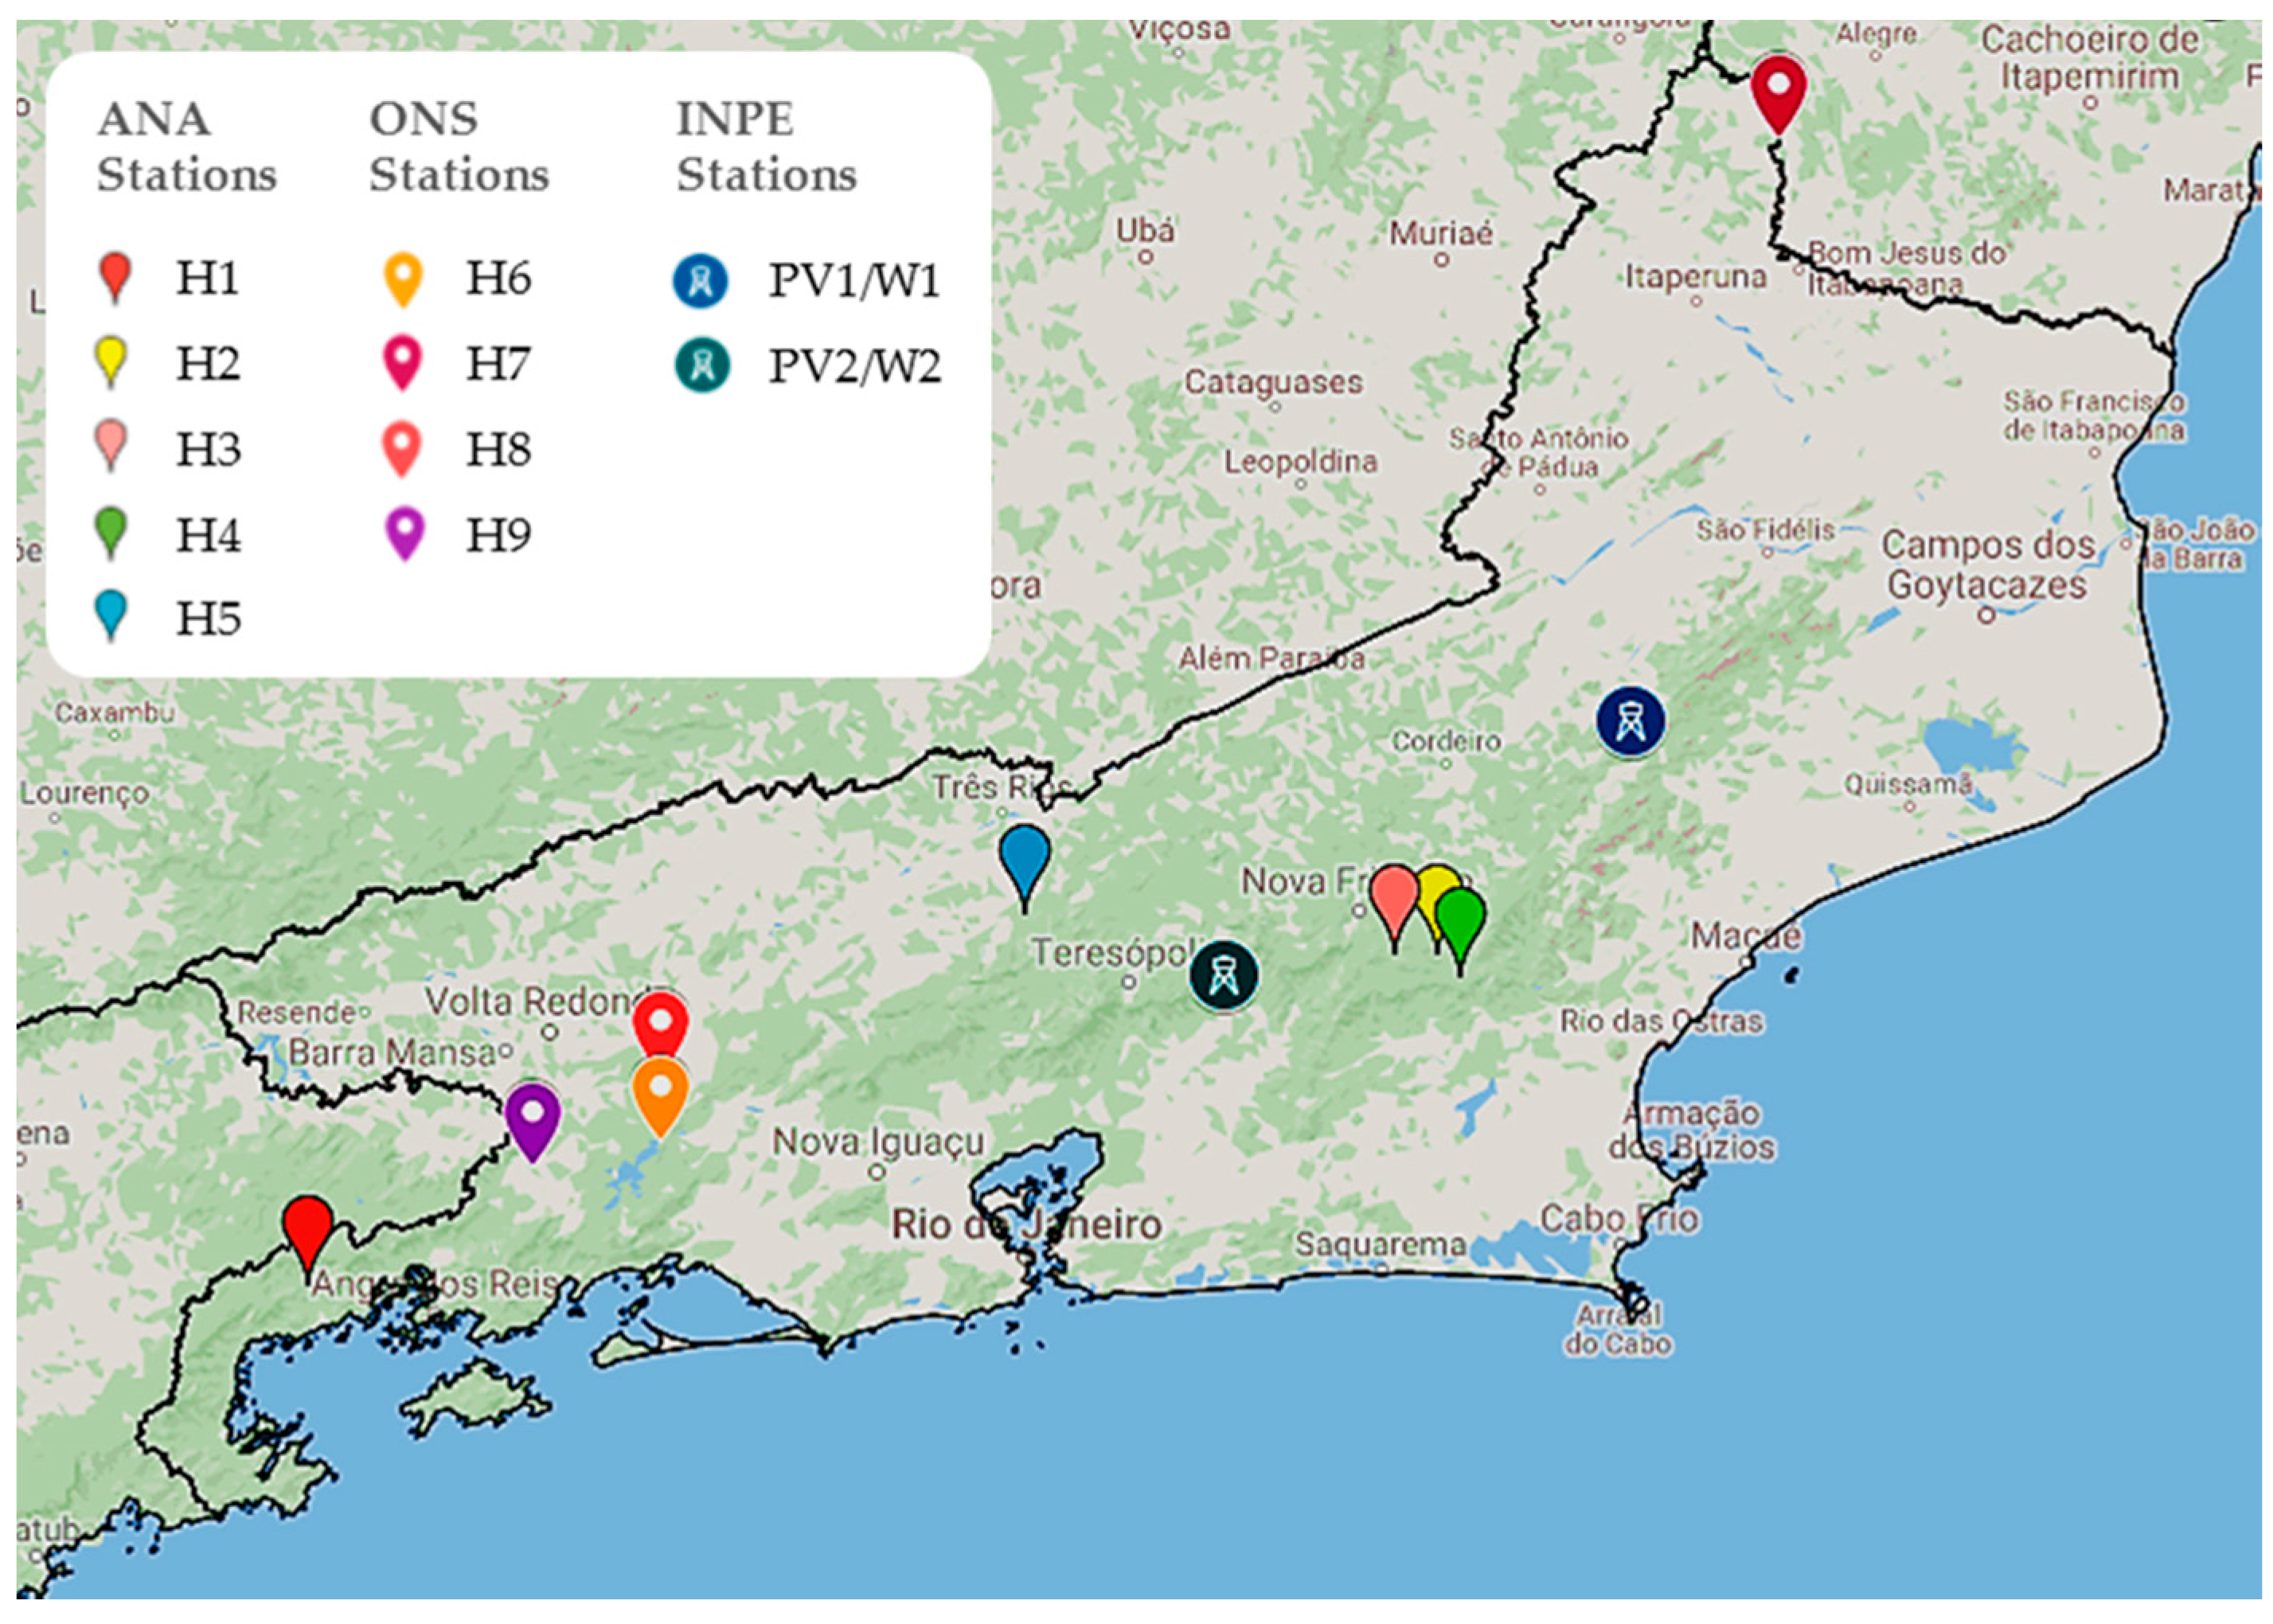
28] provides series of wind speeds and global solar radiation from thirteen measuring stations in the state, but most of them present too many missing data and, for this reason, only two stations were selected. In each series, observations were made at a rate of eight per day, from 2008 to 2014.
The National Water Agency (Agência Nacional de Águas—ANA) [
29] measures river flow throughout the country. However, these data receive no treatment and the rivers’ natural behavior might be influenced by dams. Thus, rivers with large hydropower plants or series with numerous missing data were not taken into account. Five stations in the state with daily measurements have been used in this paper. Moreover, the Brazilian Power System Operator (Operador Nacional do Sistema Elétrico—ONS) [
30] also provides river flow measurements at reservoirs, and the collected data, besides being quite complete, are treated in order to remove the effect of upstream installations, evaporation at the reservoirs, and consumptive use of water in the basin. Therefore, rivers with only large hydropower plants installed were avoided as they would probably not be chosen to receive a SHP project. Four stations with daily measurements from three different rivers were taken from ONS database. The same period of wind and solar data (2008–2014) was available for all river flow series.
With regard to missing data, the solar radiation series were 99.51% and 99.24% complete, the wind ones were 98.58% and 98.03% complete, and eight from the nine river flow series were 100% complete, while the ninth was 99.7% complete. Radiation missing data were replaced by the mean between the same hour observations from the previous and the subsequent days and, when it was not possible to apply this procedure, the month average for that hour was used. Wind speed missing data were replaced by the mean between the previous and subsequent observations in the same day and, if there was two missing data in sequence, the month average for each hour was applied. River flow missing data were replaced by the month average value.
Figure 1 shows Rio de Janeiro State map, in Southeastern Brazil, and the geographical location of all considered stations. More information about used data is available at
Appendix A.
5. Results and Discussion
5.1. Linear Correlation
The Pearson correlation coefficient was chosen to this work because it is an important statistical tool and has been successfully applied in several complementarity studies, such as [
8,
10,
11,
12,
13]. Furthermore, as it is based on data covariance and standard-deviation, it can be easily implemented.
The authors of [
10] affirm that “different energy sources can be considered complementary if their variability is uncorrelated, or negatively correlated in time”. That is because opposite or independent behaviors can be joined in order to achieve better results. The Pearson correlation coefficient was calculated for the p
h, p
w, and p
pv series from 1 January 2008 to 31 December 2014.
River flow data have a daily resolution, while wind and radiation measurements have a three hour interval. Therefore, the correlation analysis was divided in two steps: an hourly wind–PV evaluation and, after calculating daily average values for wind and solar radiation series, a daily wind–PV–hydro assessment was conducted.
Table 2 presents the Pearson correlation coefficients between p
w and p
pv at an hourly basis.
While the two PV stations have a strong positive correlation (0.849), the two wind series presented a very weak correlation (0.184). It suggests a larger geographical variability of wind speeds and perhaps a spatial complementarity—the same source could complement itself when installed in different sites—which was not detected in this case, but could happen between other locations of the state. In fact, the assessment of Rio de Janeiro’s wind potential showed that wind speed magnitude varies throughout the state, as well as the shape parameters of the Weibull distribution connected to them for each season [
21]. The PV–wind coefficients indicate weak positive correlation, which does not indicate hourly complementarity of the resources at the considered locations.
The daily analysis is presented by
Table 3. The grey cells correspond to results considered nulls by significance tests.
The weak and null correlations between hydro and PV series indicate they might be complementary. The wind–PV relation has changed and there is a possibility of one of the wind series complementing PV generation. Some rivers may also complement wind generation, especially H5 and H7.
5.2. Verification
It should be noted that in this study it is assumed that the theoretical power plants would convert energy with any value of solar radiation, river flow and wind speed. In reality, the generators have a maximal capacity restrained by the nominal power, besides a minimum capacity defined by the used technology—such as cut in speed for wind turbines—or by other restrictions, including the environmental flow that must be respected by hydropower plants.
To verify the suitability of the simplified series, p
w and p
h, they were compared to the available monthly generation data from the six SHPs and the wind farm, which take part on the Program of Encouraging Alternative Sources of Electrical Energy (Proinfa) [
31], from Brazil. First, the generation series were divided by the number of hours of each month in order to obtain the monthly power. Second, the daily average power for each month was calculated through dividing the monthly power by the number of days of the respective month. Next, the monthly mean values of p
w and p
h were computed. Finally, the linear correlations between Proinfa and p
w and p
h series were calculated.
The wind series comparison is shown in
Table 4, where WP is the wind farm from Proinfa.
There is a strong positive correlation between the WP and W1 series, but a weak positive correlation between WP and W2. The already mentioned geographical variability of winds might be responsible for that, as W1 is closer to WP than W2.
The hydro series comparison is presented by
Table 5, where HP
i are the Proinfa SHPs.
In the hydro comparison, every correlation was at least moderately positive. It is important to state that the SHPs from Proinfa are installed in different rivers than the ANA and ONS stations. The only exception is Itabapoana River, where H7 and HP2 are located and these two stations presented the higher correlation (0.866).
5.3. Renewable Energy Optimal Mix
The simplified series are measured in different units, which does not affect the linear correlation calculation, but restricts an association of them with the aim of finding an optimal mix—in terms of minimizing the irregularity of renewable energy generation. In order to overcome that, each series was divided by its mean value, according to the procedures of [
11,
15]. As a result, the new series indicate how the generated power would change around its average value.
With the intention of attesting the benefits of a renewable energy mix instead of single source options and which would be the best scenario, it was supposed that the total power capacity (p
t) from the three sources was
where p
h, p
w, and p
pv are the hydro, wind, and PV power capacities, respectively, and α and β are weights—α is the hydro power contribution to total power, (1 − α)β is the wind power participation, and (1 − α)(1 − β) is the PV percentage. Thus, when α = 1, only hydropower is being used; when α = 0 and β = 1, all power comes from wind; when α = 0 and β = 0, there is just PV generation. It was assumed that each station would contribute equally to its source final power.
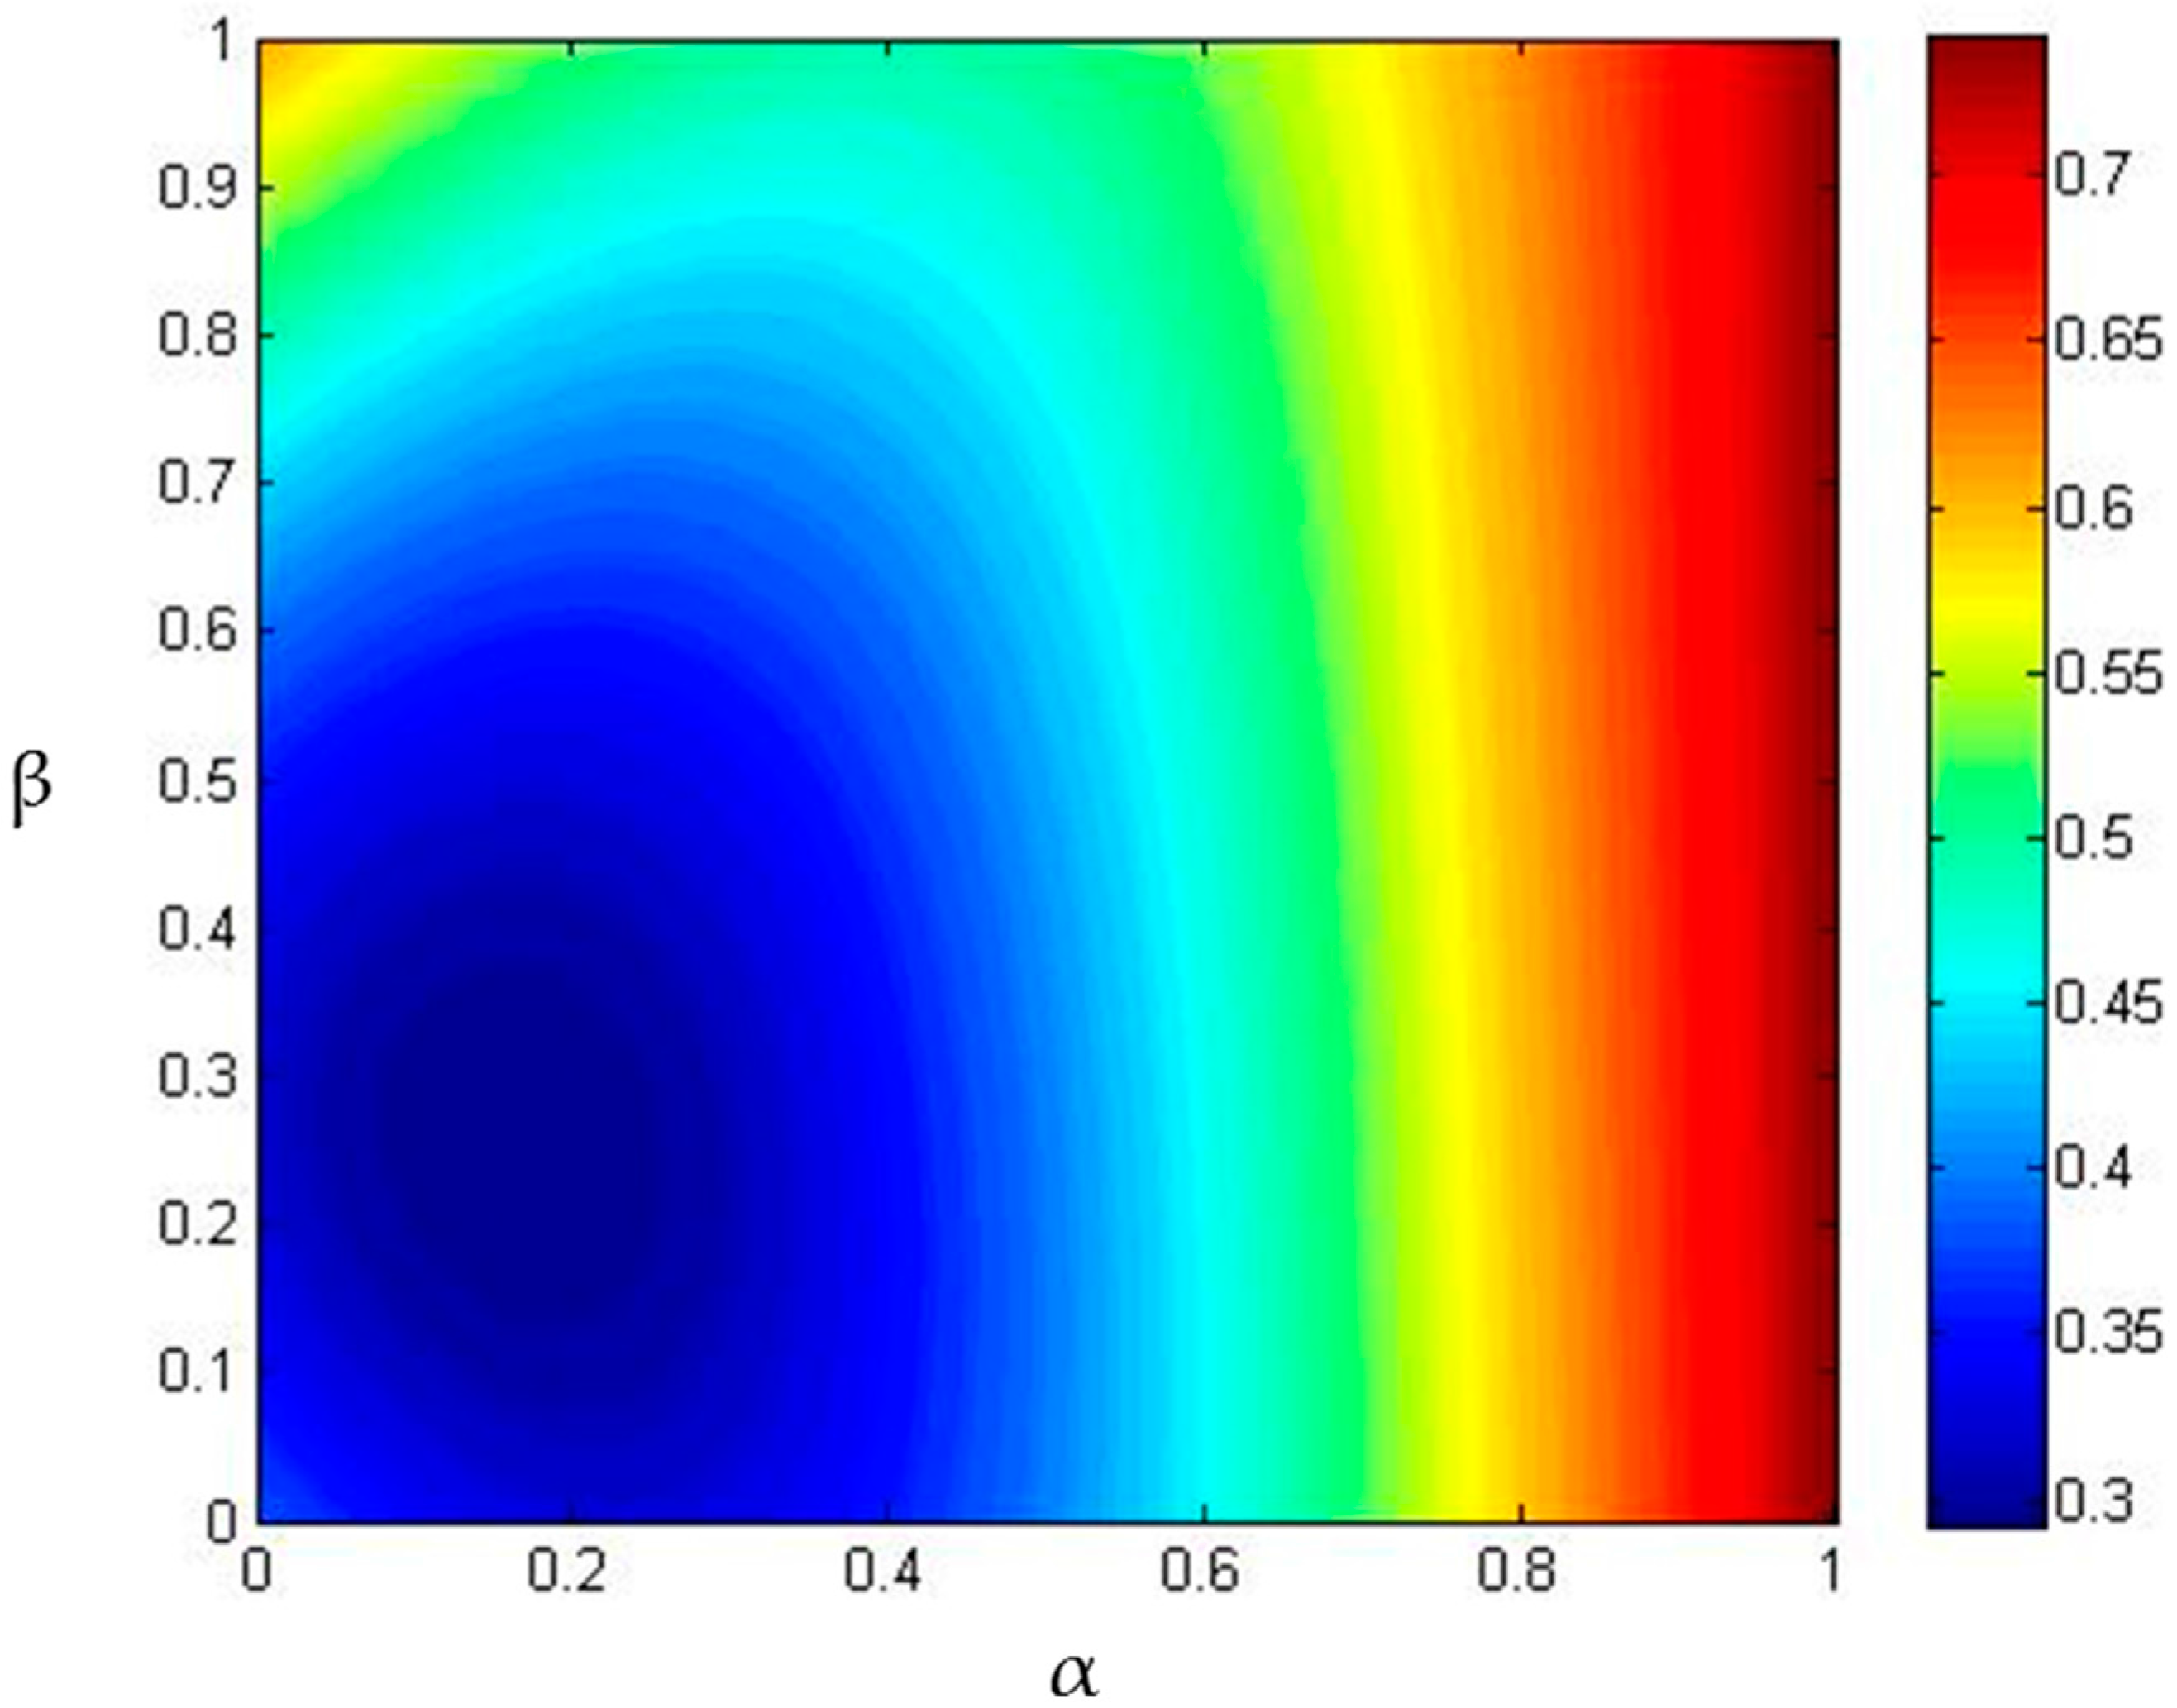
The standard deviation (SD) of p
t is the objective function to be minimized, subject to the constraints 0 ≤ α ≤ 1 and 0 ≤ β ≤ 1. A Matlab code was used to vary α from 0 to 1, with a 0.01 step and, for each α, β varied from 0 to 1 with the same step. The SDs for all pairs were stored and are presented by
Figure 2.
The smallest SD is 0.2923, when α = 0.17 and β = 0.25, and consequently, ph = 17%, pw = 21% and ppv = 62%. The highest SD was 0.7460 and occurred in a total hydro scenario (α = 1). There is an improvement of 61% of the SD value from the worst to the best case, which confirms the benefits of planning the renewable energy mix in the State.
If only SHP, PV panels, and wind turbines are taken from the
Table 1 information, hydro generation corresponds to 90.8%, of the parcel’s total power, while wind and PV represents 8.2% and 1.0%, respectively. This means that the intermittent-source power capacity of Rio de Janeiro is given by α = 0.91 and β = 0.89, quite distant from the optimal point. It is necessary to significantly expand the PV participation, what is made easier by the high population density of Rio de Janeiro—and consequently roof area—but on the other hand, demands government incentives, for PV panels are still unaffordable for a large part of the state’s population.
It is also noticeable that the PV generation cost (US
$ 97.66/MWh) is the highest from the mix—wind energy costs US
$ 45.49/MWh and small hydro, US
$ 52.37/MWh—however, it is not as expensive as any non-nuclear thermal plant [
19]. Moreover, the Brazilian Energy Research Company (Empresa de Pesquisa Energética—EPE) estimated a 47% reduction on residential PV generation cost and 45% on the commercial one, from 2012 to 2023 [
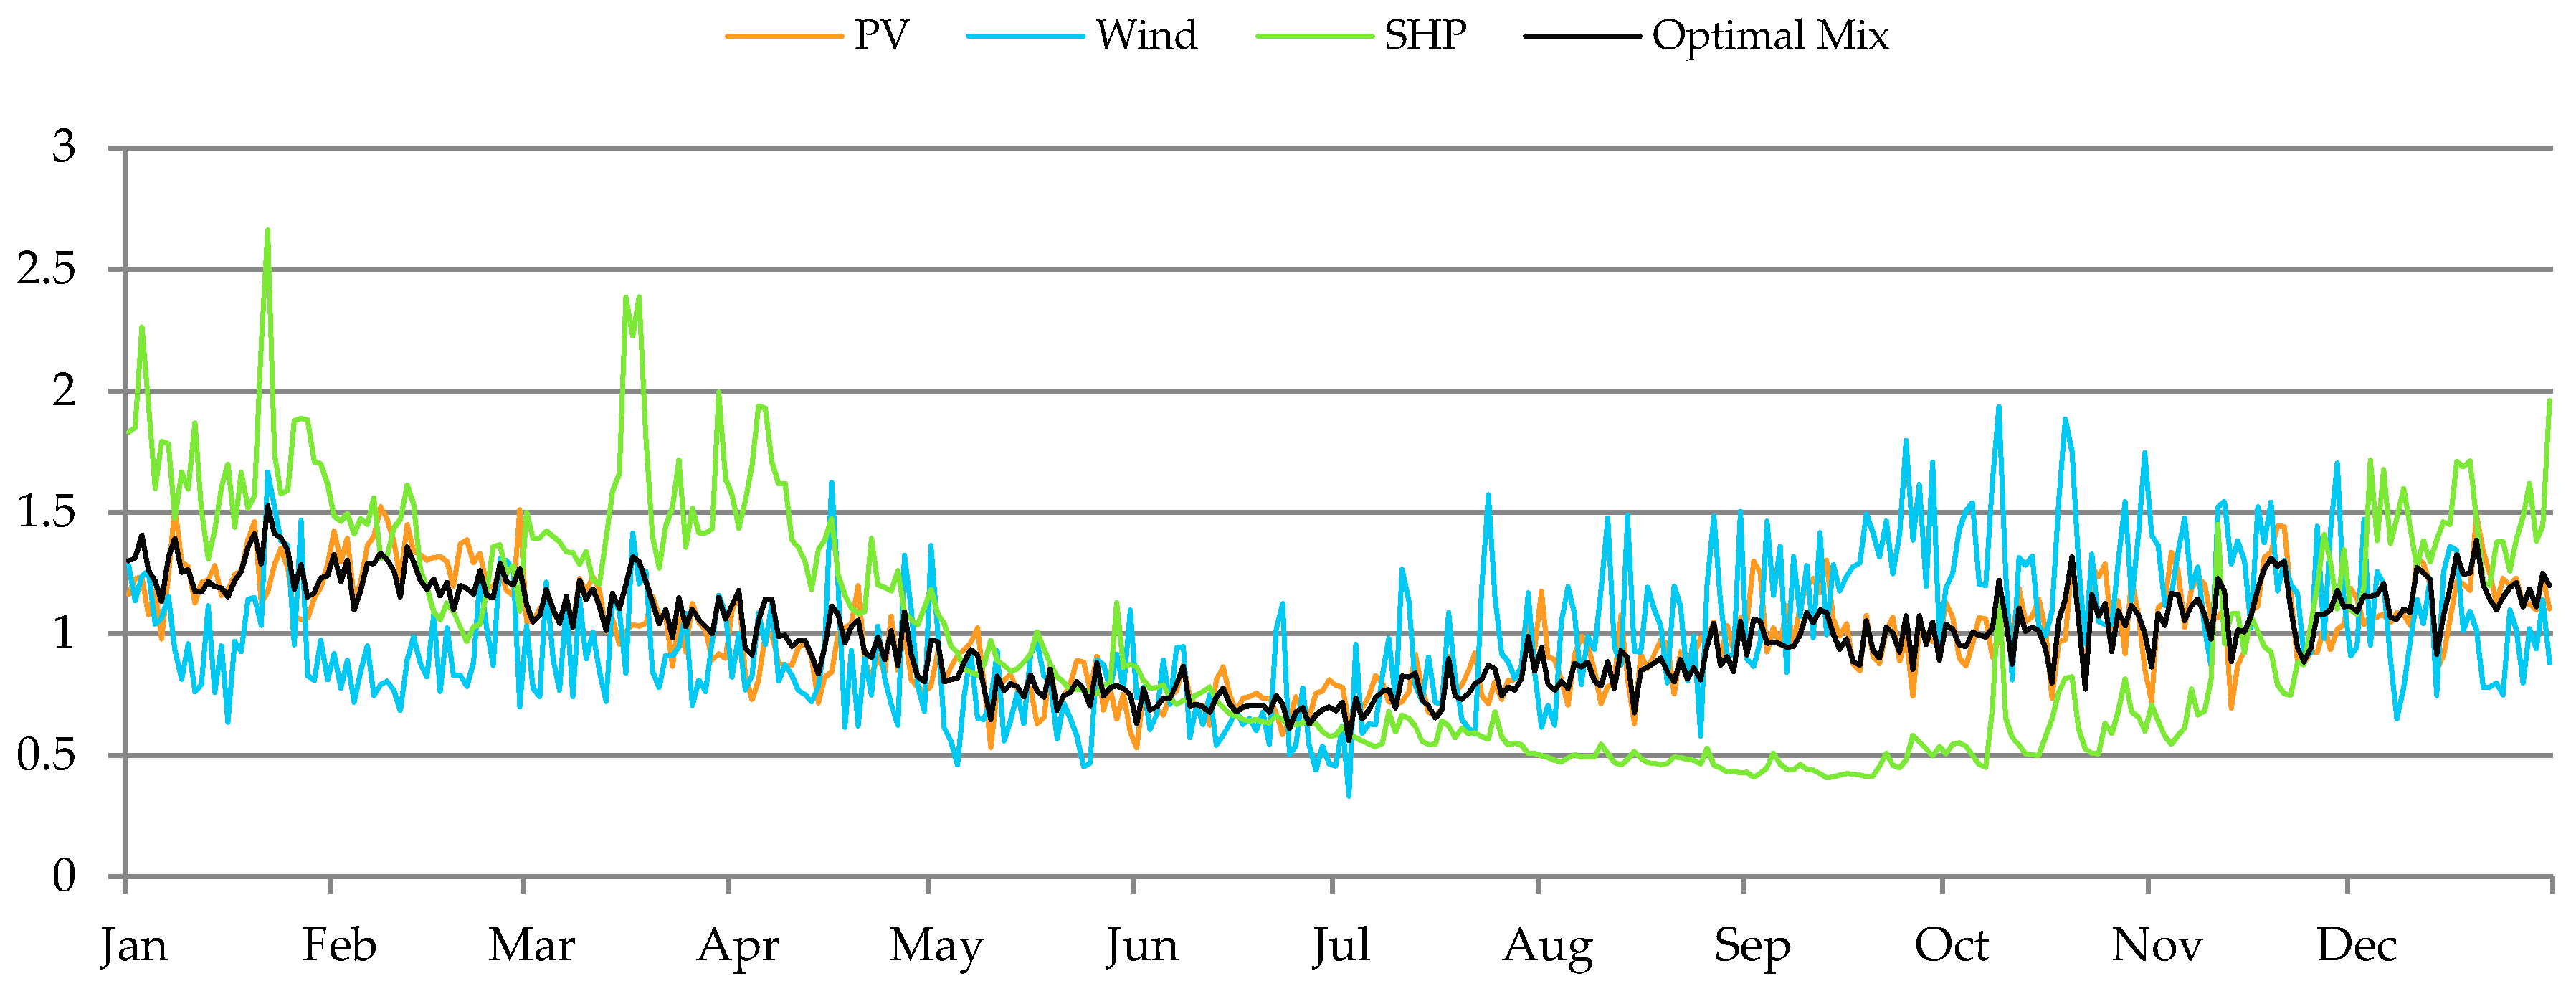
22]. An average year, based on 2008–2014 optimized mix series, is shown by
Figure 3 and it is clearly seen that even the best scenario does not omit the use of other sources. From May to September (autumn/winter in Southern Hemisphere), the power generation remains below the average. Fortunately, other renewable sources can be applied to compensate for this behavior. Sugarcane is largely used in Brazil for producing ethanol and sugar and its harvest generally occurs from May to November. In this period, then, biomass power plants use sugarcane bagasse to generate electricity. Furthermore, the storage capacity of large hydropower plant reservoirs can be used to support the penetration of intermittent sources into the grid [
32].
Although the methodology is not considered unprecedented, the noveltyof this work lies in its application to a developing country, where the expenses with production and consumption of electric energy are limited. However, the geographic characteristics are favorable forthe use of certain renewable sources whichallowed the use of real power data. These characteristics were also of prime importance for the studied state, since it offers natural resources for exploration of the three sources.
6. Conclusions
This work verified that combining hydro, PV, and wind resources in Rio de Janeiro State can reduce their daily variability by up to 61%, if compared to isolated sources. This significant reduction supports the safe insertion of renewable energy sources into the grid, in order to reduce environmental and social (health) impacts connected to traditional thermal plants; weaken the dependence on non-renewable resources; and diminish electricity generation costs.
The most stable renewable mix found is highly dependent on PV generation, whose present participation in the state’s power capacity is insignificant and needs, therefore, to be expanded. Other renewable sources, such as biomass power, could be used to further improve the intermittent mix. The methodology of power modelling did not fix on specified technologies and its efficiency was satisfying, therefore it could be easily extended to other states or regions in Brazil.
Although PV–wind hourly complementarity was not detected for the two available sites, the weak correlation between the wind series should be investigated in other cities, for there could be spatial complementarity. The restricted number of solar radiation and wind speed series and the non-existence of river flow data with hourly resolution limited the study.
Further analysis could refine the assessment of the PV–wind hourly complementarity, considering the correlation for each hour available, as it would allow a better understanding of how they are related to each other during different periods of the day, especially in critical demand hours. It would also be interesting to conduct an optimization process considering not only the power generation, but also the electricity demand.

 ,
, 