1. Introduction
During the last fifty years, world energy consumption has increased disproportionately in relation to population growth, mainly as a result of economic development and a lack of social awareness in more developed countries, where the energy consumed by each inhabitant is increasing [
1]. For several years, the dependence on energy in developed countries has been increasingly alarming. From 1971 to 2014, worldwide energy consumption has grown 92%, according to the International Energy Agency [
2].
Reducing energy consumption at a transnational and global level from a demand side point of view, is not only a challenge, but also a global duty, which requires immediate action and substantial improvement, being not only in the past but also nowadays a field with great potential for improvement in this regard [
3,
4].
The building industry with its high energy consumption requires more attention and effective actions than other sectors [
5,
6]. Despite the trend to focus on existing residential housing, due to the fact that they comprise over 60% of the total sector [
7], the number of non-residential buildings continues to be too high to ignore. It is anticipated that energy efficiency measures could save over 28% energy costs of these buildings [
8]. Energy efficiency is an issue that has acquired significant relevance in the first decade of the XXI century because of its considerable economic and environmental role [
9]. There is a growing number of countries that have introduced energy-efficient strategies in their public-use buildings, due to the increase in energy needs, the obvious signs of climate change and limited resources, among other factors. All of this makes action plans for decreasing dependence on fossil fuels necessary, striving towards to an optimal, competitive and sustainable energy system [
10].
The building and construction sector has undoubtedly contributed too much to this increase, due to energy consumption, which in this sector represents between 20% and 40% of the energy consumed in developed countries, and more than 30% of total greenhouse gas emissions [
11]. This occurs not only in new buildings but also in historic buildings, taking into account that currently approximately 35% of buildings in Europe are more than 50 years old, so it is urgent to adapt the energy systems of these buildings, always preserving authenticity and integrity [
12]. Semprini et al. [
13] analysed a building with these characteristics, making some minor modifications to improve the energy efficiency and they obtained some very promising results. Moreover, on the urban scale, energy sustainability is also a point of reference for the rise of smart cities [
14,
15].
The energy consumption in buildings open to the public is 40% greater than that in residential buildings and 30% of the non-residential buildings in Europe are public buildings. For this reason, these buildings, as an entity at the service of the citizens, are responsible for taking all feasible steps towards securing long-term energy sustainability; first of all, because they consume energy and secondly because they play important roles, both in setting a positive example of the incorporation of energy efficiency measures and in encouraging energy saving and efficiency actions among the public. This approach not only will result in a gradual reduction of the public expenditure, but also minimizes the detrimental environmental impacts, contributing to the fight against climate change. It is therefore essential that further thought be given to this issue, and that great effort should be put into promoting more energy-efficient and environmental solutions that aim for the lowest possible costs and the highest possible profits with major advantages.
Improving energy efficiency is considered one of the basic keystones of the main national and international strategies to reduce greenhouse gas emissions with acceptable economic costs [
16]. The need for simple and clear measures and for all citizens to contribute to energy savings have been addressed in many studies [
17]. Changes and adaptations are required at the social, economic and technological level in order to preserve our wellbeing and the welfare of future generations, although they will result in a change in our way of living. To reduce the energy consumption of buildings, almost all governments have opted for the adoption of measures aimed at improving energy efficiency in buildings for public use. Governments and non-governmental organizations (NGOs) have focused on other issues in plans and programs to boost renewable energies, energy efficiency strategies and strategies to fight climate change [
18]. In Europe, the legislation of the different countries in this area comes, on the one hand, from the creation of certificates of energy efficiency, developed in the early 1990s as a primary strategy to reduce energy use and carbon emissions. On the other hand, it comes from the energy policy adopted in 2007, called Horizon 20-20-20, in which the EU demands the fulfillment of certain objectives by the end of 2020: saving 20% of energy in its primary level in comparison with 2005; lowering greenhouse gas emissions by 20% compared to 1990; increasing renewable energy in the total energy mix to a minimum of 20% by 2020. It is popularly known as the “20-20-20 goal”, which implies improvements in energy efficiency [
19].
At the same time, the Directive on Energy Efficiency in Buildings [
20] states that all newly constructed buildings should be listed as “zero-energy buildings” (ZEB) by the end of 2020 and in the case of public buildings, by the end of 2018. This new concept refers to buildings with minimum levels of energy, whose origin is from renewable sources. Nevertheless, it is a very complex concept, especially because of the lack of a clear and standardized definition and a common energy calculation methodology for all countries to evaluate them with the same criteria [
21].
The importance of showing the energy and environmental performances of public buildings is well known [
22,
23]. In fact, the European association of local authorities, launched its Display
® Campaign in 2001 in order to encourage governments to share with citizens this information. Different assessment processes or evaluations were created over the last two decades, in order to combine and create a new way to audit the energy performance in buildings. The energy performance assessment for existing dwellings (EPA-ED) methodology is supported by software, and has been developed in the framework of a European project that focuses on energy related issues for existing residential buildings [
24]. However, most of the time, the energy efficiency evaluations were not properly assessed or even not assessed at all [
25]. The main reasons were to keep the audits simple and low cost. Part of the different evaluations were carried out by the users, in simple and not assessed DIY (Do-It-Yourself) evaluations.
Another idea that is receiving stronger support in recent years is the Inter-Building Effect [
26], where the buildings are connected and share a spatial relationship which could vary the building’s performance. This is also affected by the weather and climatology. All of this must be taken into account in order to predict the energy performance of buildings and their surroundings. These reasons have led to a growing tendency to search for new ways of enhancing public buildings’ performance, especially in those opened with long-term projections and for many hours during the day, such as universities [
27]. Many publications studied the new measures to incorporate them into university buildings and how these could affect in the energy costs of local authorities. Trying to achieve this goal of energy sustainability, governments have included new policies to improve both energy saving and renewable energy; for example, the inclusion of light-emitting diodes (LEDs) in indoor lighting instead of the old incandescent bulbs [
28]. Not only lighting has been studied during the last 15 years; some studies focused their research on all kinds of energetic items and especially new renewable ways of energy, and their consumption was compared to the previously used items in the buildings [
29].
The main goal of this study is to determine the status and development trends in the field of sustainability over the last 40 years to help the research community better understand the current and future situation as well as to predict dynamic changes that may take place in lines of research. This kind of research has been successfully employed in other research projects [
30,
31,
32].
2. Materials and Methods
Bibliometric is one of the main research approaches that is extended to almost all scientific fields, being increasingly used to assess peer reviewed research outputs. Scopus is accepted by the international scientific community as the largest database of citations and abstracts of refereed literature for the analysis of scientific publications [
33]. It was selected as the database used in this study because it has a complete catalogue of 20,500 publications from more than 5000 international publishers.
A full search was carried out with this database using the subfields’ title, abs, and authkey to find publications dealing with the topics of Sustainability and Energy Efficiency. The search scope was from 1976 to 2016. Other analyses show the success of this methodology [
34,
35].
Avoiding risks of distorting the results, the best option to search for the exact content was to use the following search string:
TITLE ({sustainability}) OR ABS ({sustainability}) OR AUTHKEY ({sustainability}) OR TITLE ({energy saving}) OR ABS ({energy saving}) OR AUTHKEY ({energy saving}) AND TITLE ({building}) OR ABS ({building}) OR AUTHKEY ({building}) OR TITLE ({buildings}) OR ABS ({buildings}) OR AUTHKEY ({buildings}) OR TITLE ({school}) OR ABS ({school}) OR AUTHKEY ({school}) OR TITLE ({schools}) OR ABS ({schools}) OR AUTHKEY ({schools}) OR TITLE ({office}) OR ABS ({office}) OR AUTHKEY ({office}) OR TITLE ({offices}) OR ABS ({offices}) OR AUTHKEY ({offices}) OR TITLE ({university}) OR ABS ({university}) OR AUTHKEY ({university}) OR TITLE ({universities}) OR ABS ({universities}) OR AUTHKEY ({universities}) OR TITLE ({public buildings}) OR ABS ({public buildings}) OR AUTHKEY ({public buildings}) OR TITLE ({public building}) OR ABS ({public building}) OR AUTHKEY ({public building}).
By combining the information gathered with the results of the field work, different indices and statistics of many fields of interest may be elaborated. The obtained publications referring to sustainability and energy efficiency during the period from 1976 to 2016 were analyzed through different aspects such as publication type, language, characteristics of scientific output, publication distribution by country and institution, distribution subject categories, citation analysis as well as the keyword occurrence frequency. The citation analysis includes a study on the influence of the h-index. This index was proposed in 2005 by Jorge E. Hirsch for the qualitative evaluation of researchers in the field of physics [
36]. Researchers consider it not only the safest way of measuring the scientific quality of the work, but also quite a useful tool to evaluate the regularity of production and to predict future scientific output, as it takes into account both productivity and impact [
37,
38].
3. Results and Discussion
3.1. Type of Publications and Languages of Publications
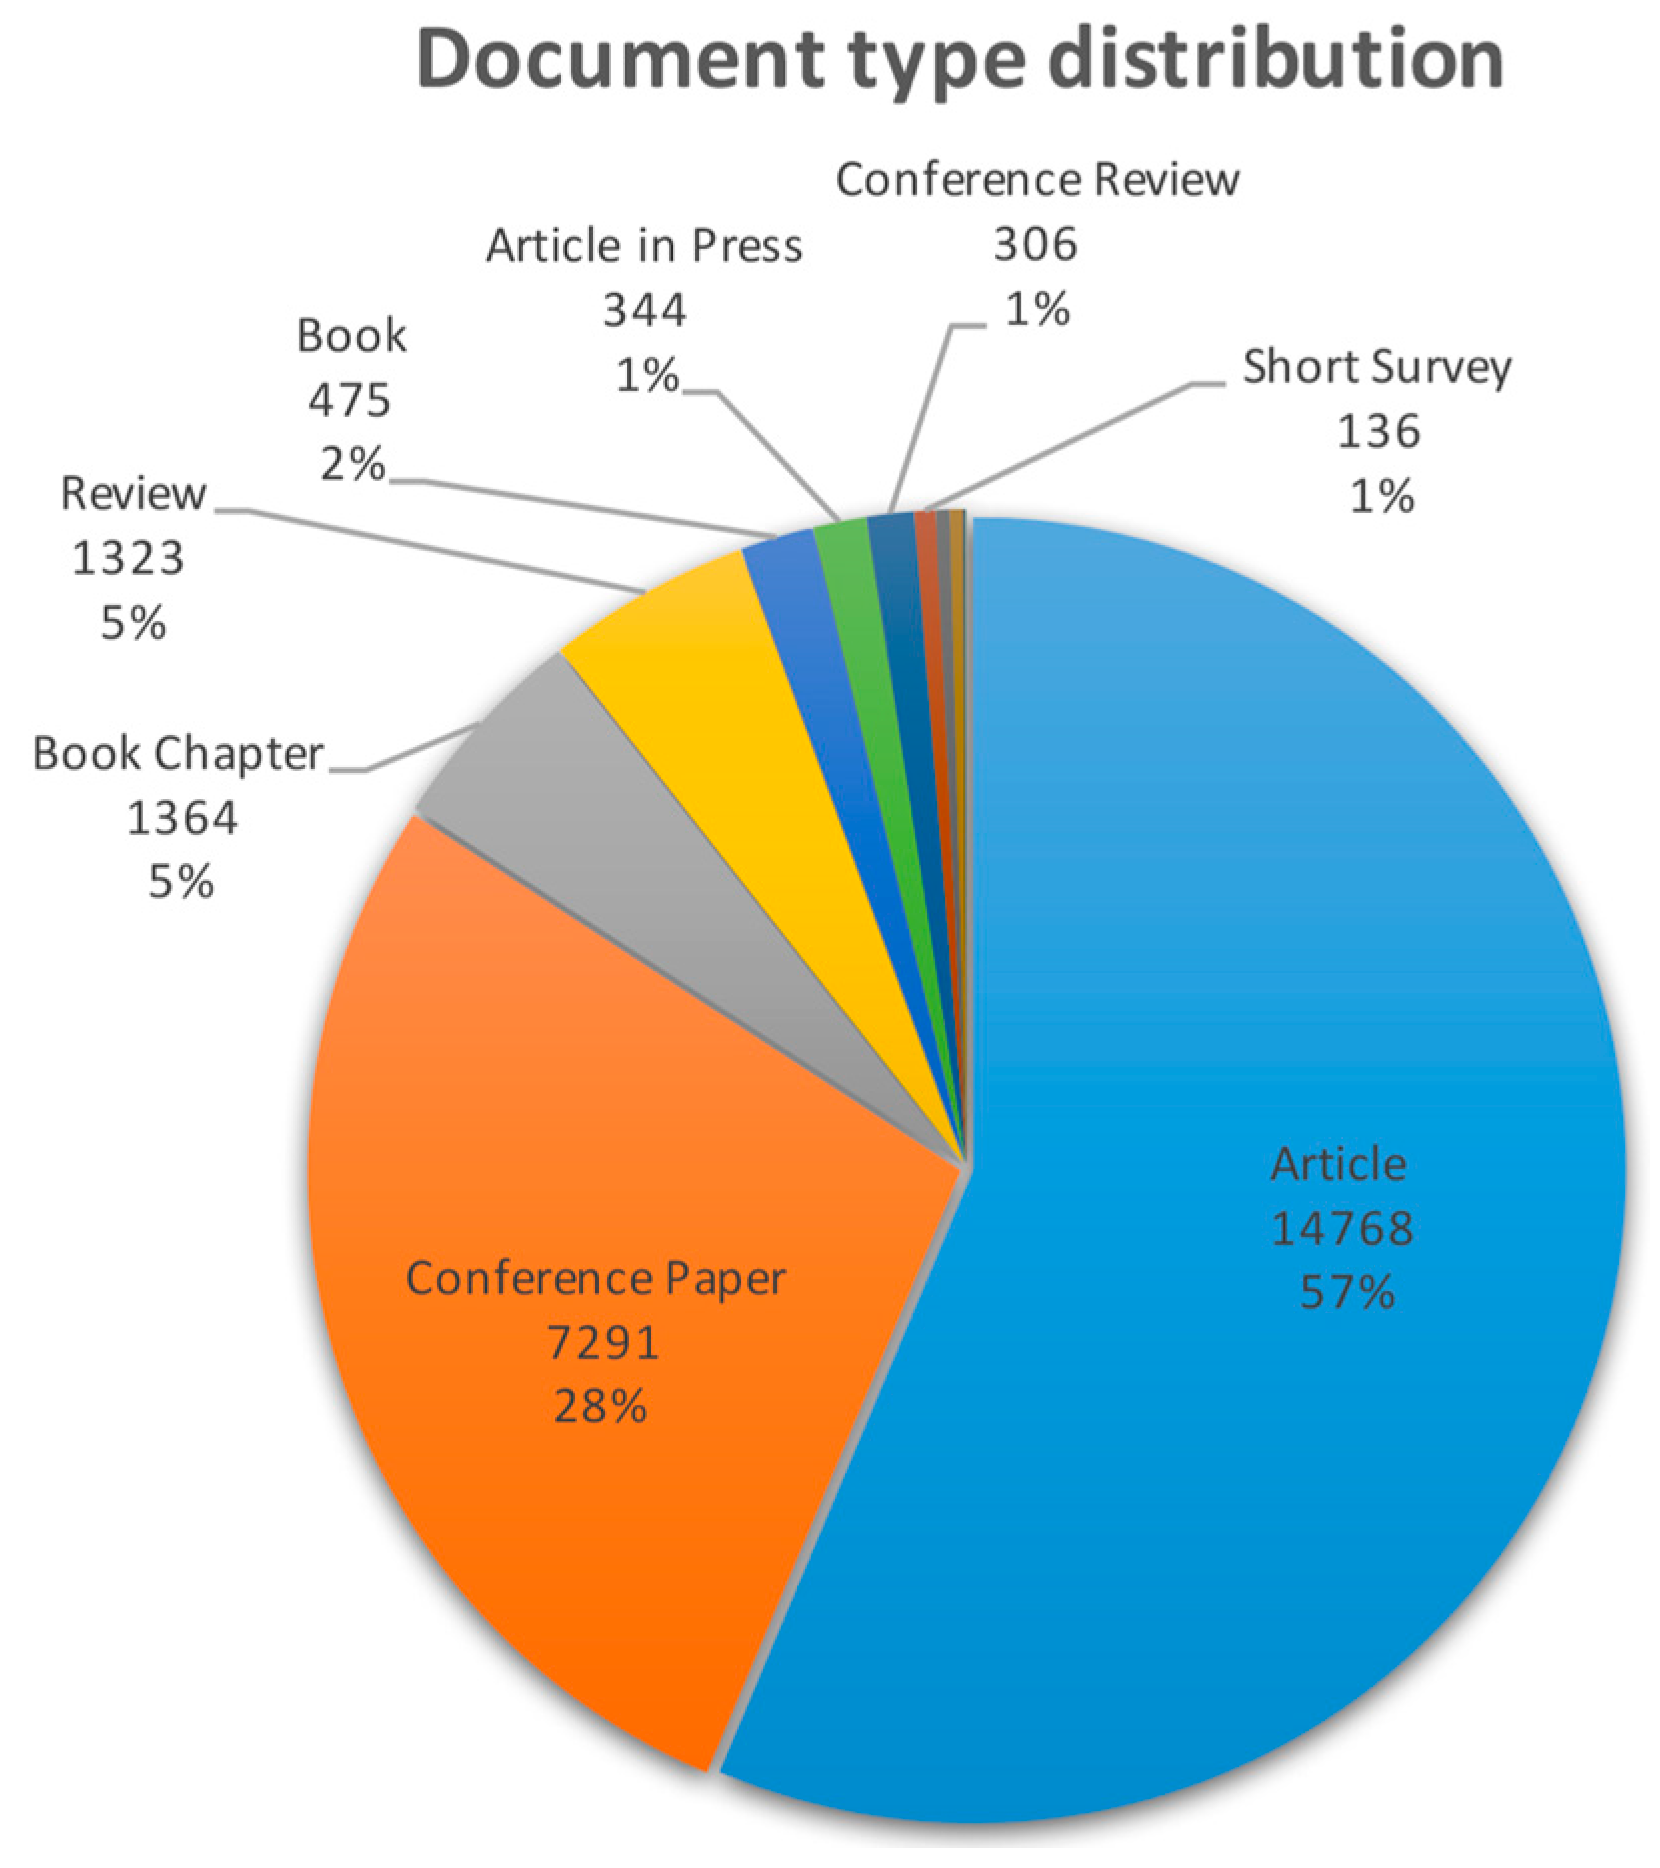
The search considered 26,653 documents in various fields or types of documents. After analyzing the different types of publications (see
Table 1), most of the research work was articles (14,768; 57%) and conference papers (7291; 28%). There was a significantly smaller quantity of Book Chapters (1364; 5%) and Reviews (1323; 5%) and a less significant number of other types of publications such as Books, Press Articles or Conference Reviews.
Figure 1 shows a chart representation of document type distribution during the period 1976–2016.
Most of the publications taken into account are articles, which are mainly published in international journals. For that reason, 95% of the work has been published in English (25,320) and only 5% in other languages such as Chinese, German or Spanish. In
Table 1, there is a list containing the number of publications for each language in the work analyzed.
3.2. Characteristics of Scientific Output
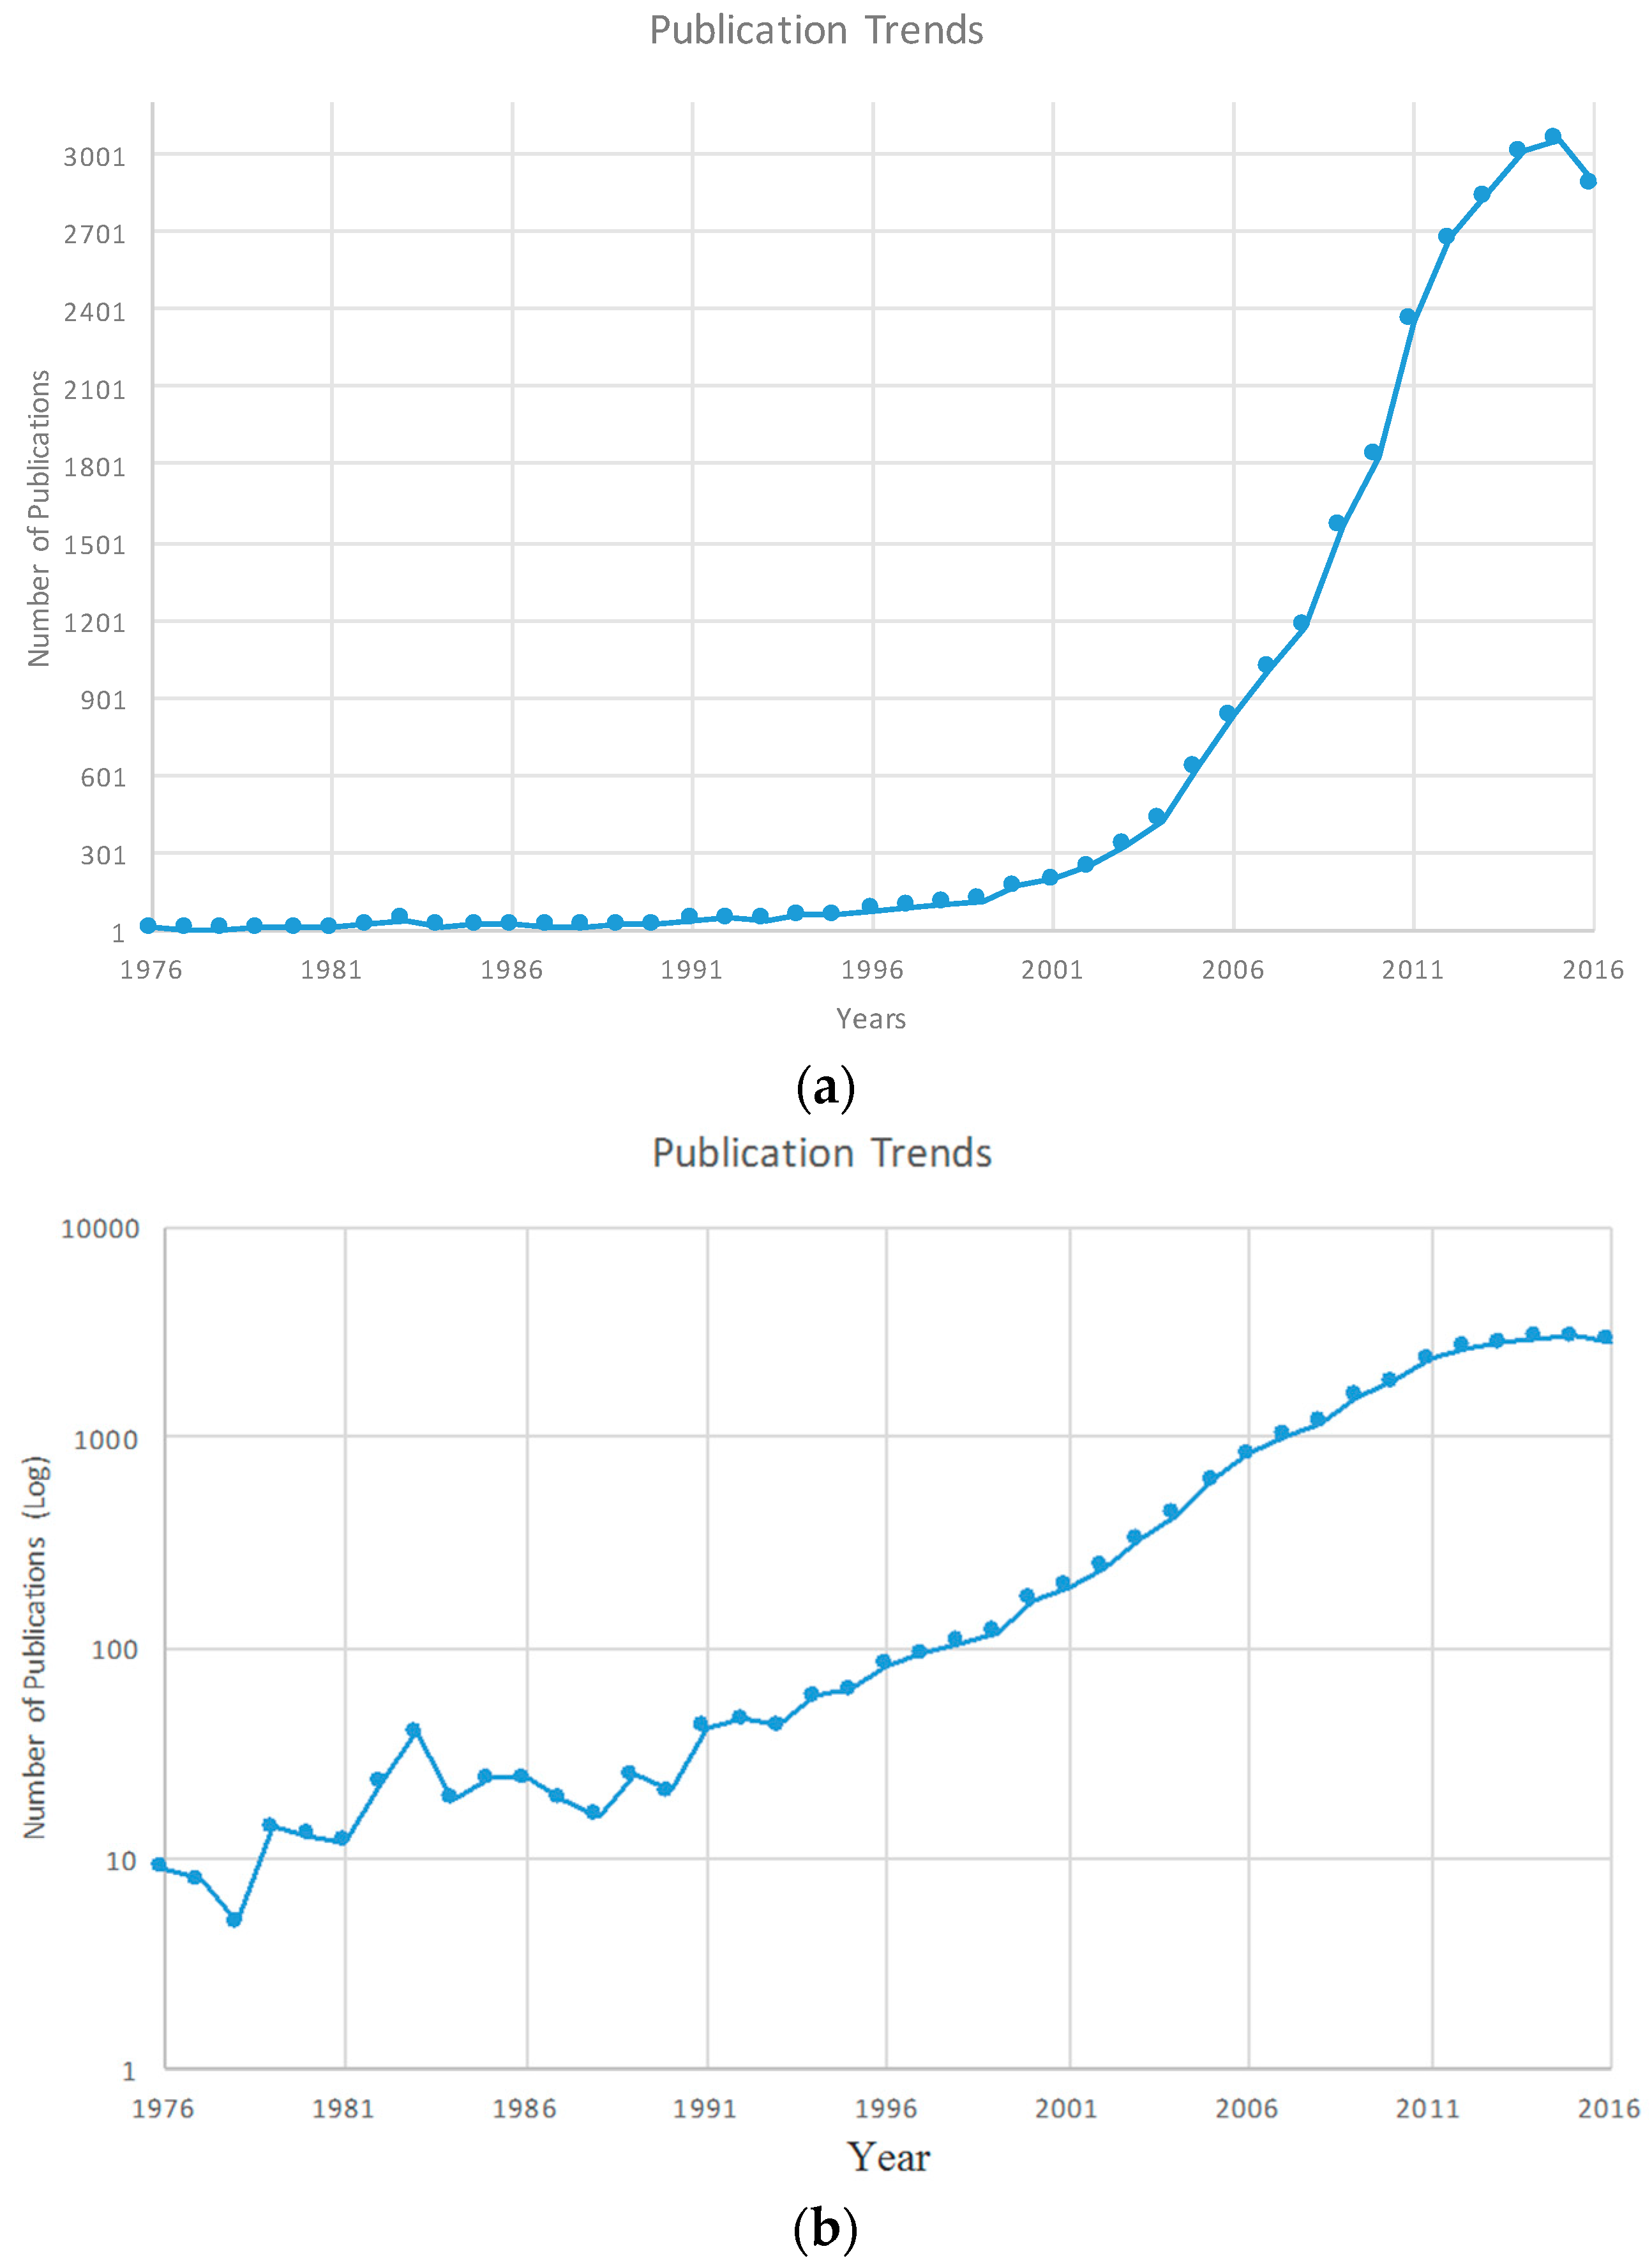
Figure 2a shows the output of the search in relation to the number of publications during the last 40 years. As we can see, the number of articles in this area was not very high until the early 2000s, when it started to grow from less than 300 publications per year to more than 3000 in 2015. This significant growth stems from the awareness of the ecological problem in the first decade of the century. Many policies were established around the different governments and institutions in order to reduce pollution and encourage efficiency and sustainability in public buildings.
Figure 2b presents the same data but this time on a logarithmic scale, which provides some insight into the growth rate.
3.3. Publication Distribution by Regions and Institutions
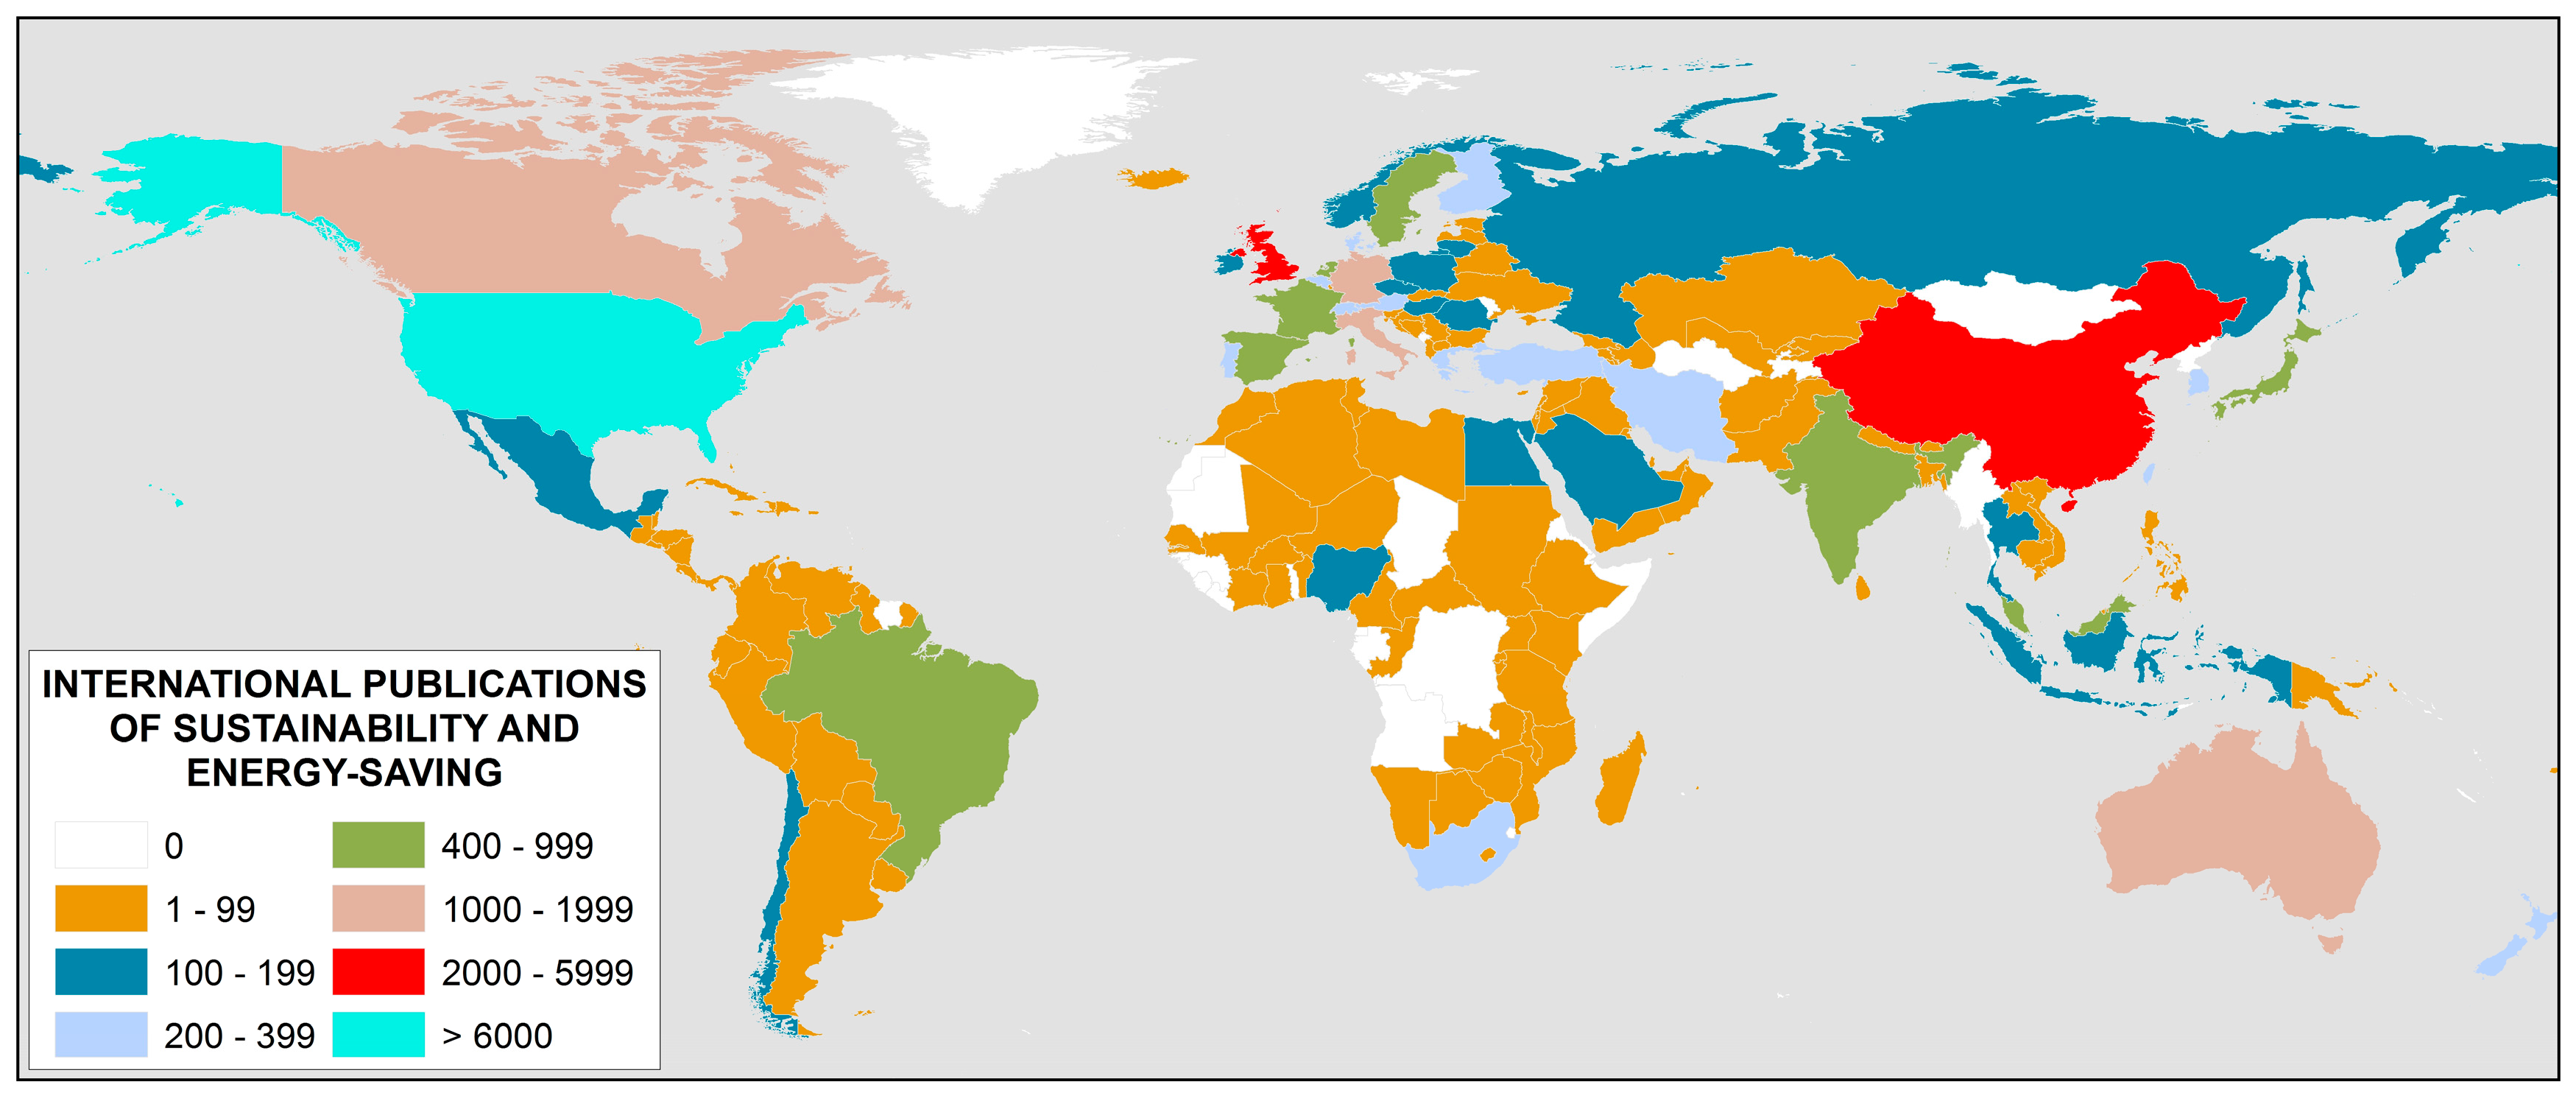
Figure 3 shows the distribution of publications according to country. Turquoise color indicates the largest number of publications, whereas the grey color indicates no publications at all. We can see how the United States is the country with the most publications, followed by China, England and Ireland. Other countries with a large number of publications are Australia, Germany and Italy. This information reveals the importance of energy efficiency and sustainability in developed countries, where governments are dedicated to stricter policies and this subject has become part of the goals of the richest countries.
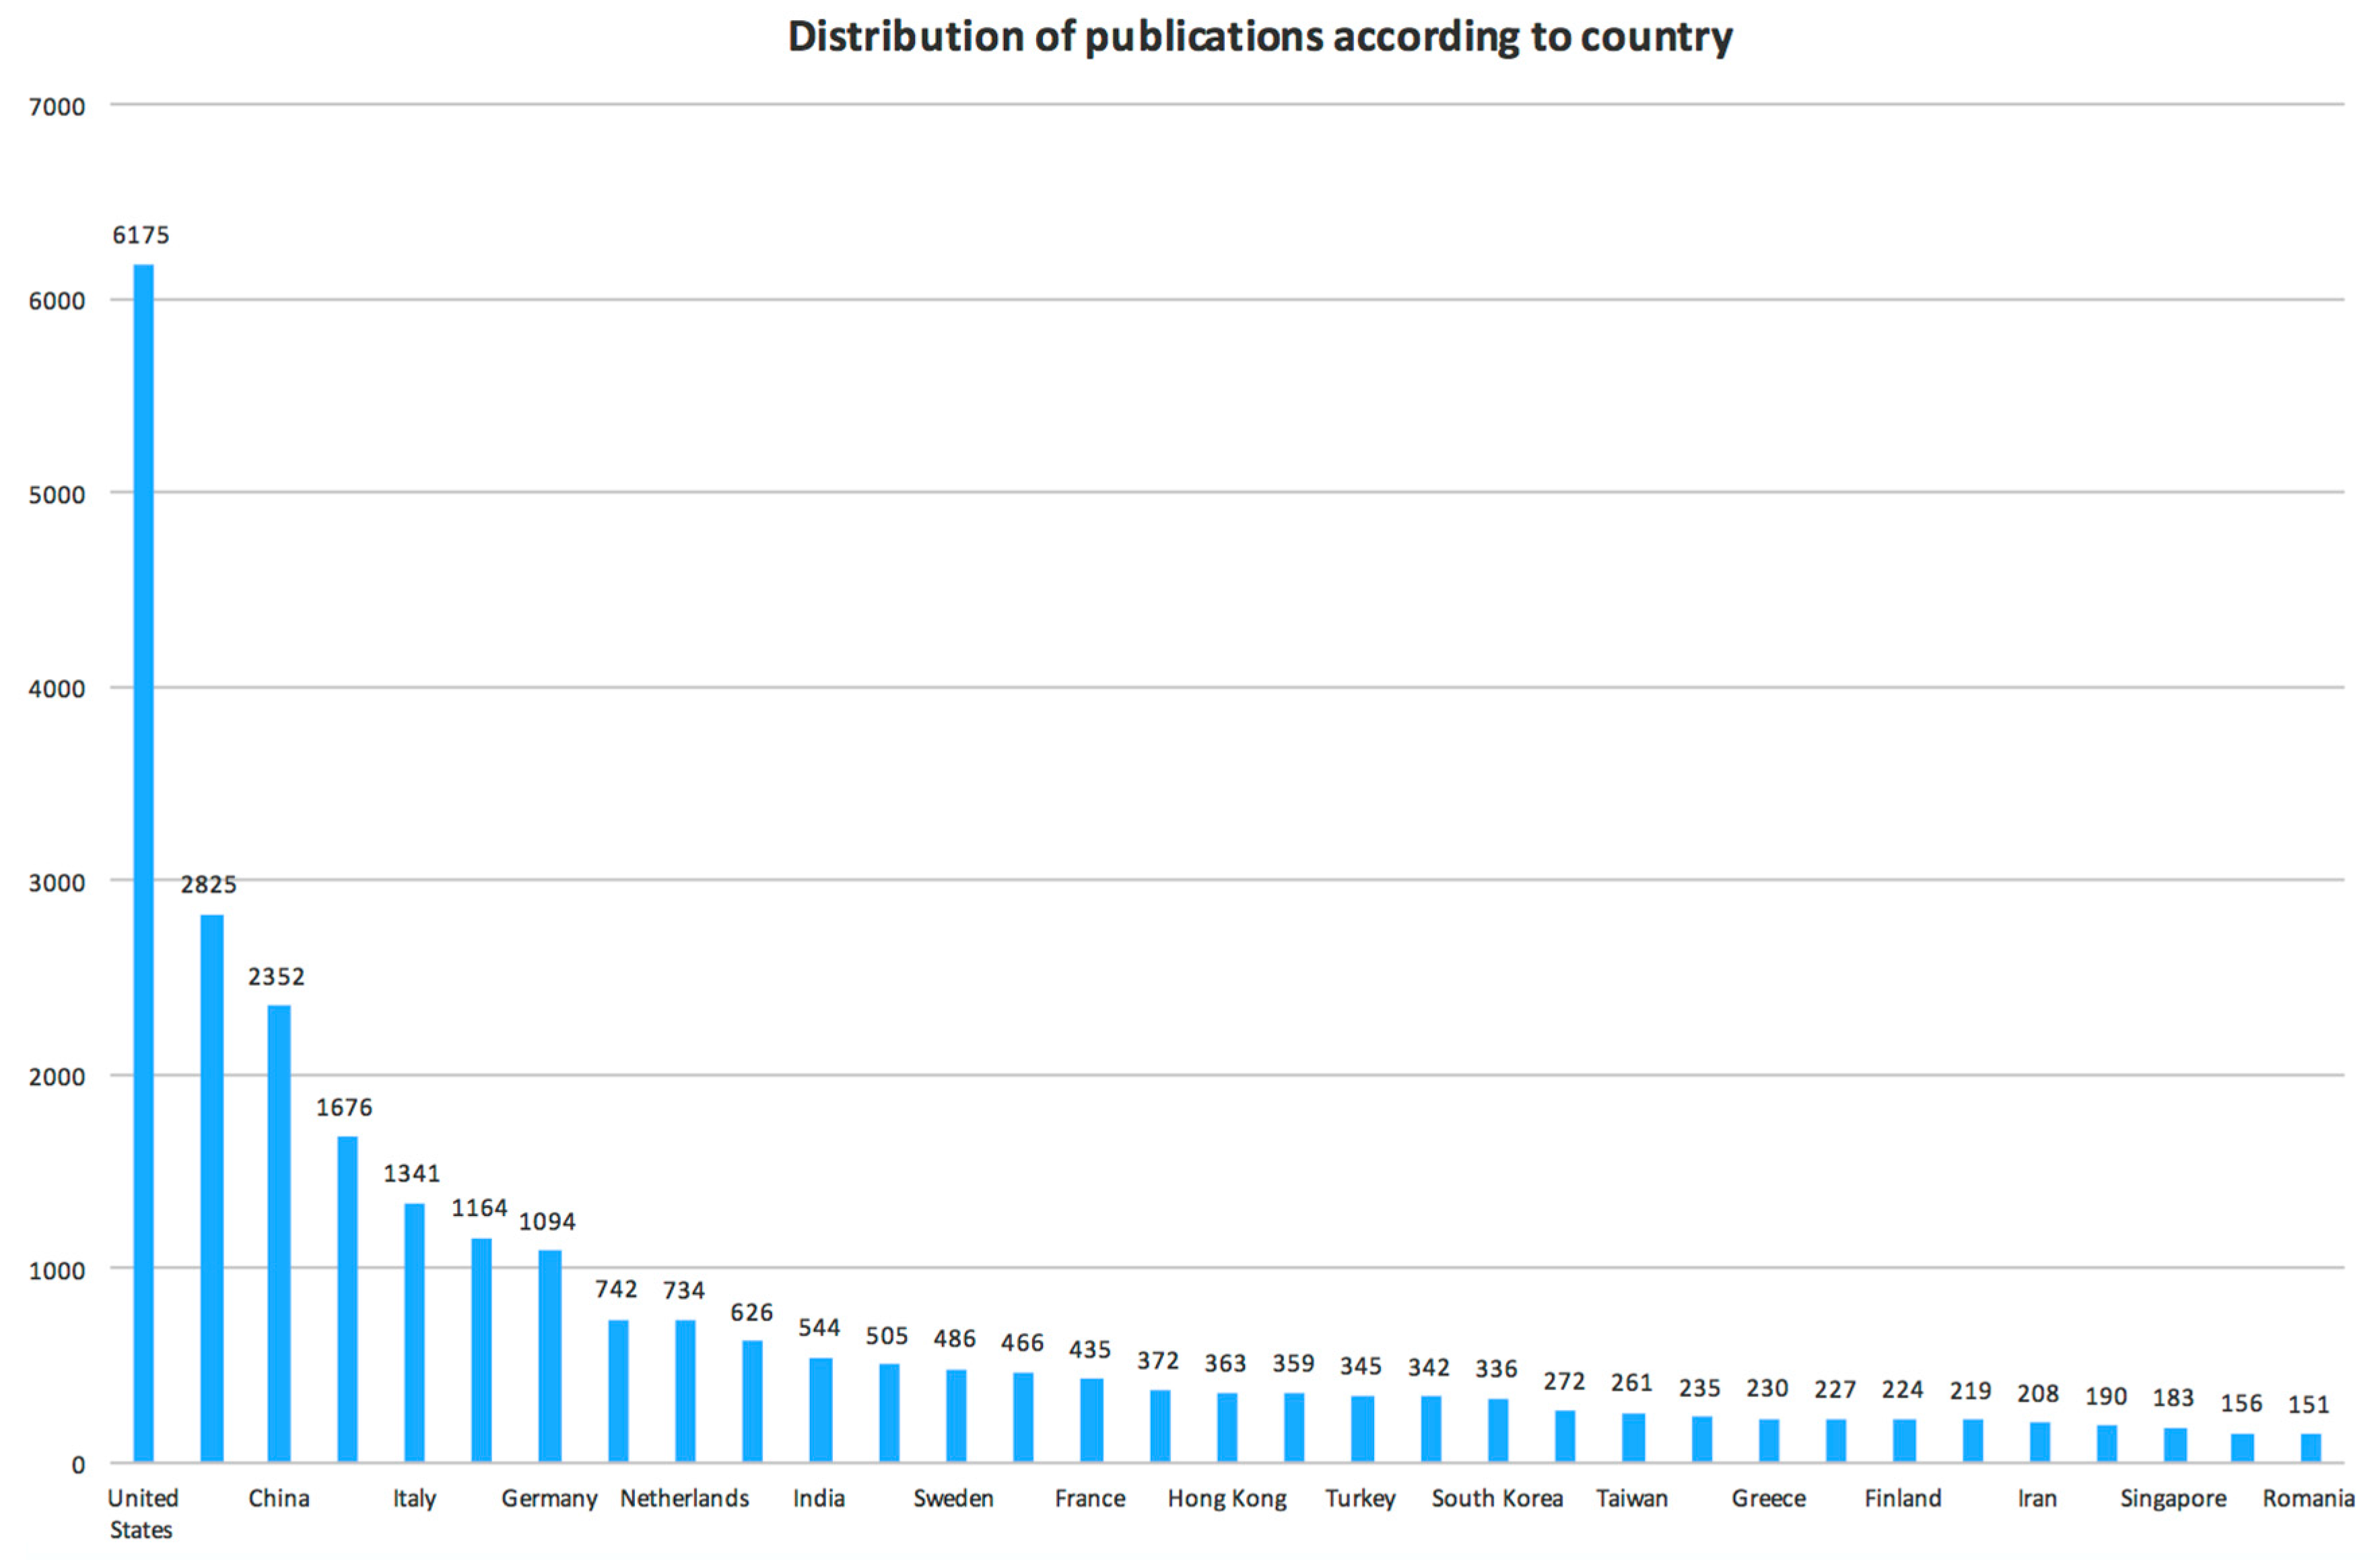
Table 2 shows the top 50 contributing countries and their total number of publications.
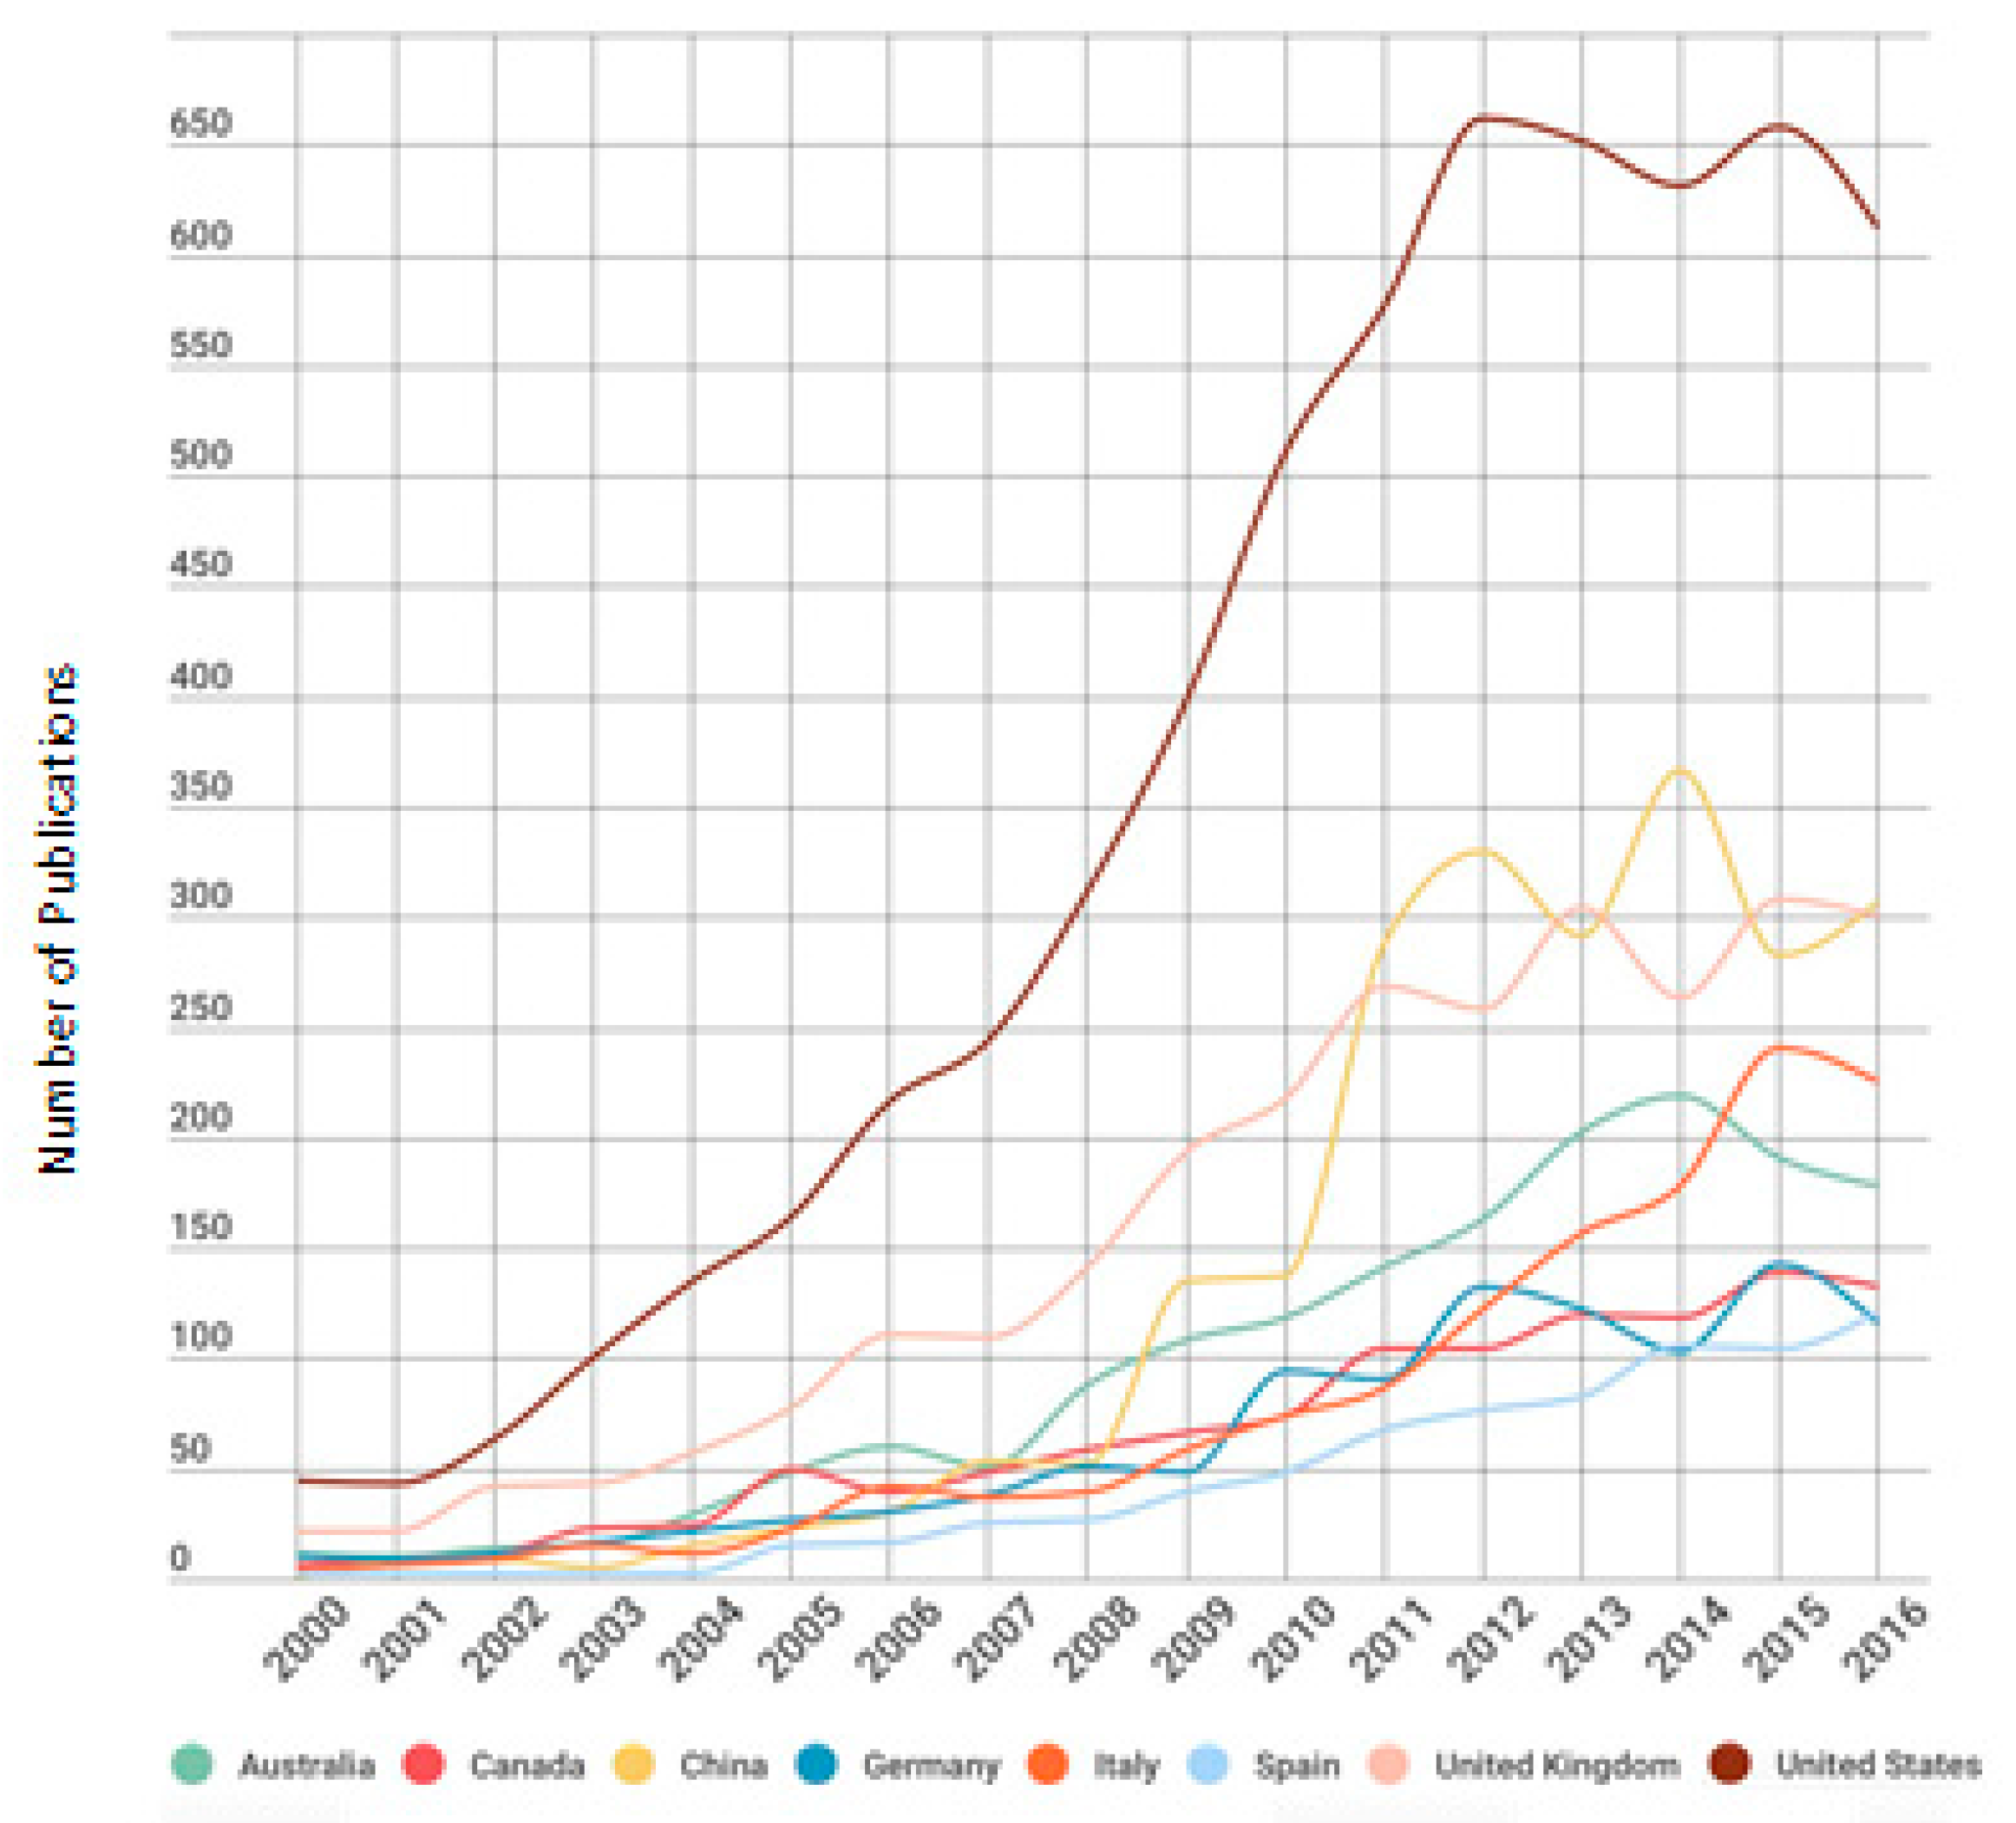
Figure 4 shows the number of publications per year in relation with the country. As we can see, the United States is the most active country in this subject with more than 600 publications from 2012. The United States is followed by the United Kingdom and China with around 300 publications each year from 2012. All the countries show exponential growth in the number of publications during the years 2001 and 2003 as we have mentioned before. In
Figure 5, the top 8 contributing countries during the last 16 years are presented.
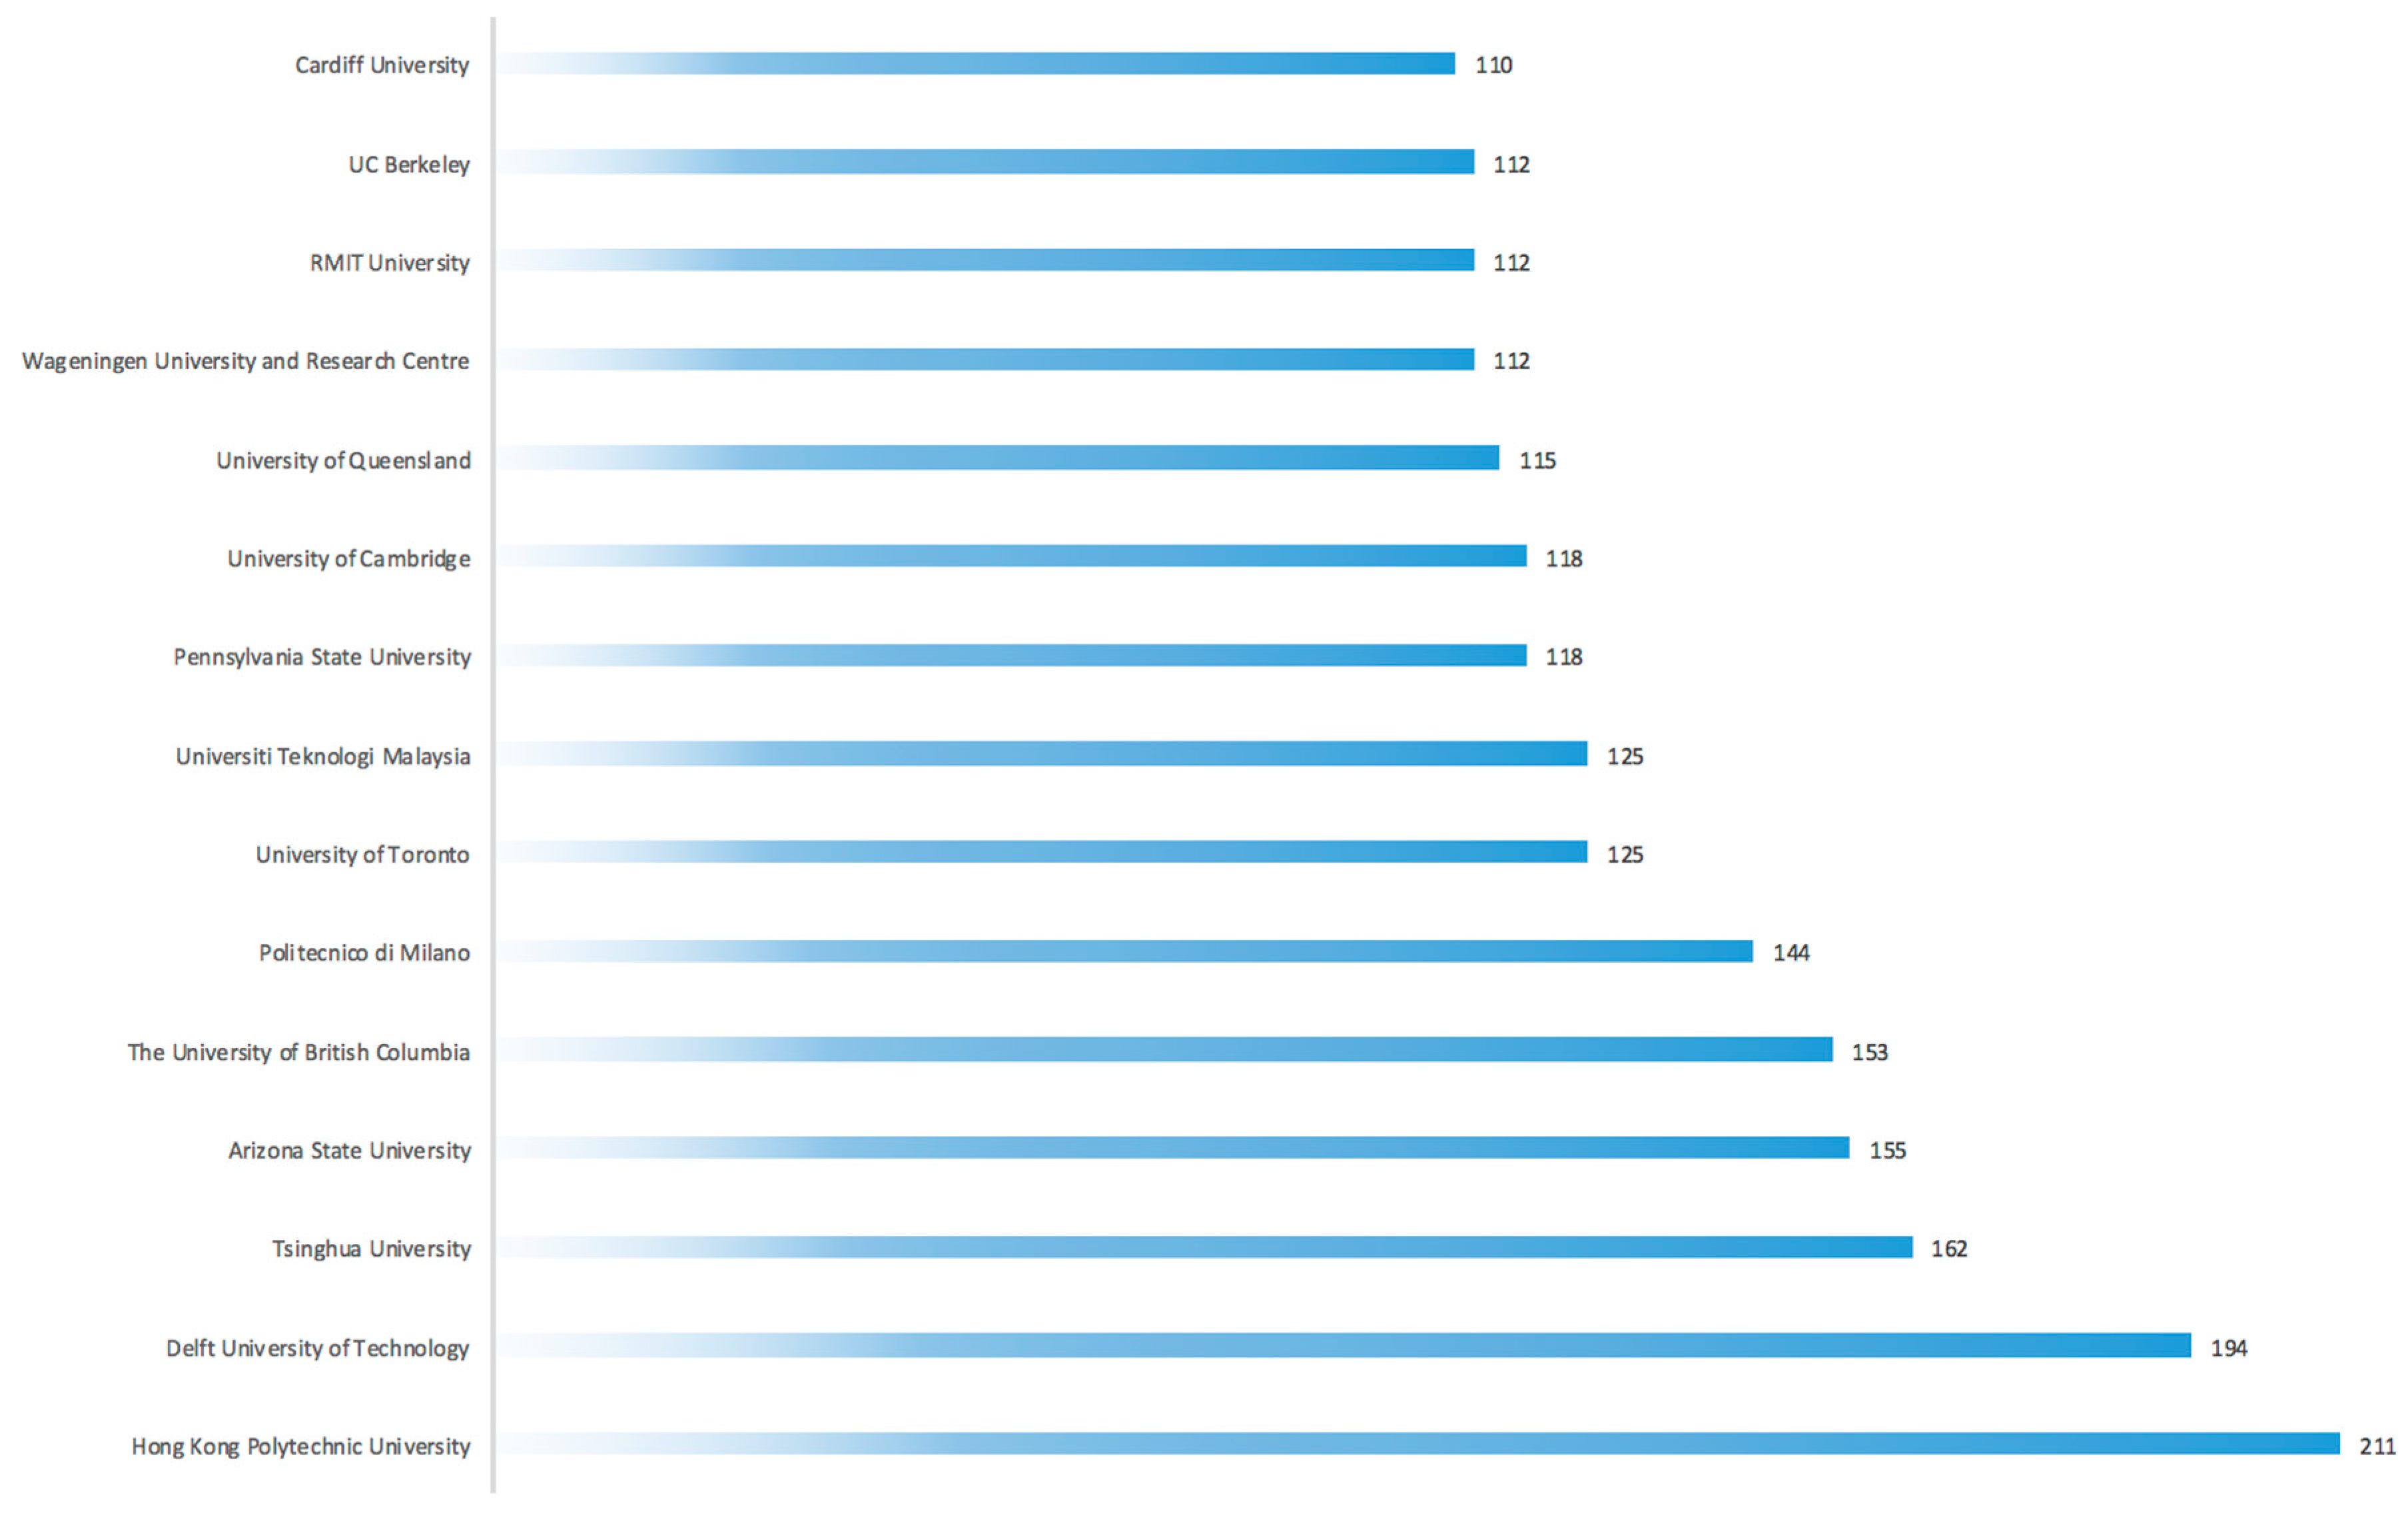
Figure 6 shows the ranking of the top 15 most productive international institutions around the world in the last 10 years. The three institutions with the highest numbers of published works on the subject are Hong Kong Polytechnic University, Delft University of Technology and Tsinghua University.
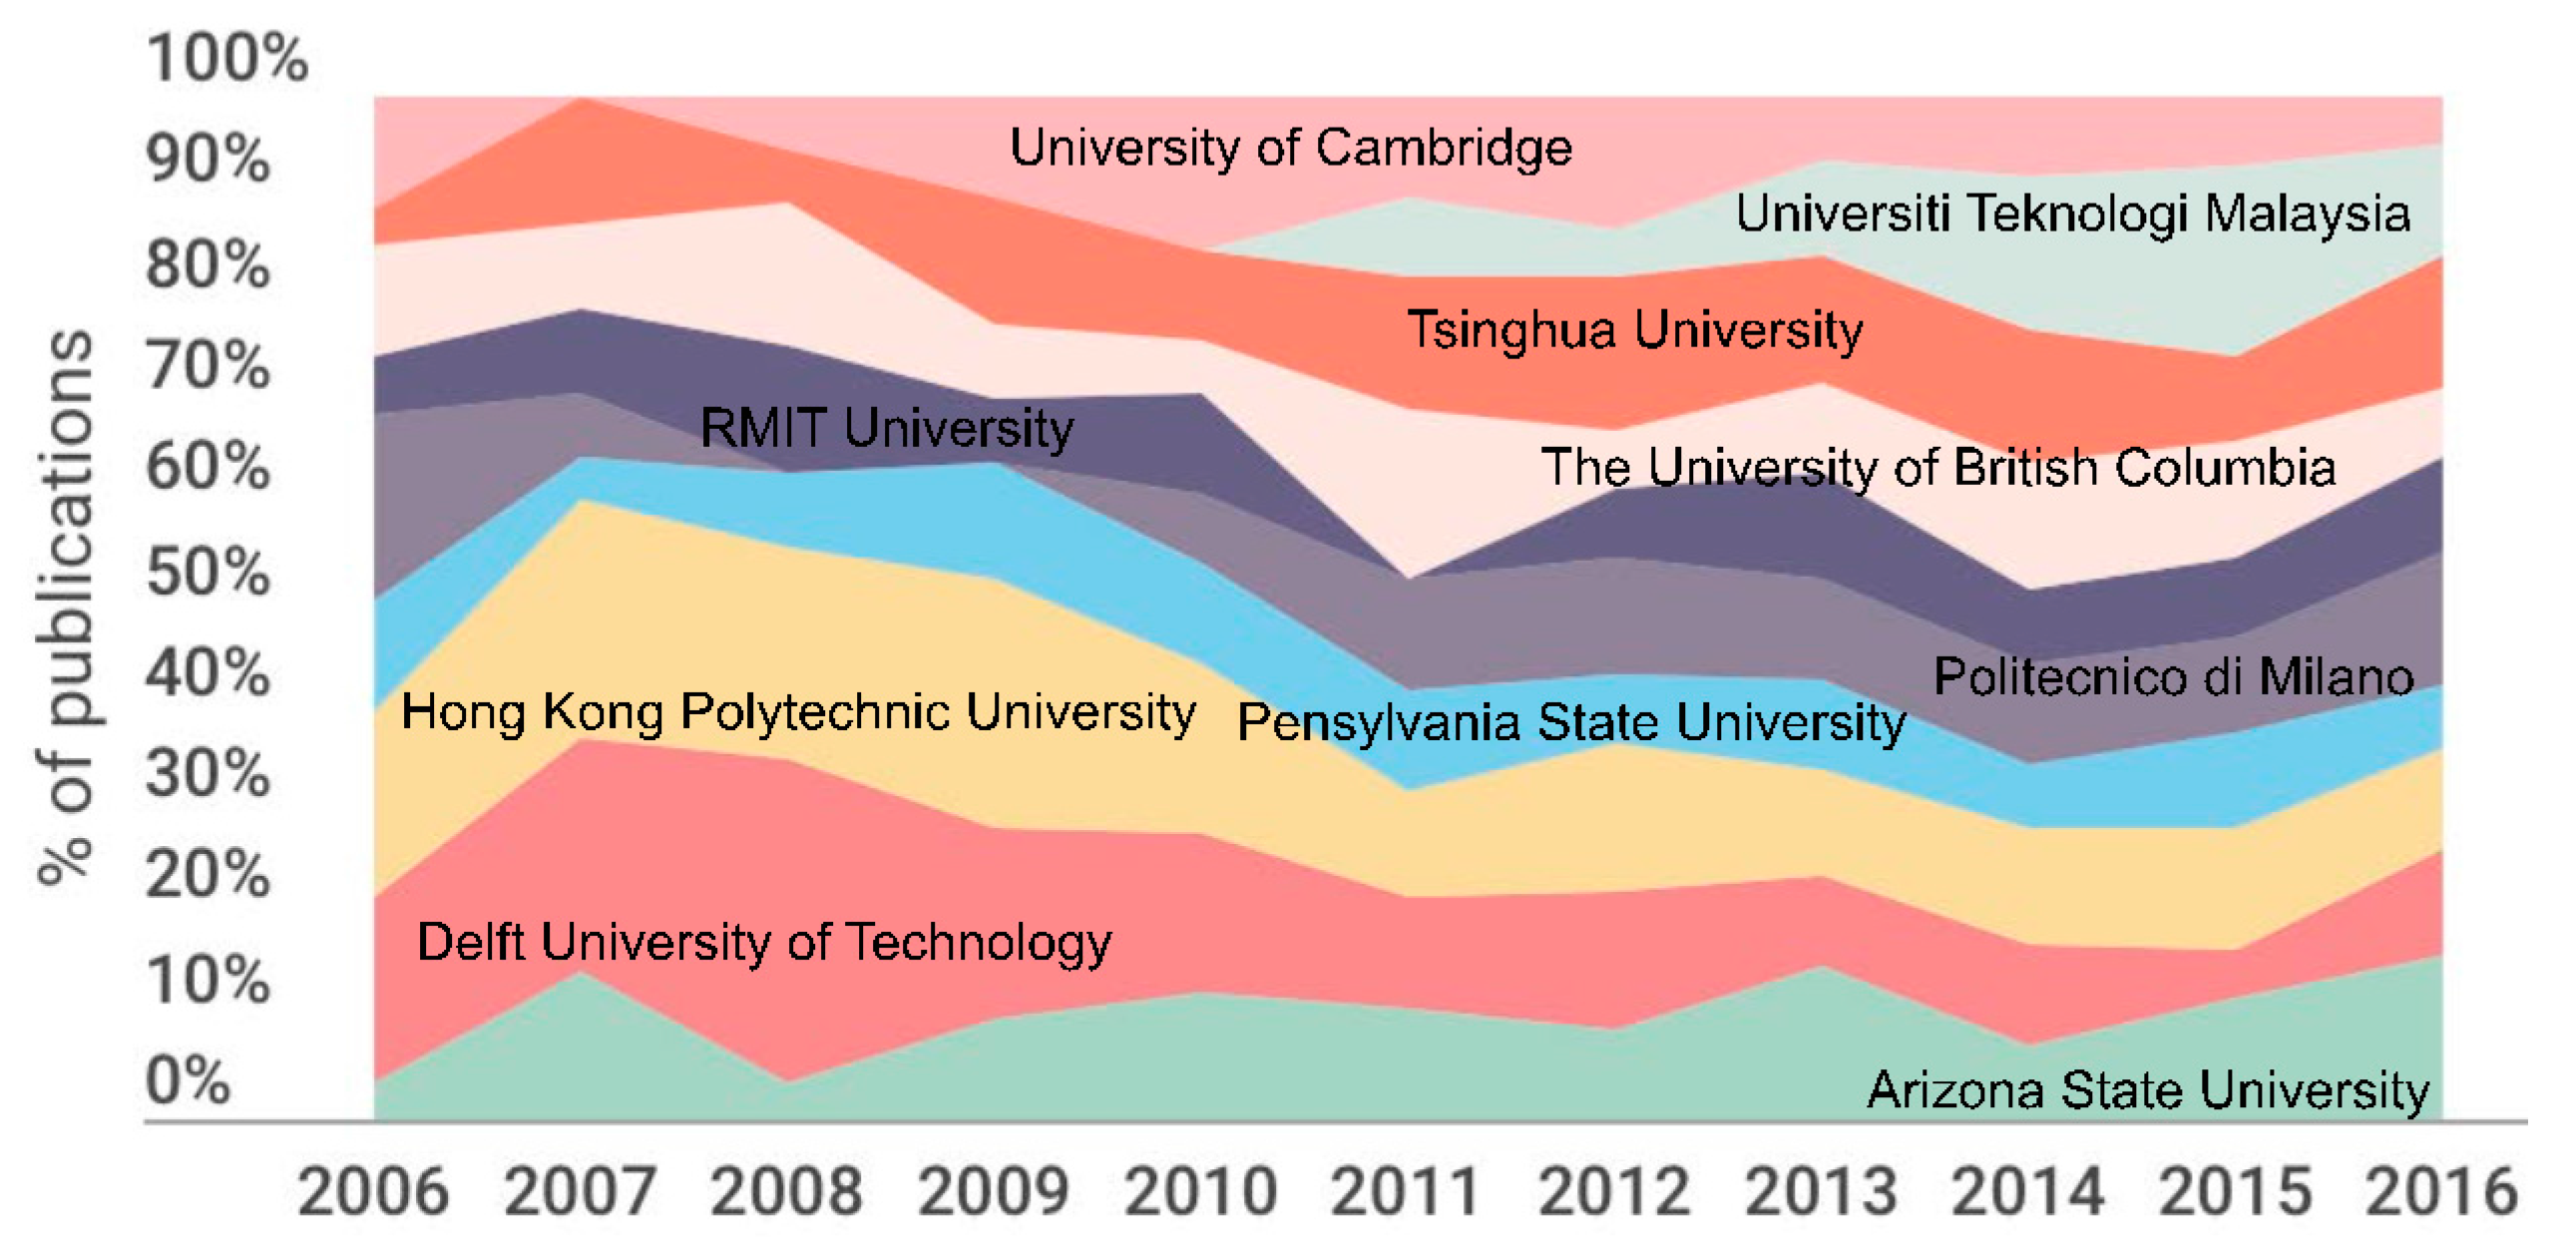
In
Figure 7, we can see the activity of the top 10 institutions during the last 10 years as well as the percentage of the total publications in the subject.
Table 3 shows the exact number of publications of each institution per year, during the period 2006–2016.
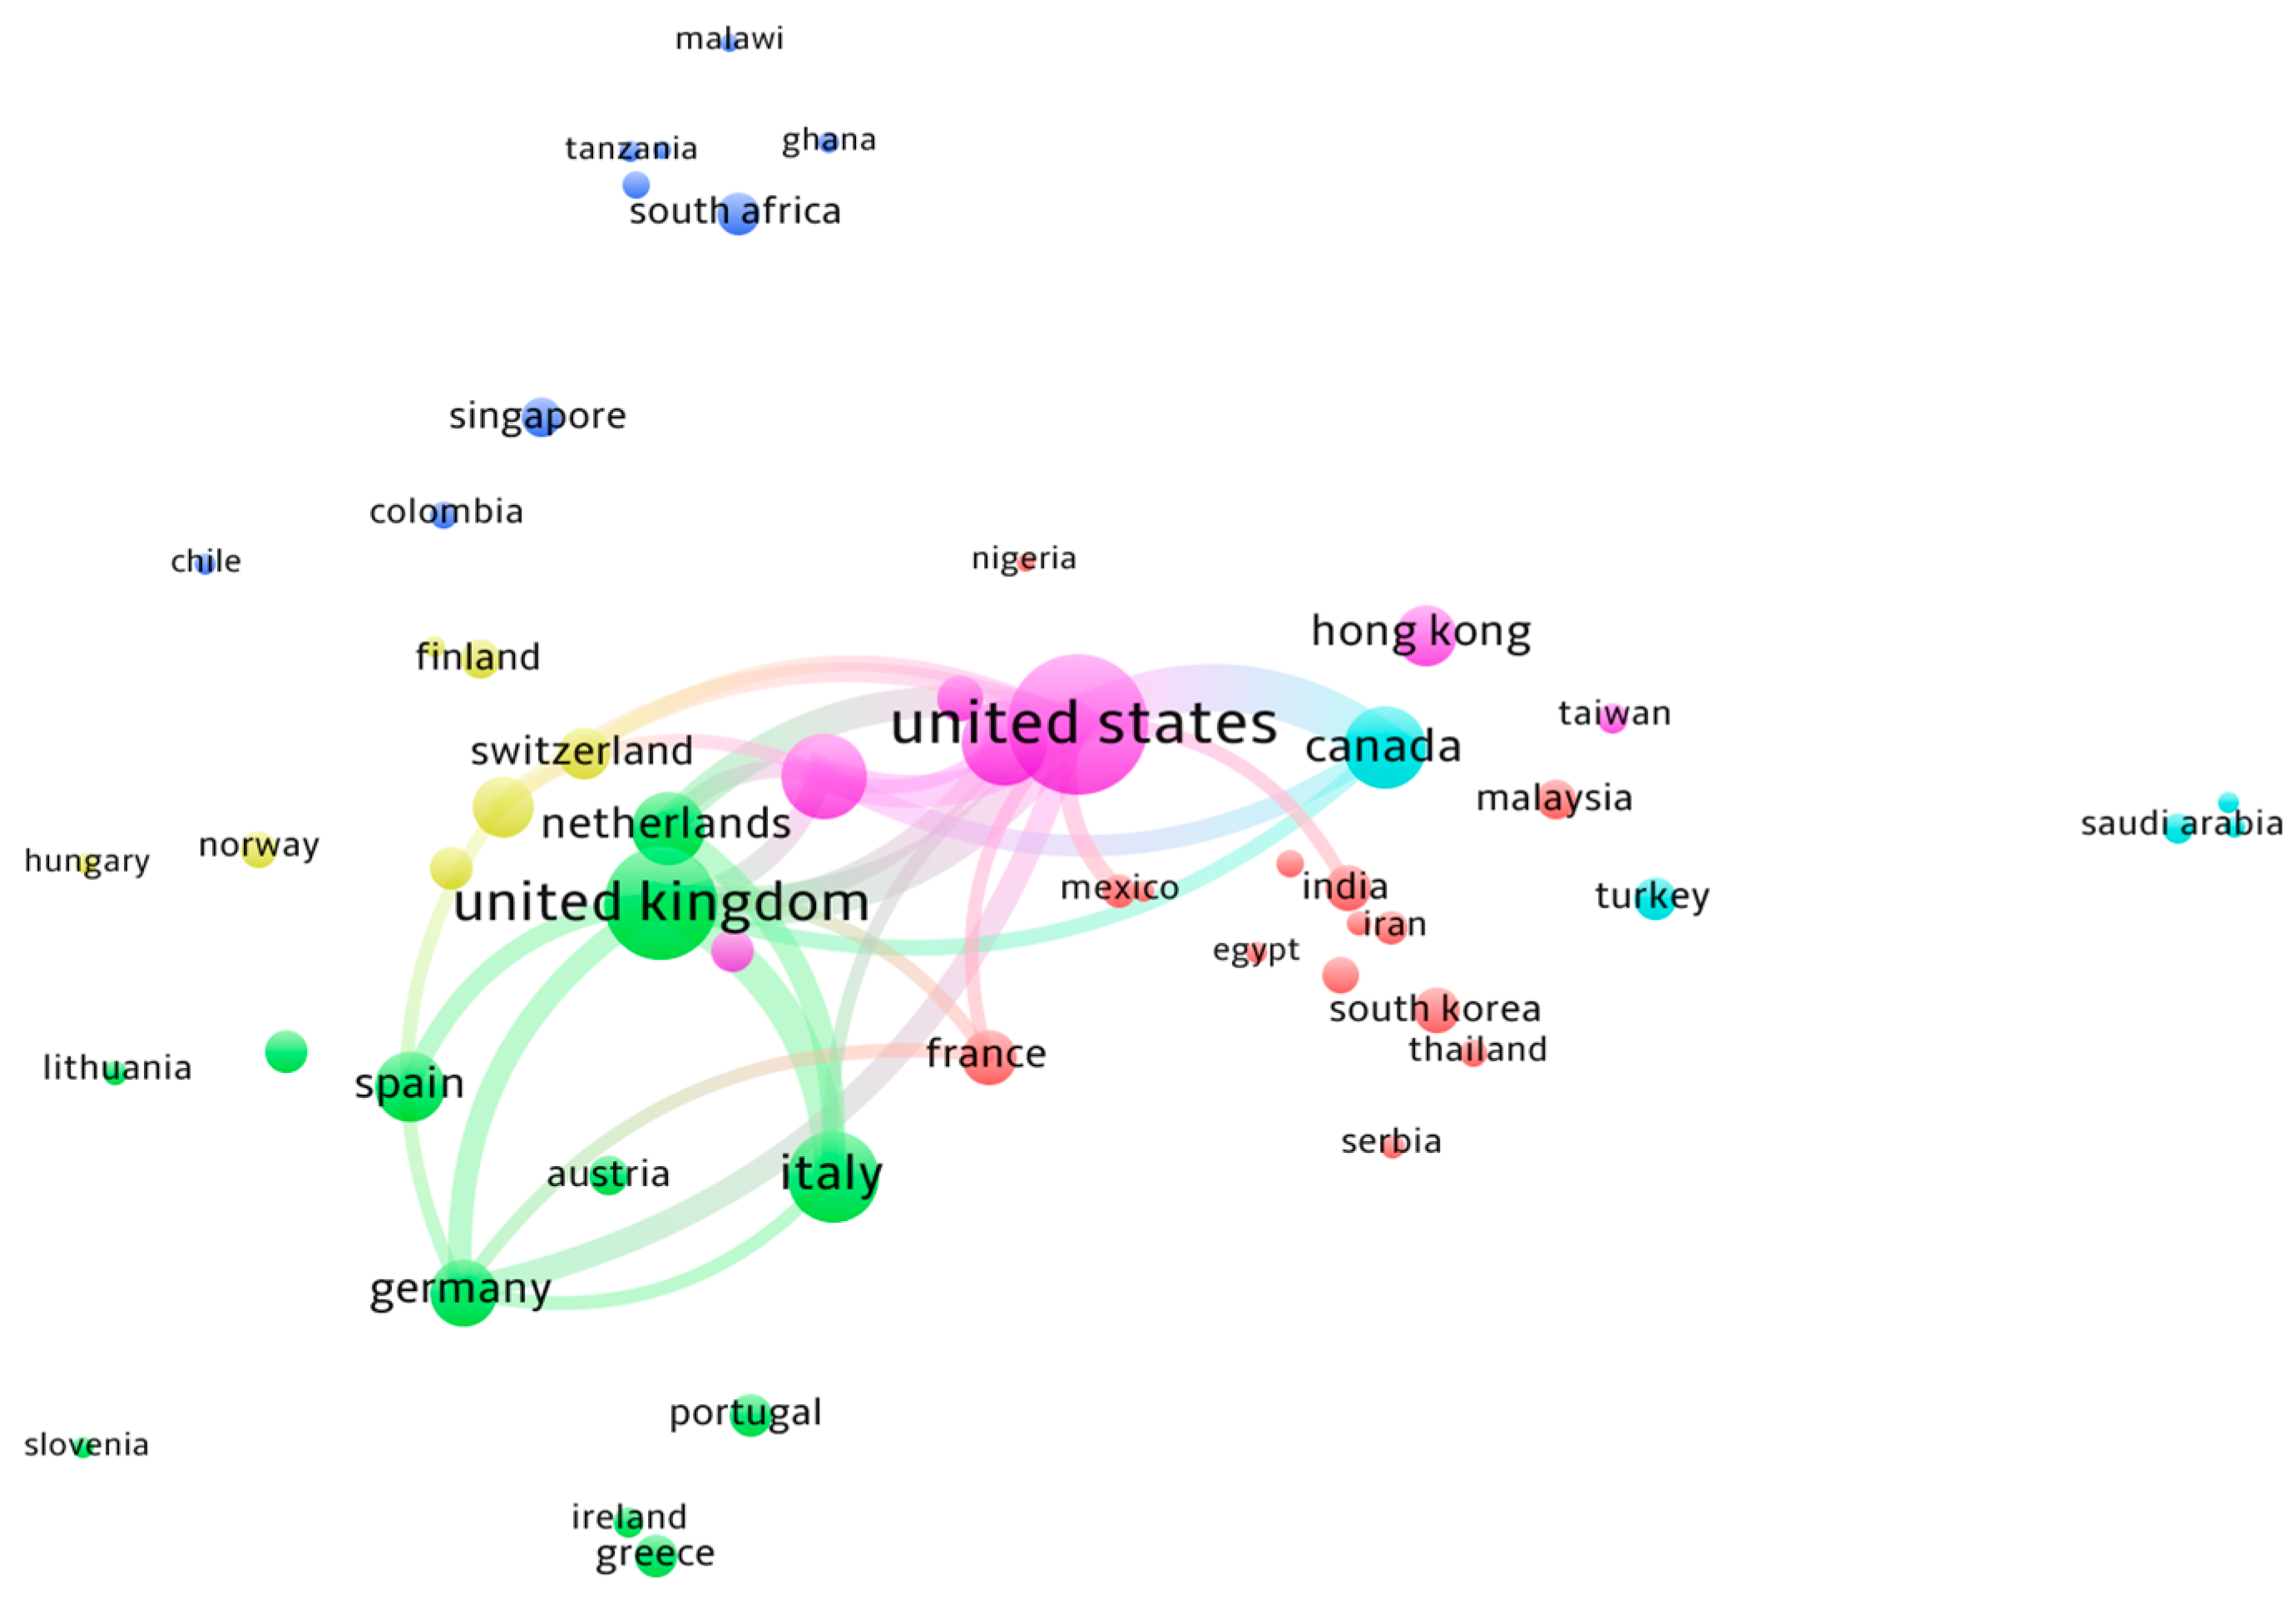
Figure 8 is a map in which the relation between different countries that share a co-author in different publications is analyzed. The map was obtained with the software VOSviewer v.1.6.5 (CWTS Leiden of Leiden University, Leiden, The Netherland) including a CSV file obtained in Scopus with the most significant terms of our search. We can see a strong relationship between the USA and Canada; also between the UK and the USA, and the UK and Italy. The exchange of information and works between developed countries and also countries that share the same language is normal, although it is obvious that English is the international language and that is no longer a barrier. We can also see some countries that have no relationship with any country in this field.
3.4. Distribution of Output in Subject Categories and Journals
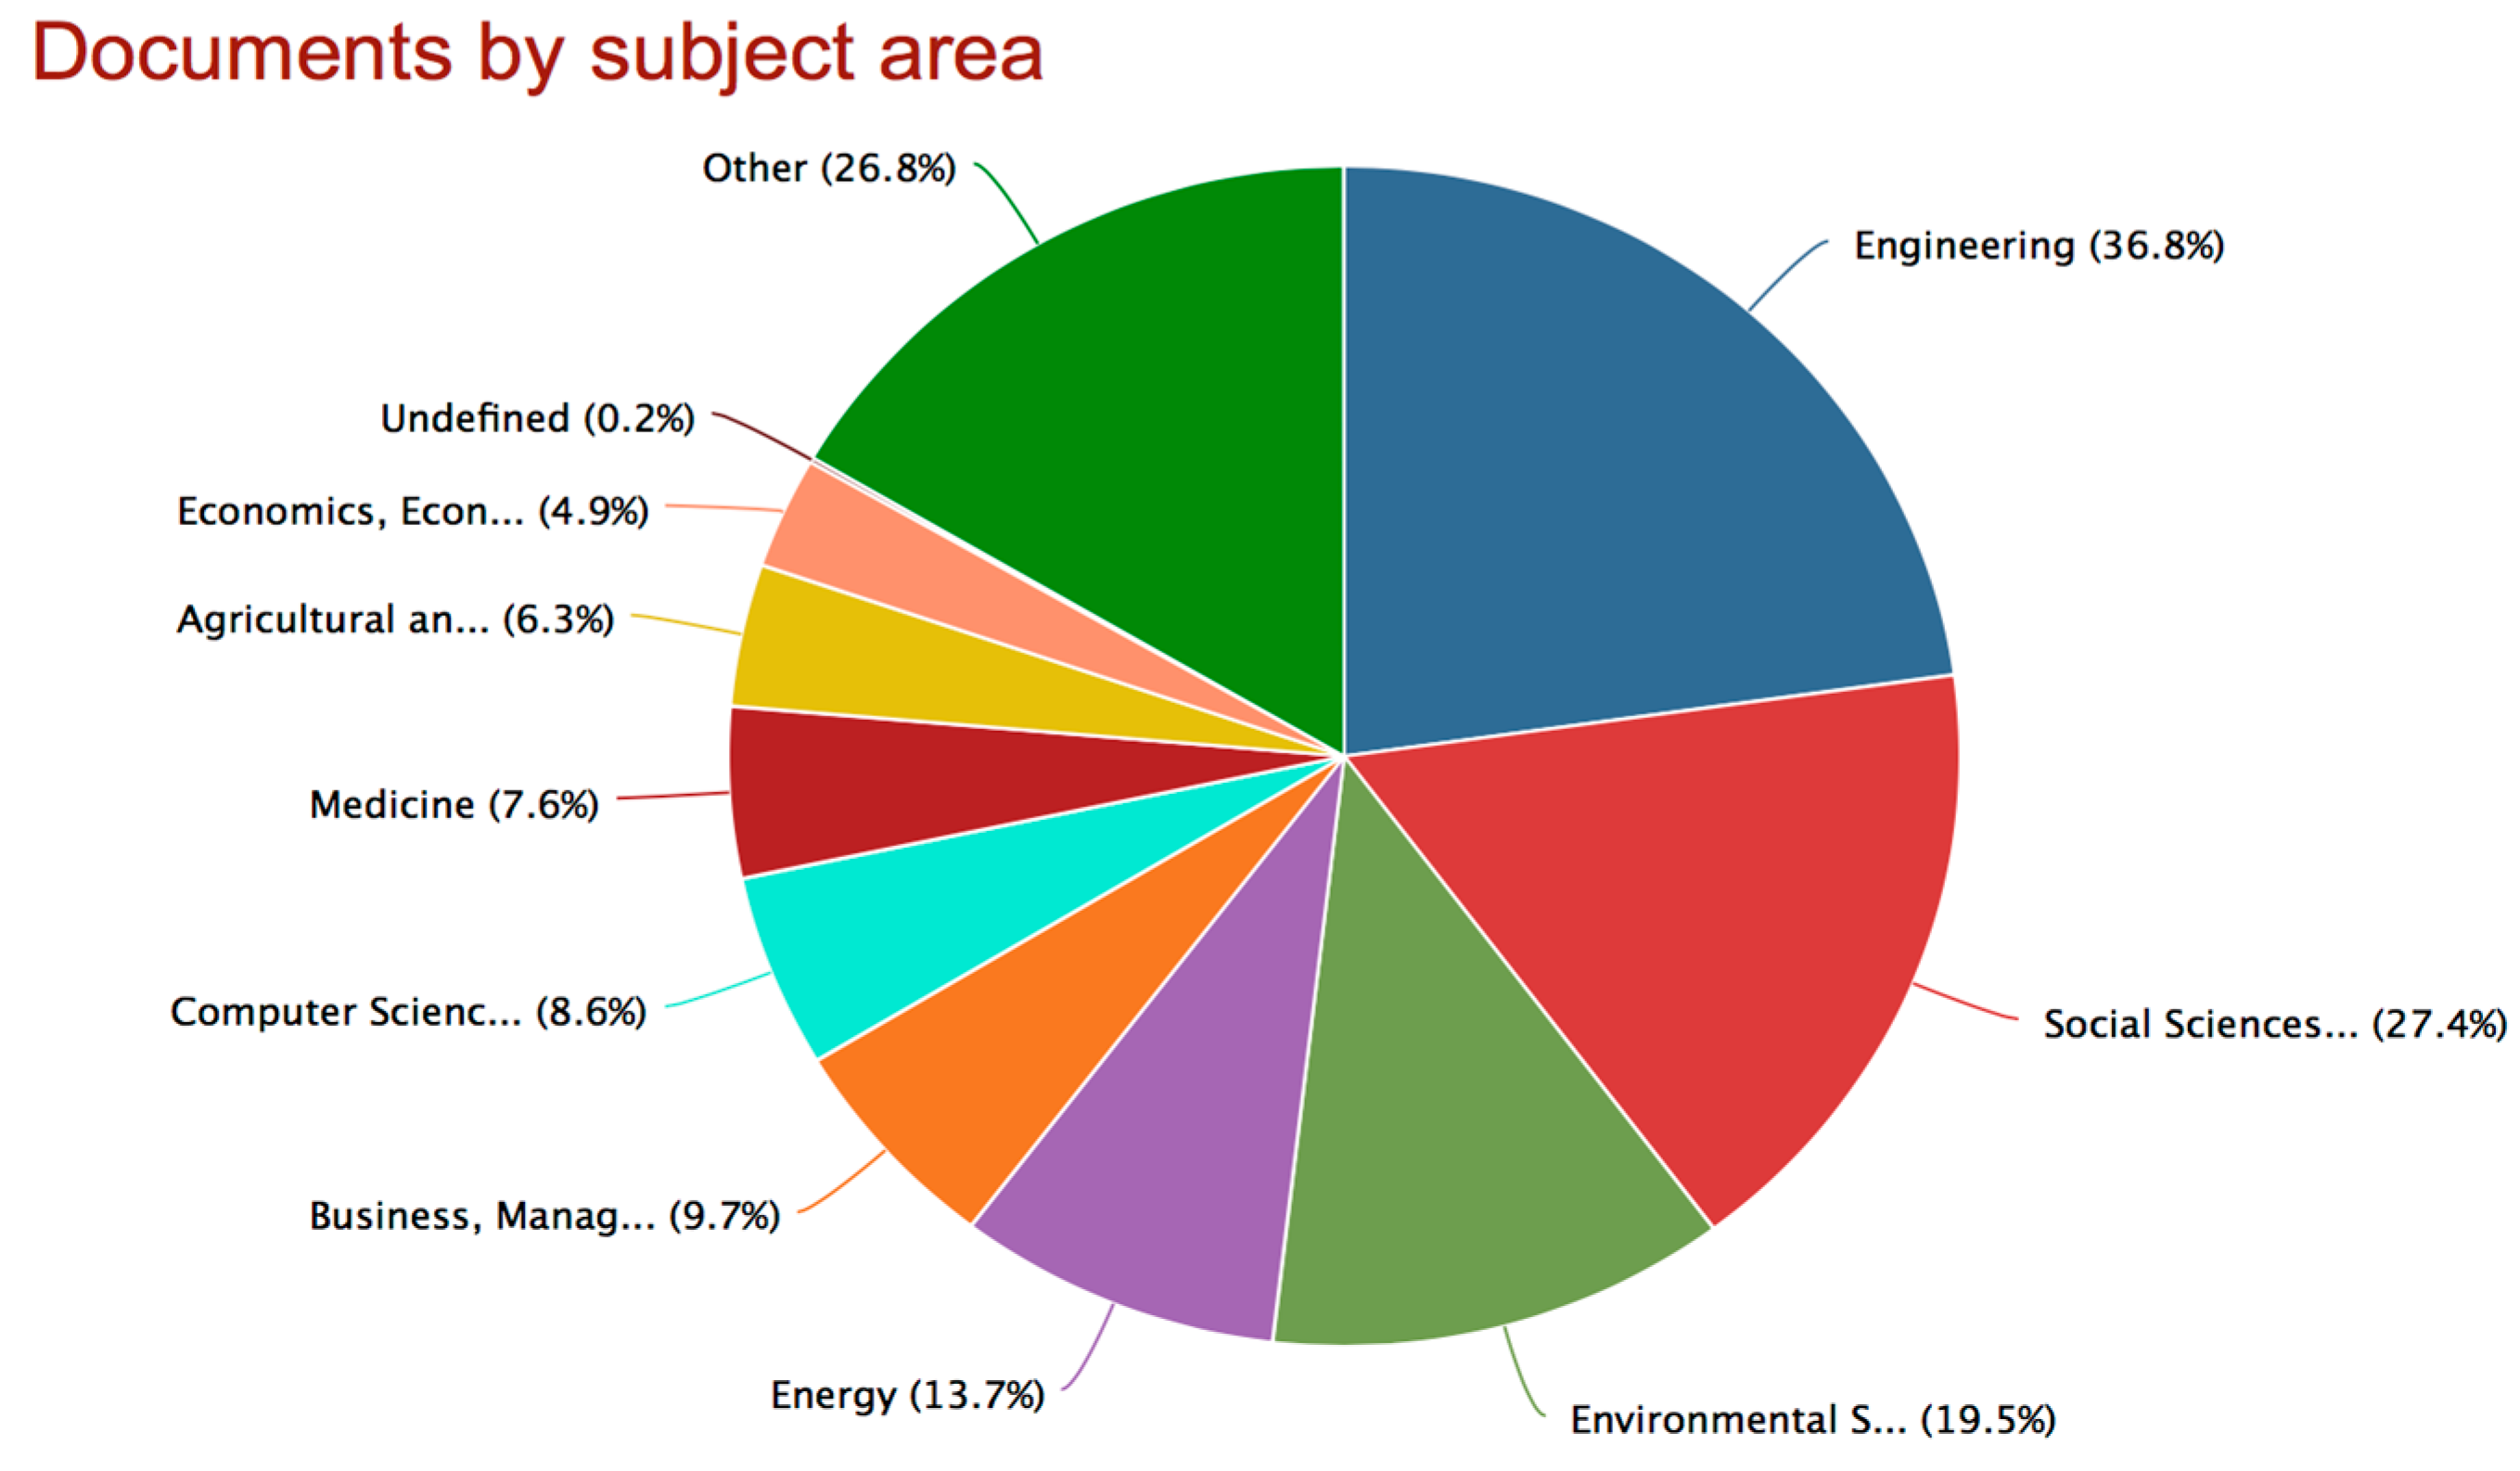
Figure 9 presents a graphic with the search results classified by subject. Engineering is the one with the highest rate (36.8%), followed by Social Sciences (27.4%) and Environmental Sciences (19.5%). We can observe an area called “Other” which includes the undefined subjects or areas.
Table 4 gives us information about the number of publications according to the subject.
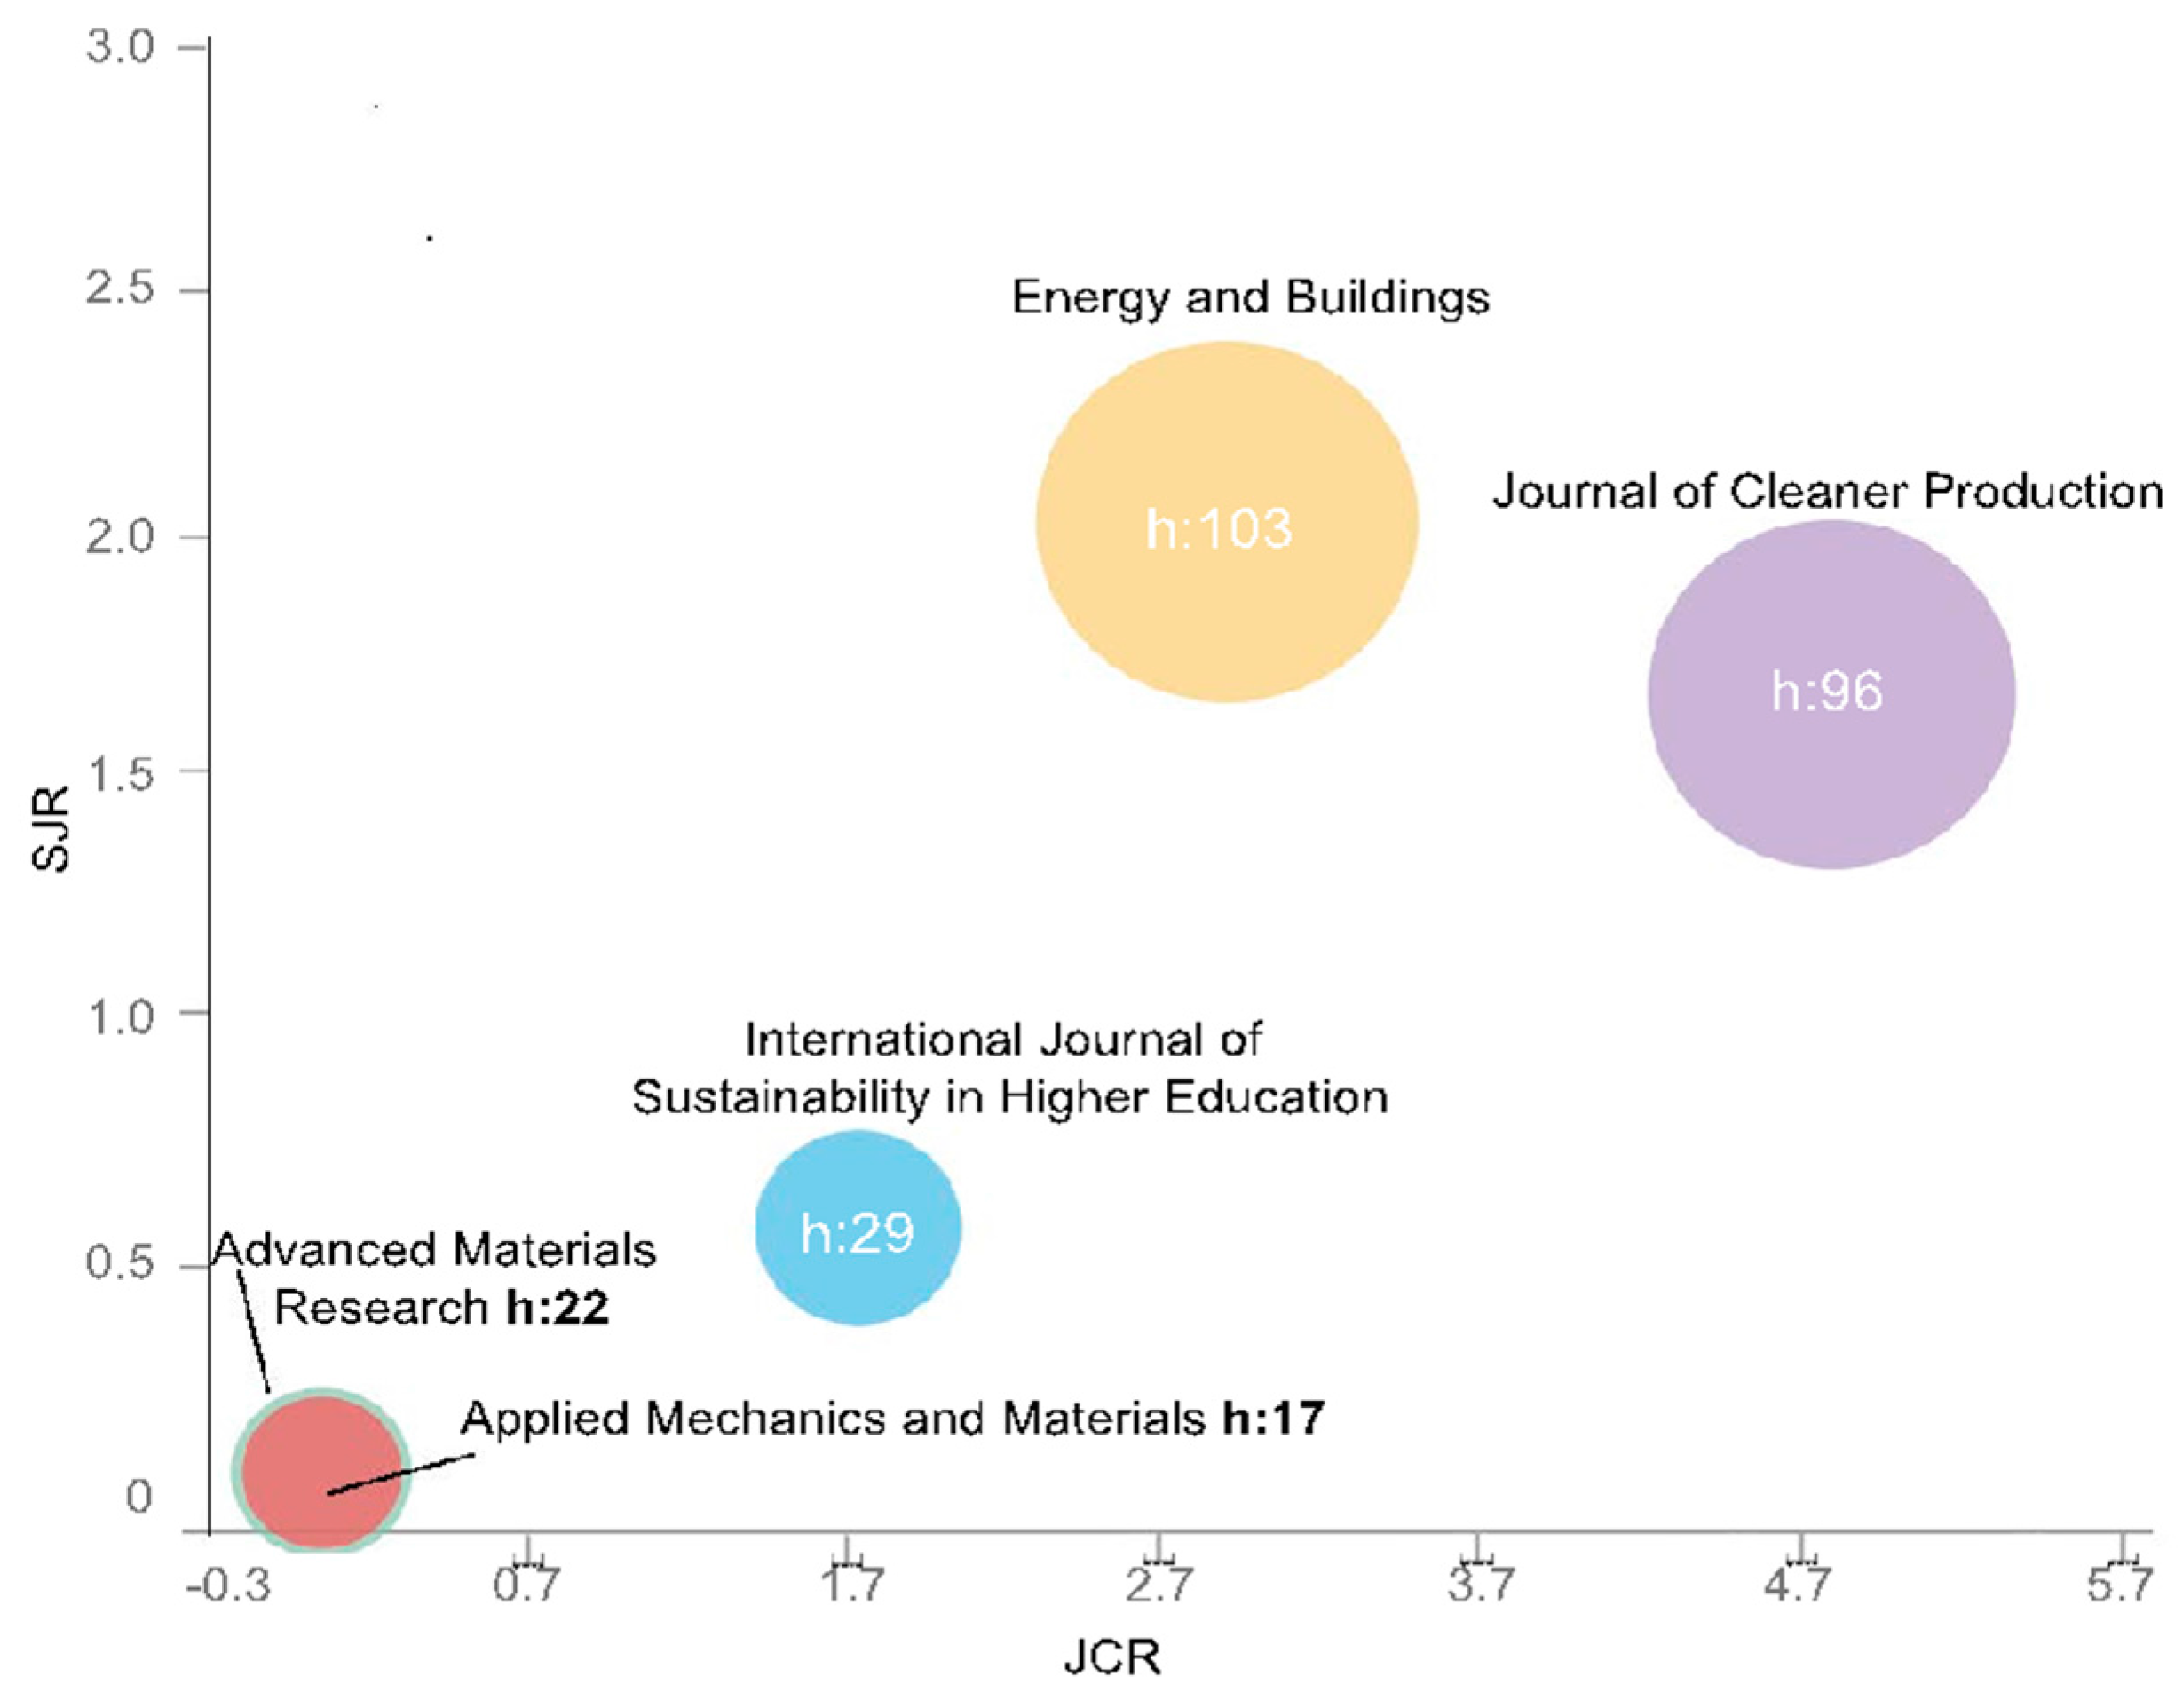
Figure 10 and
Table 5 show the top five journals in which most of the work has been published. We have presented this data through the h-index, which is the most commonly used to analyze the publication level of a journal. In first place, we have the journal
Energy and Buildings with a 103 h-index, followed by
Journal of Cleaner Production with a 96 h-index and in third place is the
International Journal of Sustainability in Higher Education with a 29 h-index. In the graph, we can see a relation between the SJR (Scientific Journal Ranking) index and the JCR (Journal Citation Report) index; we tried to obtain the most accurate data.
Today, it is necessary to combine different techniques and, above all, to look for applications of generated representations that allow us to go beyond the obvious from the analytical point of view.
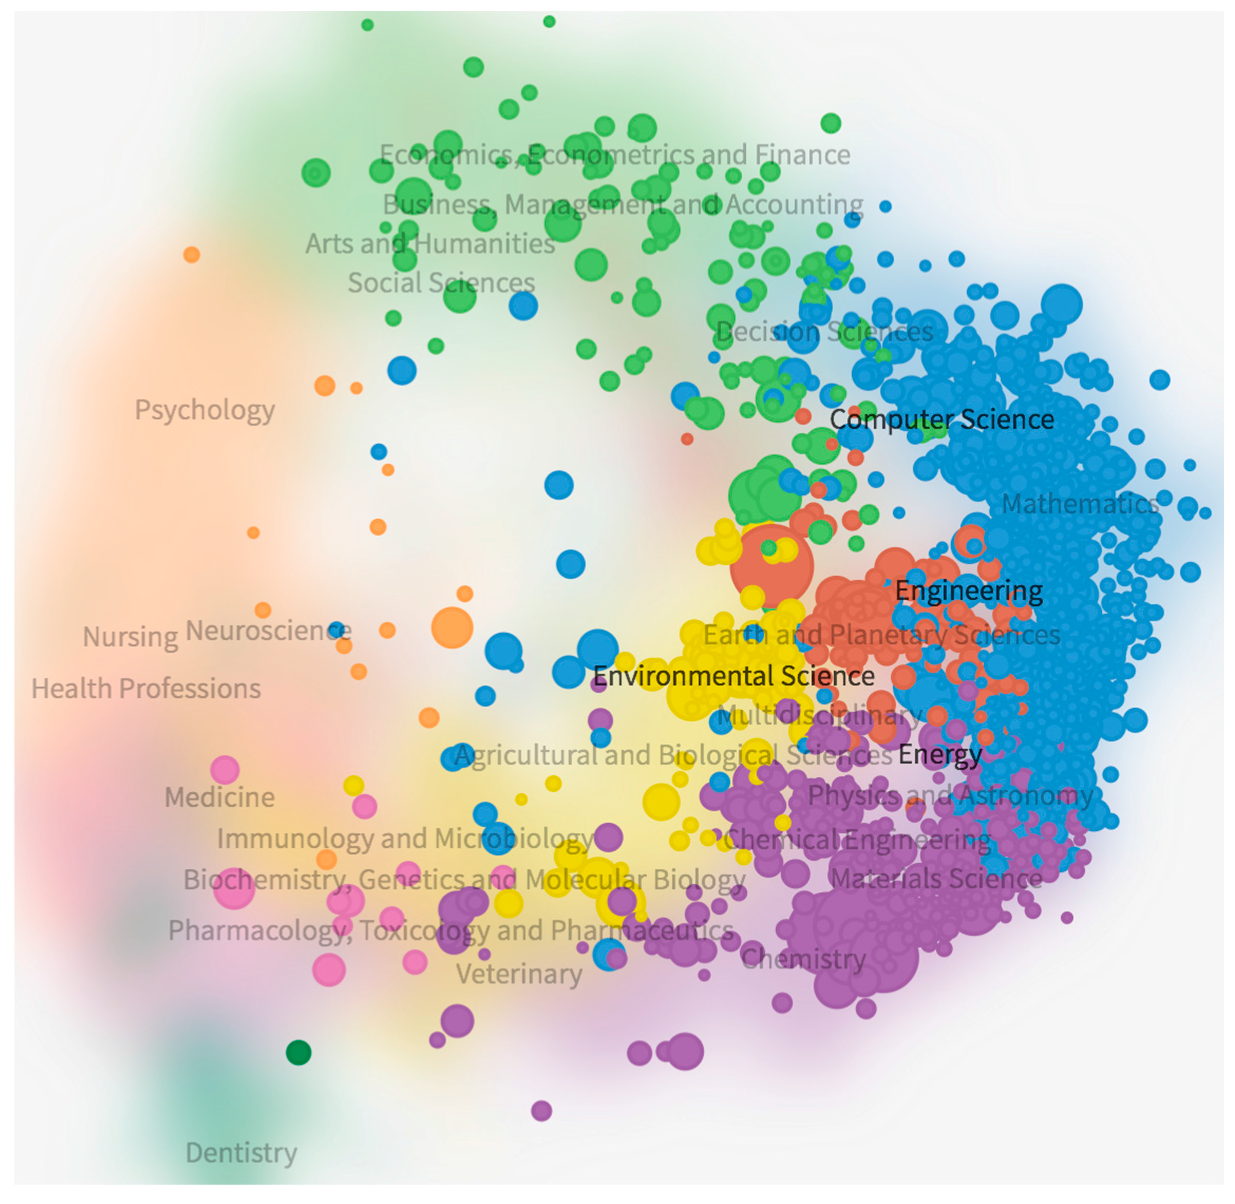
Figure 11 shows the overlay of the top journals in Environmental Science, Engineering and Energy areas at an international level, with 1597 journals being found. This graphic is a useful tool to analyze the presence of Scopus publications in the scientific domain that concerns us, as well as the global distribution of the editorial capacity of the different countries or regions.
The map is generated from the relational matrix based on citation, co-citation and bibliographic coupling that form the almost 20,000 publications (magazines and congress proceedings) registered in Scopus. The interface allows the visualization of the bibliometric indicators of the publications and the structure of clusters that they form based on their use by the authors of the works. The interface can use the overlay mapping methodology to place the subsets of selected publications in the context of the overall structure of publications. The nodes’ colors correspond to the different clusters that the algorithm detects. There is a green cluster at the top devoted primarily to the social sciences and humanities. On the left side, there is an orange cluster corresponding to Psychology, Neuroscience, Nursing and Health Professions. Below is a pinkish cluster dedicated to Medicine. At the bottom, this cluster is merged with a blue–green dedicated to Ophthalmology and Optometry, and another green of Dentistry. Then, on the right side, two clusters are observed, one yellow dedicated to the sciences of the life (Agricultural and Biological Sciences, Environmental Science...) and another purple one dedicated to Chemistry, Materials Science and Chemical Engineering. These two clusters are merged with two others, one reddish brown from Earth and Planetary Sciences and another light blue, rather elongated beginning with Physics and Astronomy, Mathematics, Computer Science and ending with Decision Sciences when it merges with Economics, Econometrics and Finance. It is observed that the main group of magazines is in the right part of the thread, which matches with the areas of Environmental Science, Engineering, Computer Science and Energy.
3.5. Analysis of Authors and Keywords
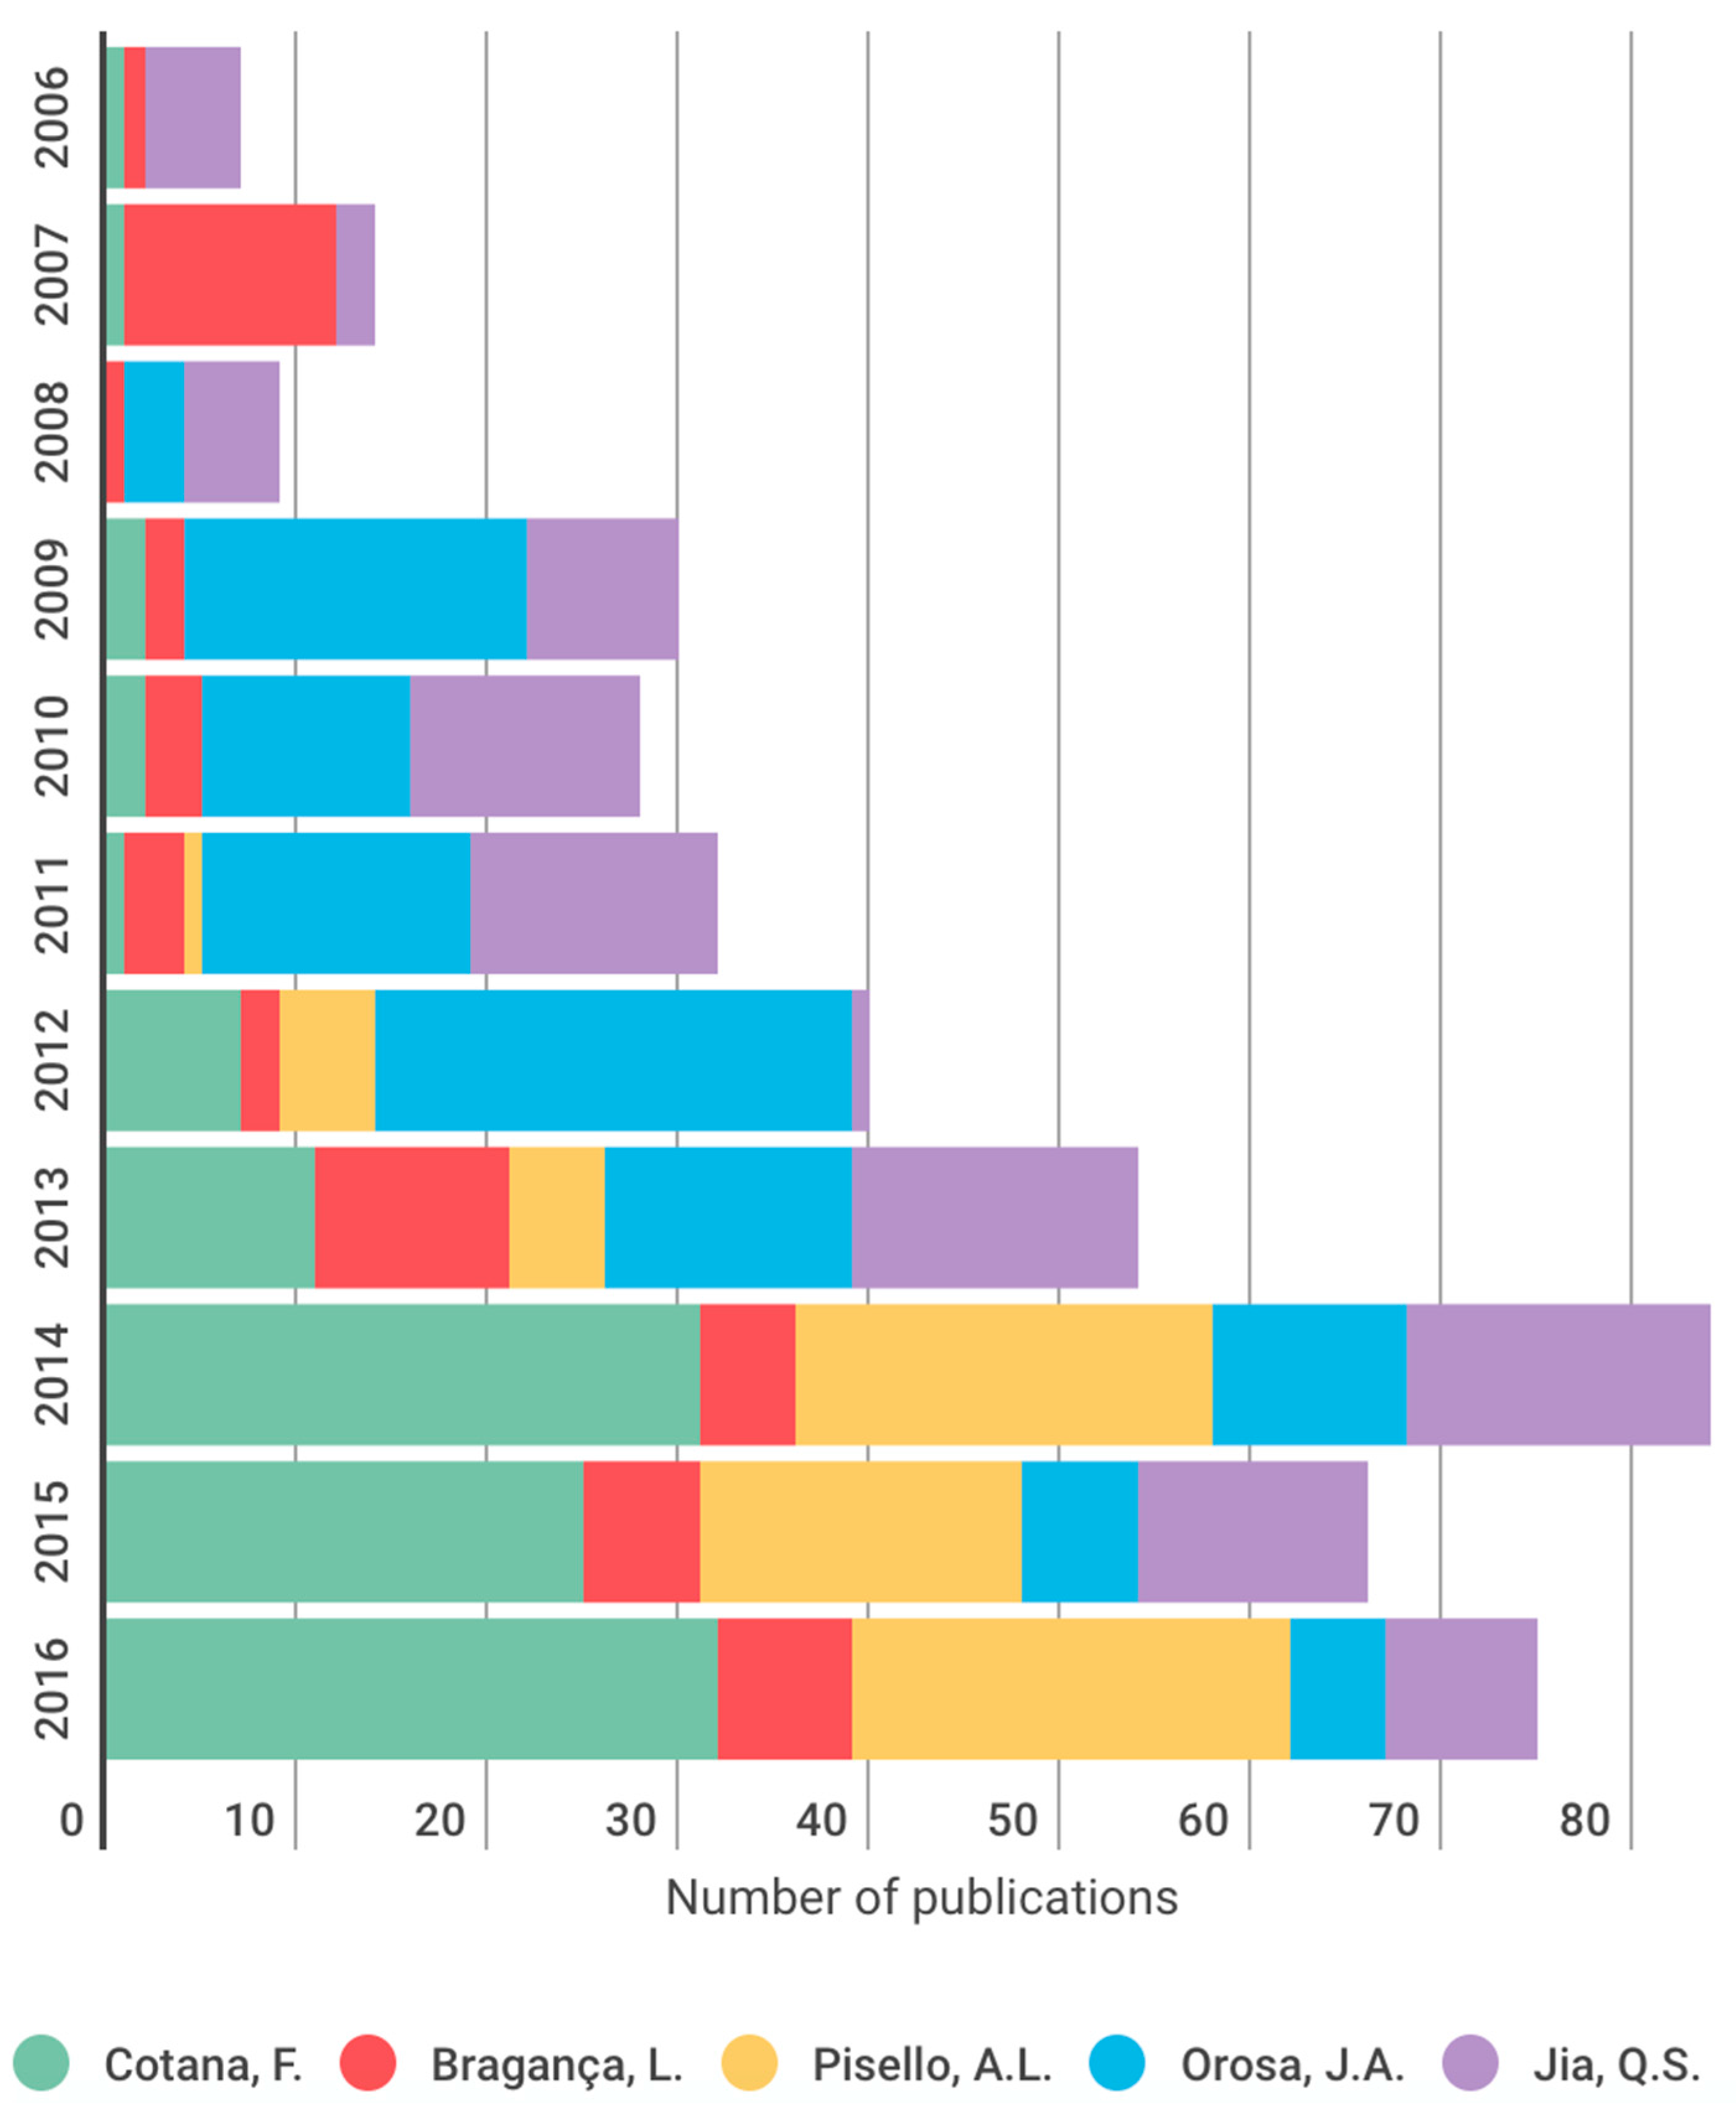
Figure 12 and
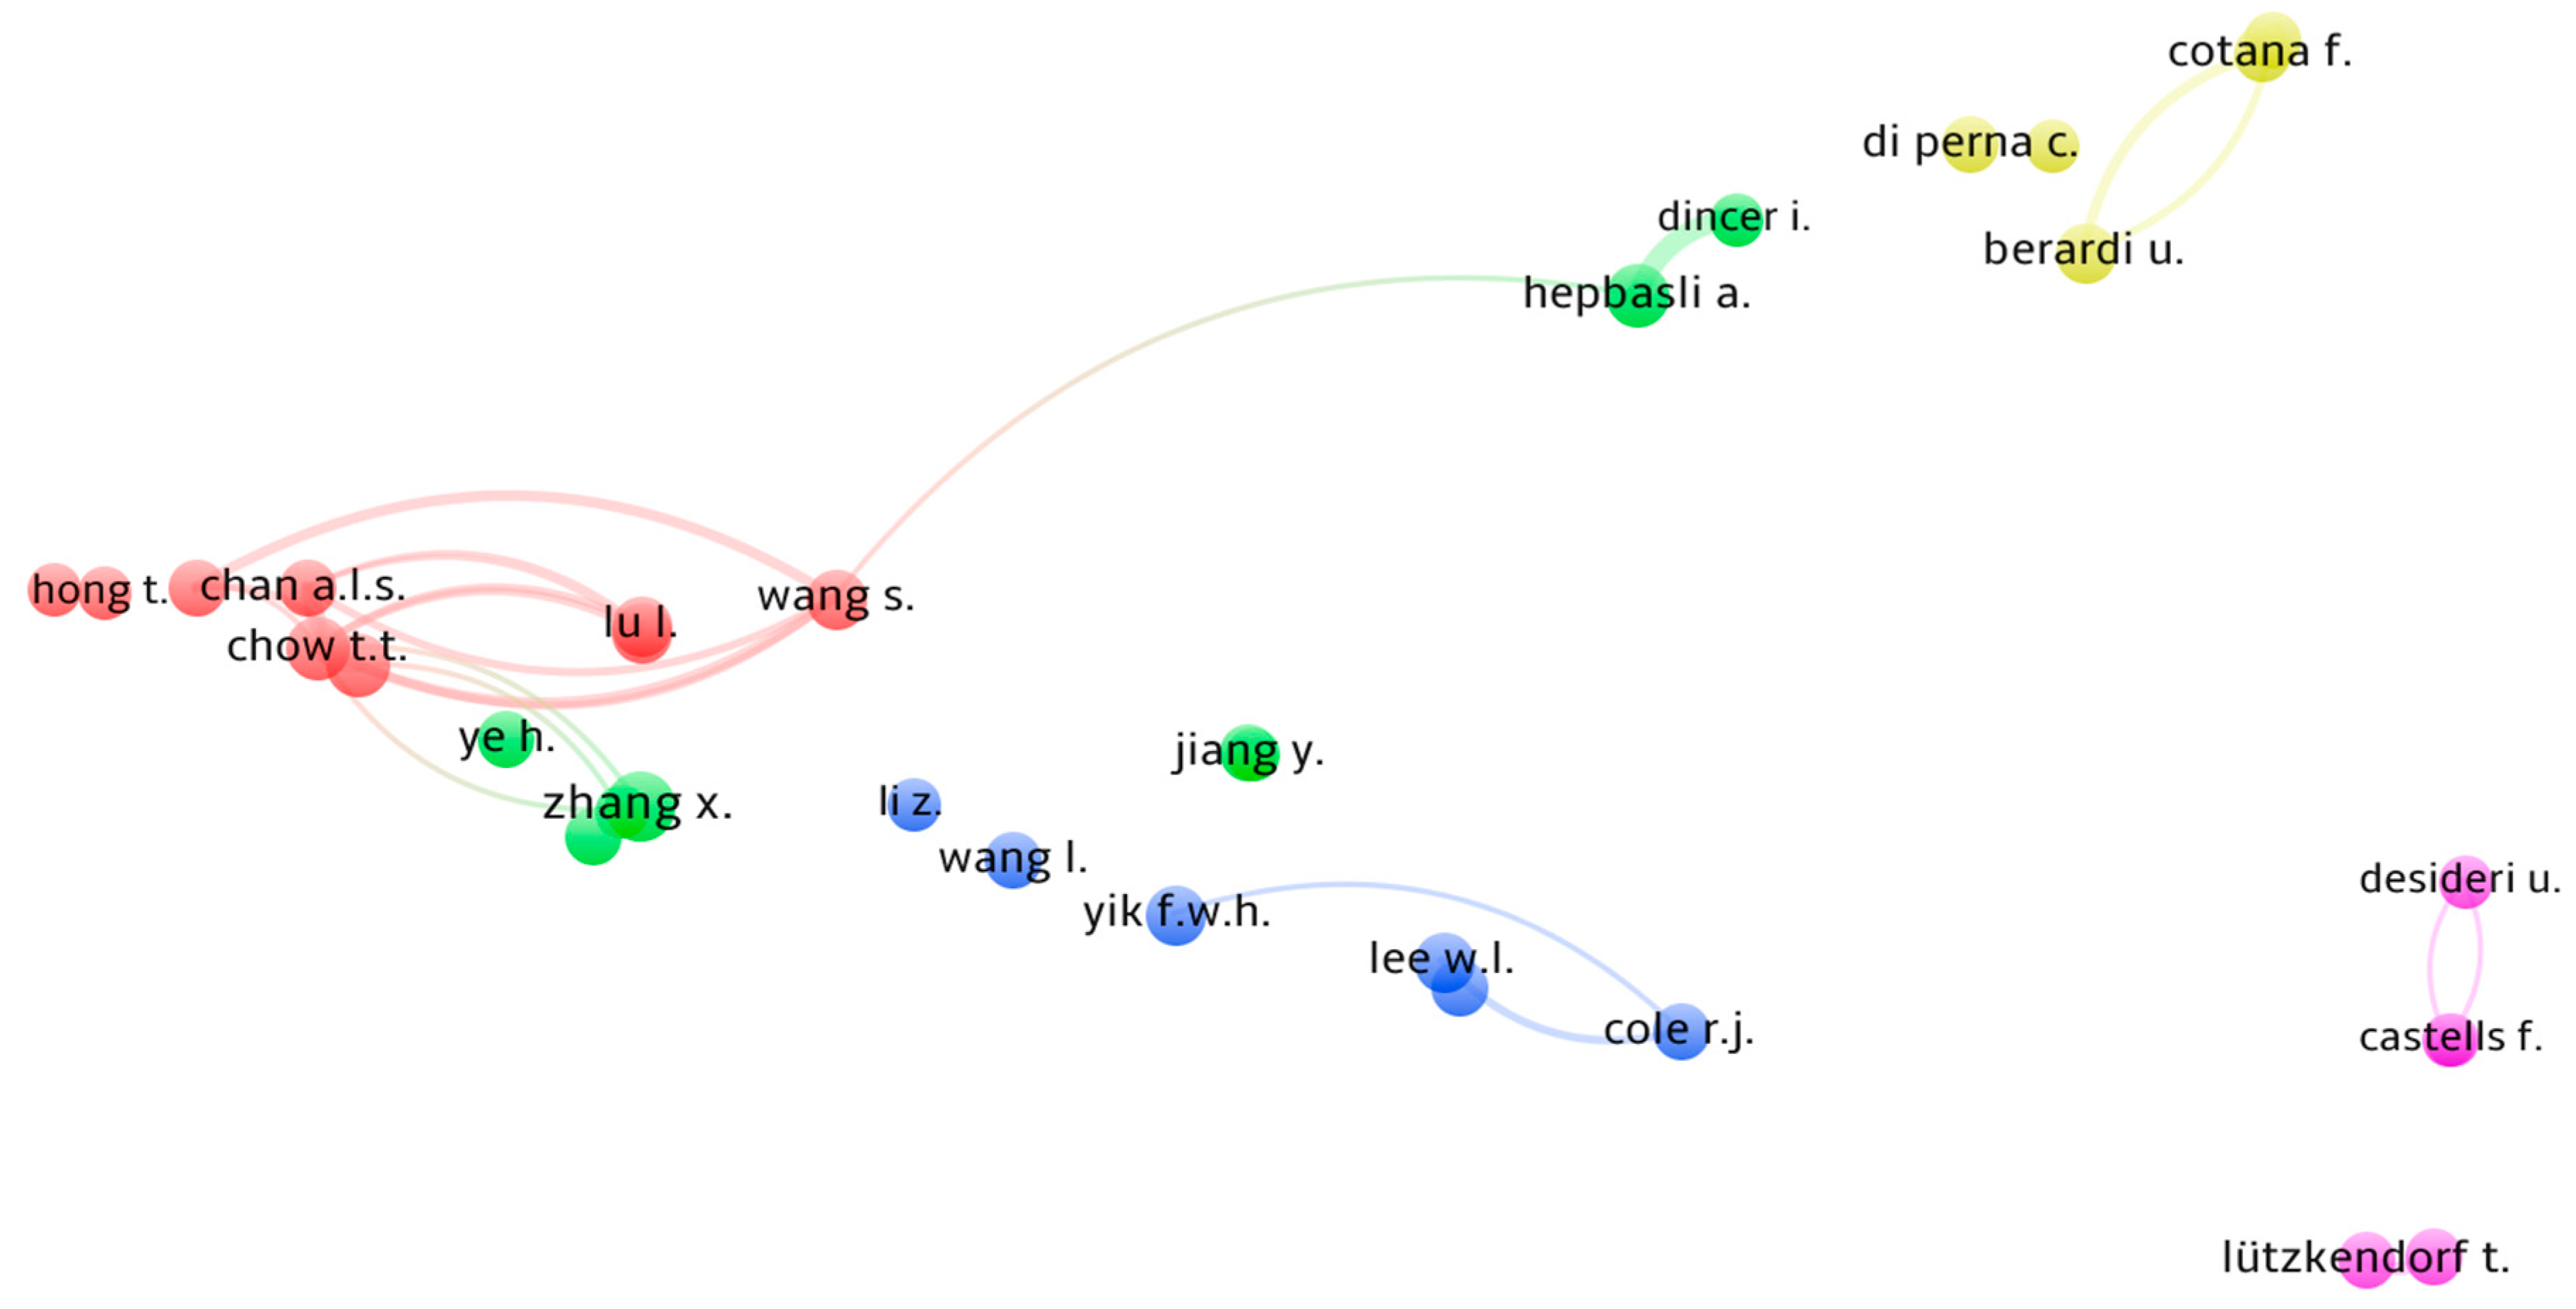
Table 6 show the five most relevant authors in the field of sustainability in the last 10 years. It can be clearly observed that Cotana, F. is at the top of the ranking with 113 publications since 2006. This author has an h-index 18 and most of his works have been published by the Universita degli Studi di Perugia. Following him is Orosa, J.A. with 105 works. This author of the University of Coruña has an h-index of 13, while Jia, Q.S., Pisello, A.L. and Bragança, L. have published a total of 97, 73 and 51 articles respectively in the period 2006–2016. It is also observed how in recent years there has been a significant increase in the number of publications on the issue at hand. A relevant fact that supports this assertion is that the sum of publications over the last three years accounted for more than 50% of all publications in the last decade. In 2014, a total of 84 publications were obtained among the works of the five most relevant authors.
In
Figure 13, the relation between co-authors who collaborated with the most important authors of
Table 6 are shown. We can see a more frequent relationship between Asian authors, probably because of the language and the close distance of their institutions.
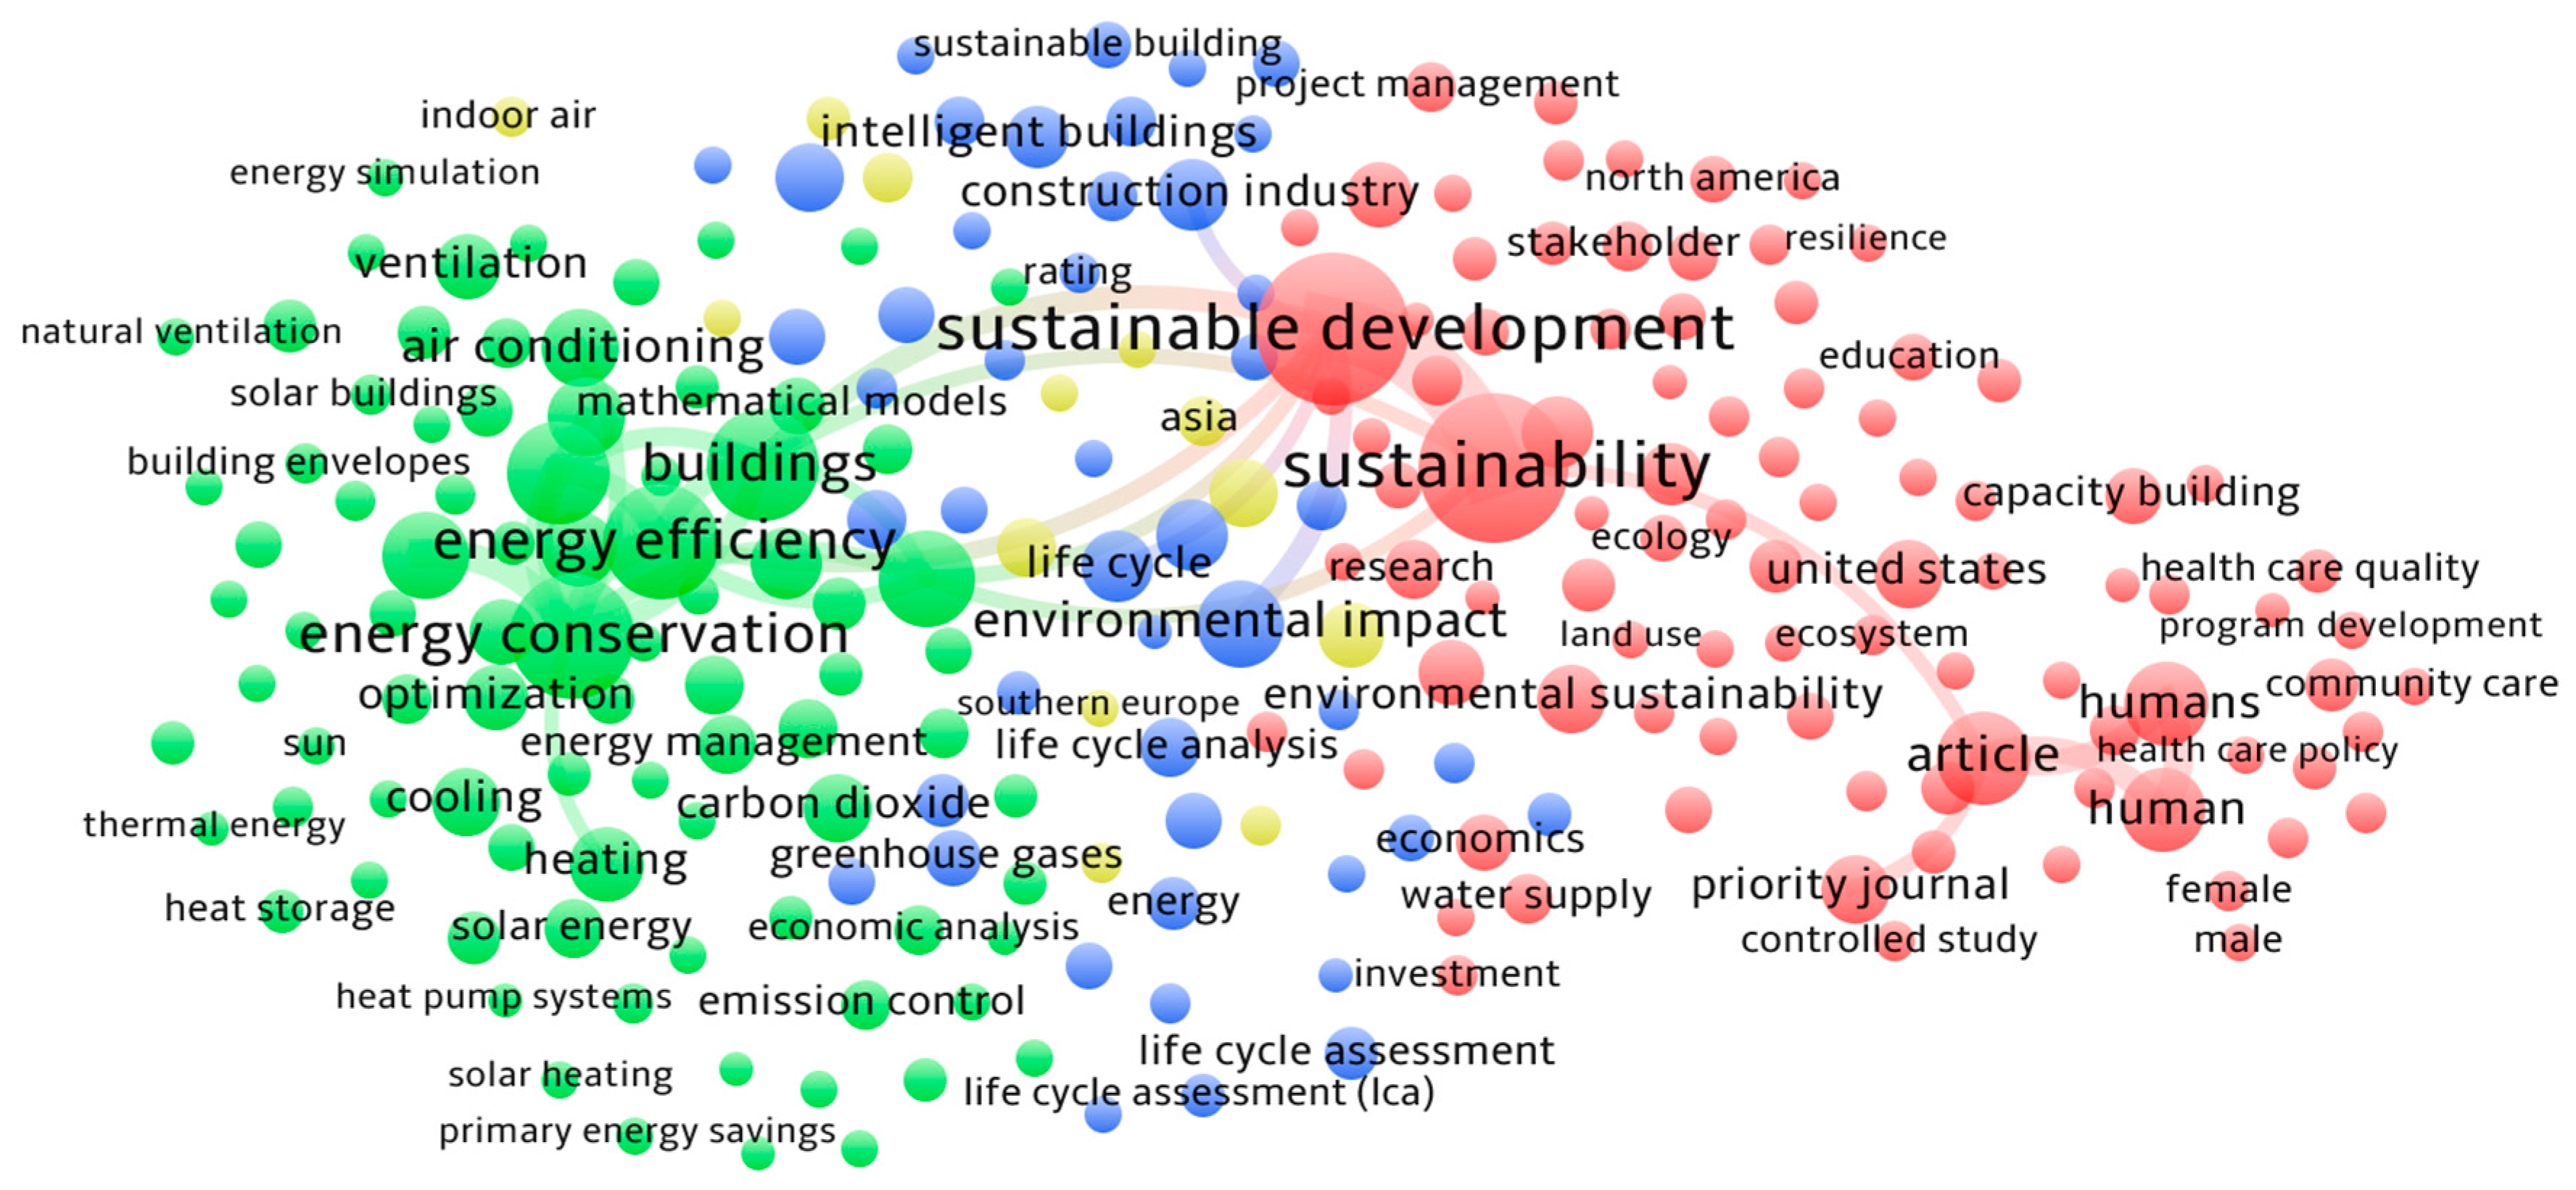
It is important to analyze the keywords used in the search, in order to specify which branches and areas have been taken into account in the work. In total, our search resulted in 26,644 items in the last 40 years. The keyword “Sustainable Development” was present in 6679 items (25.1%). This was followed by “Sustainability” with 5864 (22%) and “Energy Conservation” with 3512 (13.2%).
Table 7 shows the 40 most relevant keywords during the analyzed period.
The analysis of keywords in scientific articles is of great interest for the follow-up and search of tendencies in the branches of science and engineering. In order to obtain the aforementioned data, it was necessary to carry out a process of filtering in the data provided by Scopus. It should be remarked that numerous variants, depending on how each author writes the keyword, were detected. For example, “ENERGY” can be written as “Energy”, “energy”, “Energies” or “energies”, giving rise to different versions of the same concept. For example, in our table, the first position was the concept “Sustainable Development” and the second one “Sustainability”; both concepts would have aspects in common, although they do not have the same meaning at all.
A string with a combination of different keywords was used to determine the number of scientific publications in this field. The first term to include in the search was “sustainability”, then other concepts such as “energy saving”, “building” and many more; it was necessary to evaluate the possibility of including quite similar terms such as “school” and “university” in order to encompass the term “public use building”. The string of terms tried to be specific to each concept, as follows: TITLE ({sustainability}) OR ABS ({sustainability}) OR AUTHKEY ({sustainability}) OR TITLE ({energy saving}) OR ABS ({energy saving}) OR AUTHKEY ({energy saving}) AND TITLE ({building}) OR ABS ({building}) OR AUTHKEY ({building}) OR TITLE ({buildings}) OR ABS ({buildings}) OR AUTHKEY ({buildings}) OR TITLE ({school}) OR ABS ({school}) OR AUTHKEY ({school}) OR TITLE ({schools}) OR ABS ({schools}) OR AUTHKEY ({schools}) OR TITLE ({office}) OR ABS ({office}) OR AUTHKEY ({office}) OR TITLE ({offices}) OR ABS ({offices}) OR AUTHKEY ({offices}) OR TITLE ({university}) OR ABS ({university}) OR AUTHKEY ({university}) OR TITLE ({universities}) OR ABS ({universities}) OR AUTHKEY ({universities}) OR TITLE ({public buildings}) OR ABS ({public buildings}) OR AUTHKEY ({public buildings}) OR TITLE ({public building}) OR ABS ({public building}) OR AUTHKEY ({public building}).
Figure 14 shows a map of the most common keywords that our search revealed. They are divided by their field, indicated by colours. We can see that the biggest circles represent the more frequent terms such as “sustainable development”, “sustainability”, “energy conservation”, “energy efficiency” and “buildings”. Also, the lines that link the circles represent the connection between keywords through different articles or publications.
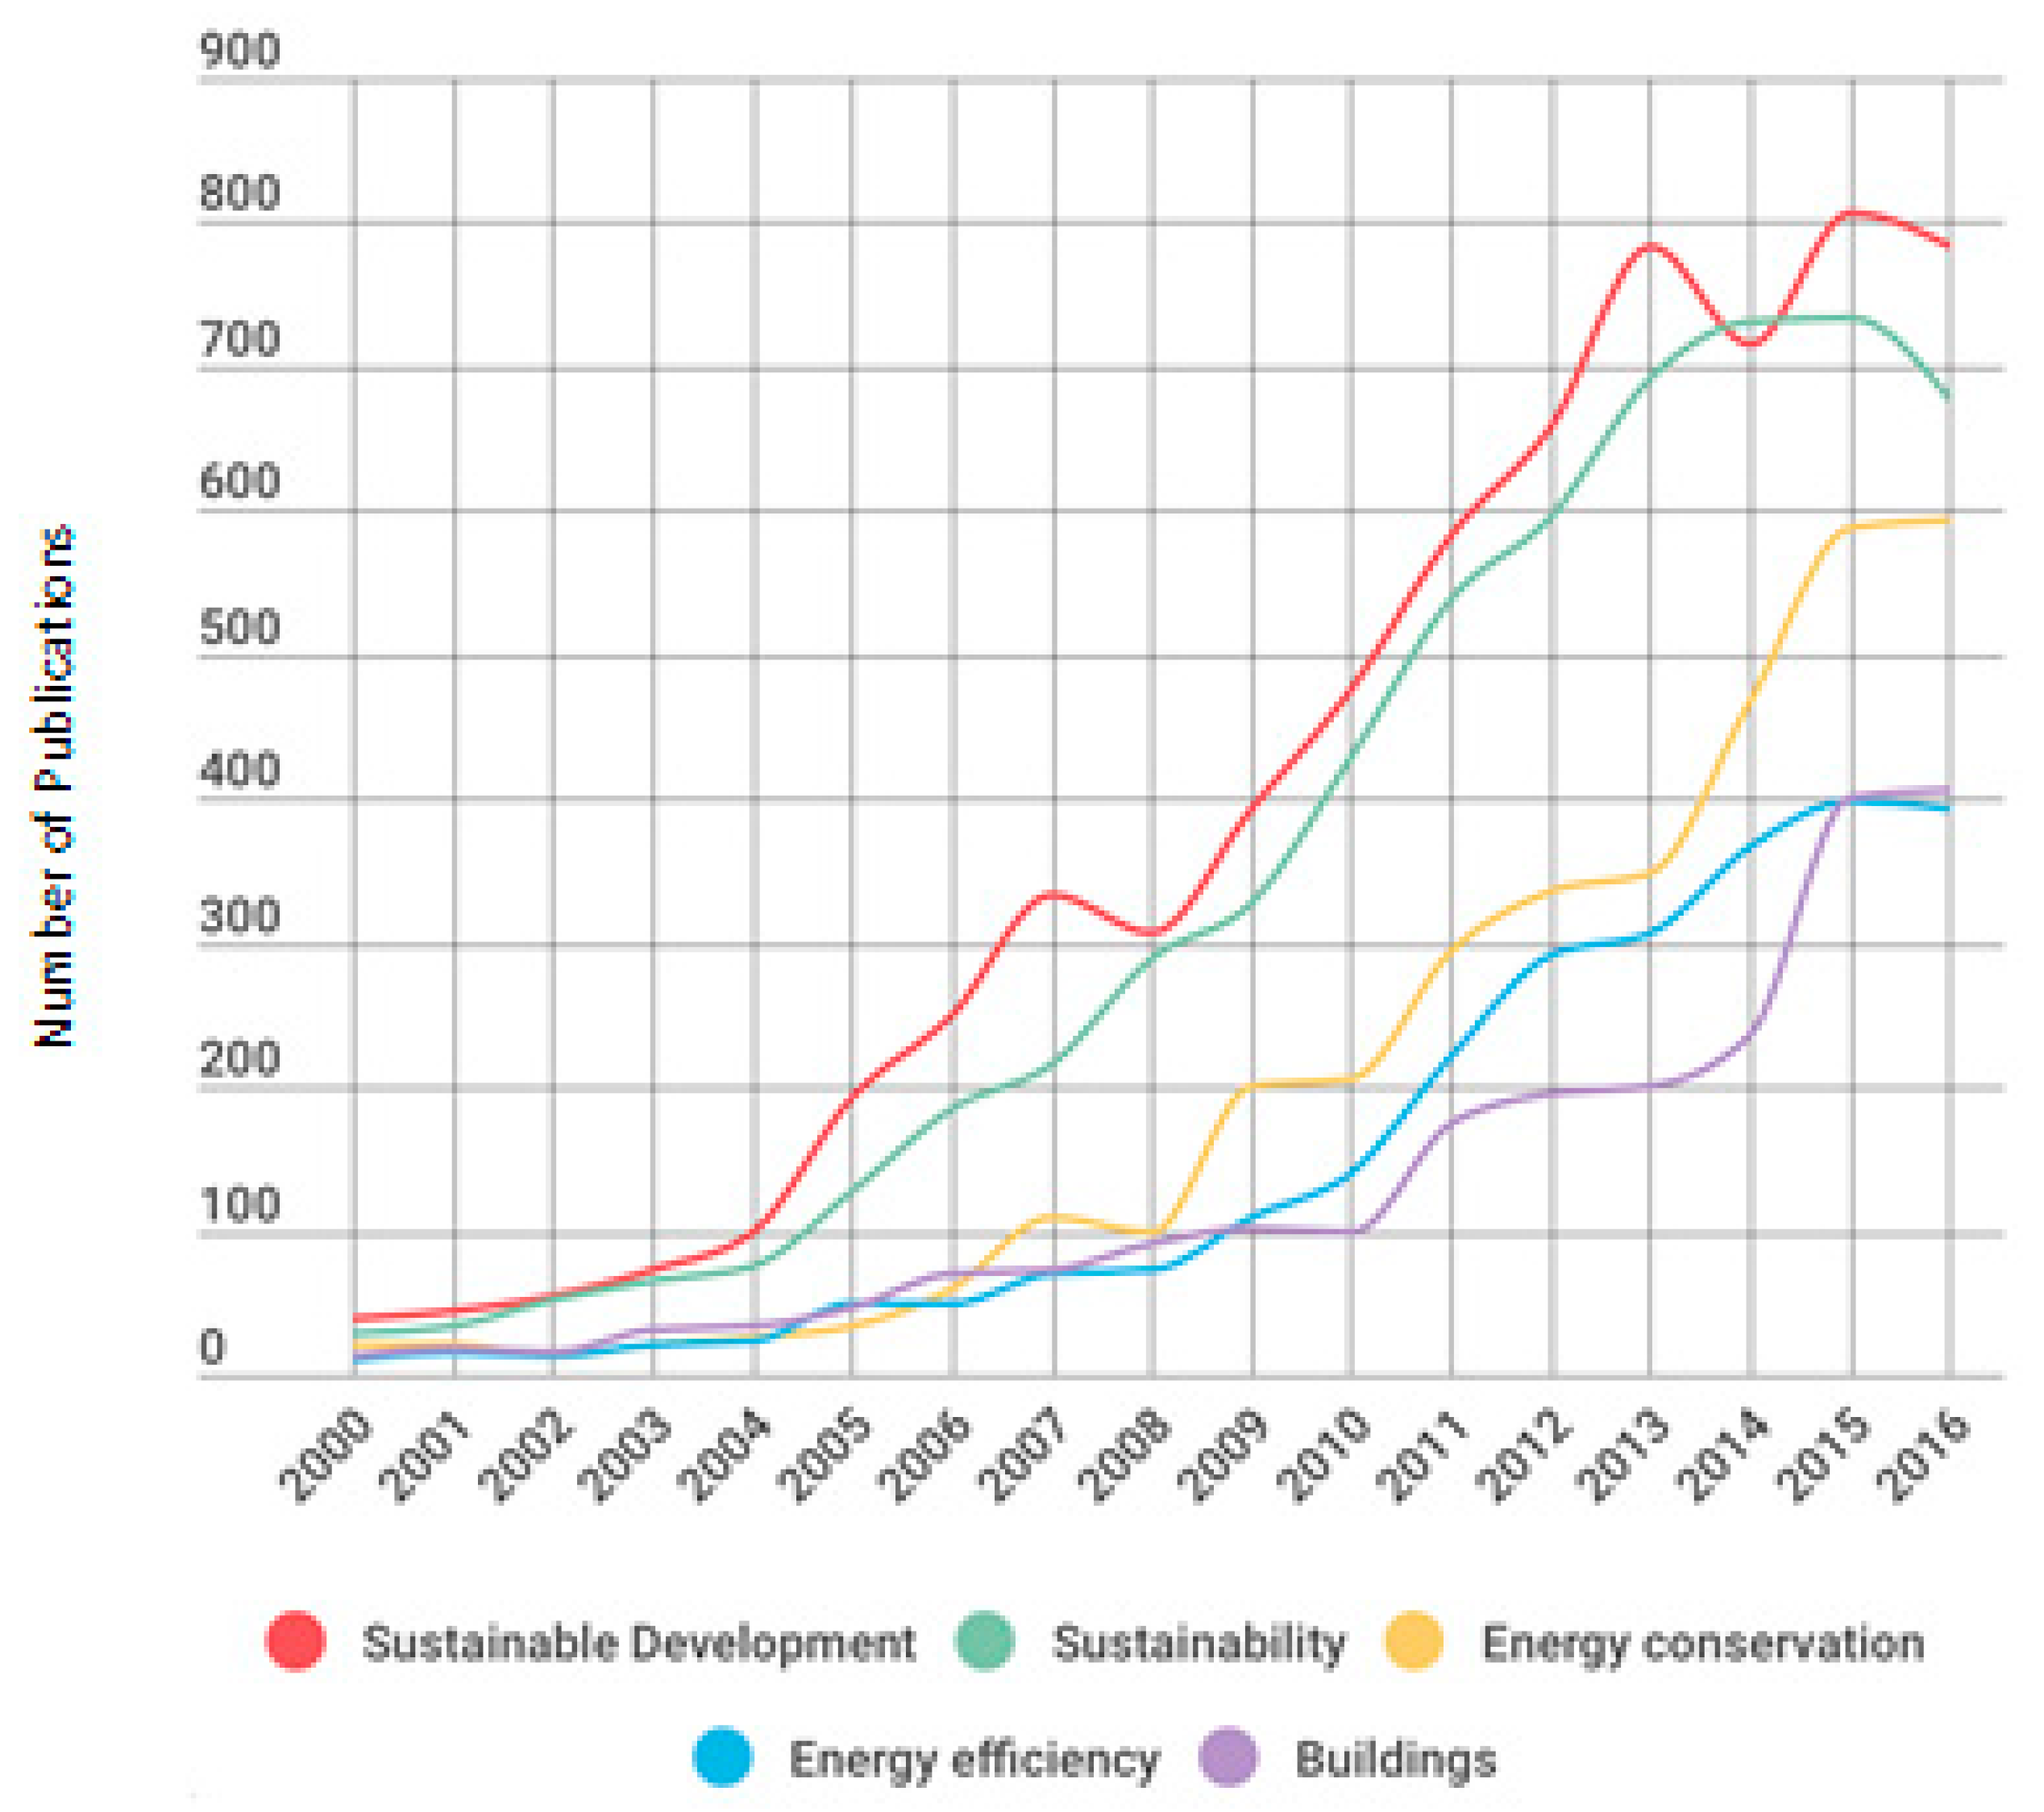
Figure 15 shows a trend graph of these five terms throughout the analyzed period. There is an evident inclination in the use of the first two terms, where the term sustainability appears. Sustainability is a narrow area of equilibrium in the complex relationship between the environment, the economy and society [
39].
These two keywords are followed by “energy conservation” and “energy efficiency”, which are also related to sustainability. Although these terms are commonly joined together, they have very different meanings. While energy conservation involves sacrificing the quality of energy services and well-being to reduce energy consumption, energy efficiency is related to saving, producing more with less energy, without affecting the comfort factor [
40]. The clear upward trend is observed at the beginning of 2004 and this evolution continues until 2015, when the growth tends to stagnate or fall. This shows that the terms used are replaced by others in the most recent year, although the topics treated continue to be of great interest to the scientific community.
4. Discussion and Conclusions
A search was made for energy saving and transport, to compare it later with the search of energy saving and buildings. The transportation sector is characterized by a high consumption of fossil fuels and a strong environmental impact [
41]. Some countries have policies to promote electric vehicles as an alternative to reduce and limit fossil fuel consumption and move towards the sustainability of the transport sector [
41].
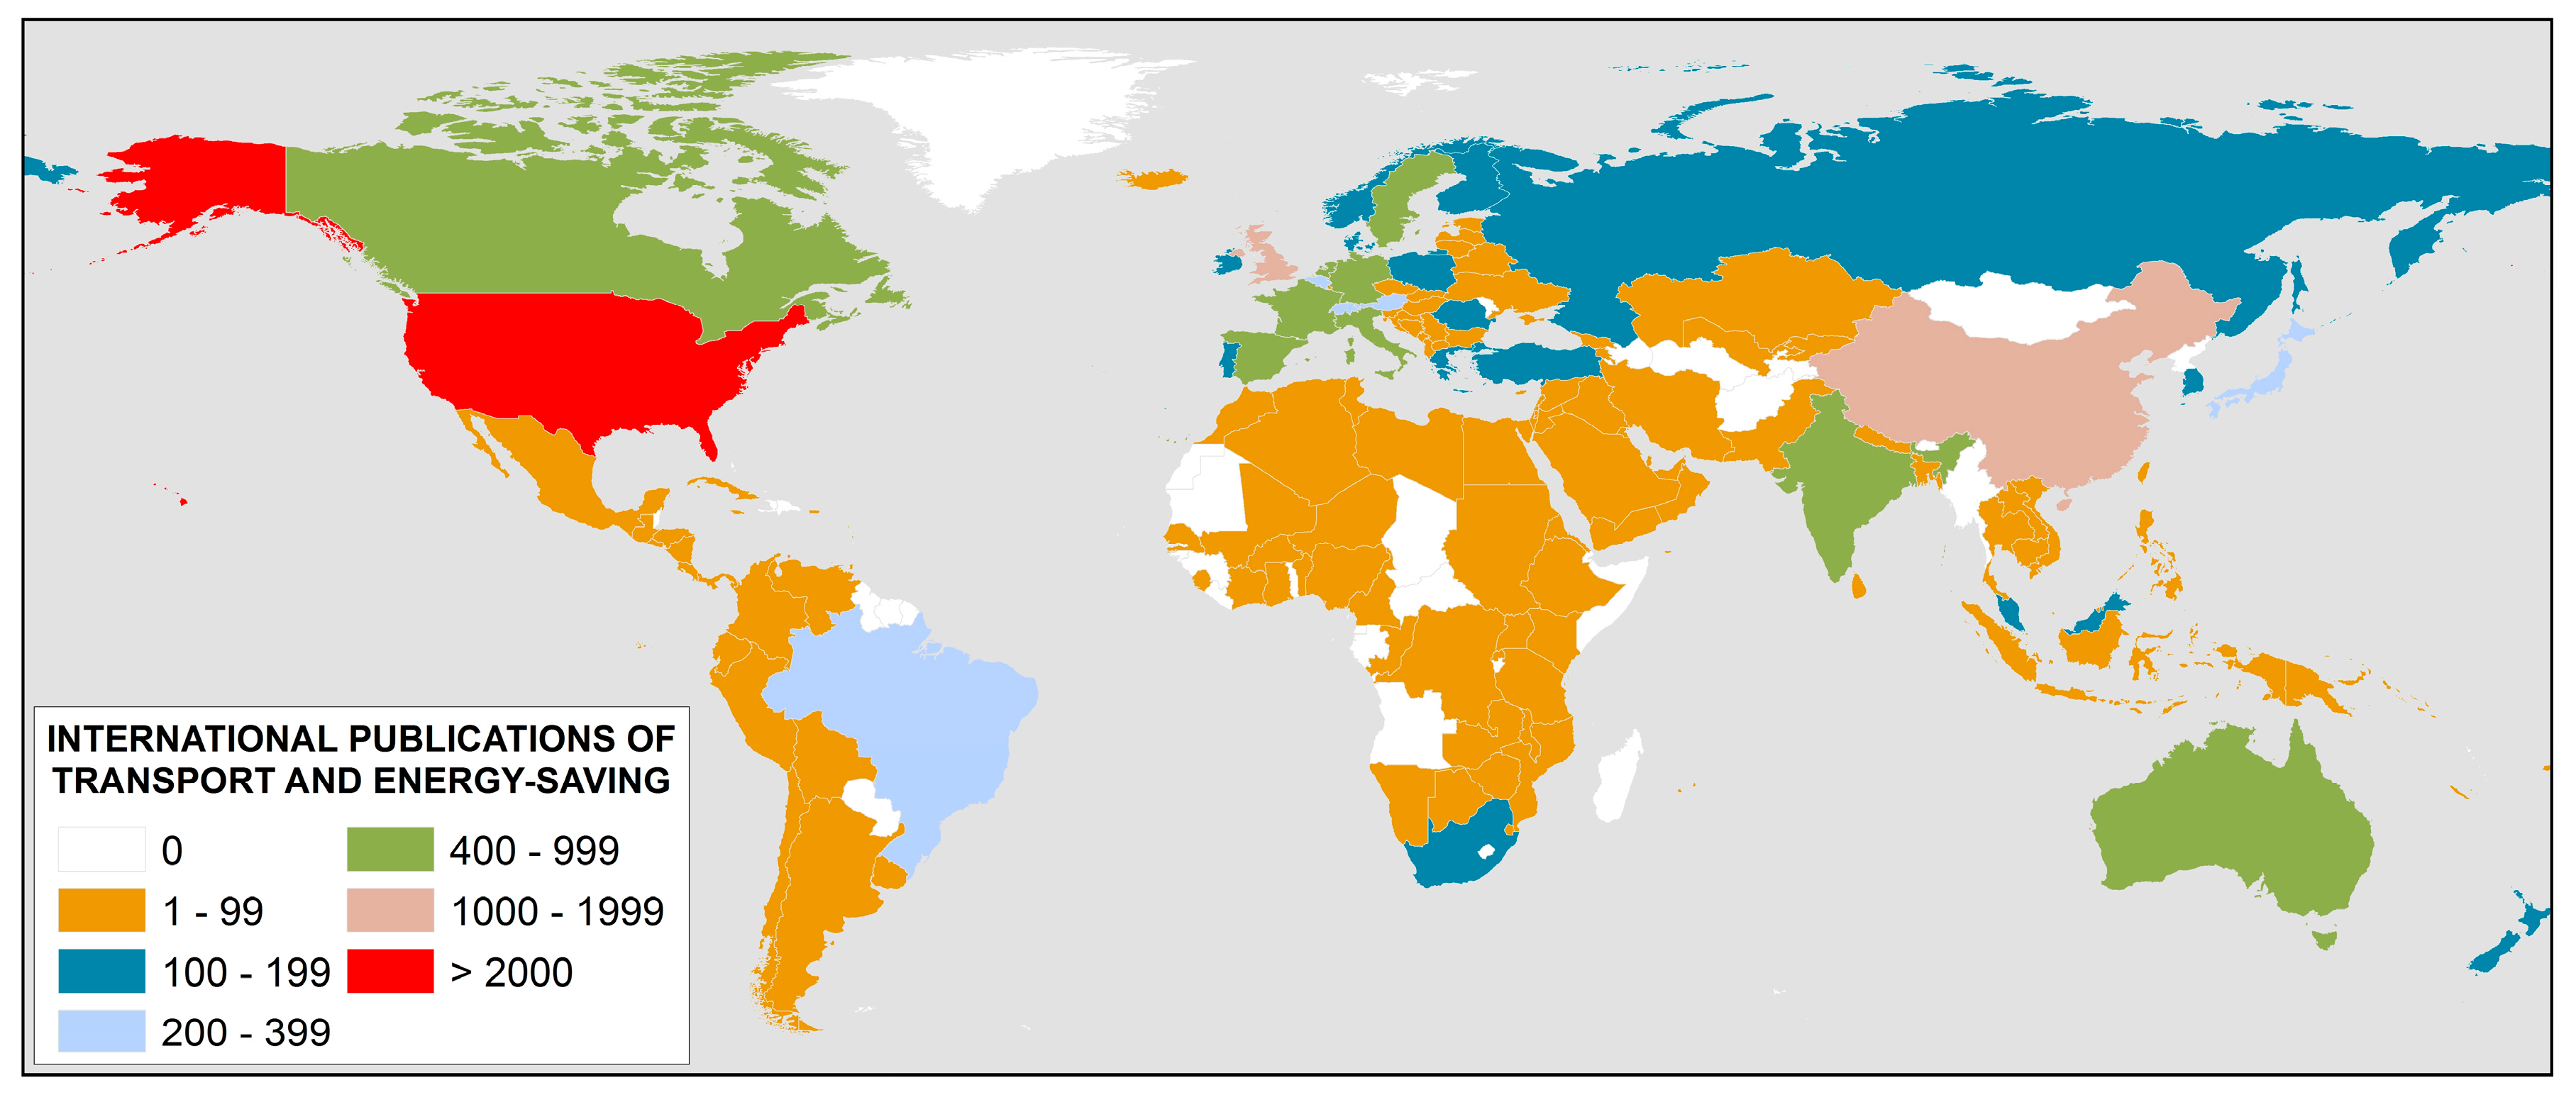
For this comparison, the methodology described above was used, but instead using the terms “transport” and “Energy saving”. The results are shown in
Figure 16. It is observed that, in general, there are less published items in the transport sector (17,304) than in the buildings sector. However, on the other hand, it is observed that the countries deeply involved in sustainability through energy efficiency are equally active in the building sector as in the transport sector.
Returning to the central research topic, a wide range of data on the international contribution to the scientific knowledge in the field of sustainability and energy-efficiency during the period 1976–2016 has been highlighted. In total, 26,585 publications have been found in more than 27 different categories. In this period, there has been an exponential increase in the number of publications, highlighting the categories of Engineering, Social Science and Environmental Science.
It is identified that the year of greatest productivity was last year with a total of 3207 publications, with Energy and Buildings being the journal that published most on this subject; several authors have been responsible for producing most of the work.
The works have mostly been published in international journals (57%) and congresses (28%), with English being the most common language in which the papers were written (more than 95%).
The institutions that publish the most are Hong Kong Polytechnic University, Delft University of Technology and Tsinghua University. They are located in Hong Kong, The Netherlands and northwest Beijing, China, respectively, representing more than 30% of the total publications during the last 10 years among the three of them. Something not to be ignored is that these three are public universities.
In Europe, the United Kingdom, Italy, Germany, Spain, The Netherlands, Sweden, and France are the countries with the highest number of international publications, with the United Kingdom accounting for almost 60 per cent of the total European publications in this field.
The analysis of the keywords for the studied publications reveals a great dispersion in the use of the set of keywords selected. Many compound terms are used which give rise to a larger number of unique terms. In addition, very similar concepts are written in different ways, giving rise to a greater variety which is clearly artificial as it does not mean any real complexity in the terms.
The most commonly used terms are “Sustainable Development”, “Sustainability”, “Energy Conservation”, “Energy Efficiency” and “Buildings”. In addition to these terms, others such as “Energy conservation” or “Energy efficiency” allude to the general environmental concern about energy prices and their environmental impact in the international community, especially in the last years.
As a final remark, this work shows that the international contribution to sustainability research is well preserved, generating a large number of publications in relevant journals and conferences. The strong development in energy efficiency in Europe has also stimulated research in this field, as seen from the data analyzed.

 ,
, 


