1. Introduction
Due to increasingly global competition, gains in productivity appear especially important, whereas the increase in the quality of human capital constitutes an important facet of productivity growth. In his book
Investment in Human Capital: The Role of Education and of Research, Schultz [
1] highlighted the contribution of education towards the economic growth. The United Nations Educational, Scientific, and Cultural Organization (UNESCO) has also called for activities directed towards stimulating national economies and making appropriate efforts for improving educational environment. Indeed, both developed and developing countries have aimed at promoting education development and reducing the education gap as a top social and political priority.
The illiteracy rate is a key indicator to reflect public education quality. Indeed, a rich body of literature provided evidence on the existence of an inverse relationship between the illiteracy rate and economic growth [
2,
3,
4]. China is still a developing country, where gains in productivity and human capital are required. Therefore, China’s government has realized illiteracy is a serious problem and have attempted to reduce the illiteracy rate at the highest possible pace through enactment of relevant laws and regulations, as well as acknowledgment of the government’s responsibility to promote public education development. Concerning educational development in China, Duan [
5] showed that the illiteracy rate has been following a steep downward trend, yet there have been significant regional imbalances in regards to the decline. Liu et al. [
6] also confirmed the aforementioned result. Hence, it is important to investigate the performance of public education operated by local government bodies in China in order to streamline the education system and properly address the challenges of public education.
Due to the externality of public education with respect of social overflow benefit, it is difficult to evaluate the performance of public education relative to economic growth accurately based on a market-oriented perspective. Liu and Zhao [
7] argued that, as contrasted to the market price, shadow price can reflect marginal social costs in a more reasonable manner. Indeed, as the public sector, including public education, focuses on maximization of social welfare, the government should make decisions on the basis of social benefits rather than market benefits as it would be the case in the business world. However, it is usually difficult to measure the social effects directly and exactly. In this case, the shadow price approach is an appropriate instrument to deal with the problem of measurement. In this paper, we thus aim to employ the illiteracy rate as a key variable to study the contribution of public education to local economic growth based on the shadow price perspective.
Methodologically, we apply the quadratic directional distance function to measure the shadow price of the illiteracy rate. As nonparametric approaches—e.g., data envelopment analysis—rely on non-differentiable frontiers, the parametric approach is an appealing technique to measure shadow prices. For instance, Pittman [
8] used the Shephard cost distance function to measure the shadow price of undesirable outputs. Consequently, frontier-based shadow prices have been widely applied across different fields, including energy [
9], environmental regulation [
10], agriculture [
11], and banking [
12], among others. Moreover, Chambers et al. [
13] introduced two parametric approaches to gauge shadow prices, including translog form and quadratic form, where the former satisfies homogeneity property, and the latter satisfies translation property. Due to the translation property of directional distance function, many studies suggest using the quadratic form, in lieu of translog form, to measure the shadow price of undesirable output [
10,
11,
14].
To the best of our knowledge, there have been few studies focusing on impact of public education in economic growth based on the perspective of shadow price in China. Therefore, we attempt to look into this relationship by employing a parametric approach based on linear programming to measure the shadow price of illiteracy rate in 31 provinces in China. The comparison of shadow prices of illiteracy across different areas in China allows one to further the practice of allocation of public education resources.
The rest of the paper is arranged as follows:
Section 2 presents the background of public education development in China.
Section 3 and
Section 4 introduce the methods and the data used, respectively.
Section 5 presents results of the empirical analysis, whereas
Section 6 concludes the paper.
2. Background
Before the China’s opening up reform in 1978, the illiteracy rate in China had exceeded 50%. However, since the 1980s, China’s government has stressed the importance of educational development, as manifested by various educational laws and regulations (e.g., the Compulsory Education Law of 1986 and the Education Act of 1995) aimed at accelerating educational development in China. Indeed, government is the main body to establish and operate educational system bodies in China, i.e., public education is the major component of China’s educational system. Thus, educational expenditures are mainly facilitated by national and local fiscal allocations.
However, a serious problem is that the resource allocation of public education is rather misbalanced among the eastern, the middle and the western regions in China. Generally, the misbalanced educational development is due to subjective factors (like regional history and culture) and objective factors (like natural environment), to name a few. Indeed, the local economic development level is the most crucial component in regards to differences in spatial distribution of educational resources. Specifically, a lower level of local economic growth would reduce the local educational supply. What is more, lower education would directly affect local households’ real income and further reduce their ability for educational spending. All in all, differences in levels of economic development and economic structures determine the differences in educational levels and structures, and vice versa.
In general, thanks to full-scale reforms and opening-up policies, economic growth has been observed in China since 1980s, yet the eastern region saw much faster growth if contrasted to the middle and the western regions. Therefore, development rates have diverged across the regions. Such misalignments cause imbalances in terms of social development, particularly in public education. As the educational investment is mainly facilitated by local government in China, the eastern region has had more education investment from fiscal revenue as well as other financing sources, whereas the middle and western regions experienced lower levels of economic growth level and, hence, lower fiscal income leading to insufficient educational resources. As a result, there has been an increasing educational investment gap between the eastern region on the one side and the middle and the western regions on the other side. Such misalignments would definitely have consequences in terms of regional economic growth.
3. Methodology
Estimation of the shadow price is an optimization problem which renders the marginal value of the resources in an economic structure under equilibrium. Indeed, the magnitude of the shadow price reflects the scarcity of the resource. Here, we focus on the shadow price of the illiteracy rate to assess the impact of public education on the regional economic growth. Basically, we calculate the impact of a change in the illiteracy rate of 1% on the regional economic growth rate.
Let the productive technology be represented by the production possibility set
P = {(
x,
y,
b):
x can produce (
y,
b)}, where the decision making units (DMUs) use
N inputs
to produce
M desirable outputs
and
L undesirable outputs
. Also, we assume the production possibility set satisfies the by-product axiom (null-jointness), the assumption of the compact set, and the jointly weak disposability (weak disposability of undesirable outputs and strong disposability of desirable outputs and inputs). Similarly to the Shephard distance function, the directional distance function proposed by Chambers et al. [
15] can be applied to simultaneously expand desirable outputs and contract undesirable outputs in order to describe the underlying technology
Departing from the Shephard distance function, Chambers et al. [
15] further emphasized that the directional distance function should satisfy translation property, i.e.,
In order to maintain the translation property, a quadratic directional distance function, rather than translog function (which satisfies homogeneity property), is suggested to be applied when calculating shadow prices [
10,
11,
13,
14]. For each DMU, indexed over
k, the quadratic distance function takes the form
where
are coefficients associated with input (
x), desirable output (
y), and undesirable output (
b) quantities, respectively,
are coefficients associated with the interaction terms, the time variable
t allows for technological change. Moreover, we use two dummy variables
Di to account for heterogeneous technologies in different areas, i.e., the eastern, middle, and western regions (O’Donnell et al. [
16] argued that it is not appropriate to directly compare firms whose technologies are not homogeneous.).
Practically, quadratic distance function given in Equation (3) can be implemented by means of deterministic linear programming by Aigner and Chu (1978) [
17]. The following Equations (4)–(10) allow one to calculate the parameters by minimizing the gap between the observed inefficiency
and full inefficiency
where the restrictions given by Equation (5) imply each DMU has non-negative feasible solution; Equations (6)–(8) impose the monotonicity and thus ensure the proper signs of the shadow prices, viz. Equation (6) implies that inefficiency
increases as input quantities
x increase, Equation (7) implies that inefficiency
decreases as the quantities of desirable outputs
y increase, Equation (8) implies inefficiency
increases with the quantities of undesirable outputs
b increasing; Equation (9) imposes the translation property on the directional distance function; and Equation (10) defines the symmetry conditions.
The calculation of shadow prices based on directional distance function can be traced back to Averch and Johnson [
18].
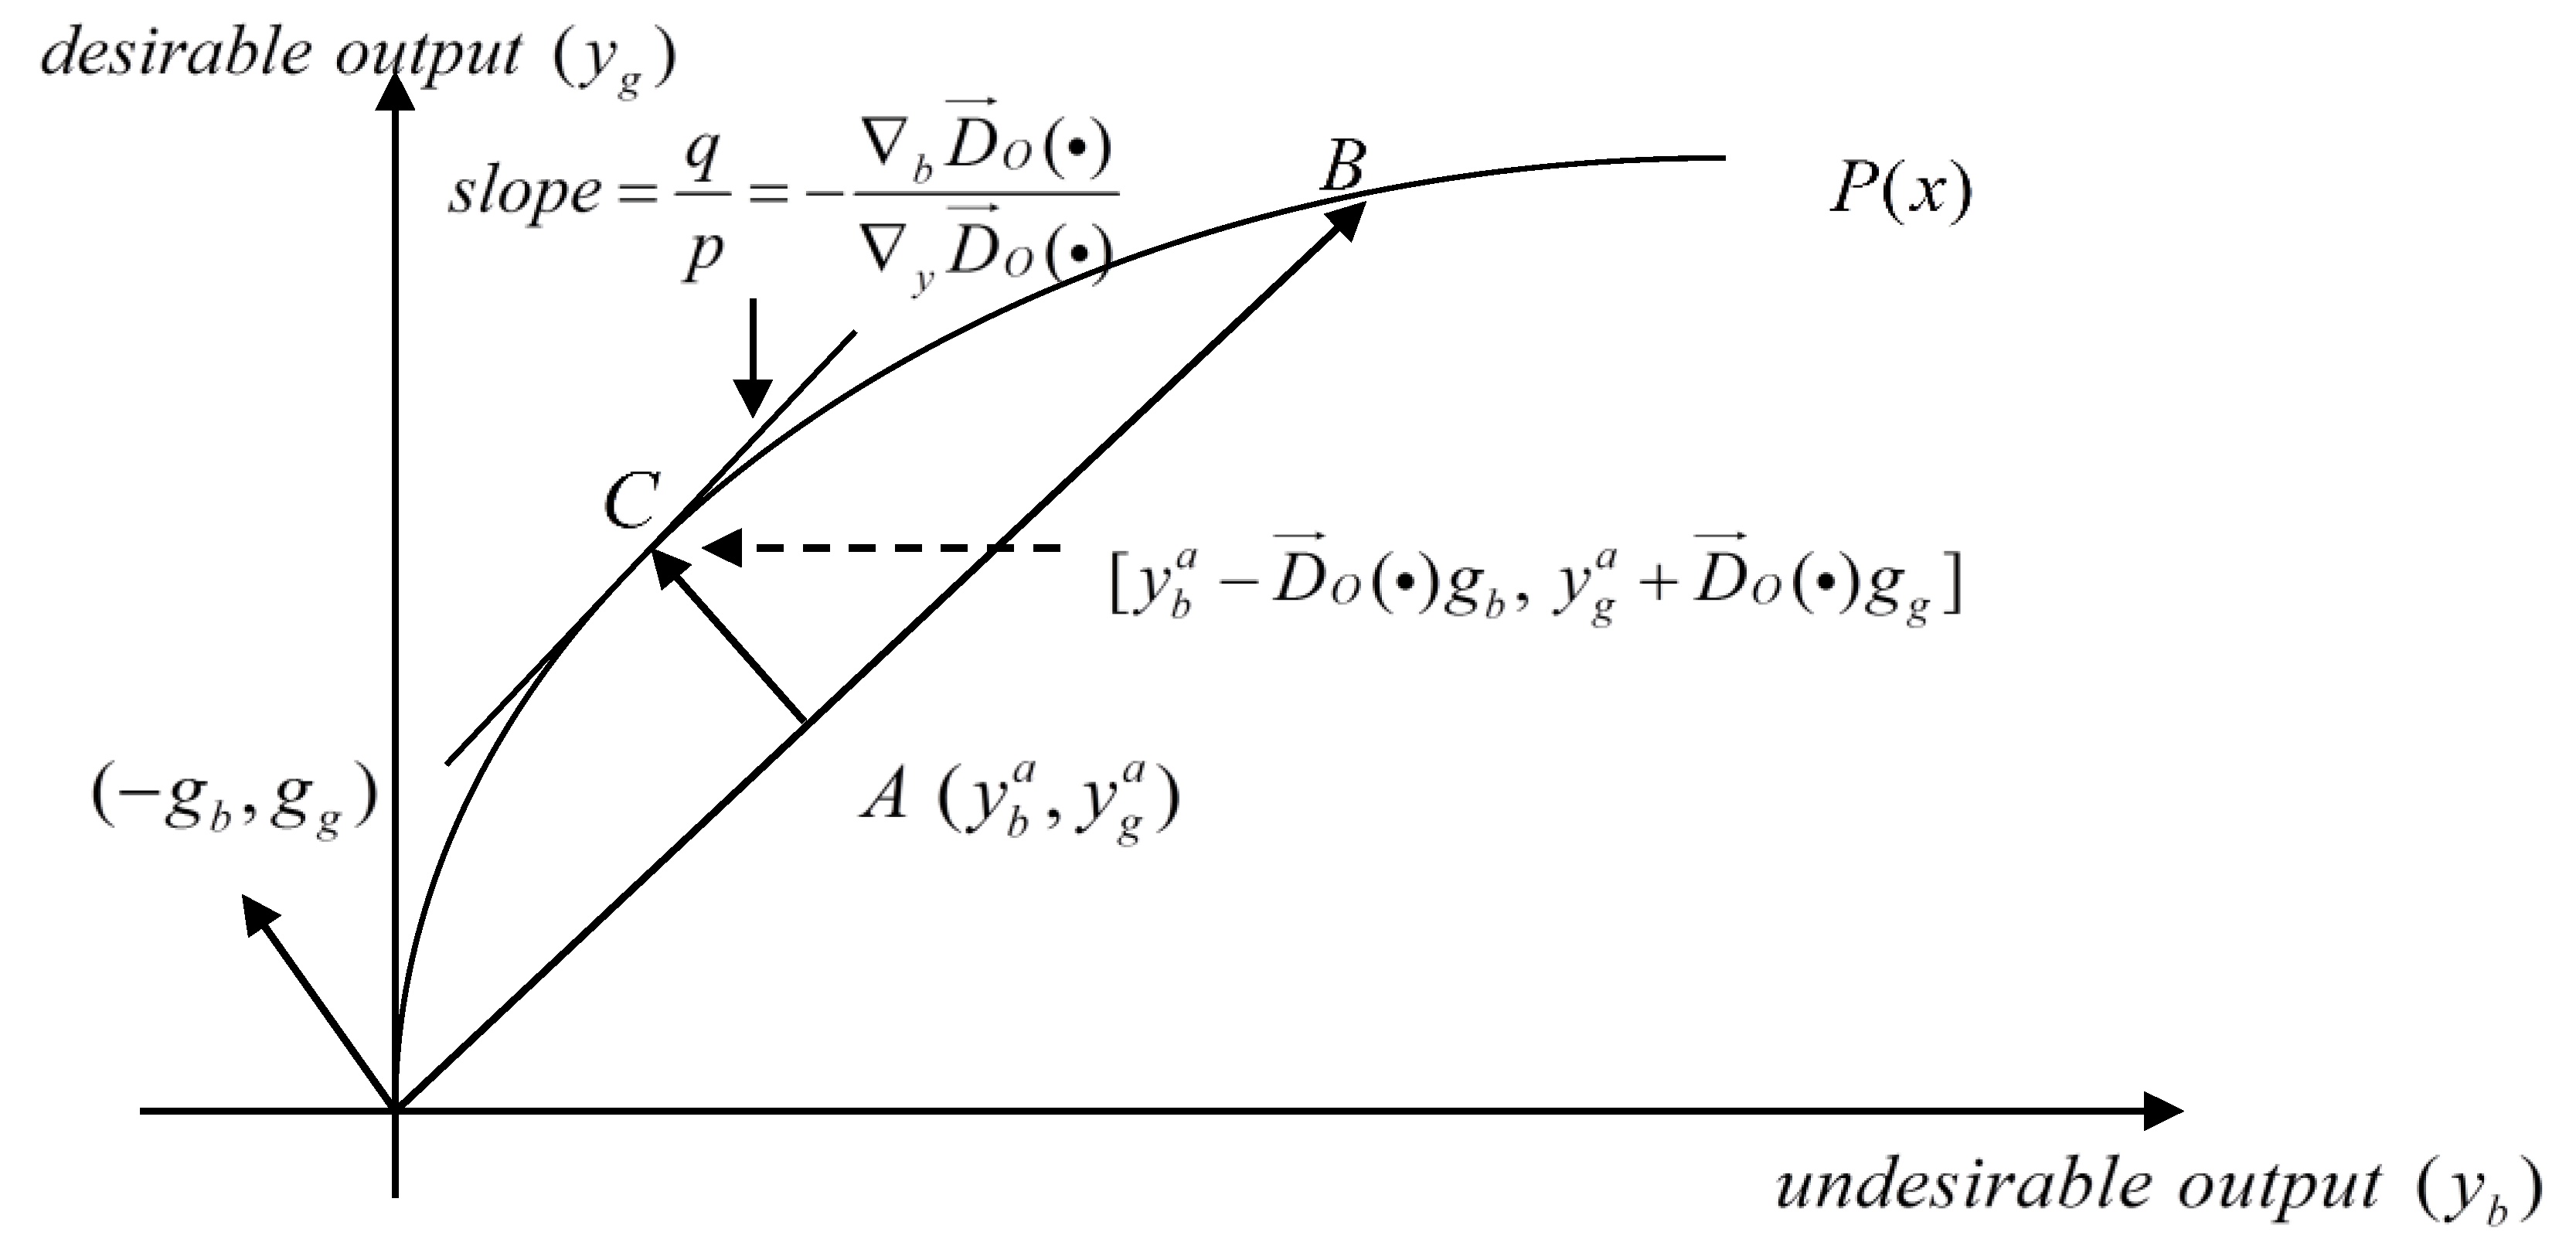
Figure 1 shows the ratio of shadow price of undesirable output to that of desirable output and defines the slope of the tangent of technology frontier
P(
x), in other words, it is equal to the ratio of the first-order derivatives of directional distance function with respect to the quantity of undesirable output
b to that of desirable output
y.
Given inefficiency renders biased shadow prices [
19], Färe et al. [
10] suggested focusing on the frontier shadow prices, which would be calculated by considering the frontier values of desirable and undesirable outputs when evaluating the derivatives
in
Figure 1. Hence, following Lee et al. [
20], we account for inefficiency when calculating shadow price. The underlying computations can be derived from a profit maximization problem
where
p and
w are price vectors associated with inputs and outputs, respectively,
and
represent factors projecting the observed quantities of desirable and undesirable outputs, respectively, onto the frontier under
g = (
y,
b) such that (
y*,
b*) is an efficient observation. The profit function in Equation (11) is maximized by considering derivatives of the Lagrangian
Given Equations (11)–(15), the shadow price of an undesirable output,
pb can be calculated given the price of a desirable output,
py in Equation (16)
4. Data Used
This paper measures the shadow price of the illiteracy rate in 31 provinces of China during the period of 2005–2011. We consider the three regions given the underlying differences in socio-economic development. The eastern region includes Beijing, Fujian, Guangdong, Hainan, Hebei, Jiangsu, Liaoning, Shandong, Shanghai, Tianjin, and Zhejiang; the middle region includes Anhui, Henan, Heilongjiang, Hubei, Hunan, Jilin, Jiangxi, and Shanxi; and the western region includes Chongqing, Gansu, Guangxi, Guizhou, Neimenggu, Ningxia, Qinghai, Shanxii, Sichuan, Xizang, Xingjiang, and Yunnan. The main data sources are China Statistical Yearbook and China Education Yearbook.
Table 1 introduces the input and output variables. The shadow price is interpreted as an opportunity cost of reducing undesirable output. In our case, we look at the impact of illiteracy rate on the local economic growth, and the gross regional product (GRP) per person is treated as a desirable output. The average years of schooling per person (EY) reflects population education attainment level in different areas. According to Liu et al. [
6], we treat EY as another desirable output. Moreover, the illiteracy rate is an undesirable output which reflects the quality of public education. This indicator is important as a higher illiteracy rate would seriously undermine local economic growth. Finally, in order to capture the effectiveness of investments by the local governments into education, the budget expenditure on public education is treated as an input. All the monetary variables are measured in constant prices of 2005.
Table 2 presents descriptive statistics of the input/output variables across 31 Chinese provinces during 2005–2011. The EY is 8.33 year, and the illiteracy rate is 8.7% on average in China over the said period. Comparing the eastern, middle and western regions, the average local economic growth level (GRP) and education expenses (PEE) are considerably higher in the eastern region (36,571 CNY/person and 29,003 million CNY) if compared to the middle (17,469 CNY/person and 20,580 million CNY) and western regions (15,742 CNY/person and 14,648 million CNY). Looking at average schooling years per person (EY), the eastern region (9.04 years) also shows higher values than the middle (8.44 years) and western (7.6 years) regions. As regards the illiteracy rate (IR), the western region (12.76%) is worse off if contrasted to the eastern (5.76%) and middle (6.63%) regions. Analysis of the coefficients of variation (C.V.) suggests that EY shows the lowest regional/temporal correlation if compared to the other variables. Furthermore, the middle region shows the lowest variation in all the variables except IR among the areas under analysis. The western region exhibits the highest disparities in terms of IR and PEE. The difference among the eastern, middle, and western regions mainly contributes to heterogeneous natural geographical conditions, long-term historical reasons, political and policy environments, population and labor quality, and so on.
5. Empirical Analysis
In order to estimate the shadow prices as defined by Equation (16), we apply the General Algebraic Modelling Software (GAMS) to solve Equations (4)–(10) and obtain parameters for directional distance function in Equation (3). As the pooled dataset is employed, the objective function considers the years 2005–2011 and 31 provinces. The resulting values of the parameters of the quadratic directional distance function are presented in
Table 3.
Undesirable output is associated with negative price as it contributes to an increase in costs or reduction of profit [
21], thus being opposite to desirable output which bears positive market price. The resulting shadow prices of illiteracy are presented in
Table 4.
Table 4 shows that the average shadow price of illiteracy in China is 0.4012 which means that an increase in the illiteracy rate of 1%, yields a decrease in the GRP of 0.4012 CNY/person. Looking regionally, the shadow price of illiteracy is 0.4409 in the middle region, which is higher than those in the eastern (0.3610) and western (0.4115) regions. It implies that public education has the highest impact on the local economic growth in the middle region. In other words, the middle region has to incur higher costs (i.e., face higher shadow price) than the eastern and western regions for reducing illiteracy rates to the same extent. The aforementioned result has been termed “recession in the middle region” by China’s educational authorities and is consistent with Yu [
22]. Looking closer into the issue of “recession in the middle region”, one can note that the level of economic development in the middle region is behind that in the eastern region, while the highest growth rates are observed in the western region. Such a pattern can be partly explained by the lack of policy focus on the middle region in China as a series of national programs operated in both the east and the west (e.g., Open Policy for Eastern Coastal Areas and West Development program) [
23]. Another possible explanation of the “recession in the middle region” is that the presence of financial constraints causes a negative effect on the economic development and public education in the middle region [
24]. Thanks to its geographical location and policy-based support, the eastern region, which saw the lowest shadow price, has been a critical region in regards to economic growth in China. Due to lower transaction efficiency, the shadow price for the western region is higher than that for the eastern region [
25]. Hence, a rich body of literature argued the eastern region, e.g., Beijing, Shanghai, and Zhejiang, with higher-quality educational resources and adequate educational funding outperforms the middle and western regions. With regards to the lower shadow price of illiteracy rate in the western region, which was poorer than the middle region, a possible explanation is that the education quality in the western region has been substantially improved due to dedicated national educational policy and funding under the West Development program in China. Comparison of shadow prices of illiteracy across different provinces indicates that Zhejiang (0.2850) shows the lowest shadow price, whereas most eastern provinces, like Jiangsu (0.3043) and Shandong (0.3288), feature higher values. Anyway, some middle provinces, like Hainan (0.4578), Heilongjiang (0.4541), are attributed with the highest shadow prices and Shanxi (0.4720) appears at the very top.
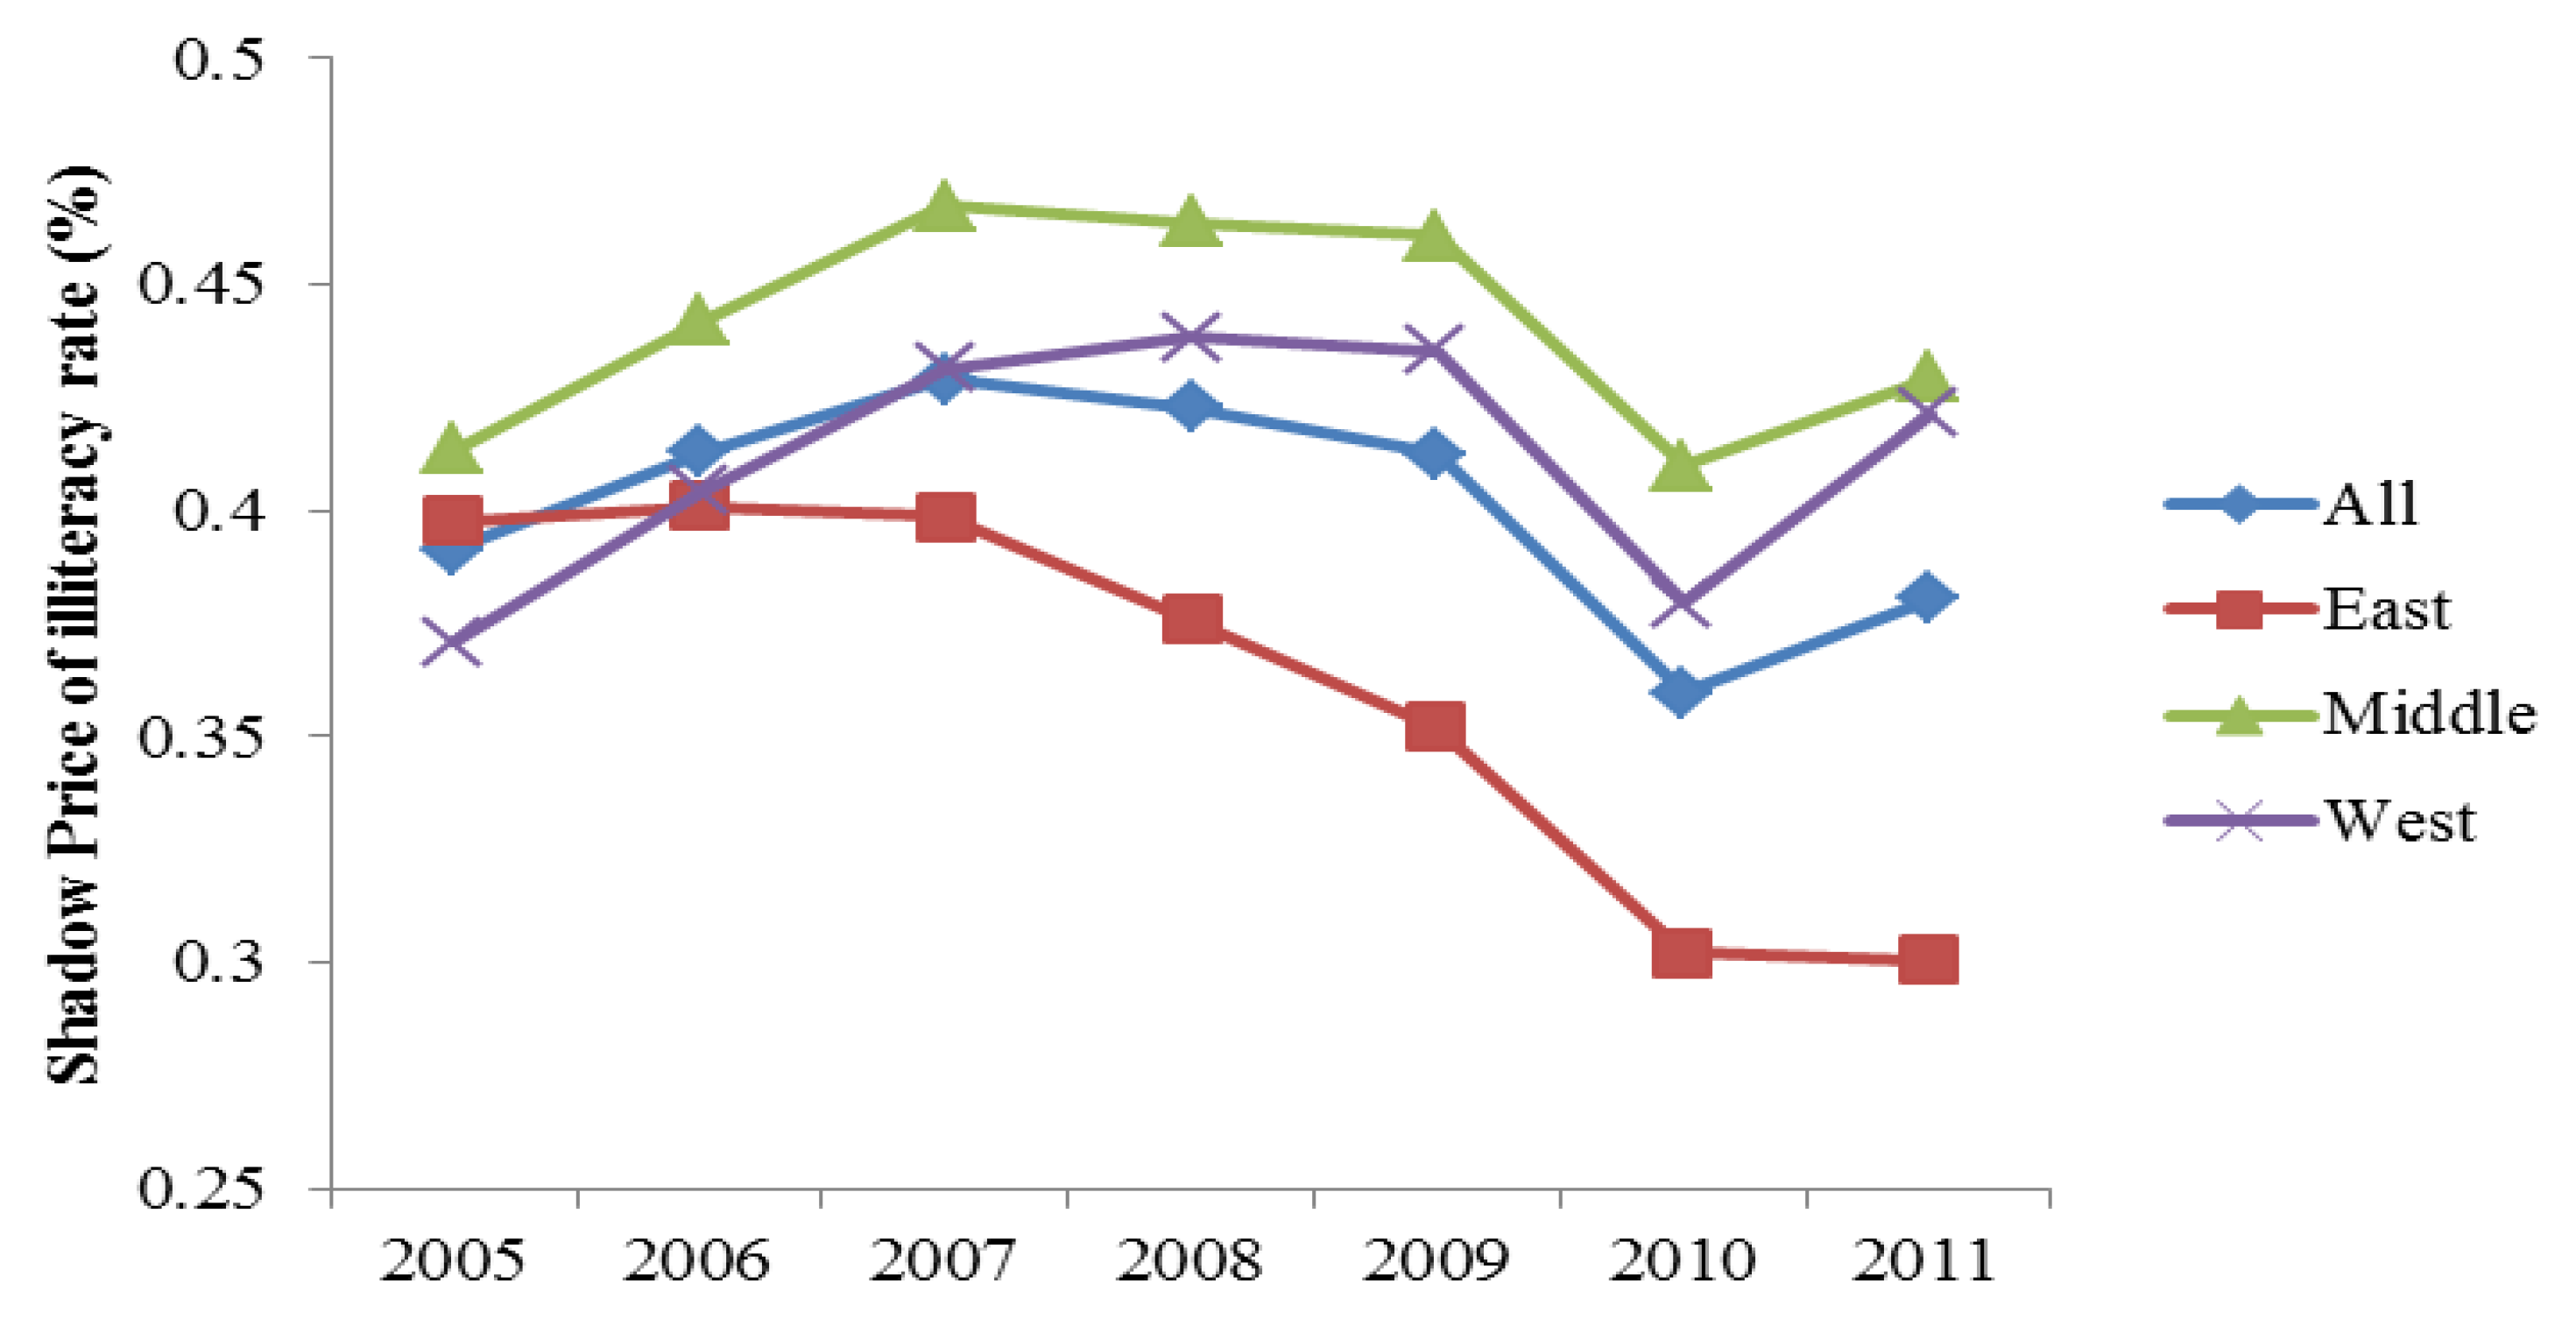
Figure 2 shows the dynamics in the shadow prices of illiteracy in the three regions of China during 2005–2011. Looking at the country average, the shadow price of illiteracy had followed an increasing trend during 2005–2007, and then took an opposite direction with a rebound after 2010. Indeed, the middle and western regions followed the similar trends the average for China, whereas the eastern region diverged and exhibited a downward trend. A potential explanation is that the eastern region promoted public education as a priority associated with local economic growth, which decreased the shadow price of illiteracy rate (marginal education cost). However, the middle and the western regions set too much emphasis on local economic growth, but ignore development of public education. The results suggest that the shadow prices of illiteracy have converged between the middle and the western regions, but the gap has widened with regard to the eastern region and the remaining areas, which corresponds to findings by Zhao [
26].
6. Conclusions
In order to investigate the impact of public education on the local economic growth, this paper used quadratic directional distance function to measure shadow prices of illiteracy in 31 provinces of China. The results indicate that, at the national level, the average shadow price of the illiteracy rate is 0.4012 CNY/person. Region-wise, the middle region shows the highest shadow price of illiteracy if compared to the western and eastern regions with policy-based support being a critical factor behind these differences. As time passed, the shadow prices of illiteracy followed similar trends in the middle and western regions, while the eastern region diverged with a downward trend. It implies that public education has a persistent positive effect in promoting economic growth in the eastern region, whereas the gap between the effects of public education have been declining in the middle and western regions.
In the light of these results, balanced development of public education in the eastern, middle and western regions remains a topical issue. The following policy implications can be proposed in order to properly address the latter question: first, the government should develop tailored policies based on real situation in different areas. The lack of the tailored policies might cause imbalances in regional economic growth, and, further on, in development of public education in China. Fair education has been a hot topic in China and it is important to support reasonable education resource allocation for underdeveloped areas. Second, rapid economic growth in the eastern region promotes the development of public education, and high-quality education generates advanced human capital to further maintain a promising socio-economic environment. It is, therefore, a golden opportunity for the eastern region to improve labor productivity and increase the regional competitiveness by exploiting the education-related advantages. Third, the “rise in the middle region” rather than “recession in the middle region” should be put into practice. Compared to the eastern region which enjoys institutional advantages and the western region which has received preferential policies, the middle region has gained lower benefits in the form of financial support. Therefore, it is necessary for the middle region to alter the economic development model and stimulate the vitality of economic development to ensure increase in education funding and public financial support. Fourth, improvements in the education system in the western region might be secured through urbanization under the West Development strategy. Indeed, urbanization is an effective means to promote public education development, as population concentration improves the distribution of educational resources and, hence, the efficiency of educational resource use.


