National Water Footprint: Toward a Comprehensive Approach for the Evaluation of the Sustainability of Water Use in Italy
Abstract
1. Introduction
2. Methodology and Datasets
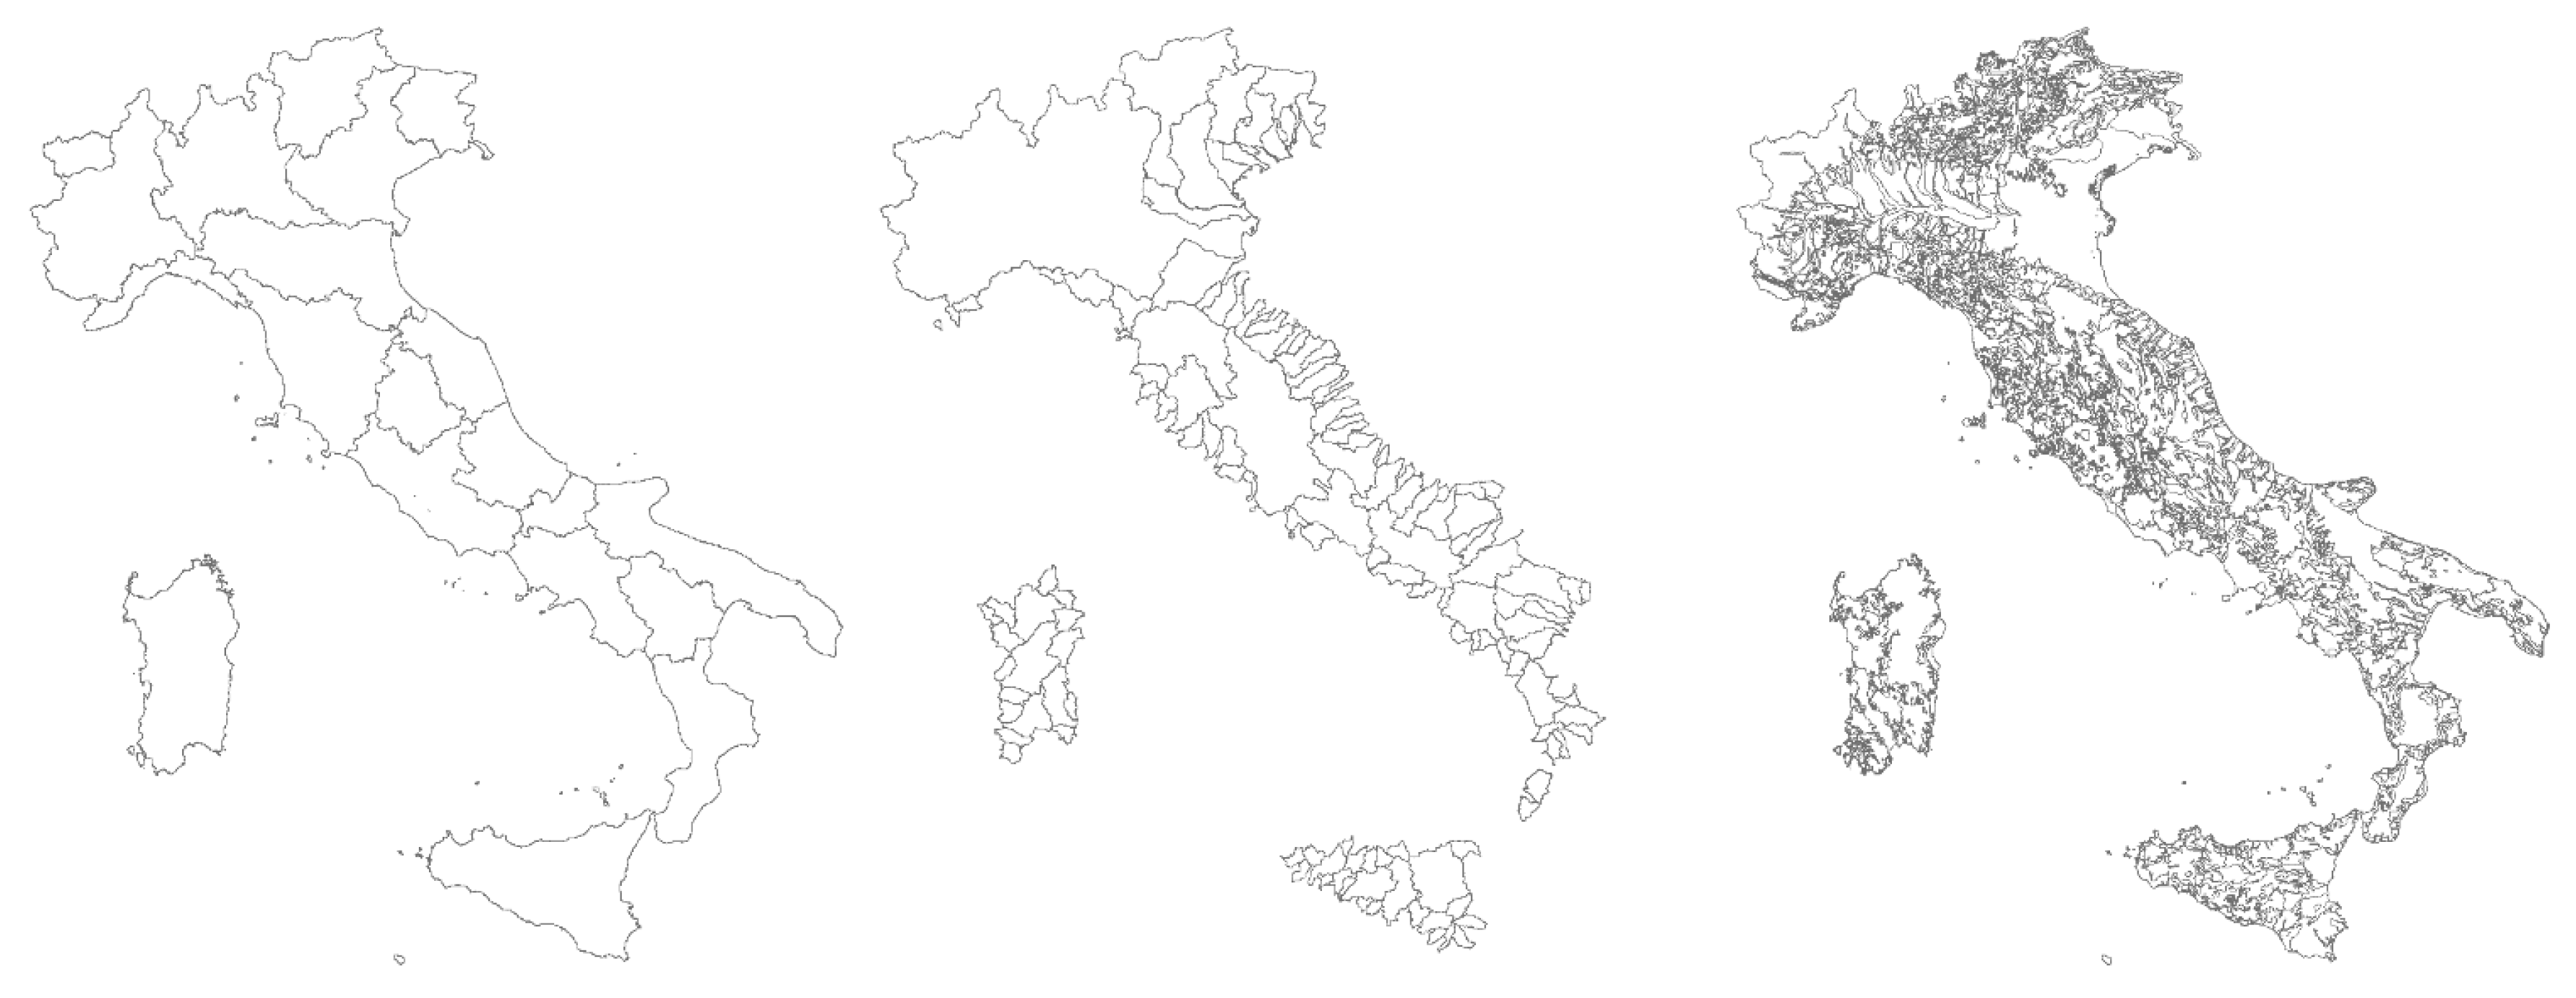
- regional (administrative) boundaries (REG, [22]), consisting of 20 polygons with an average extension of 15,103 km2;
- river basin (BAS, [23]), consisting of 137 polygons with an average extension of 1827 km2;
- hydrogeological complex (i.e., areas with same lithological properties) (COM, [24]) consisting of 3011 polygons with an average extension of 100 km2.
3. Results and Discussion
4. Conclusions
Acknowledgments
Author Contributions
Conflicts of Interest
References
- Hoekstra, A.Y.; Chapagain, A.K.; Aldaya, M.M.; Mekonnen, M.M. The Water Footprint Assessment Manual: Setting the Global Standard; Earthscan: London, UK, 2011. [Google Scholar]
- ISO 14046:2014, Environmental Management—Water Footprint—Principles, Requirements and Guidelines; ISO: Geneva, Switzerland, 2014.
- Bonamente, E.; Cotana, F. Carbon and Energy Footprint of Prefabricated Industrial Buildings: A systematic Life Cycle Assessment Analysis. Energies 2015, 8, 12685–12701. [Google Scholar] [CrossRef]
- Bonamente, E.; Pelliccia, L.; Merico, M.C.; Rinaldi, S.; Petrozzi, A. The Multifunctional Environmental Energy Tower: Carbon Footprint and Land Use Analysis of an Integrated Renewable Energy Plant. Sustainability 2015, 7, 13564–13584. [Google Scholar] [CrossRef]
- Water Footprint Network—What is the Water Footprint? Available online: http://waterfootprint.org/en/water-footprint/what-is-water-footprint (accessed on 27 July 2017).
- Rinaldi, S.; Bonamente, E.; Scrucca, F.; Merico, M.C.; Asdrubali, F.; Cotana, F. Water and Carbon Footprint of Wine: Methodology Review and Application to a Case Study. Sustainability 2016, 8, 621. [Google Scholar] [CrossRef]
- Bonamente, E.; Scrucca, F.; Rinaldi, S.; Merico, M.C.; Asdrubali, F.; Lamastra, L. Environmental impact of an Italian wine bottle: Carbon and Water Footprints assessment. Sci. Total Environ. 2016, 560–561, 274–283. [Google Scholar] [CrossRef] [PubMed]
- Wichelns, D. Volumetric water footprints, applied in a global context, do not provide insight regarding water scarcity or water quality degradation. Ecol. Indic. 2017, 74, 420–426. [Google Scholar] [CrossRef]
- Salmoral, G.; Willaarts, B.A.; Garrido, A.; Guse, B. Fostering integrated land and water management approaches: Evaluating the water footprint of a Mediterranean basin under different agricultural land use scenarios. Land Use Policy 2017, 61, 24–39. [Google Scholar] [CrossRef]
- Zheng, Z.; Liu, J.; Koeneman, P.H.; Zarate, E.; Hoekstra, A.Y. Assessing water footprint at river basin level: A case study for the Heihe River Basin in Northwest China. Hydrol. Earth Syst. Sci. 2012, 16, 2771–2781. [Google Scholar] [CrossRef]
- Liu, J.; Wang, Y.; Yu, Z.; Cao, X.; Tian, L.; Sun, S.; Wu, P. A comprehensive analysis of blue water scarcity from the production, consumption, and water transfer perspectives. Ecol. Indic. 2017, 72, 870–880. [Google Scholar] [CrossRef]
- Mekonnen, M.M.; Pahlow, M.; Aldays, M.M.; Zarate, E.; Hoekstra, A.Y. Sustainability, Efficiency and Equitability of Water Consumption and Pollution in Latin America and the Caribbean. Sustainability 2015, 7, 2086–2112. [Google Scholar] [CrossRef]
- Sartori, M.; Tavernini, S.; Consalvo, C. Water Footprint of Italy; WWF: Roma, Italy, 2014. [Google Scholar]
- Mekonnen, M.M.; Hoekstra, A.Y. National Water Footprint Accounts: The Green, Blue and Grey Water Footprint of Production and Consumption; UNESCO-IHE: Delft, The Netherlands, 2011. [Google Scholar]
- Joint Research Center Data Portal. Available online: http://water.jrc.ec.europa.eu/waterportal (accessed on 27 July 2017).
- Hoekstra, A.Y. Sustainable, efficient, and equitable water use: The three pillars under wise freshwater allocation. WIREs Water 2014, 1, 31–40. [Google Scholar] [CrossRef]
- Richter, B.D.; Davis, M.M.; Apse, C.; Konrad, C. A presumptive standard for environmental flow protection. River Res. Appl. 2012, 28, 1312–1321. [Google Scholar] [CrossRef]
- Pistocchi, A.; Alberto, A.; Simone, B.; Faycal, B.; Andreas, B.P.; de Arie, R.; Bruna, G.; Camino, L.G.M.D.; Marco, P.; Fuensanta, S.H.M.; et al. Assessment of the Effectiveness of Reported Water Framework Directive Programmes of Measures; Publications Office of the European Union: Luxembourg City, Luxembourg, 2015. [Google Scholar]
- Liu, C.; Kroeze, C.; Hoekstra, A.Y.; Gerbens-Leenes, W. Past and future trends in grey water footprints of anthropogenic nitrogen and phosphorus inputs to major world rivers. Ecol. Indic. 2012, 18, 42–49. [Google Scholar] [CrossRef]
- European Environment Agency. CLC2006 Technical Guidelines; EEA: Copenhagen, Denmark, 2007. [Google Scholar]
- Center for International Earth Science Information Network. Documentation for the Gridded Population of the World, Version 4 (GPWv4); NASA Socioeconomic Data and Applications Center: Palisades, NY, USA, 2016.
- Regional Administrative Boundaries. Available online: https://www.istat.it/it/archivio/124086 (accessed on 27 July 2017).
- River Basins. Available online: http://www.sinanet.isprambiente.it/it/sia-ispra/download-mais/bacini-idrografici-principali-1-250.000/view (accessed on 27 July 2017).
- Hydrogeological Complexes. Available online: http://www.sinanet.isprambiente.it/it/sia-ispra/download-mais/complessi-idrogeologici/view (accessed on 27 July 2017).


| Water Type | Upper Limit | Description | Value |
|---|---|---|---|
| Blue | Maximum sustainable blue water footprint | ||
| Grey | Maximum sustainable grey water footprint | ||
| Green | Maximum sustainable land use |
| Pollutant | ||
|---|---|---|
| (kg/m3) | (kg/m3) | |
| N | 1 × 10⁻³ | 0.2 × 10⁻³ |
| P | 0.005 × 10⁻³ | 0.12 × 10⁻³ |
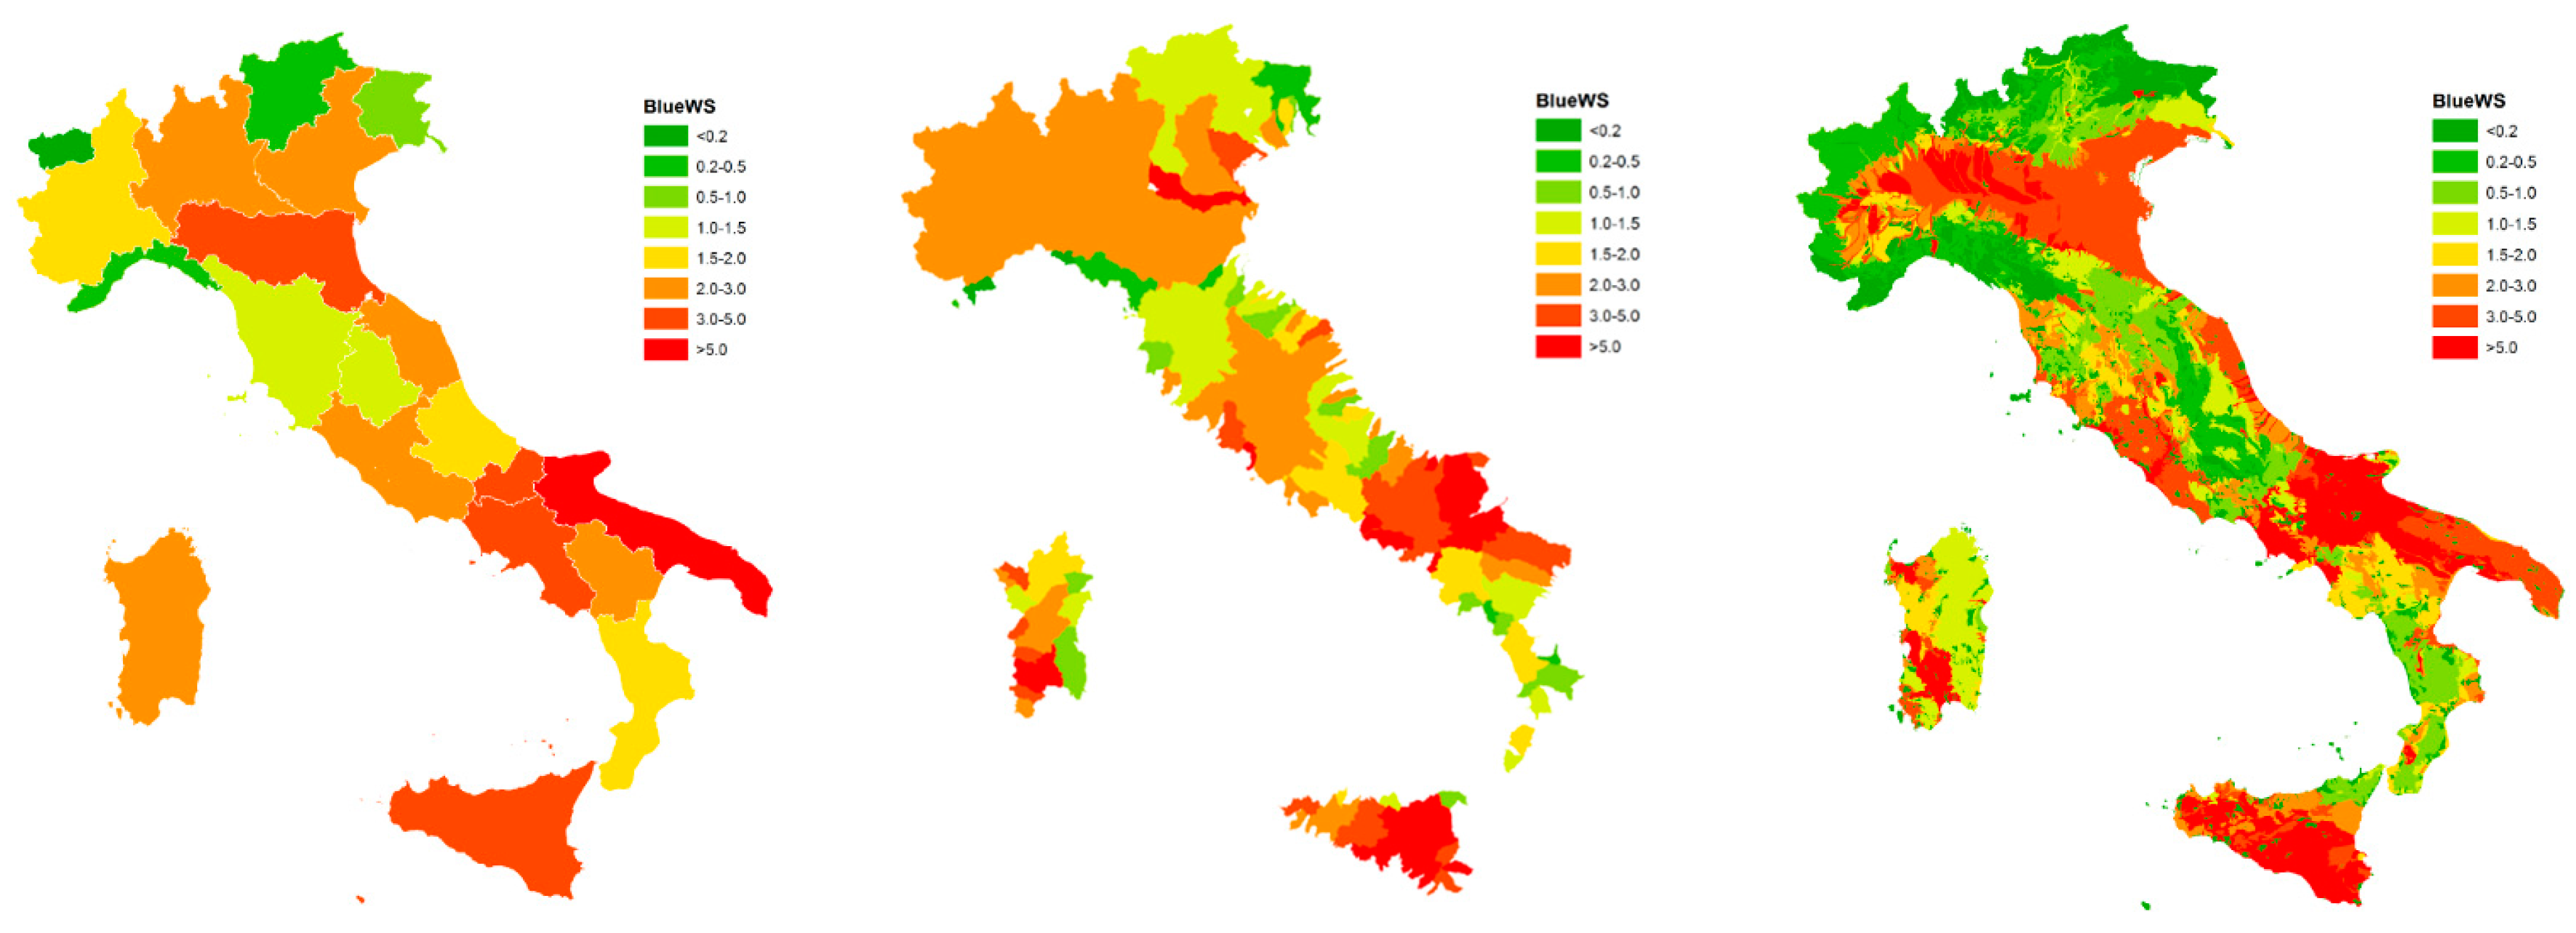
| Region | Runoff | WAblue | WFblue | WFblue | WSblue | Domestic | Energy | Industry | Irrigation | Livestock |
|---|---|---|---|---|---|---|---|---|---|---|
| (mm) | (mm) | (mm) | (m3/pers/year) | (-) | (%) | (%) | (%) | (%) | (%) | |
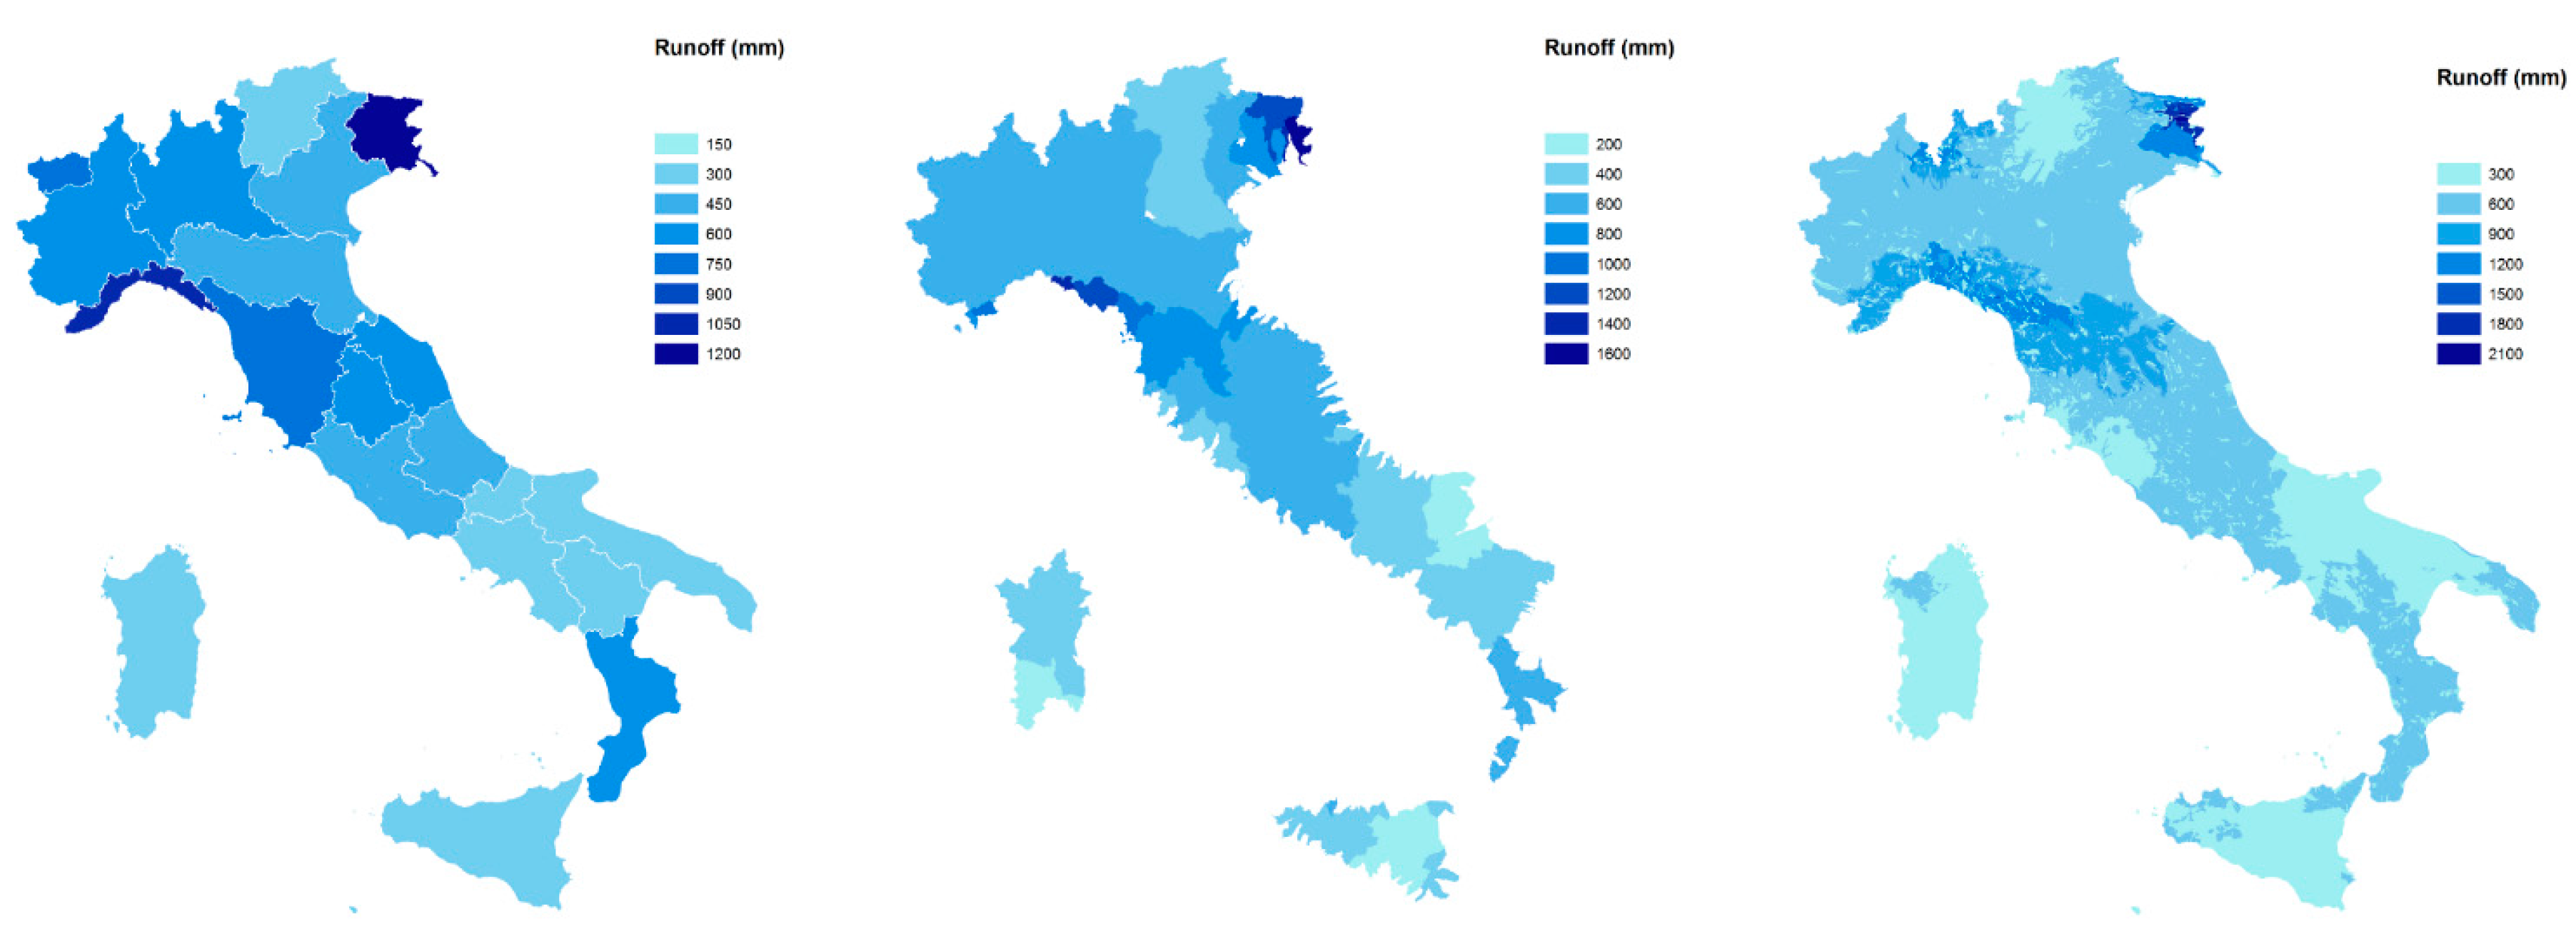
| Piemonte | 497.5 | 99.5 | 184.2 | 1082 | 1.9 | 13.6% | 40.4% | 10.0% | 34.0% | 2.0% |
| Valle D’Aosta | 729.6 | 145.9 | 5.1 | 129 | 0.0 | 61.8% | 0.0% | 32.5% | 0.0% | 5.7% |
| Lombardia | 477.4 | 95.5 | 233.6 | 584 | 2.4 | 24.5% | 8.7% | 19.4% | 42.1% | 5.3% |
| Trentino-Alto Adige | 266.0 | 53.2 | 24.0 | 331 | 0.5 | 49.8% | 28.0% | 19.4% | 0.5% | 2.3% |
| Veneto | 411.0 | 82.2 | 219.3 | 811 | 2.7 | 17.3% | 9.5% | 16.3% | 51.5% | 5.2% |
| Friuli Venezia Giulia | 1054.4 | 210.9 | 179.6 | 1209 | 0.9 | 12.0% | 26.7% | 10.9% | 47.6% | 2.8% |
| Liguria | 945.0 | 189.0 | 77.3 | 268 | 0.4 | 35.5% | 45.4% | 12.1% | 6.3% | 0.6% |
| Emilia-Romagna | 428.6 | 85.7 | 269.6 | 1446 | 3.1 | 11.3% | 21.1% | 12.4% | 53.2% | 2.1% |
| Toscana | 682.5 | 136.5 | 161.3 | 1038 | 1.2 | 16.4% | 13.5% | 13.5% | 52.3% | 1.5% |
| Umbria | 495.6 | 99.1 | 143.3 | 1406 | 1.4 | 11.2% | 16.2% | 11.0% | 58.8% | 2.8% |
| Marche | 477.4 | 95.5 | 192.0 | 1197 | 2.0 | 12.9% | 0.1% | 12.8% | 71.6% | 1.8% |
| Lazio | 400.4 | 80.1 | 217.5 | 707 | 2.7 | 19.7% | 5.4% | 12.3% | 61.9% | 0.6% |
| Abruzzo | 394.4 | 78.9 | 121.9 | 1014 | 1.5 | 18.9% | 7.8% | 16.3% | 56.8% | 0.7% |
| Molise | 285.2 | 57.0 | 232.9 | 3236 | 4.1 | 5.1% | 30.8% | 3.2% | 59.6% | 0.4% |
| Campania | 290.5 | 58.1 | 237.4 | 566 | 4.1 | 25.0% | 16.0% | 9.0% | 49.4% | 0.7% |
| Puglia | 210.1 | 42.0 | 247.0 | 1177 | 5.9 | 13.0% | 2.2% | 8.2% | 70.9% | 0.4% |
| Basilicata | 275.0 | 55.0 | 137.7 | 2321 | 2.5 | 5.9% | 0.0% | 5.9% | 87.0% | 1.2% |
| Calabria | 470.1 | 94.0 | 142.3 | 1084 | 1.5 | 12.0% | 20.2% | 5.6% | 61.6% | 1.0% |
| Sardegna | 243.9 | 48.8 | 113.8 | 1613 | 2.3 | 7.6% | 7.9% | 8.0% | 73.0% | 3.0% |
| Sicilia | 260.6 | 52.1 | 225.0 | 1158 | 4.3 | 13.0% | 9.8% | 6.0% | 64.8% | 0.5% |
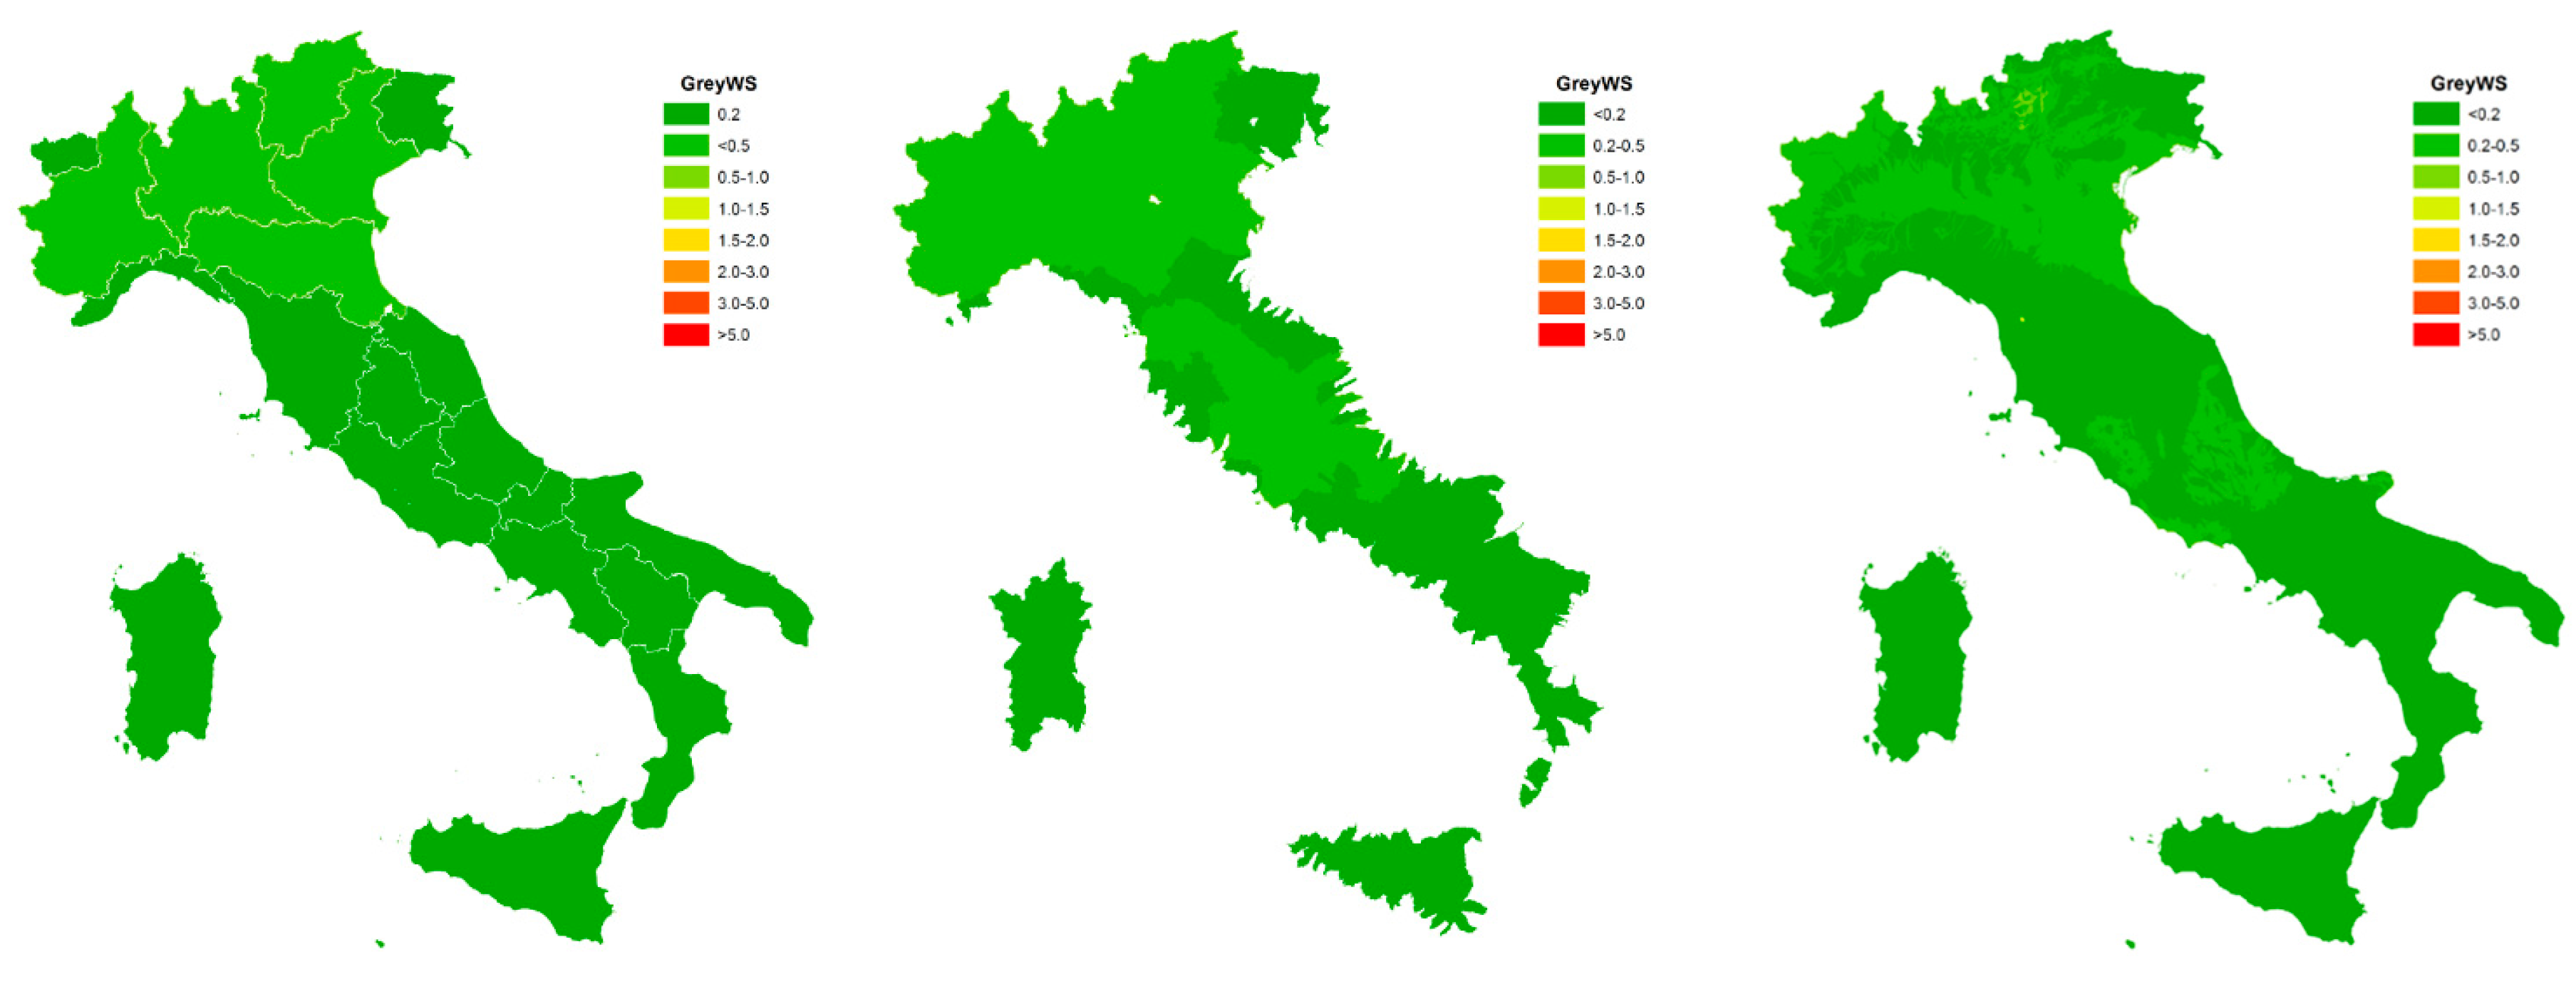
| Region | Runoff | WAgrey | WFgrey | WFgrey | CN | CP | WSblue |
|---|---|---|---|---|---|---|---|
| (mm) | (mm) | (mm) | (m3/pers/year) | (10−3 kg/m3) | (10−3 kg/m3) | (-) | |
| Piemonte | 497.5 | 398.0 | 50.2 | 180 | 0.202 | 0.013 | 0.25 |
| Valle D’Aosta | 729.6 | 583.6 | 50.2 | 99 | 0.138 | 0.009 | 0.17 |
| Lombardia | 477.4 | 381.9 | 49.5 | 71 | 0.207 | 0.014 | 0.26 |
| Trentino-Alto Adige | 266.0 | 212.8 | 36.8 | 165 | 0.277 | 0.019 | 0.35 |
| Veneto | 411.0 | 328.8 | 34.4 | 56 | 0.167 | 0.011 | 0.21 |
| Friuli Venezia Giulia | 1054.4 | 843.5 | 61.2 | 78 | 0.116 | 0.009 | 0.15 |
| Liguria | 945.0 | 756.0 | 15.3 | 7 | 0.032 | 0.002 | 0.04 |
| Emilia-Romagna | 428.6 | 342.9 | 35.2 | 102 | 0.164 | 0.011 | 0.21 |
| Toscana | 682.5 | 546.0 | 43.3 | 154 | 0.127 | 0.007 | 0.16 |
| Umbria | 495.6 | 396.5 | 39.1 | 78 | 0.158 | 0.011 | 0.20 |
| Marche | 477.4 | 382.0 | 33.2 | 47 | 0.139 | 0.010 | 0.17 |
| Lazio | 400.4 | 320.3 | 31.2 | 42 | 0.156 | 0.011 | 0.19 |
| Abruzzo | 394.4 | 315.5 | 26.4 | 57 | 0.134 | 0.009 | 0.17 |
| Molise | 285.2 | 228.1 | 7.3 | 11 | 0.052 | 0.004 | 0.06 |
| Campania | 290.5 | 232.4 | 7.3 | 6 | 0.051 | 0.004 | 0.06 |
| Puglia | 210.1 | 168.1 | 7.3 | 16 | 0.070 | 0.005 | 0.09 |
| Basilicata | 275.0 | 220.0 | 7.3 | 30 | 0.053 | 0.004 | 0.07 |
| Calabria | 470.1 | 376.1 | 7.3 | 20 | 0.031 | 0.002 | 0.04 |
| Sardegna | 243.9 | 195.1 | 6.3 | 51 | 0.051 | 0.003 | 0.06 |
| Sicilia | 260.6 | 208.5 | 7.8 | 25 | 0.060 | 0.004 | 0.08 |
| Region | Population (pers/km2) | Total Area (km2) | Artificial (%) | Agriculture (%) | Forest (%) | Wetlands (%) | Water (%) | Natural Area (frac) |
|---|---|---|---|---|---|---|---|---|
| Piemonte | 170.3 | 25,401 | 4.6% | 43.7% | 50.9% | 0.0% | 0.9% | 0.52 |
| Valle D’Aosta | 39.6 | 3262 | 1.4% | 8.0% | 90.5% | 0.0% | 0.1% | 0.91 |
| Lombardia | 400.0 | 23,879 | 11.1% | 47.6% | 38.3% | 0.1% | 2.9% | 0.41 |
| Trentino-Alto Adige | 72.7 | 13,605 | 2.1% | 13.8% | 83.7% | 0.0% | 0.4% | 0.84 |
| Veneto | 270.6 | 18,398 | 8.5% | 57.0% | 28.9% | 1.5% | 4.1% | 0.34 |
| Friuli Venezia Giulia | 148.5 | 7849 | 7.2% | 38.9% | 51.5% | 0.3% | 2.0% | 0.54 |
| Liguria | 288.8 | 5420 | 5.1% | 16.5% | 78.2% | 0.0% | 0.2% | 0.78 |
| Emilia-Romagna | 186.4 | 22,453 | 5.1% | 67.2% | 26.1% | 0.5% | 1.0% | 0.28 |
| Toscana | 155.3 | 22,987 | 4.7% | 45.4% | 49.3% | 0.2% | 0.4% | 0.50 |
| Umbria | 101.9 | 8454 | 3.4% | 51.0% | 43.7% | 0.1% | 1.8% | 0.46 |
| Marche | 160.4 | 9382 | 4.7% | 64.3% | 30.8% | 0.0% | 0.1% | 0.31 |
| Lazio | 307.6 | 17,203 | 6.2% | 56.5% | 35.7% | 0.0% | 1.5% | 0.37 |
| Abruzzo | 120.3 | 10,797 | 3.0% | 44.9% | 51.9% | 0.0% | 0.2% | 0.52 |
| Molise | 72.0 | 4440 | 1.9% | 61.6% | 36.3% | 0.0% | 0.3% | 0.37 |
| Campania | 419.2 | 13,600 | 7.2% | 55.3% | 37.3% | 0.0% | 0.2% | 0.38 |
| Puglia | 209.8 | 19,355 | 4.9% | 83.1% | 10.7% | 0.4% | 0.8% | 0.12 |
| Basilicata | 59.3 | 9992 | 1.5% | 57.3% | 40.7% | 0.1% | 0.4% | 0.41 |
| Calabria | 131.3 | 15,083 | 3.6% | 48.2% | 47.9% | 0.0% | 0.3% | 0.48 |
| Sardegna | 70.6 | 24,119 | 2.9% | 46.2% | 49.7% | 0.3% | 0.9% | 0.51 |
| Sicilia | 194.3 | 25,718 | 4.9% | 67.7% | 26.8% | 0.1% | 0.5% | 0.27 |
| REG Boundaries | BAS Boundaries | COM Boundaries | |||||||
|---|---|---|---|---|---|---|---|---|---|
| Polygons | Area | Population | Polygons | Area | Population | Polygons | Area | Population | |
| Green water | 19/20 | 94% | 93% | 95/137 | 86% | 84% | 2160/3011 | 56% | 31% |
| Blue water | 4/20 | 10% | 7% | 29/137 | 9% | 4% | 2433/3011 | 38% | 21% |
| Grey water | 20/20 | 100% | 100% | 137/137 | 100% | 100% | 3010/3011 | 100% | 100% |
| ALL | 4/20 | 10% | 7% | 28/137 | 8% | 3% | 1820/3011 | 32% | 16% |
© 2017 by the authors. Licensee MDPI, Basel, Switzerland. This article is an open access article distributed under the terms and conditions of the Creative Commons Attribution (CC BY) license (http://creativecommons.org/licenses/by/4.0/).
Share and Cite
Bonamente, E.; Rinaldi, S.; Nicolini, A.; Cotana, F. National Water Footprint: Toward a Comprehensive Approach for the Evaluation of the Sustainability of Water Use in Italy. Sustainability 2017, 9, 1341. https://doi.org/10.3390/su9081341
Bonamente E, Rinaldi S, Nicolini A, Cotana F. National Water Footprint: Toward a Comprehensive Approach for the Evaluation of the Sustainability of Water Use in Italy. Sustainability. 2017; 9(8):1341. https://doi.org/10.3390/su9081341
Chicago/Turabian StyleBonamente, Emanuele, Sara Rinaldi, Andrea Nicolini, and Franco Cotana. 2017. "National Water Footprint: Toward a Comprehensive Approach for the Evaluation of the Sustainability of Water Use in Italy" Sustainability 9, no. 8: 1341. https://doi.org/10.3390/su9081341
APA StyleBonamente, E., Rinaldi, S., Nicolini, A., & Cotana, F. (2017). National Water Footprint: Toward a Comprehensive Approach for the Evaluation of the Sustainability of Water Use in Italy. Sustainability, 9(8), 1341. https://doi.org/10.3390/su9081341


