1. Introduction
Monitoring soil moisture content (SMC, i.e., water content) is important for determining water-use efficiency and planning precision-agriculture programs. Optimizing available water and land resources by adjusting the correct SMC to the specific agricultural crop will maximize crop yields and prevent damage. Optimization serves both the economy and the environment and will increase field productivity and decrease irrigation expenses, which can be enormous, especially in arid and semi-arid zones [
1].
Soil moisture serves as a binding factor for soil materials, thereby affecting soil structural stability and strength. Soil moisture is involved in the processes of soil development and degradation with respect to both chemical and biological aspects, and agricultural crop production is influenced mainly by water availability [
2].
Today, SMC is monitored by conservative local sampling and testing methods in the field and in the laboratory, which are time-consuming and expensive, making use of neutron gauges, various types of tensiometers, and time-domain reflectometry [
3,
4].
The subsurface imaging methods using a ground-penetrating radar (GPR) and the frequency domain electromagnetic (FDEM) techniques measure subsurface electrical conductivity and magnetic susceptibility [
5]. Combining them with passive tools such as analytical spectral devices (ASD) has made it possible to estimate soil properties in the field rapidly and with high precision [
3,
6]. The advances in remote-sensing technologies now enable their use to measure SMC, which is responsible for plant and crop growth, and to increase water use effectiveness and efficiency.
The GPR methods currently measure SMC in various ways: multi-offset techniques from reflected waves [
7], waveguide inversion of dispersive data [
8,
9], off-ground measurements [
10], full-waveform inversion [
11].
These recent studies have developed practical tools to obtain real-time monitoring of changes in spatial SMC up to depths of 3–4 m at low cost. Spatial volumetric soil moisture content (VSMC) measurements can be performed using diffraction hyperbola analysis methods combined with qualitative and quantitative methods.
The aim of this paper was to present the use of diffraction and reflection to estimate the VSMC in the laboratory for various agricultural soils and a wide moisture content range and to establish the first step toward a field-scale GPR application. The final aim of this research is to develop a spatial, non-destructive, non-invasive, cost-effective method based on GPR application for measuring SMC.
Electromagnetic (EM) methods provide an additional advantage in that they enable spatial mapping of the soil structure below the surface. Moisture content measurements using GPR are not limited to a specific location or depth. Spatial measurements performed using GPR systems allow monitoring areas that include thousands of measurement points per hectare, thus providing a picture of the spatial subsurface situation in real time, with precision levels between 1% and 5%. The application of this study’s results will increase the efficiency and effectiveness of the agricultural production and will help decrease water waste in agriculture.
2. Materials and Methods
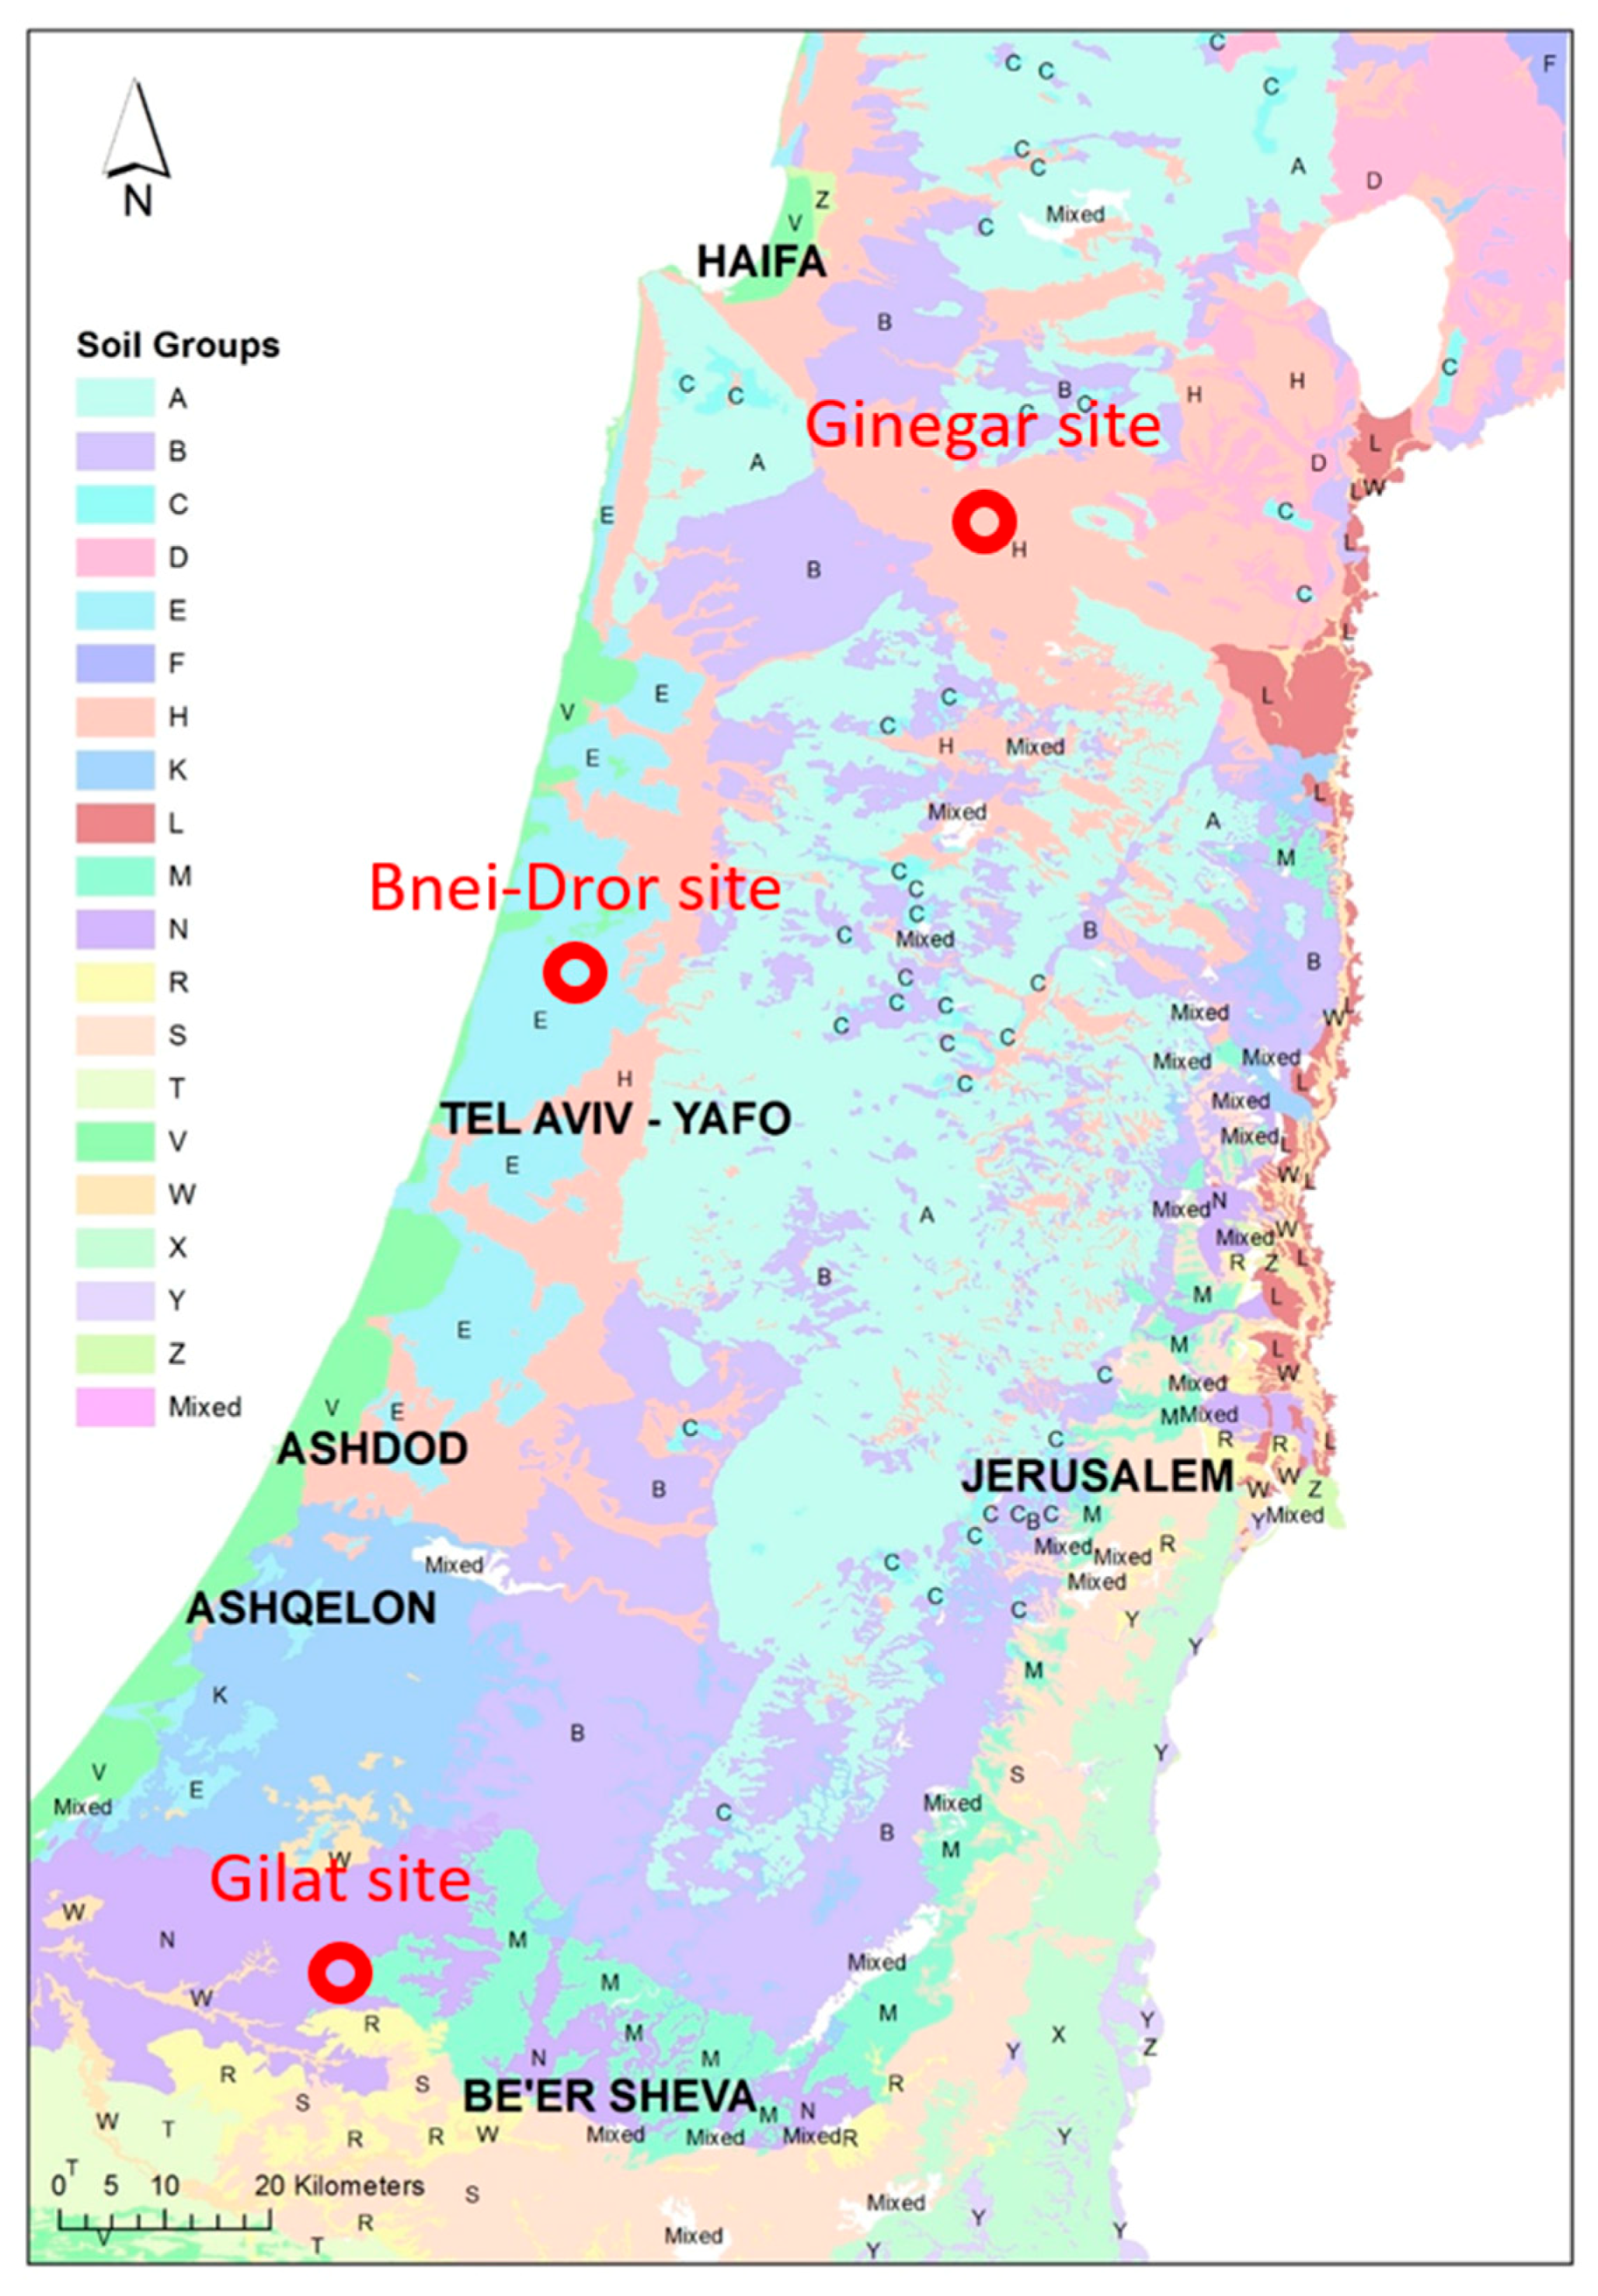
The chosen research sites represent three main agricultural soil types in Israel, i.e., the northern Negev in the south of Israel, the Jezreel valley in the north of Israel, and the Sharon coastal plain in central Israel (
Figure 1).
The soil from the northern Negev area at the Gilat research site (
Figure 1) was characterized as light-brown loess (calcic haploxeralf [
13]). The soil there is very deep (more than 100 cm depth), with rock fragments mixed with the soil down to a depth of 20 cm [
14].
The soil from the Sharon coastal plain area at the Bnei-Dror research site (
Figure 1) was characterized as hamra (typic rhodoxeralf [
13]). The research site was near the dried-up Dror River area in the eastern Poleg River basin in the Sharon coastal plain in central Israel. The soil was red-brown in color and very deep (more than 100 cm depth), with no rock fragments [
14].
The soil from the Jezreel valley area at the Ginegar research site (
Figure 1) was characterized as grumusol (typic chromoxerets [
13]). The soil was dark brown in color and was very deep (more than 100 cm depth), with no rock fragments [
14].
The research was based on GPR measurements and analysis. GPR is a reflection–scattering EM-wave-imaging method; the imaged sections are time-dependent recorded responses to the propagation of EM energy in subsurface materials through a radio-wave frequency range of about 10 MHz to 2 GHz. It has the ability to provide three-dimensional (3D) cross-sectional imaging with high resolution for stratigraphic descriptions of the subsurface in ‘real time’. This makes GPR one of the best tools in shallow geophysical exploration for non-invasive subsurface characterizations [
15].
Conventional operation of the GPR system produces reflection profiles in which most returned signals are influenced by the reflections and diffractions from discontinuities in the subsurface. Other types of radio waves can also be created in the system, such as direct waves in the air, refracted waves, and direct ground waves, as expected from ray theory principles and simple geometrical relationships [
16,
17]. Material permittivity (F/m),
ε, material conductivity (S/m),
, and material permeability (H/m),
, are the three main components of EM methods and GPR. Dielectric permittivity characterizes the bond charge displacement in the material structure due to the electric field, which causes energy storage in the material. Electrical conductivity
characterizes free charge movement (creating an electric current) when an electric field is applied and the resistance to the charge current leads to energy dispersal. Magnetic permeability
describes how inherent molecular and atomic magnetic moments respond to the magnetic field. For simple materials, the distortion of inherent magnetic moments leads to energy storage in the material [
18].
Permittivity,
, describes a material’s ability to store and release EM energy in the form of an electric charge; it is related to a capacitor’s ability to store and limit the flow of free charges or the degree of polarization (F/m) demonstrated by a material under the effect of an active electric field. Typically, a dimensionless relative permittivity term (
) is used [
18], also termed a dielectric constant (
k). This term can be defined as follows:
Permittivity (dielectric constant) of free air (vacuum) is , given as 8.8542 × 10⁻¹² F/m, and is the material permittivity. The permittivity of subsurface materials can change significantly, especially in the presence of free or bound water (i.e., it is higher for wetter material, and lower for drier material), and it is usually complex and frequency-dependent, with a real (storage) and imaginary (loss) magnitude. The permittivity value of a material is often simplified to its constant, real part of the complex permittivity at low frequency (static), ignoring the loss expression. It is convenient to calculate an approximation of radar wave velocities and lengths. The relative permittivity of most common subsurface materials changes from .
These parameters—
c (~3 × 10
8 m/s),
(rad/s),
,
, and
—can be used to estimate velocity (m/s) during experimental measurements and to determine the real velocity characteristics of lossy materials. In most cases, the conductivity constituent is considered to be independent of frequency and, in general, is related only to the ionic conductivity of internal fluids and the surface charge conductivity of clay minerals [
19,
20,
21].
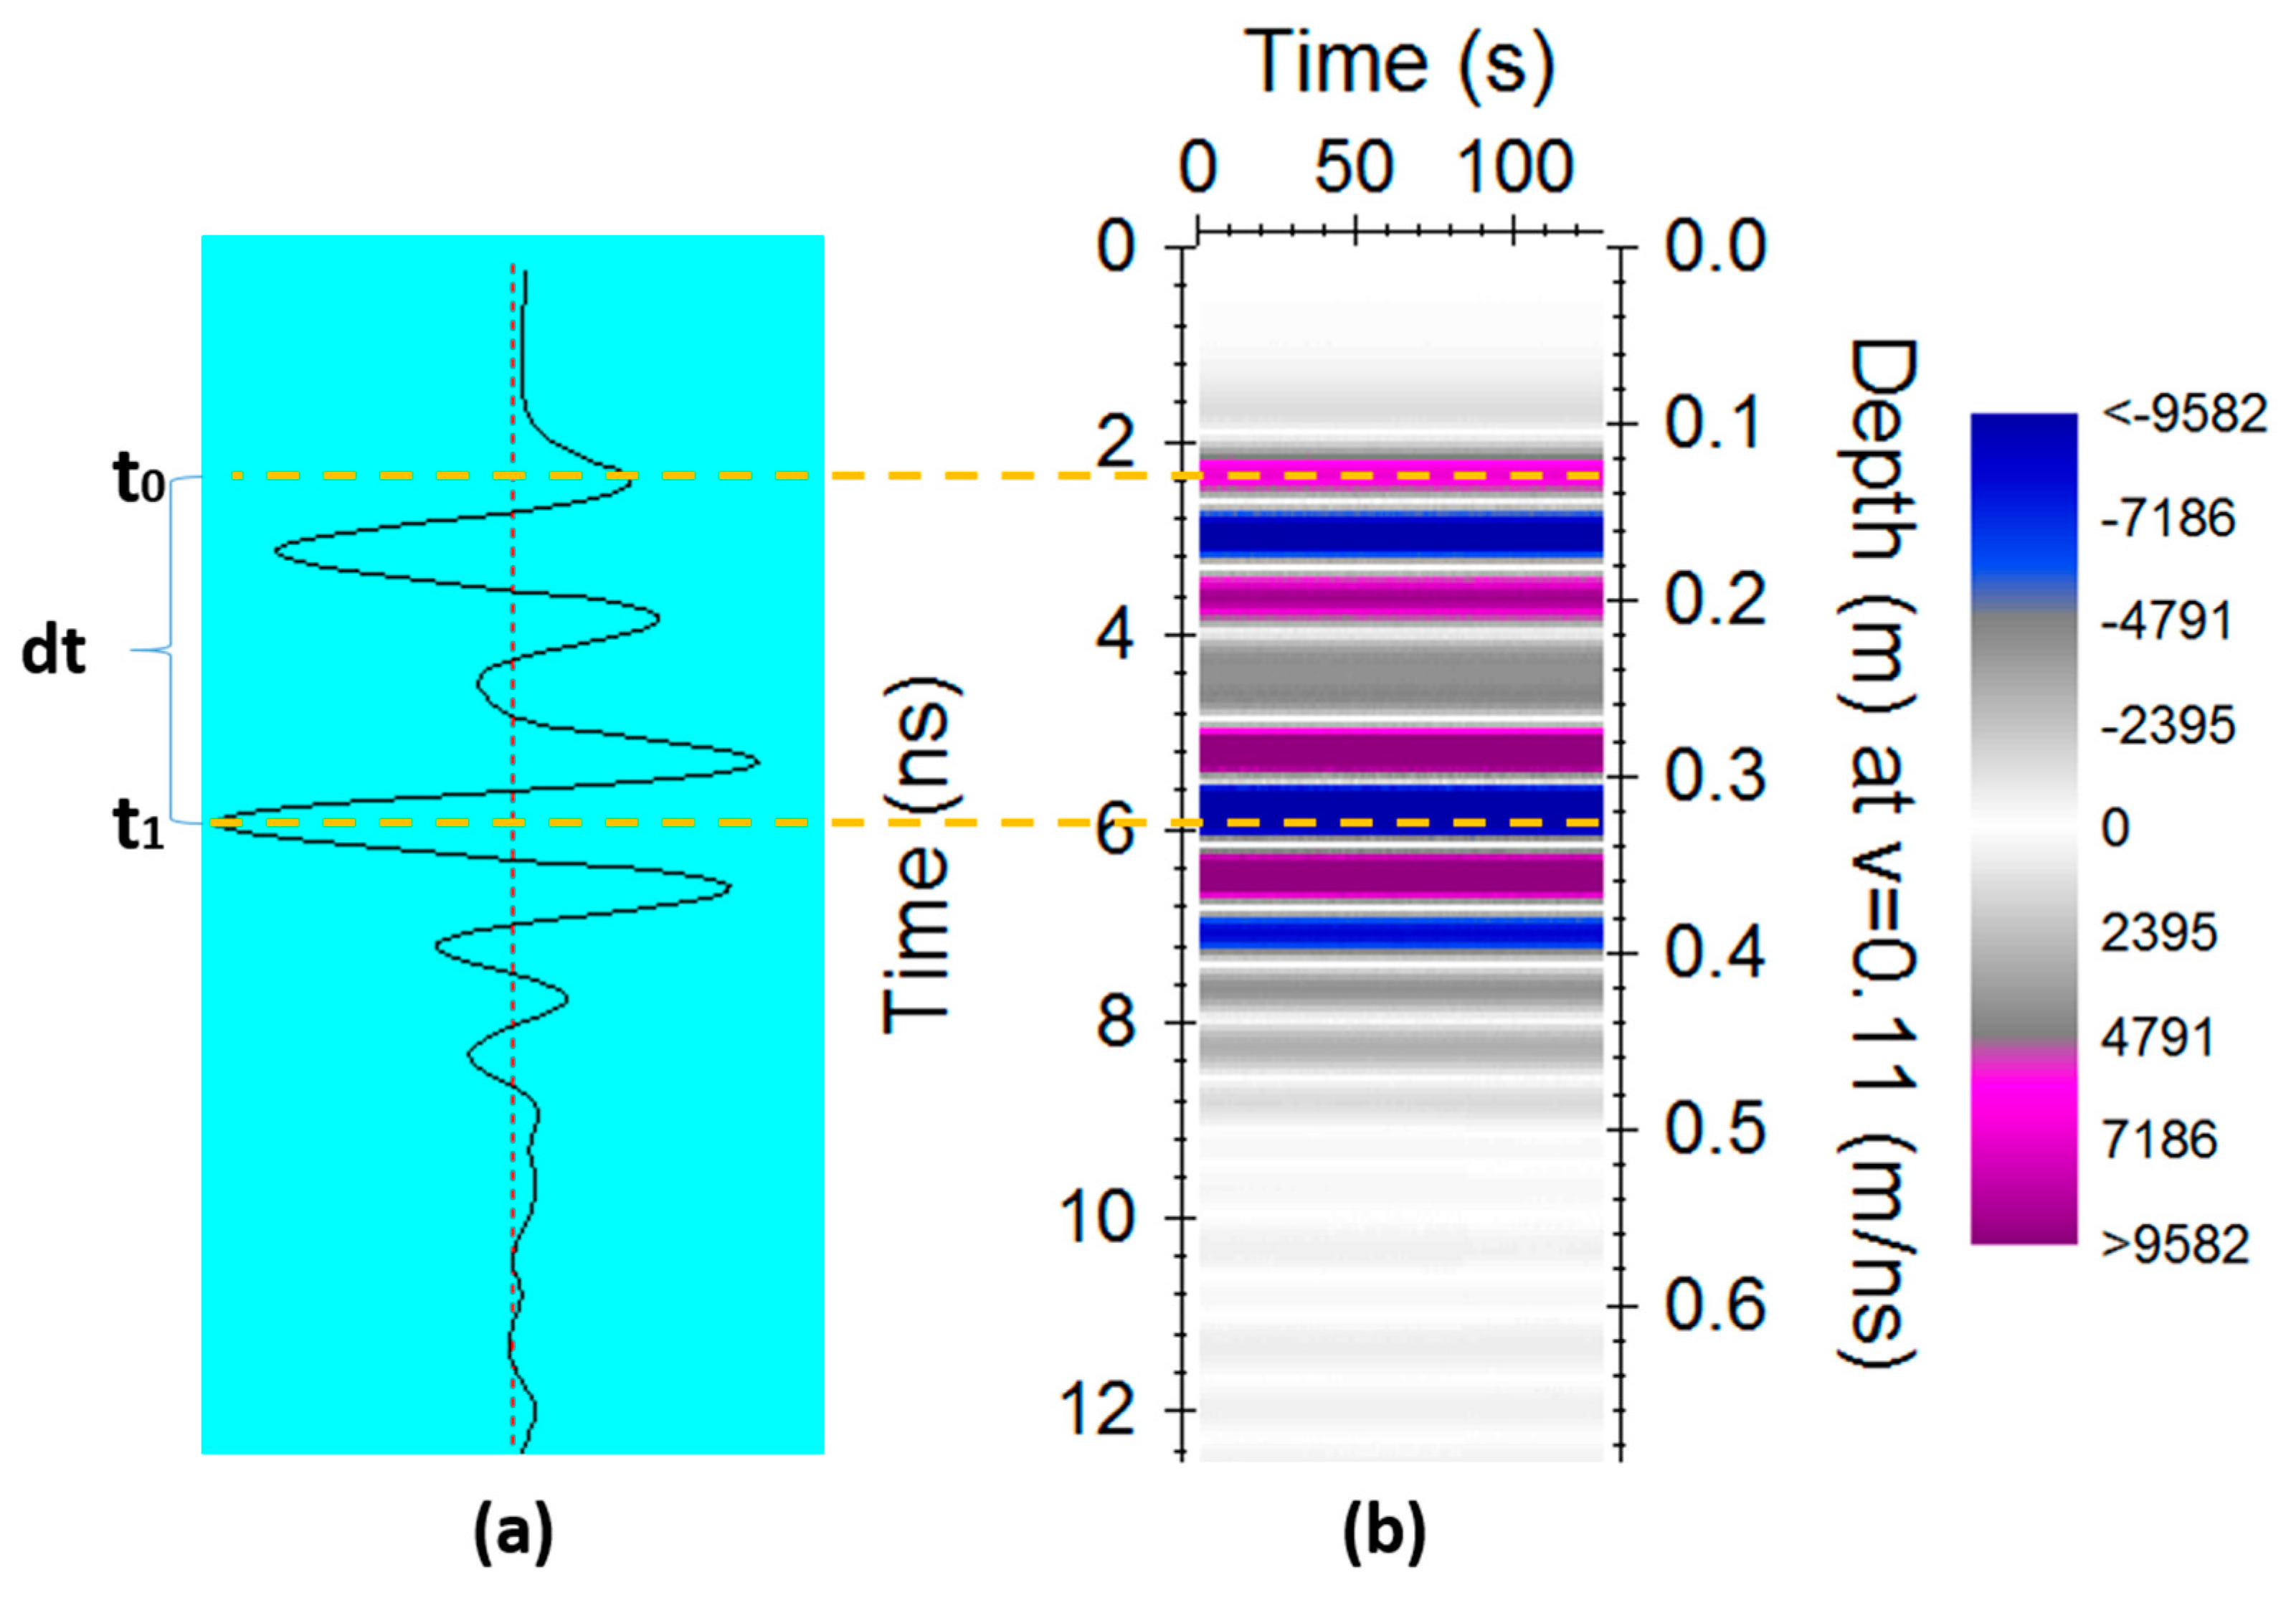
EM waves are influenced by reflections from subsurface elements that are of the approximate size of the transmitted wavelength, and by diffractions created by small discontinuities and objects [
15]. In the subsurface medium, diffraction can be detected as a hyperbolic reflection in a temporal section and appears in two cases: when the dominant wavelength,
λc, is larger than the source of the diffraction, and when the waves are broken by sharp edges [
22,
23]. Velocity analysis of hyperbolic reflections in the GPR cross section is a significant factor in measuring volumetric moisture content, because of the relationship between the medium’s wave velocity and the dielectric constant [
17]. Calculating velocities from radar cross sections allows obtaining the values of the different dielectric constants in the medium [
24]. A practical approximation of the dielectric constant from wave velocity in the soil layers is given by [
25]:
where
k is the dielectric constant,
c = 0.3 m/ns is the wave velocity in a vacuum, and
is the characteristic radio-wave velocity in the medium.
The volumetric effective relative dielectric constant is affected by soil particles volumes (mineral, liquid, and gas). It can be described approximately as a mean value of all of the dielectric constants of the different soil components [
26]:
where
keff is the effective relative dielectric constant,
ki is the dielectric constant of the specific soil component,
Vi is the relative volume of the specific component, and
N is the number of soil components.
Soil mineral particles are inorganic materials derived from rocks as a result of weathering, with varying size. The pore space is filled with water and air, with soil moisture and air typically making up about 50% of the soil volume and effective porosity. The difference in the effective dielectric constant of ‘dry’ and ‘wet’ soils is mainly a function of the ratio between the air and water volumes when the total volume is normalized to 1 [
26].
where
Vw is the relative water volume,
ks is the soil dielectric constant (values of 3–8),
keff is the effective dielectric constant,
n is the soil porosity (from 0 to 1).
The laboratory setting (including soil samples from the research sites) consisted of high-resolution GPR measurement experiments in relatively homogeneous soils with a large range of SMC. The soil samples were gathered manually after passing through a 4 mm sifter. GPR measurements included calibration and irrigation experiments in soil boxes, using a shielded 800 MHz antenna operated with a ProEx control unit built by Mala Geoscience AB of Guideline Geo, in a single-offset position. The calibration experiments were performed by static GPR measurement of sections in 21 L soil boxes, while the irrigation experiment was conducted in 270 L and 750 L soil boxes using GPR to monitor the cross sections. The controlled laboratory setting allowed maximum measurement range, resolution, and accuracy.
Soil characteristics such as moisture content (volumetric and gravimetric), porosity, and density, among others, were measured and calculated in the GPR soil laboratory. GPR measurement is volumetric. Therefore, SMC measurements were conducted as such or converted from gravimetric measurements via the soil bulk density, and then correlated to the GPR measurements. A semi analytical balance with accuracy of 0.1 g was used to weigh the soil samples. For ease of use, the term VSMC may be simplified to moisture content.
Soil properties (e.g., density, compaction, moisture content, etc.) differ as a consequence of soil destruction by extraction, sifting, drying, and repacking. The measured soil properties of bulk density and porosity are detailed in
Table 1 and
Table 2.
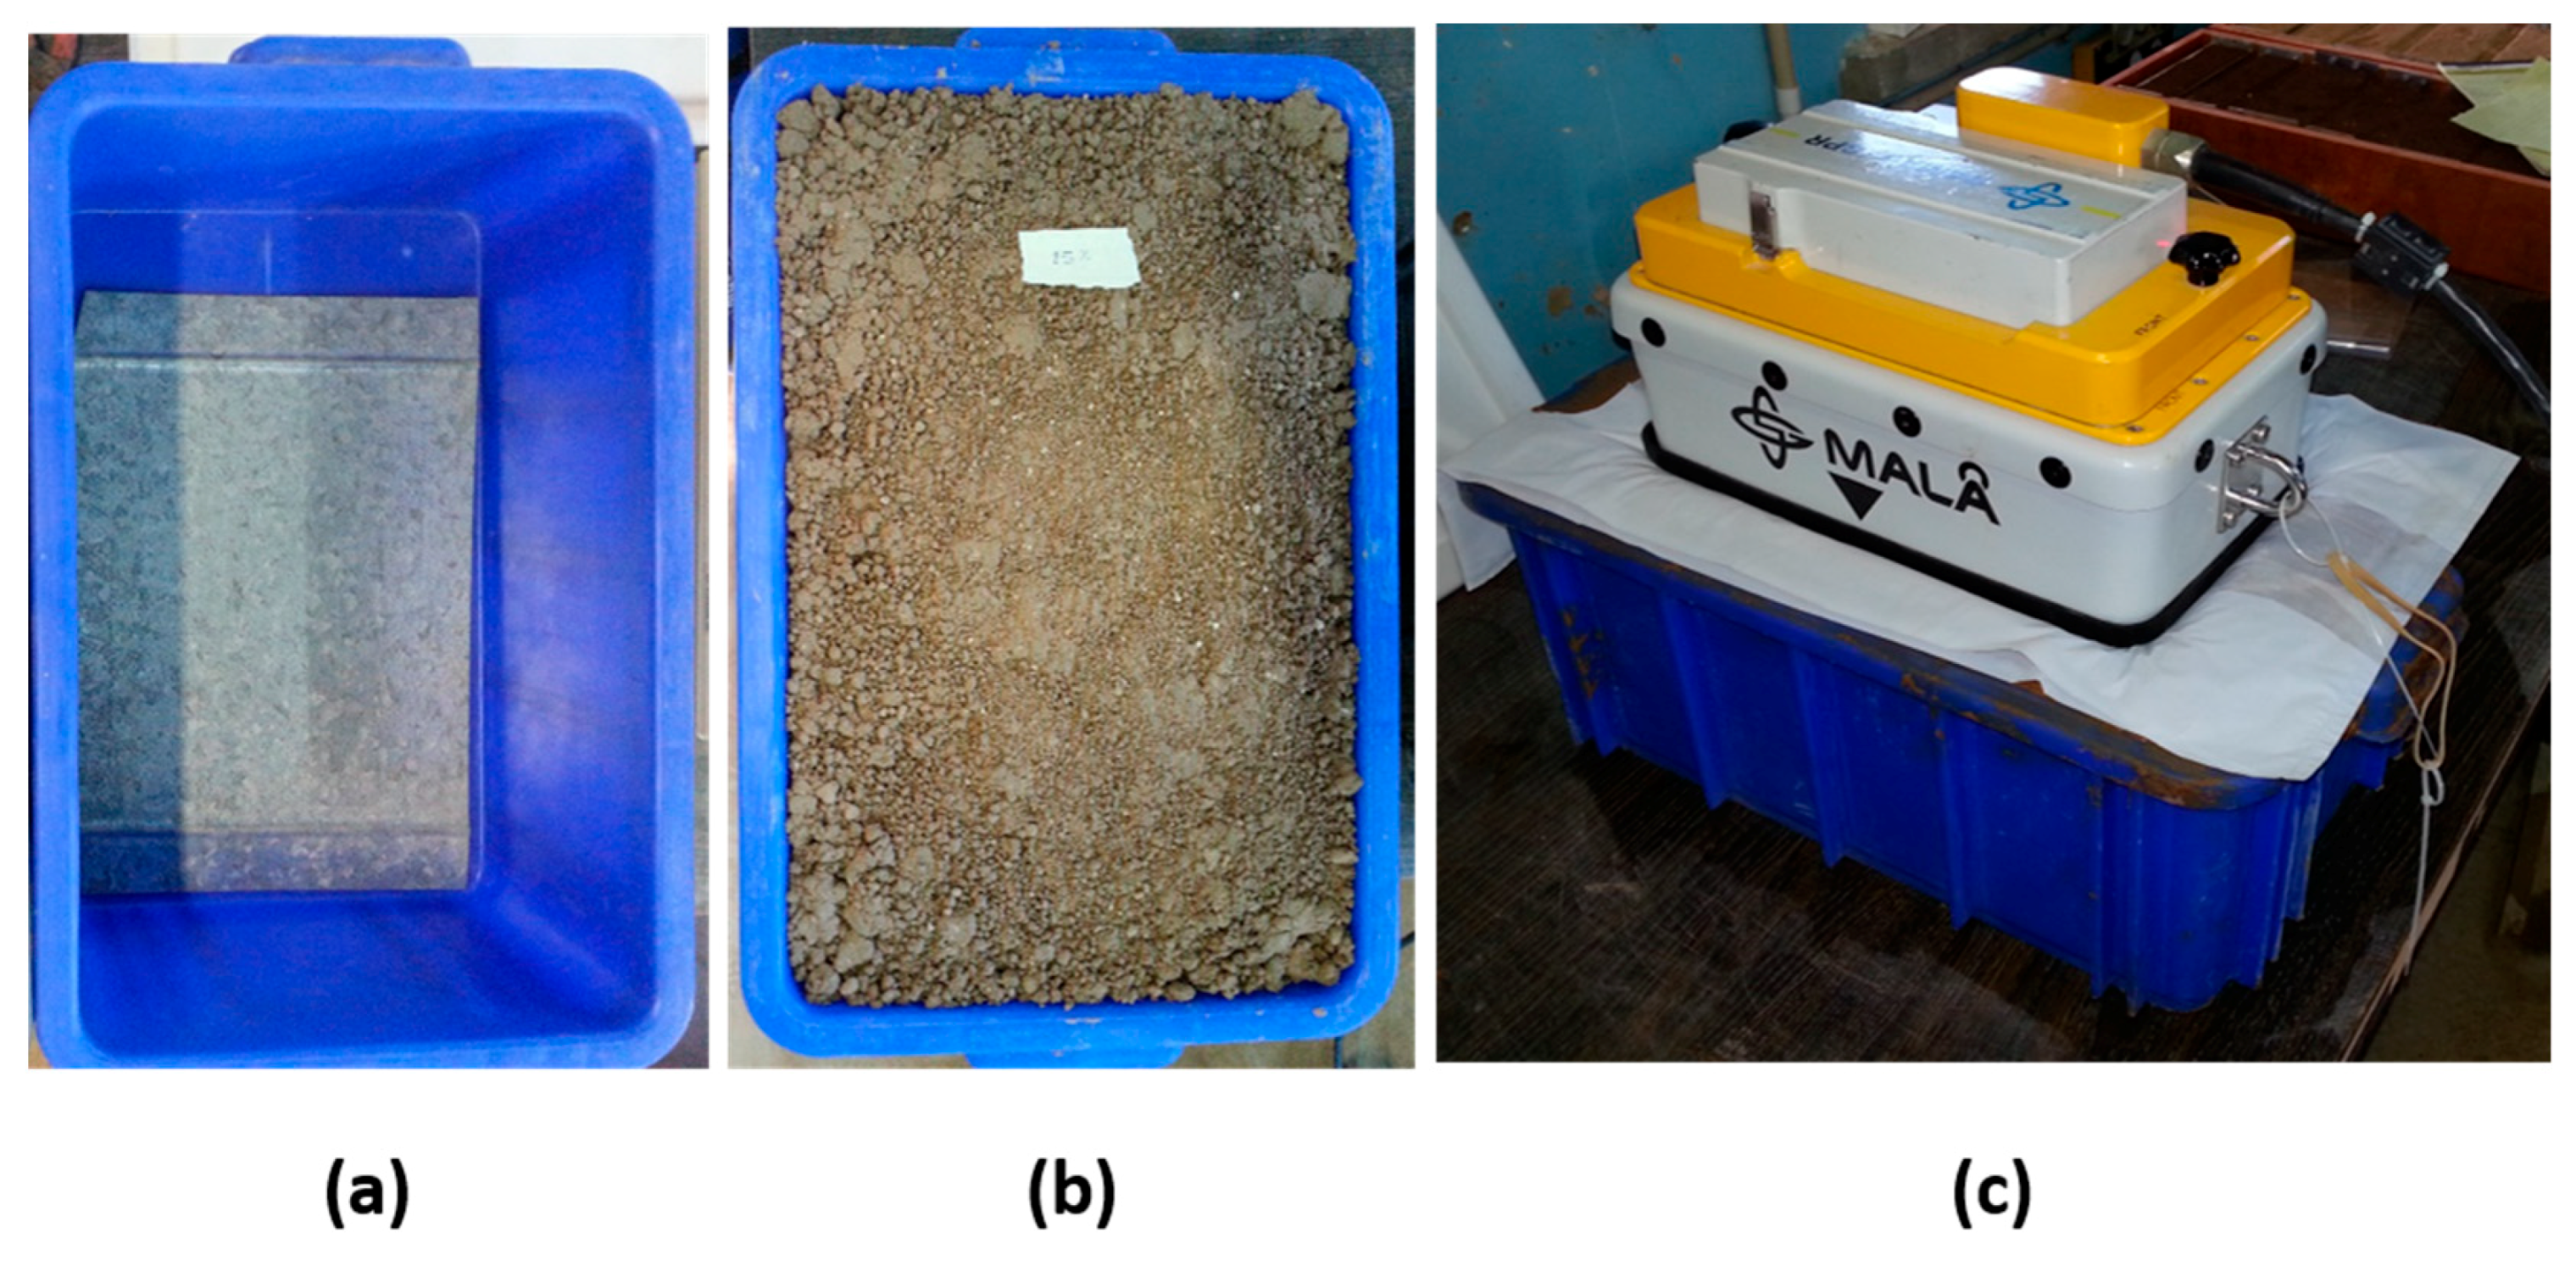
The GPR system was calibrated for each soil by performing volumetric measurements at different moisture contents. The measurements were performed at a nominal frequency of 800 MHz in plastic boxes with a volume of 21 L (
Figure 2), with a metal plate placed at a known depth at the bottom of the box (
Figure 2a) for strong and clear reflection of the GPR signals. The moisture content was gradually raised in steps by 5%. The soil samples were mixed manually before each measurement to rapidly create relative uniformity in the medium (
Figure 2b). The antenna was placed above and attached to the soil box surface in a static position for a finite measurement time (
Figure 2c). The GPR moisture content measurements were compared to the standard method using 100 mL samples dried in the oven for 48 h at 105 °C [
27]. The GPR time-section measurements were conducted in the boxes using a transmitter antenna and a receiving antenna with spatial separation of 14 cm, sampling frequency of 15 GHz, 64 stacks, and time window of 13.8 ns in hamra soil and 19.5 ns in loess and grumusol soils. The GPR measurements were performed shortly after manual mixing.
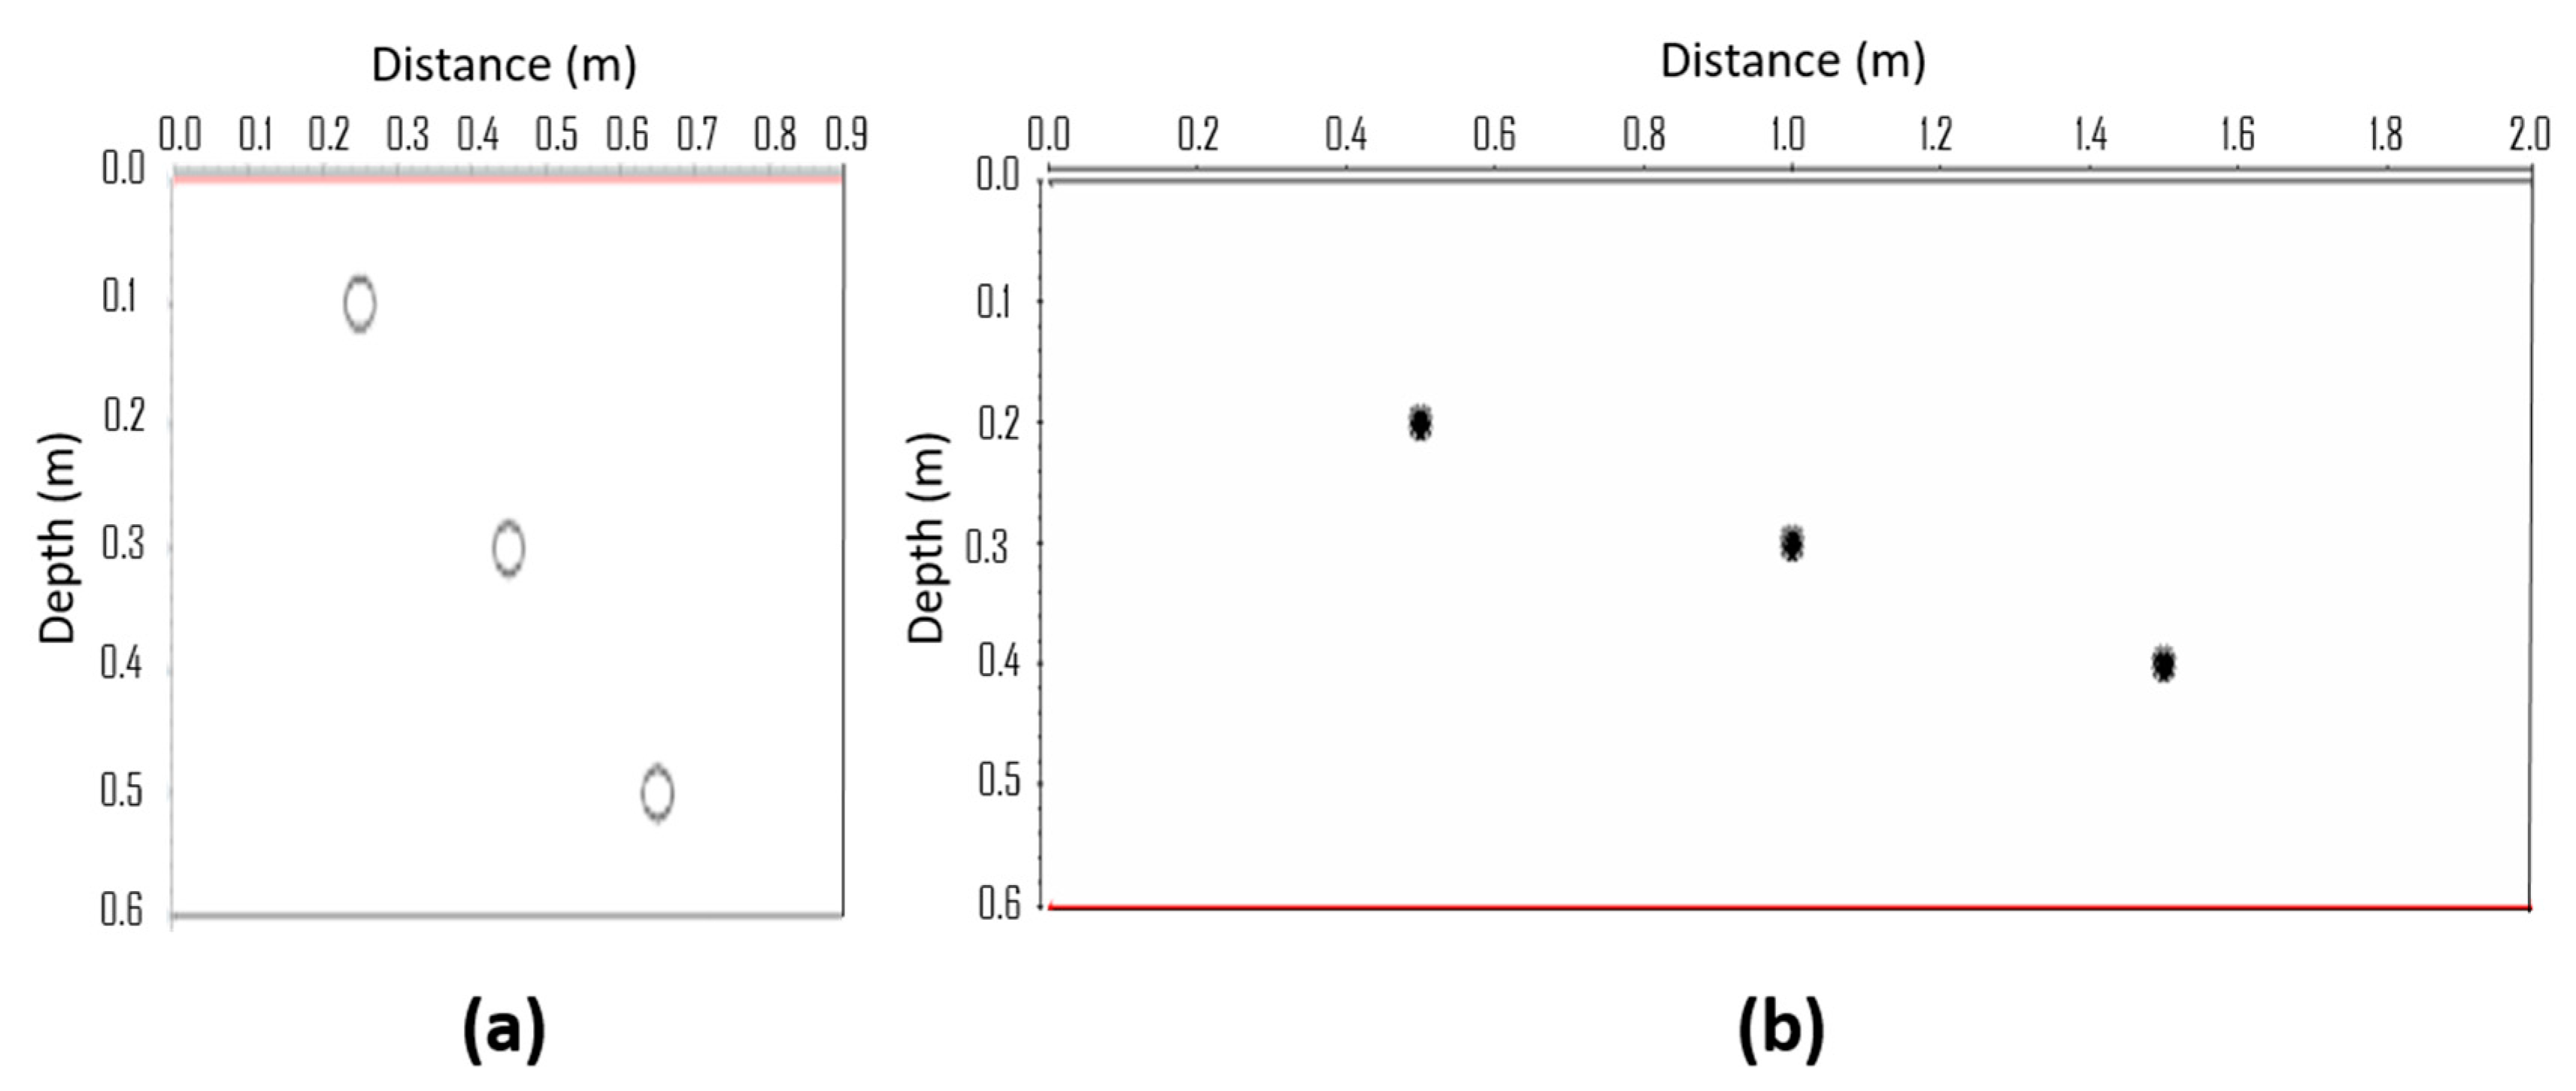
Laboratory experiments involving irrigation simulations with the geophysical software Reflex-Win (by Sandmeier geophysical research) were performed to predict the SMC measurements in soil boxes with the GPR. The model size was based on the small soil boxes (90 × 50 × 60 cm) with three diffractors at depths of 10, 30, and 50 cm; the distance between the diffractors was 20 cm and 25 cm from the box edges (
Figure 3). The EM properties controlling the models were the dielectric constant, electrical conductivity, and electromagnetic wave velocity. The simulation was based on a finite difference (FD) method algorithm for propagating waves in the medium in the time domain. This method allows the simulation of the kinematics (travel time) as well as the dynamics (amplitude, frequency etc.); an explicit method is used, i.e., the wave field is calculated for a certain point of time with the values of the preceding point of time etc. [
28]. The section was a single-offset 2D section with parameters of dx = 1 cm (lateral sampling), dt = 0.02 ns (time sampling), and a central frequency of 800 MHz with Kuepper wavelet signal type.
The 2D high-resolution GPR sections for the irrigation experiment were carried out in small soil boxes for loess and hamra soils and in large soil boxes for grumusol. The radar system was moved manually along the section segments. The moisture content was measured at the beginning (air-dried state) and end (saturation state) of the irrigation experiment for each soil type.
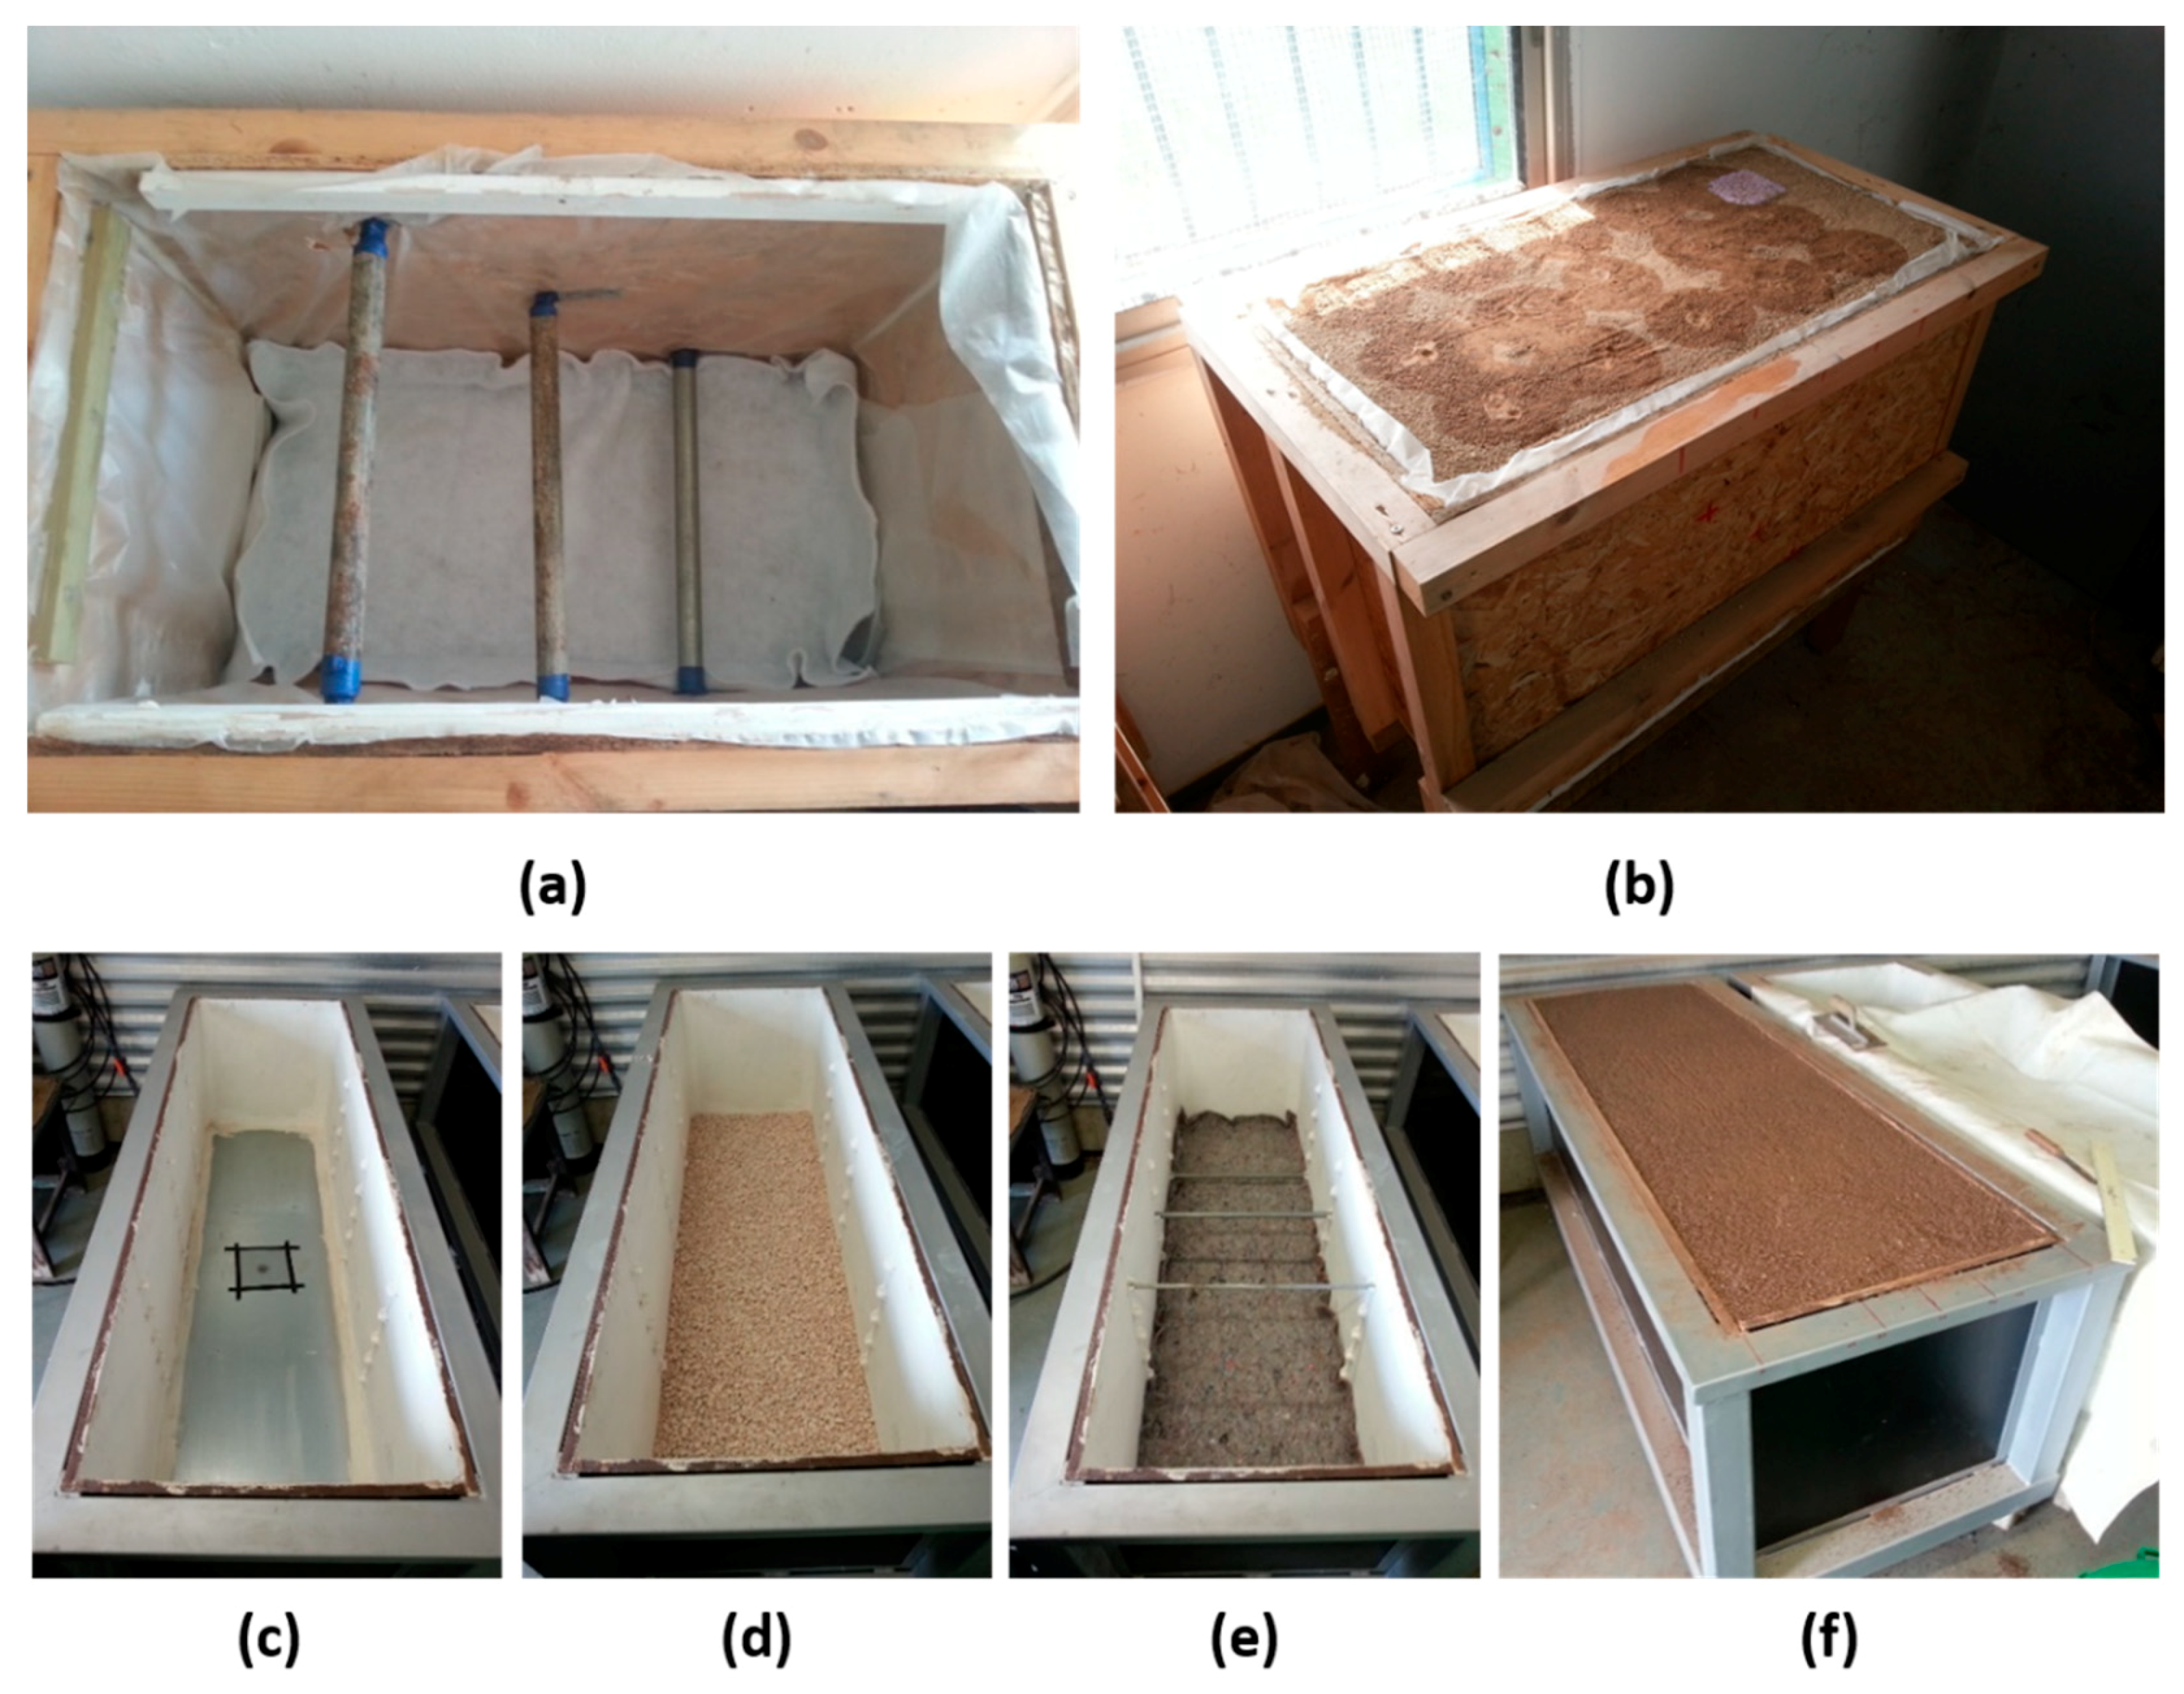
The small wood soil box size was 90 × 50 × 60 cm, with a total volume of about 270 L. Inside the boxes, three iron-tube line diffractors were inserted with external diameter of 3 cm, at depths of 10, 30, and 50 cm, placed 20 cm apart and 25 cm from the box edges (
Figure 3a). The large metal soil box dimensions were 200 × 60 × 60 cm, with a total volume of about 750 L. Inside the box, there were three iron-bar line diffractors with external diameter of 2 cm at depths of 20, 30, and 40 cm, placed 50 cm apart and 50 cm from the box edges (
Figure 3b).
The boxes’ bottom included layers of thin netting, consisting of gravel as the upper level and geotechnical fabric as the upper bottom layer, to prevent soil loss and allow water flow. The boxes were filled to the top with soil (
Figure 4). A tap was placed at the box bottom to drain the water after the experiment under saturation conditions. The irrigation system was built using distilled water columns (TREION, Treitel Chemical Engineering) supplying non-saline water through a super-sensitive water meter, specially designed for high accuracy and a wide measuring range. The drip-irrigation system included three lines. In the small boxes, there were five drippers every 15 cm along each line (the same as the distance between the lines), with built-in drippers. The flow rate in this system reached 30 L/h, whereas, in the large box with 36 drippers, it reached 72 L/h.
Much of the general GPR processing was adapted from high-level seismic data analysis [
29]. Basic processing can be carried out in a real-time display for on-site interpretation and, therefore, was adopted for the laboratory irrigation experiment, highlighting the diffractions hyperbolic pattern. More complex processing (e.g., migration, de-convolution, etc.) was tested but discarded, since the research focused on diffraction hyperbola analysis close to real time in the field.
The applied filters in the data processing were: (i) de-wow: Ideally, the baseline amplitude of each trace should be zero. However, because of the dynamic range limitations of the instrumentation and the EM induction effects in the conductive ground, there were low-frequency component variations in the baseline amplitude, including bias or constant shift [
30]. The temporal filter removed the low-frequency components, and the running mean value of each trace was subtracted from the signal. (ii) Time zero: The first arrival time from the ground can be shifted by thermal or electronic drift, cable-length differences, or changes in antenna height. It needs to be leveled to a common datum (e.g., max phase correction). The subtraction of the first arrival time was also needed for accurate evaluation of later events. (iii) Time gain: Wave propagation in the medium is accompanied by geometrical spreading losses (approximately 1/r
2) and signal attenuation. To equalize the signal return from all depths, a time-dependent gain function was applied. An energy-decay function, also known as spherical and exponential compensation (SEC), automatically amplified the signal amplitude to compensate for the energy loss by geometric spreading. The automatic gain control (AGC) function enhanced each trace by creating a temporally equally distributed signal amplitude within a predefined time window. This is a nonlinear process, so other filters will operate differently before and after time gain. It also changes the relative amplitudes and phase relationship [
31].
4. Discussion
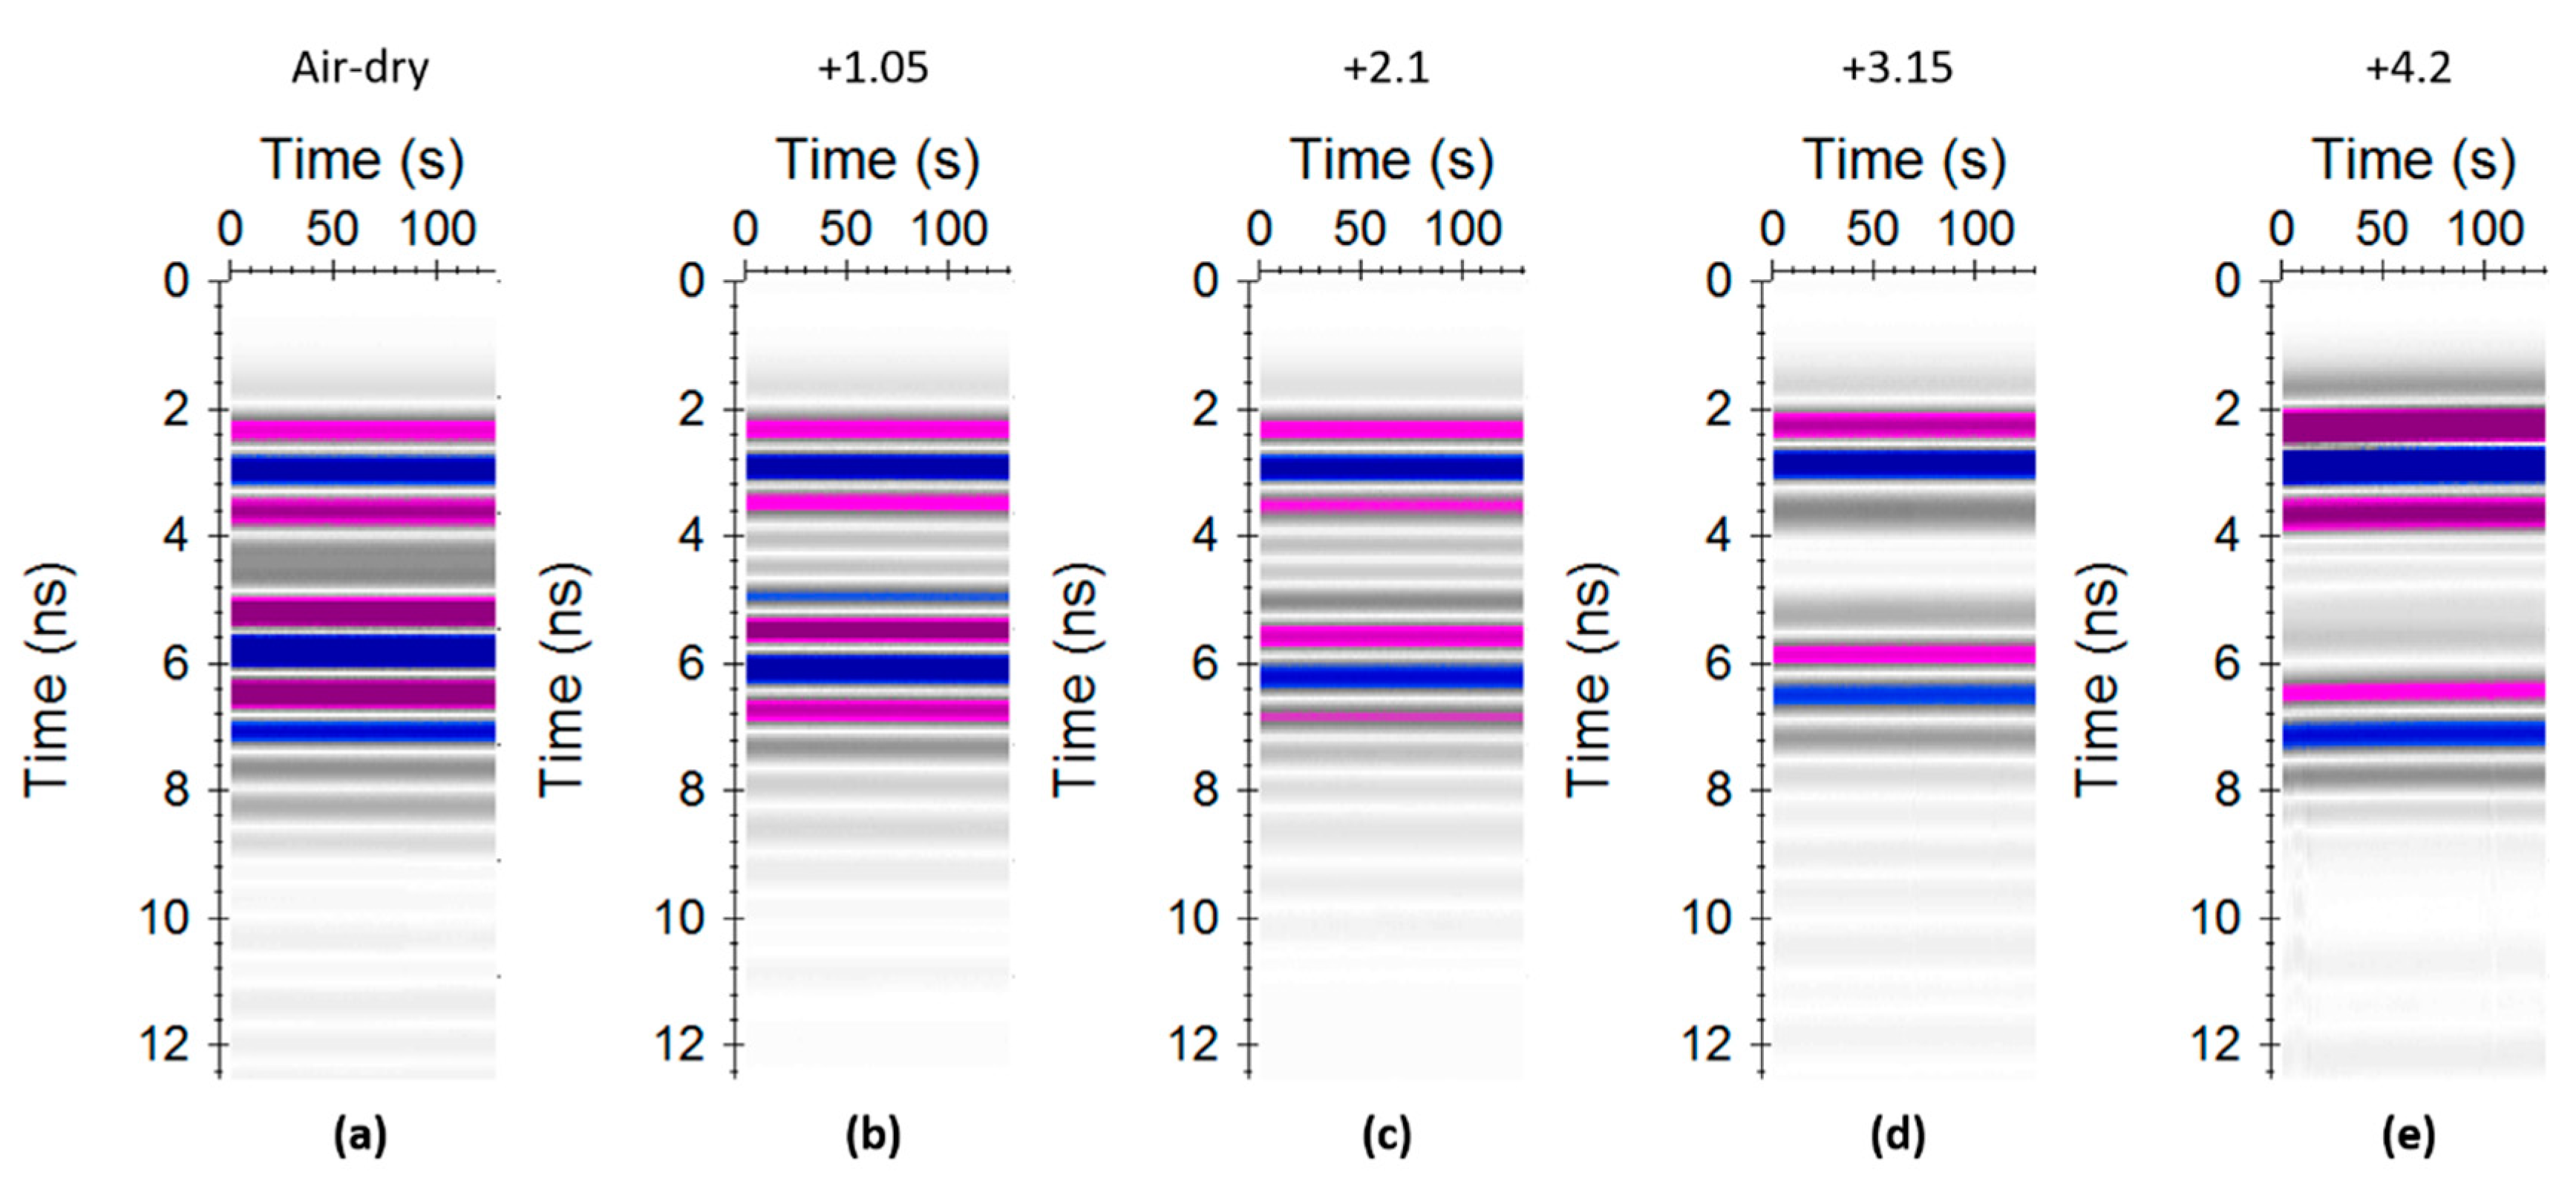
The changes in EM properties from the GPR measurement calibration experiments were correlated to the moisture content measurements (oven dry) in each tested soil. Increasing the moisture content directly affected the relative dielectric constant and the wave propagation velocity, influencing the GPR signals.
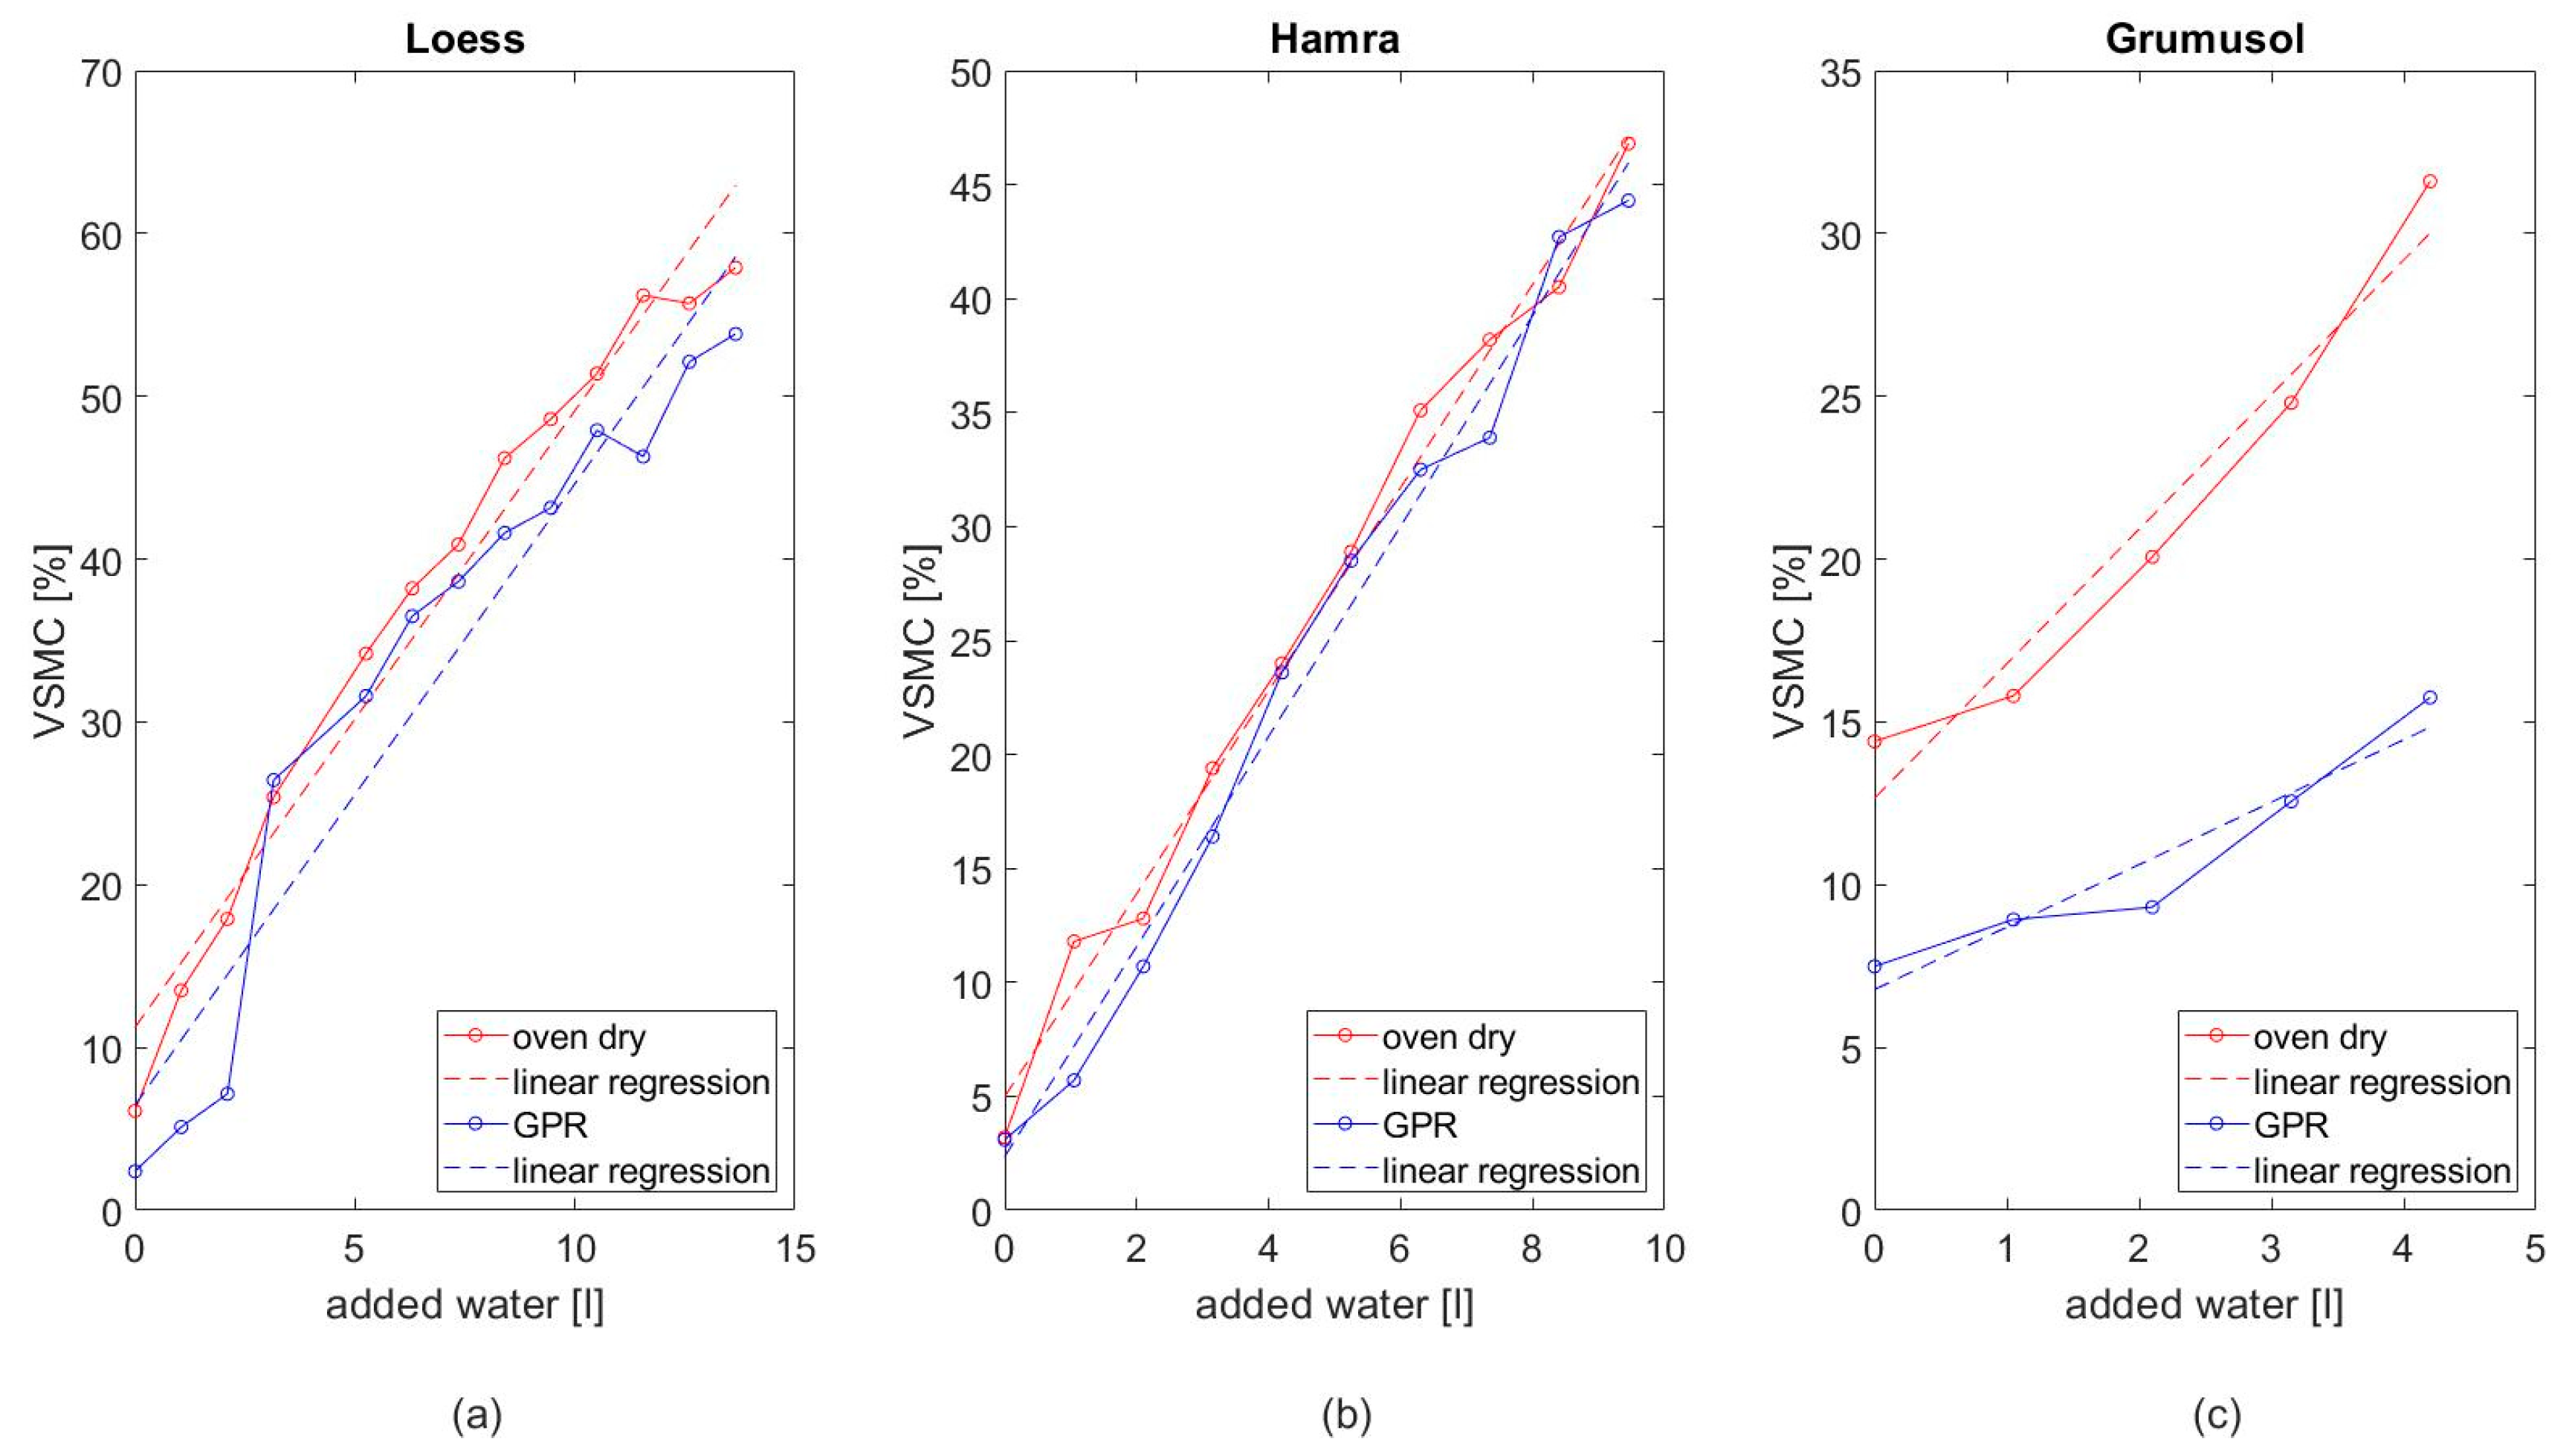
The calibration experiment presented the GPR subsurface imaging in loess and hamra soils for a wide range of moisture contents. GPR measurement of the grumusol soil type showed partial capabilities, with reliable results at lower moisture contents, starting from 14.4% up to about 31.6% (see error analysis above (in
Section 3)), and less reliable results at the upper moisture contents. These results are meaningful for agricultural applications, especially in arid and semi-arid regions, where natural water is scarce, and farmers usually irrigate to field capacity (additional irrigation above field capacity will be lost because of gravitational forces).
The calibration experiment results showed that the GPR method slightly underestimated the moisture content in hamra soil by an average 1.9% with 2.3 SD (standard deviation) and in loess soil by 4.6% with 3.4 SD compared to the standard method. Grumusol calibration results showed an average underestimation of moisture content of 10.5% with 3.4 SD, which is approximately half that of the standard method.
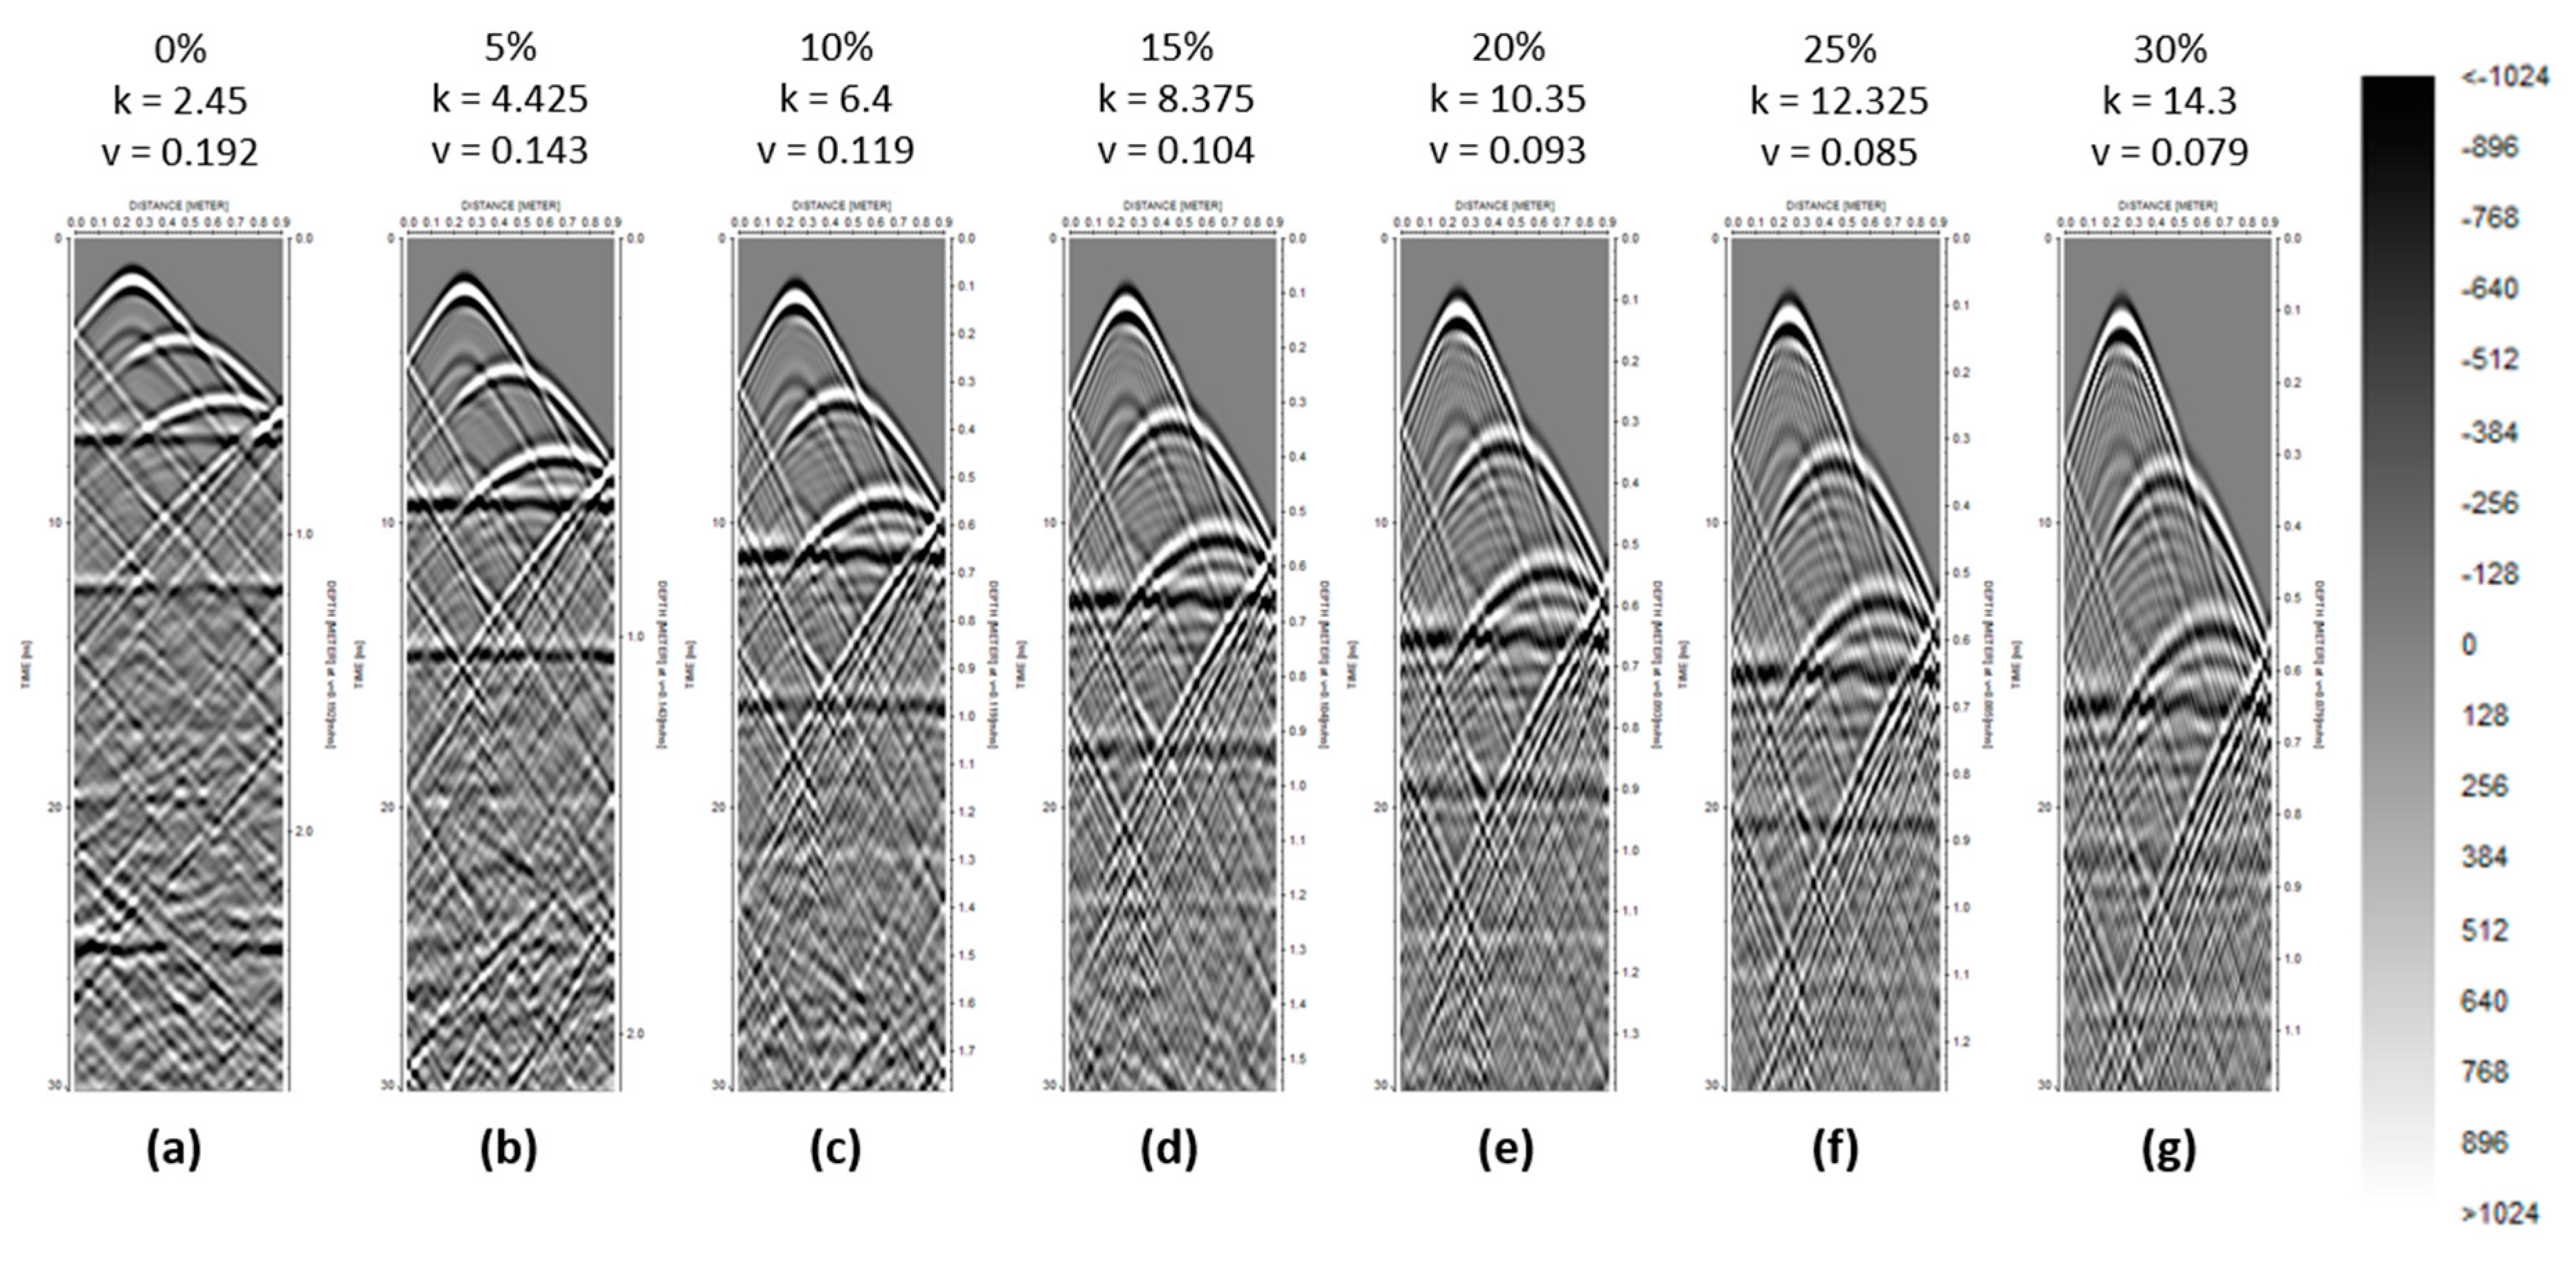
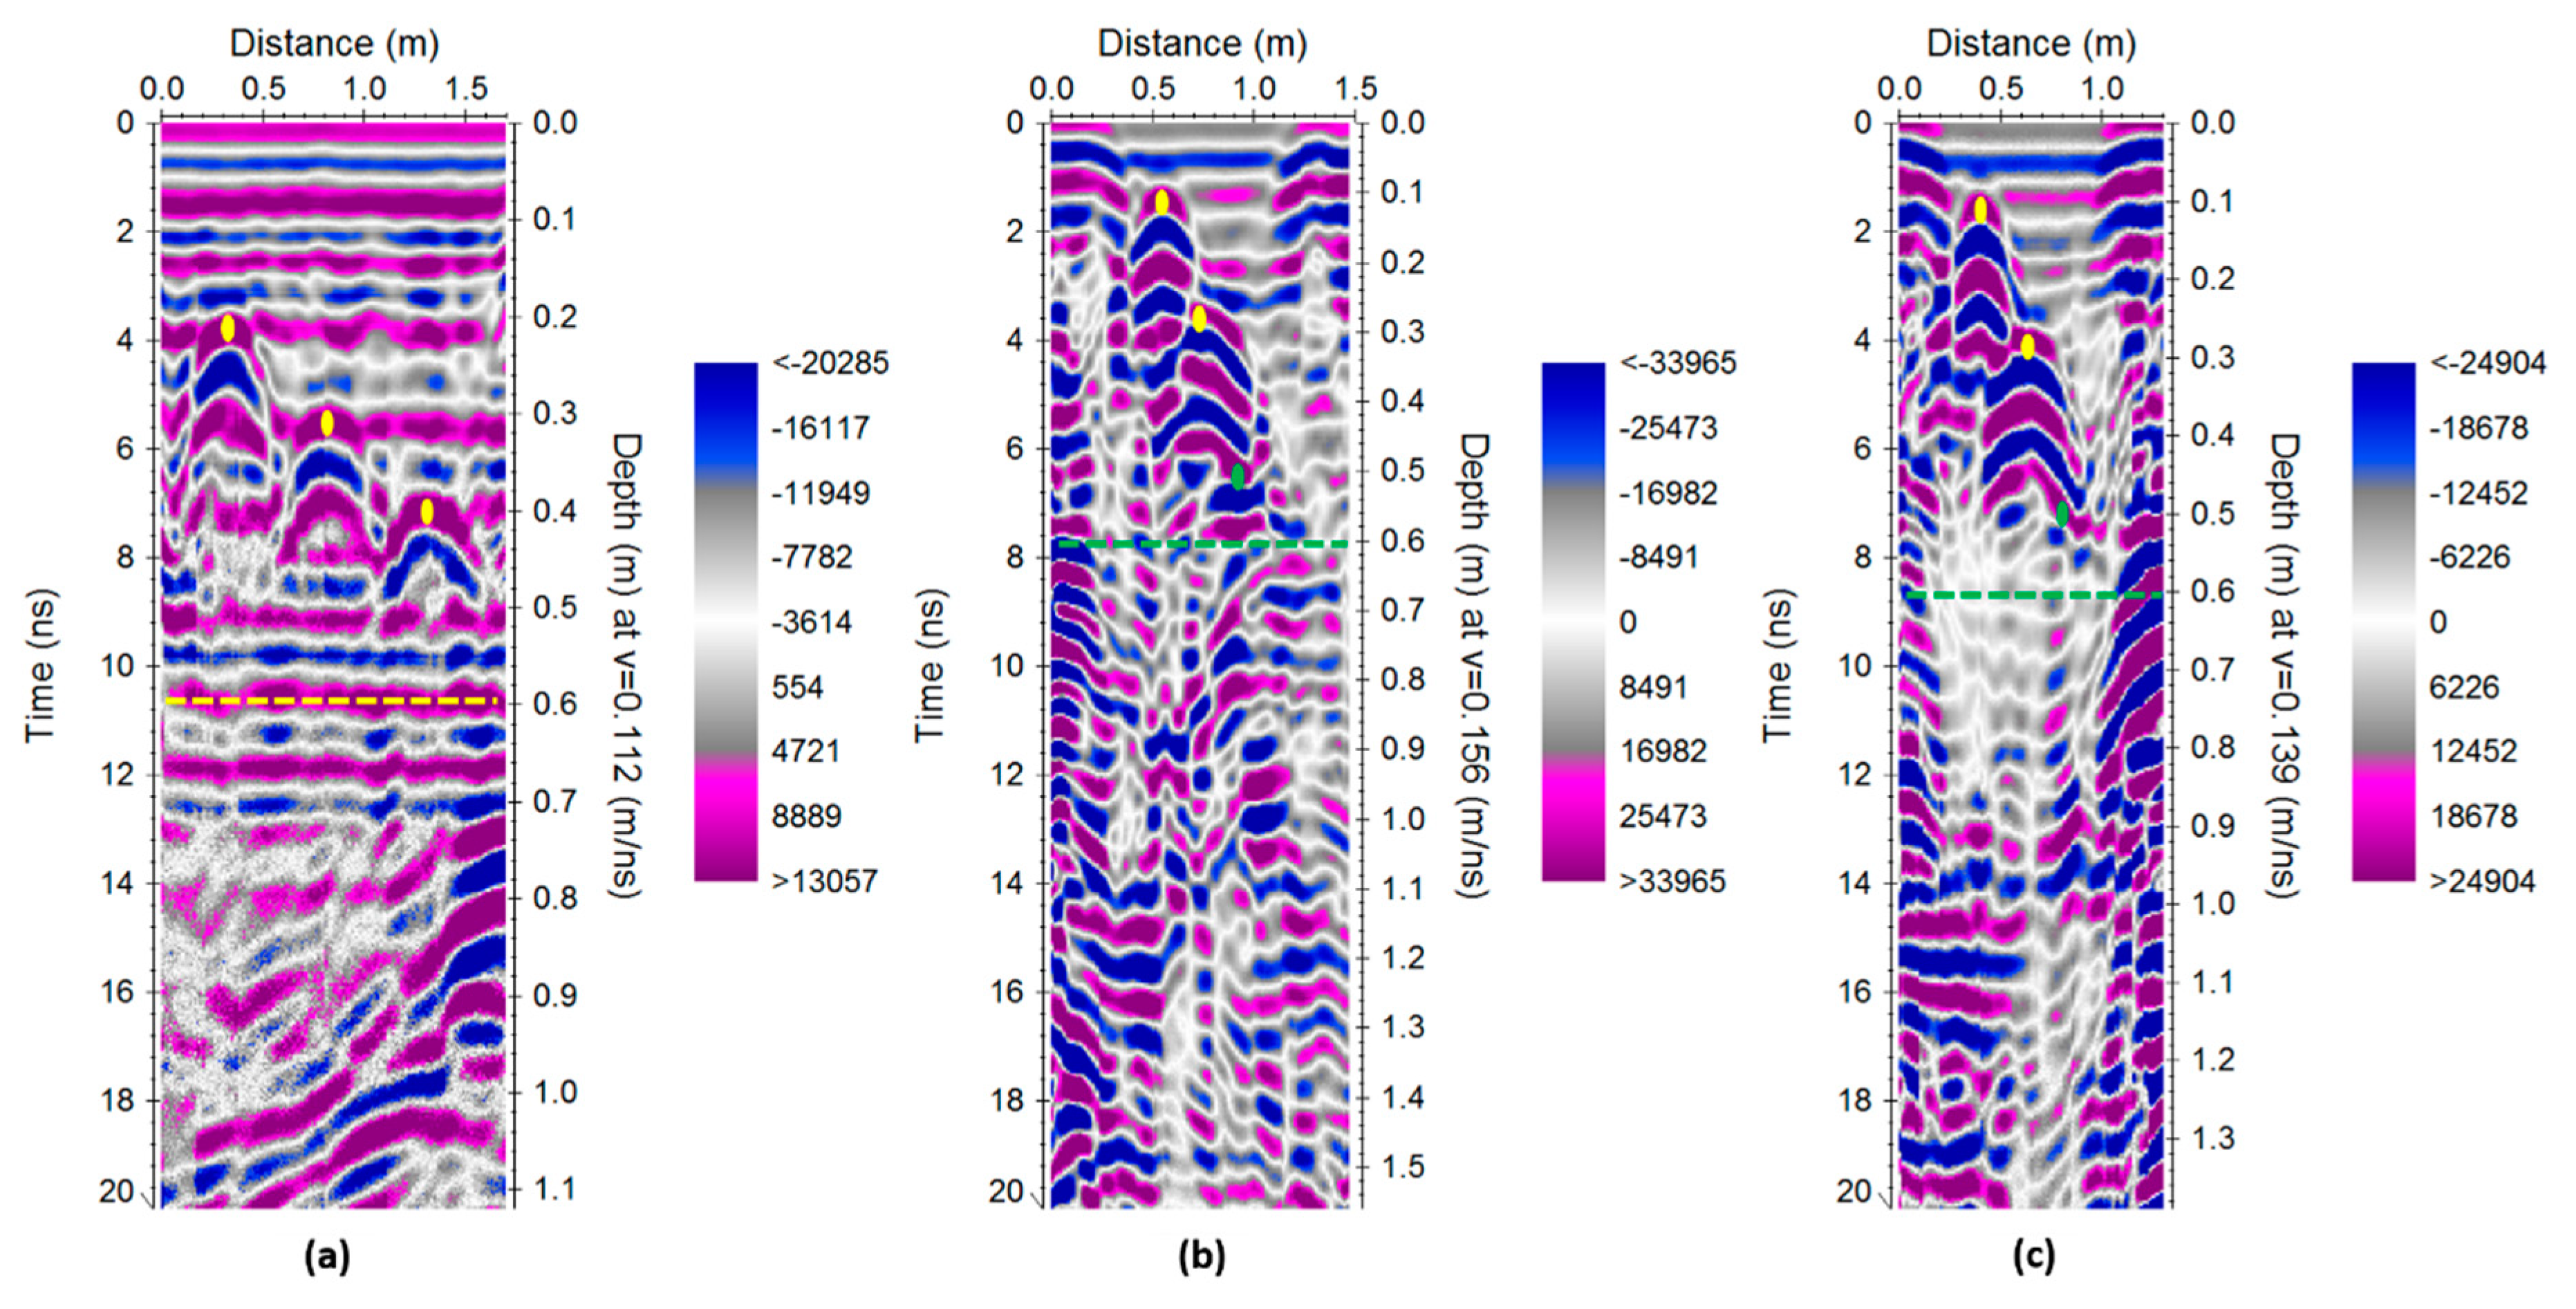
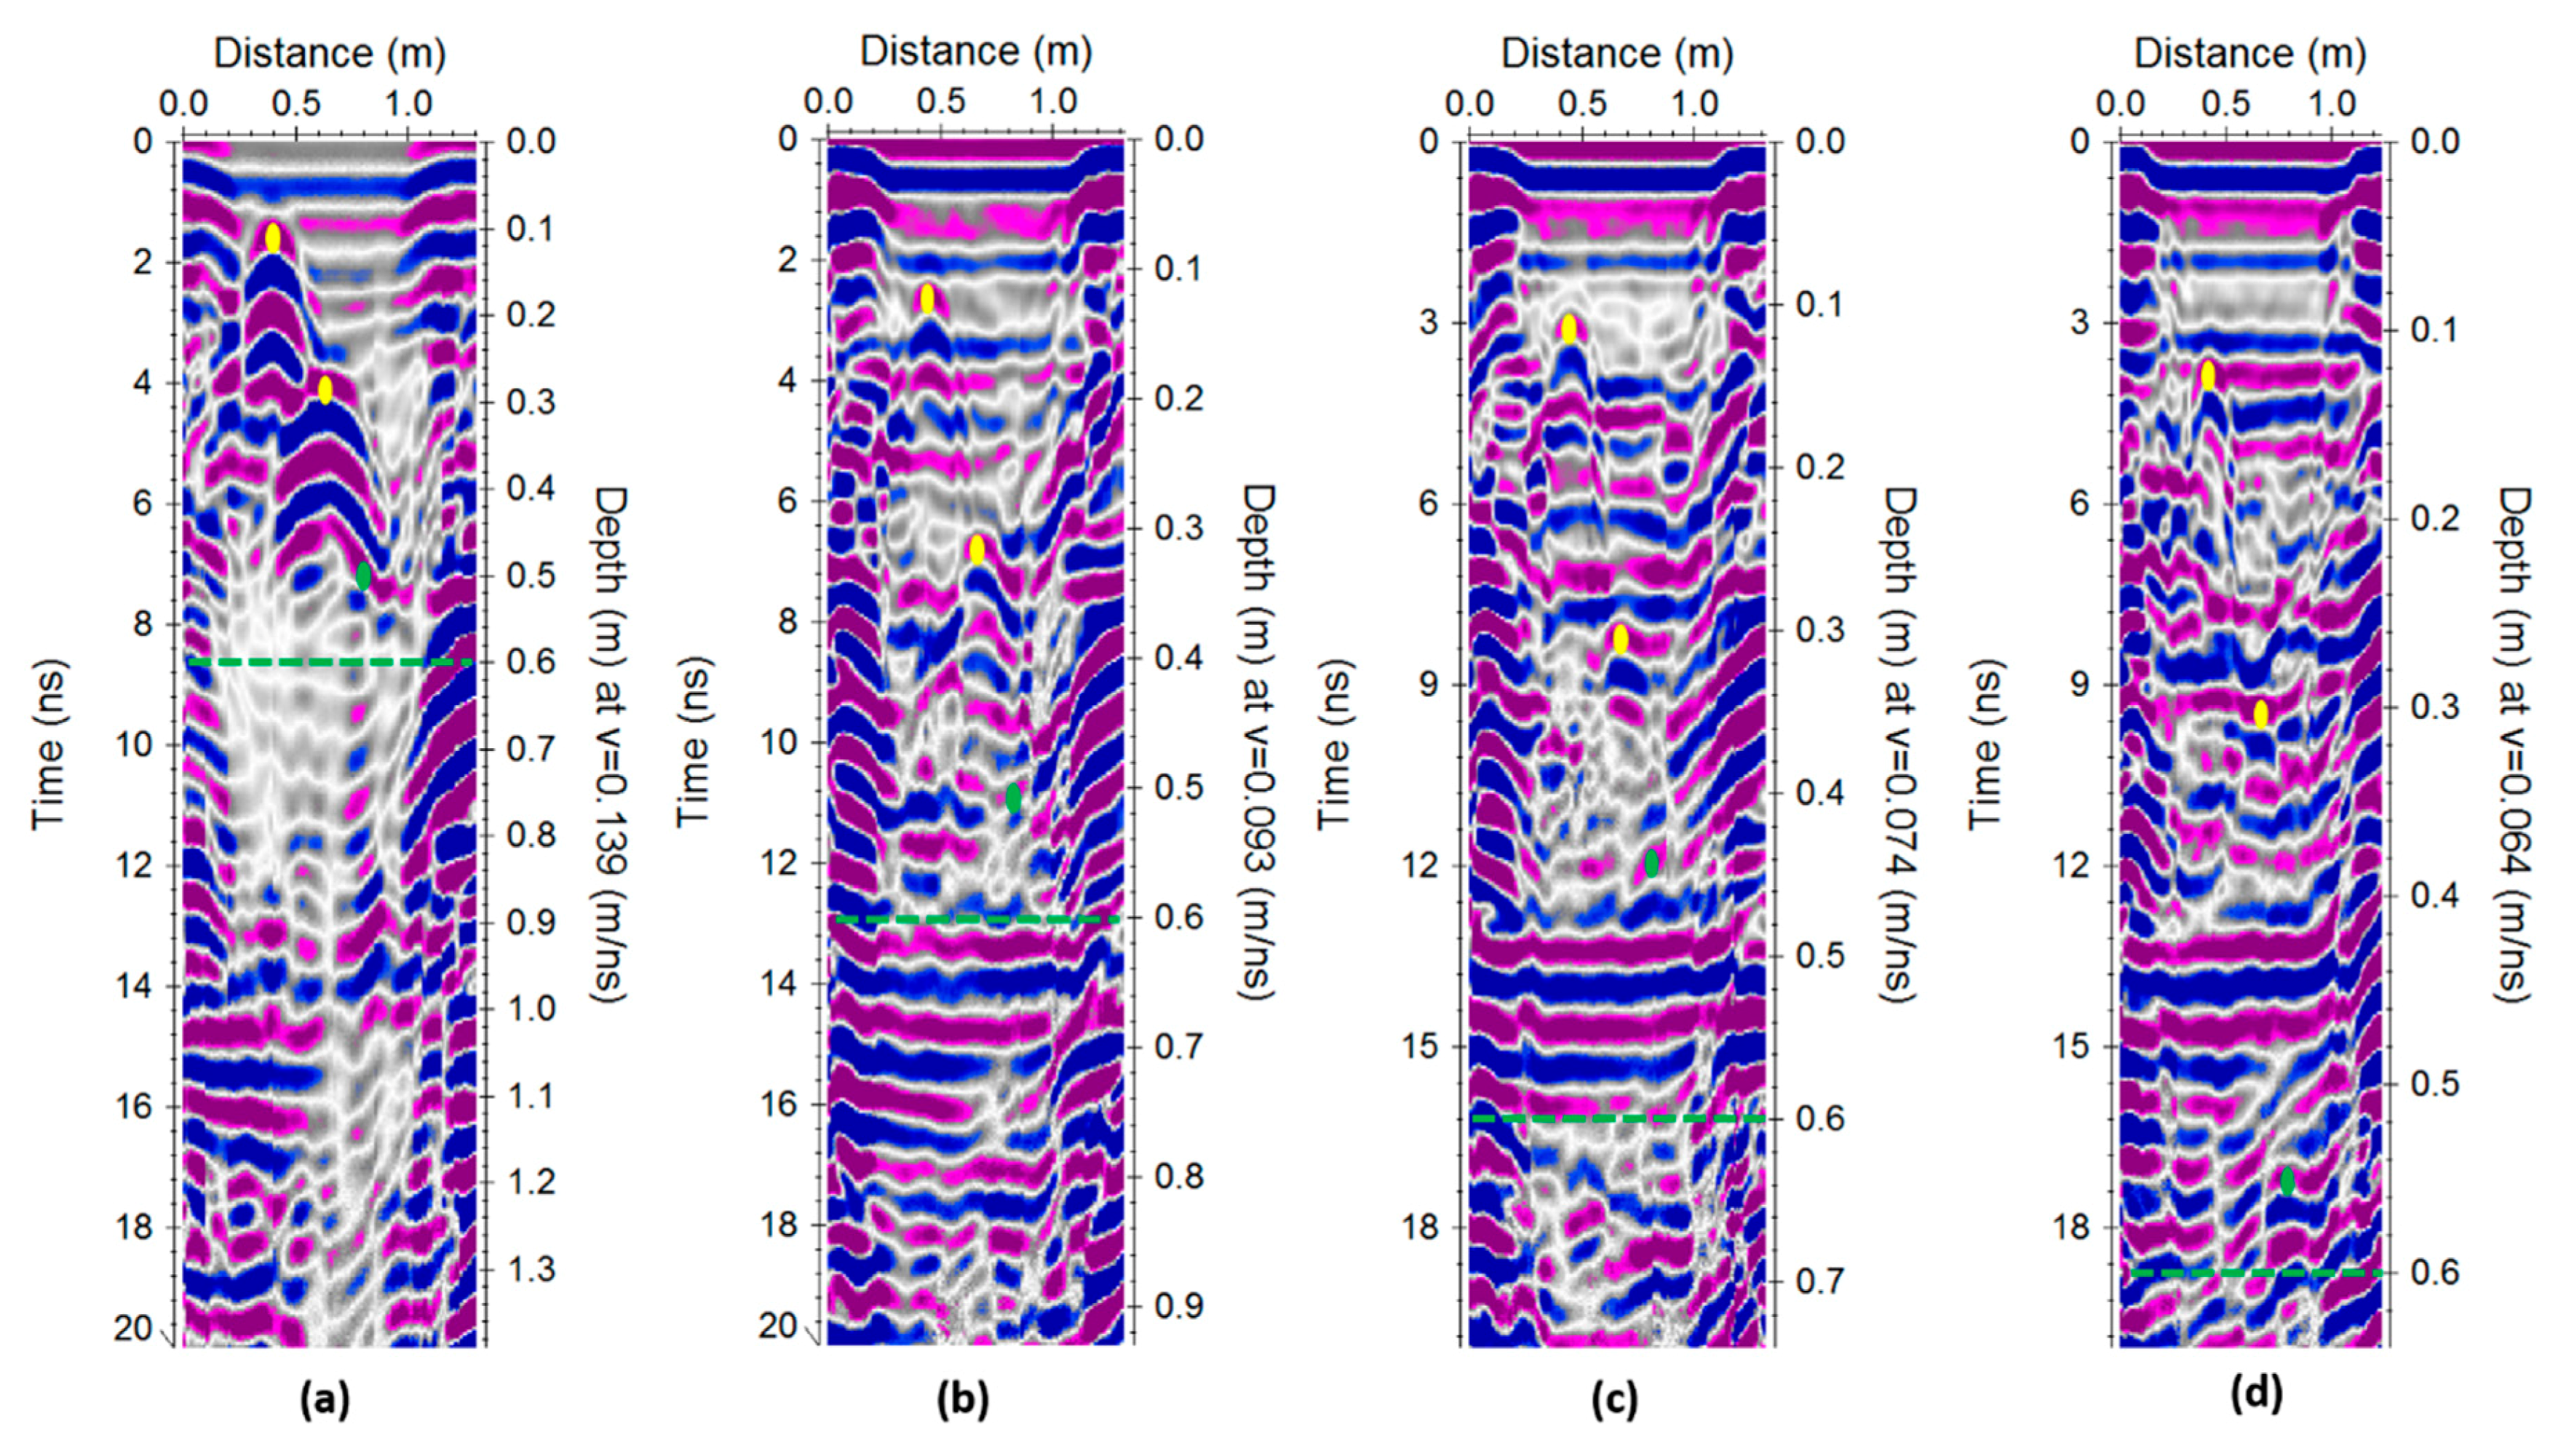
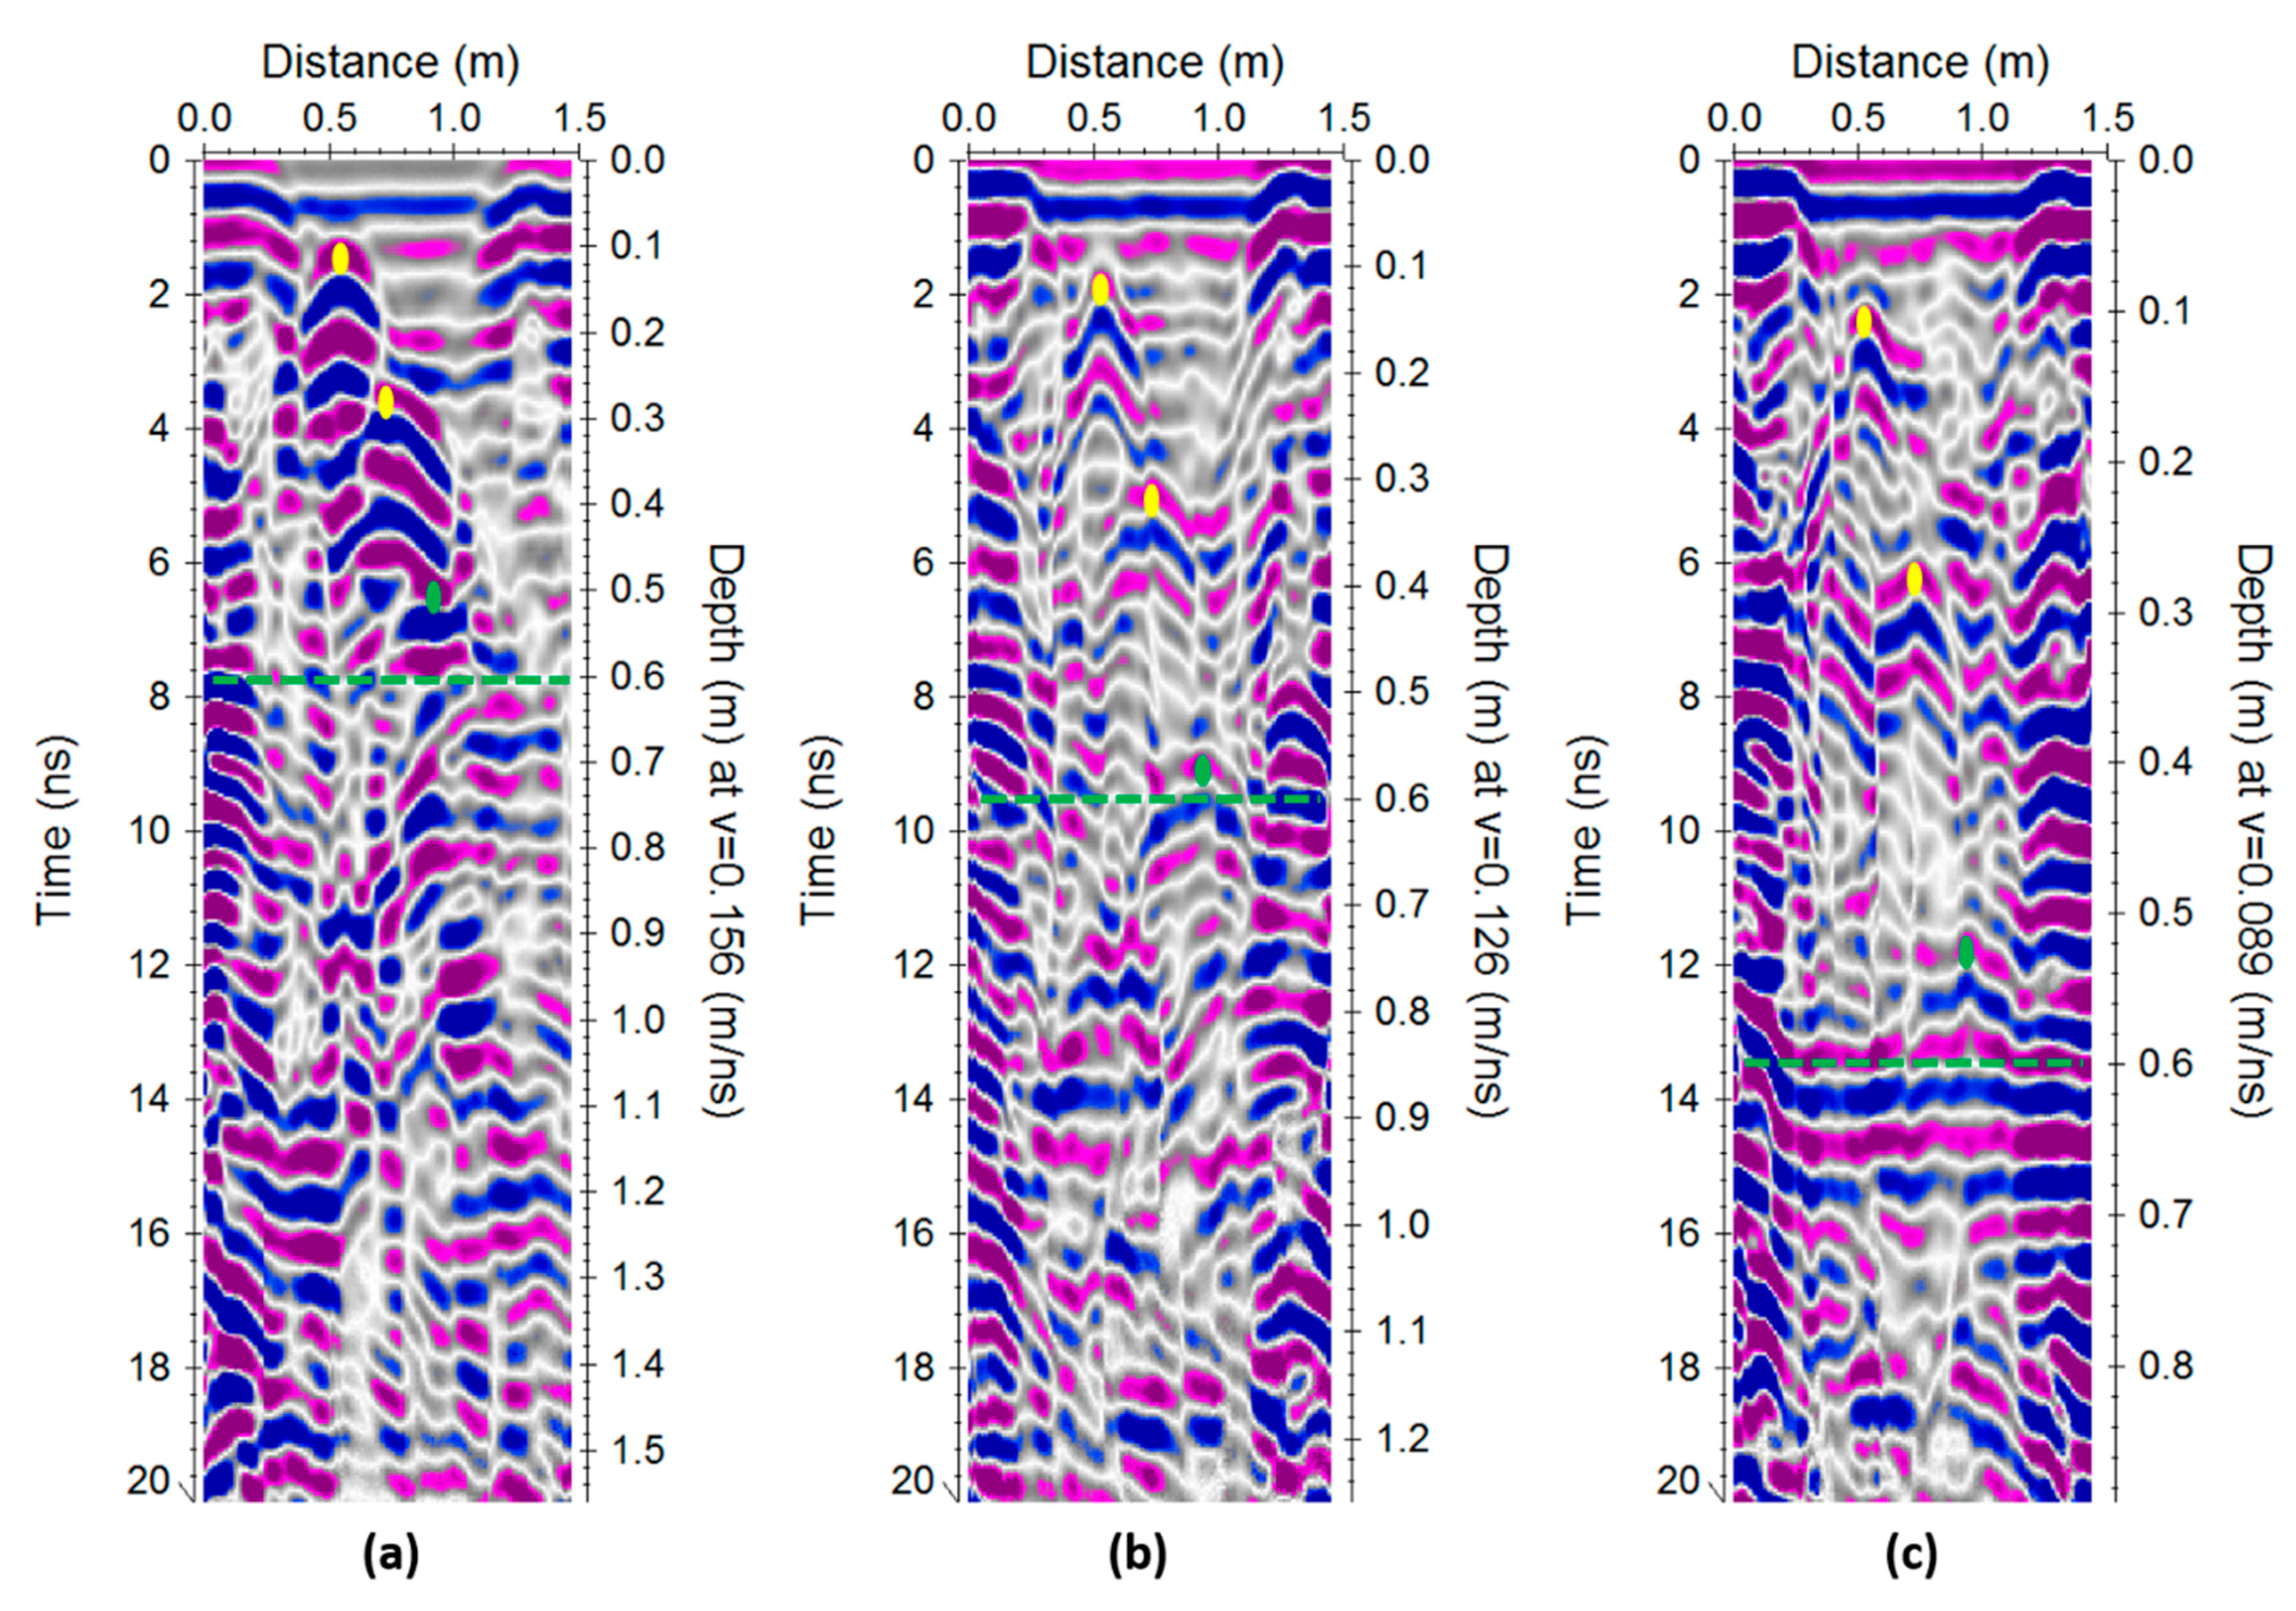
The simulation experiment showed increasing VSMC values modelled in the small loess soil box, affecting the bulk dielectric constant and the average EM wave velocity. The soil box’s diffractors and bottom reflector were clearly observed, although the upper diffraction and reflection waves from the first and second diffractors interfered with those from the lowest diffractor and the bottom reflector. Furthermore, the deepest diffractor was quite close to the bottom, so we could expect some difficulty in identifying it, which disturbed the analysis at a greater depth (>50 cm). In the large metal soil box, the diffractions were separated, and the anomalies did not overlap significantly, so each diffraction had enough space to be well represented in the measured GPR section.
The irrigation experiments enabled measurements of field-size diffractors, which can be used for velocity analysis and VSMC calculation. The experiments began with small soil boxes that provided partial results in both loess and hamra soils. The two shallower diffractors were observed clearly and were fit for analysis in most of the VSMC range, but the deep diffractor and the soil box bottom were not. The clarity of their identification decreased considerably as a consequence of wave interference of the upper diffractors and reflections of the soil box edges and bottom. Since the wooden boxes were found to be too small for the irrigation experiment setting, the larger metal frame soil boxes were used.
In the large soil box, all three diffractors and the reflection from the bottom were identifiable thanks to the spacing effect, but, unfortunately, only the first measurement was successful. After the first irrigation, the GPR imaging was blurred, and no velocity analysis could be performed. This lack of clarity was probably due to the high clay fraction (50 ± 5%), with a strong effect on the electrical conductivity value and strong signal attenuation, which was also influenced by the soil structure, grains, and moisture content, resulting in a very low signal-to-noise ratio. Moreover, the soil was disturbed, as it was collected from the field, sifted, and ground and thus it was no longer in its unified natural condition, with respect to grain behavior and internal forces. Some of these problems can be fixed over time; for example, when the small loess soil box was filled, the GPR signal results were not clear, so the diffractors were replaced with larger ones, and some more time was given for the soil to restore itself. After these steps, the GPR data were clear.
For some of the GPR measurements, a lack of clarity resulted from anomalies related to soil moisture. The irrigation water in the soil produced strong reflections and diffraction waves, especially at the beginning of the irrigation experiment when there was a large difference in the effective dielectric constants between the upper layer with high moisture content and the lower layer with relatively low moisture content. Thereafter, the water spread more equally throughout the soil boxes, and the change in the effective dielectric constants was less dramatic, so the diffractors were no longer masked.
This technique could be applied directly on undisturbed soils in the field, even though the distance to the anomaly is unknown. The diffractions hyperbola shape in the GPR profiles can be analyzed by dividing it into many point-velocity hyperbolas or interpolated to 2D velocity profiles, converted to effective dielectric constant values, and used in a soil mixture model to obtain the subsurface spatial soil water content, relying on the calibration procedure described above (
Section 2) combined with a few in situ soil samples measurements, mainly of soil texture.
The results of the study showed that the GPR can measure the spatial water content in various agricultural soils. The clarity of the profiles enabled the analysis and interpretation of the physical properties with high accuracy. The non-invasive measurements of a soil’s EM parameters can be relevant for other applications, such as subsurface targets detection, localization, and classification (e.g., explosive hazards) by the analysis of the hyperbola diffraction anomaly. GPR monitoring surveys of repeating measurements (as conducted in the calibration and irrigation experiments described above in
Section 2) can also show the subsurface changes over time caused by various factors such as irrigation, cultivation, crop type, seasons, etc. These changes can be analyzed to increase the amount of information on the soil physical parameters in a field.
5. Conclusions
Laboratory GPR studies in soil boxes showed that it is possible to measure the moisture content from a known depth using diffraction hyperbola, at gradually increasing soil moisture content (from dry to saturation state), with high accuracy. The GPR profiles were analyzed by signal parameters (e.g., arrival time) to extract EM velocities, then converted to effective dielectric constant values and used in a soil mixture model that combined a few soil samples, mainly with different soil texture, to obtain the subsurface spatial soil moisture content. These results were correlated to those from soil samples subjected to the standard measurement method of oven-drying. Good agreement was found between the measurement methods (volumetric oven-drying and GPR).
High spatial resolution (lateral and vertical) is particularly important for this application, where the required penetration depth is low (root zone); small subsurface discontinuities must be clearly identifiable to obtain information on the EM properties of the soil, so that the soil moisture content can be calculated with high accuracy for spatial agricultural practices.
The GPR analysis showed high applicability for a large range of moisture contents in soils with various textures. Several elements can be addressed to achieve better results: (i) higher antenna bandwidth for higher signal resolution; (ii) higher measurement stack number to increase the signal-to-noise ratio; (iii) laboratory measurements in larger soil boxes to reduce the edge effects.
The average moisture content measurements were conducted with an accuracy of ±1.0–2.0%. GPR imaging in the field will be based on these laboratory results and others and will enable computing the average moisture content with high accuracy.
This method relied on a calibration study in a soil box (21 L volume) to achieve the presented accuracy and to improve our understanding of the physical relations between relative permittivity and moisture content. Some knowledge is required to build a simple and reliable volume mixture model that will describe the relationship between the EM characteristics of the medium and its moisture content. To achieve the accuracy levels presented in this article, a calibration process is required, preferably using a small soil box for a rapid and accurate technique. The intensive development in recent years of GPR instrumentation now allows close-to-real-time, rapid, and highly accurate geophysical imaging and extraction of a soil’s physical properties, among which soil moisture content.
The results of this study provide the basis for GPR measurements of moisture content in the field, using the calibration and irrigation experiment models from this research.
The GPR measurement results must be correlated to those from standard methods (e.g., oven-drying) as in the calibration experiment (with varying soil texture and moisture content) to increase result accuracy and reliability. Further studies are needed to obtain more information on the relations between the dielectric constant and the moisture content in various agricultural soils and on the correlation between the GPR method and other physical methods, such as FDEM, spectroscopy, synthetic aperture radar, and time-domain reflectometry, among others.
There are many regions (arid and semi-arid) with water-related problems, such as salinized soils and areas that use mostly retrieved water in unwashed soils. The farmers in those areas need to optimize irrigation and production. Because of the need to use water efficiently, this study is mostly significant for soils with a low moisture content, from air-dry soils to those at field capacity, as these face the presented challenges.


