Downscaling of Satellite OPEMW Surface Rain Intensity Data


 ,
,  ,
,  ,
,  , , ,
, , ,  , , and
Abstract
:1. Introduction
2. Materials and Methods
2.1. Data Set
2.1.1. OPEMW
2.1.2. MSG-SEVIRI
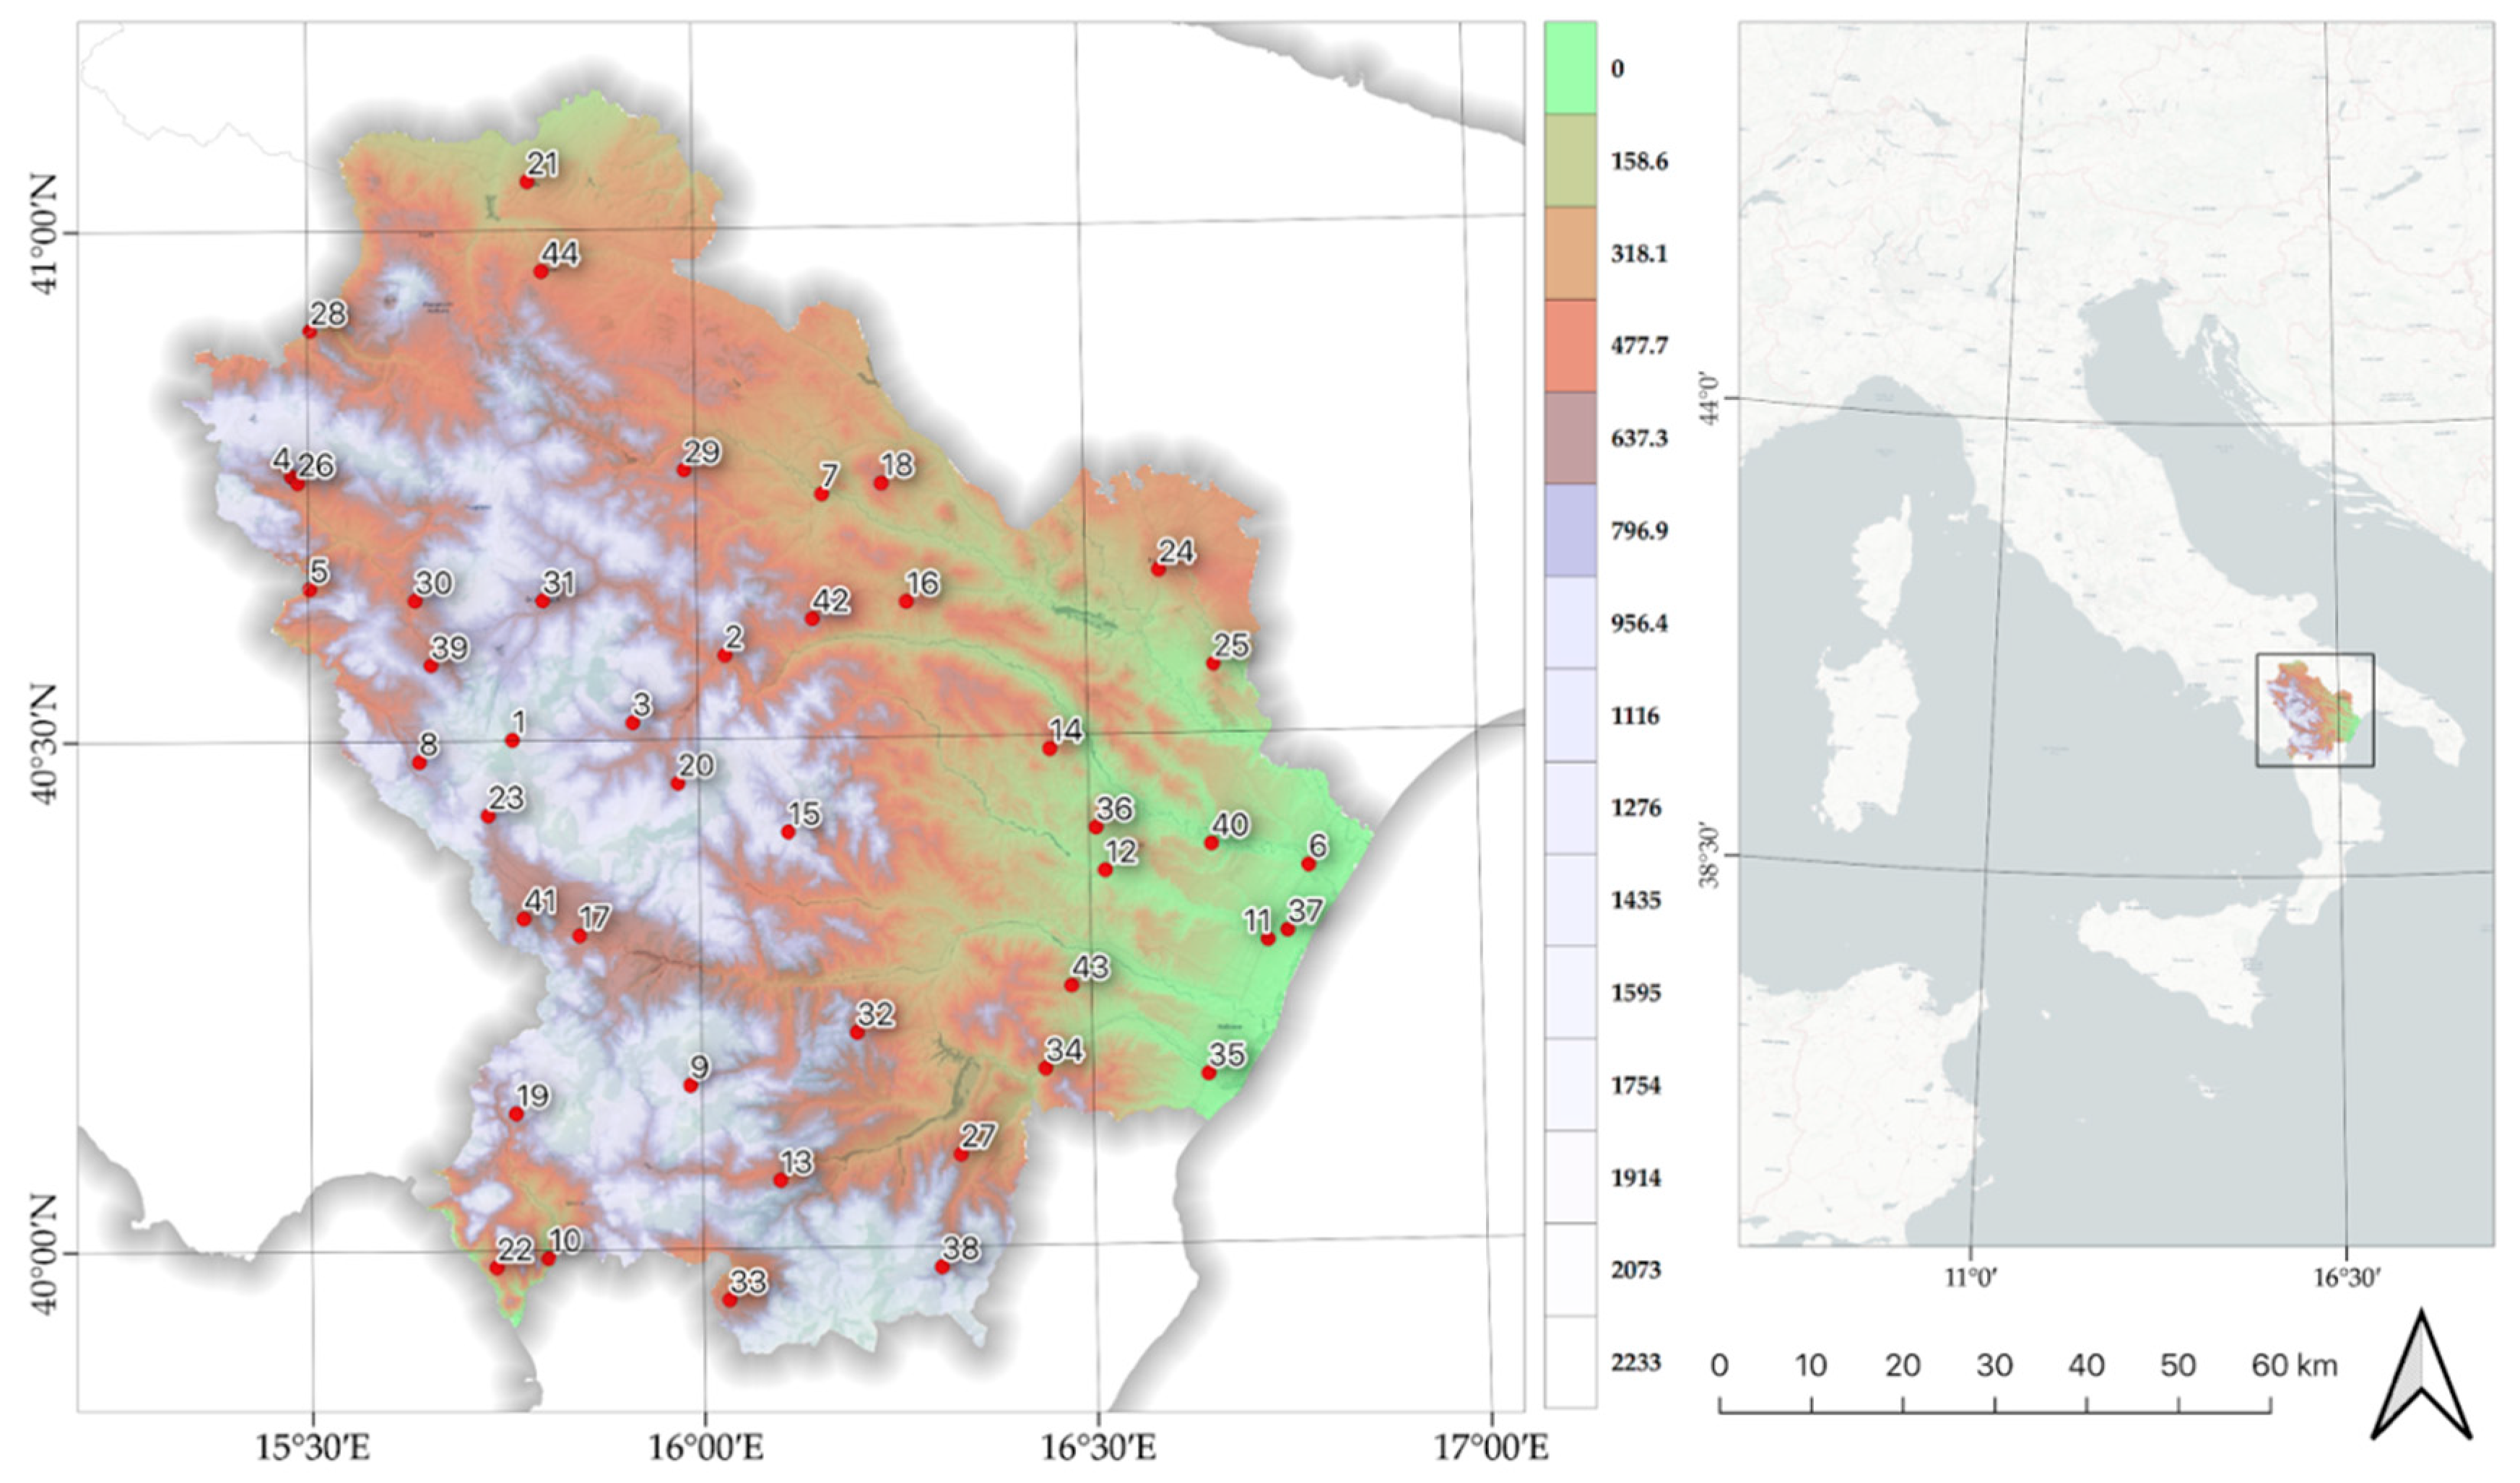
2.1.3. Rain Gauge Network
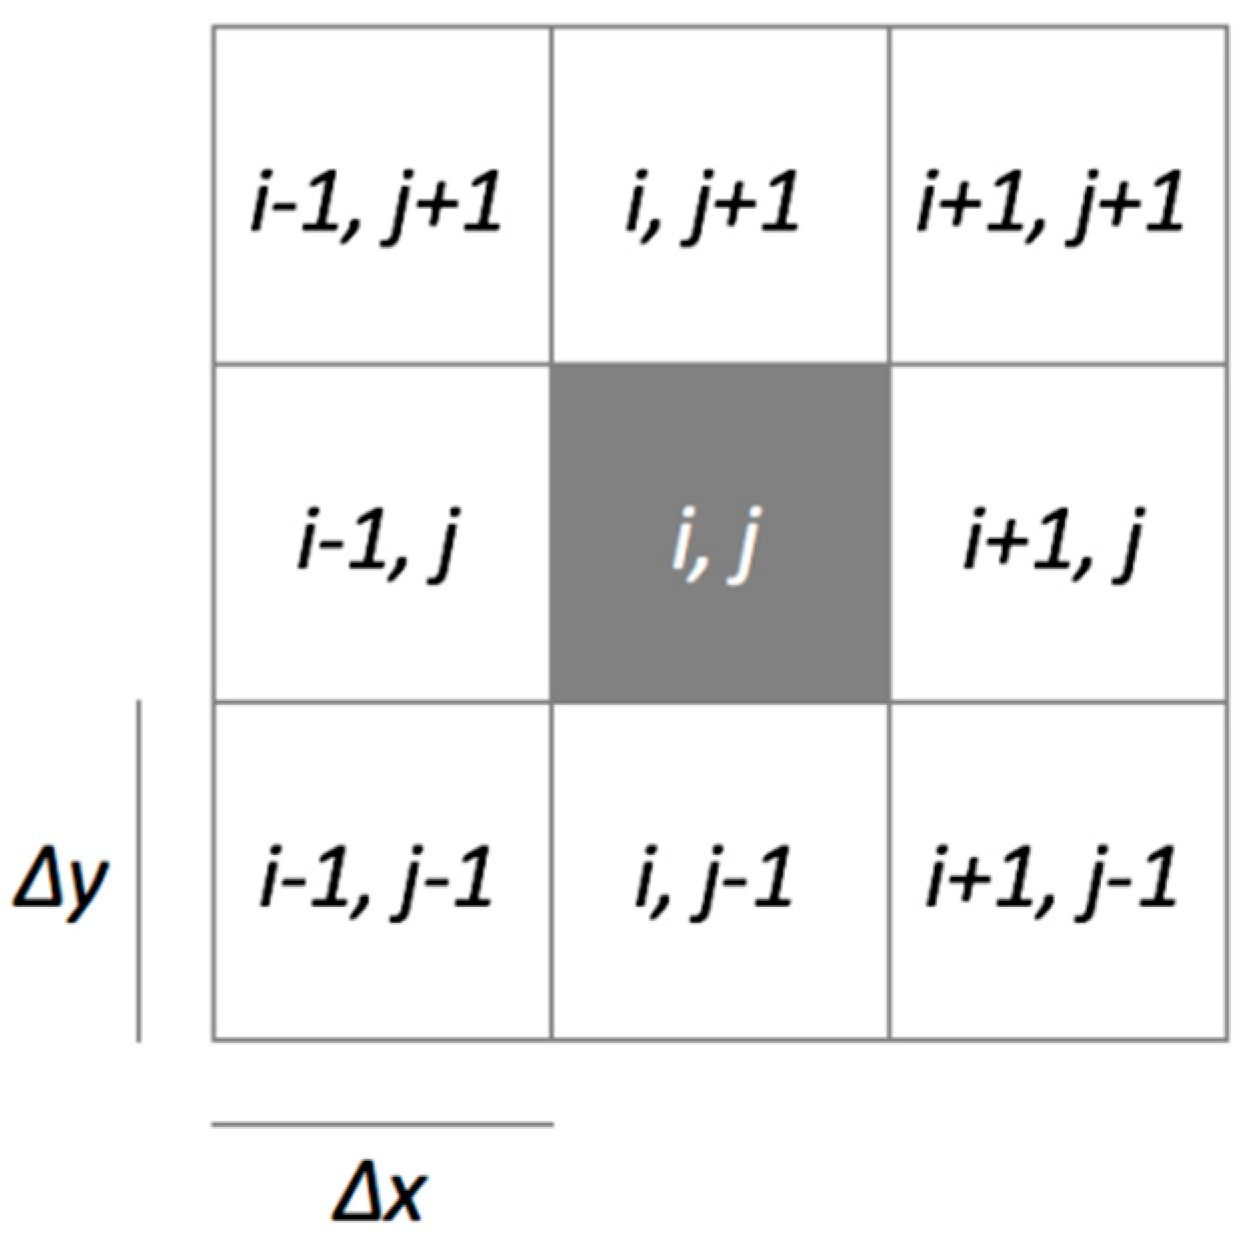
2.1.4. Elevation, Slope, Aspect
2.2. Methodology
2.2.1. Downscaling Technique
2.2.2. Choice of the Auxiliary Variables for Kriging with External Drift
- (i)
- (ii)
- (iii)
- BT difference between 8.7 μm and 10.8 μm (thermal-infrared) channels, useful to discriminate liquid and ice cloud that could be associated with mid-level stratiform cloud (nimbostratus) and convective clouds, respectively.
- TREND_CR = difference between 8.7 μm and 10.8 μm channels + slope + difference between 10.8 μm and 7.3 μm channels;
- TREND_SR = difference between 8.7 μm and 10.8 μm channels + slope + difference between 7.3 μm and 6.2 μm channels.
2.2.3. Validation
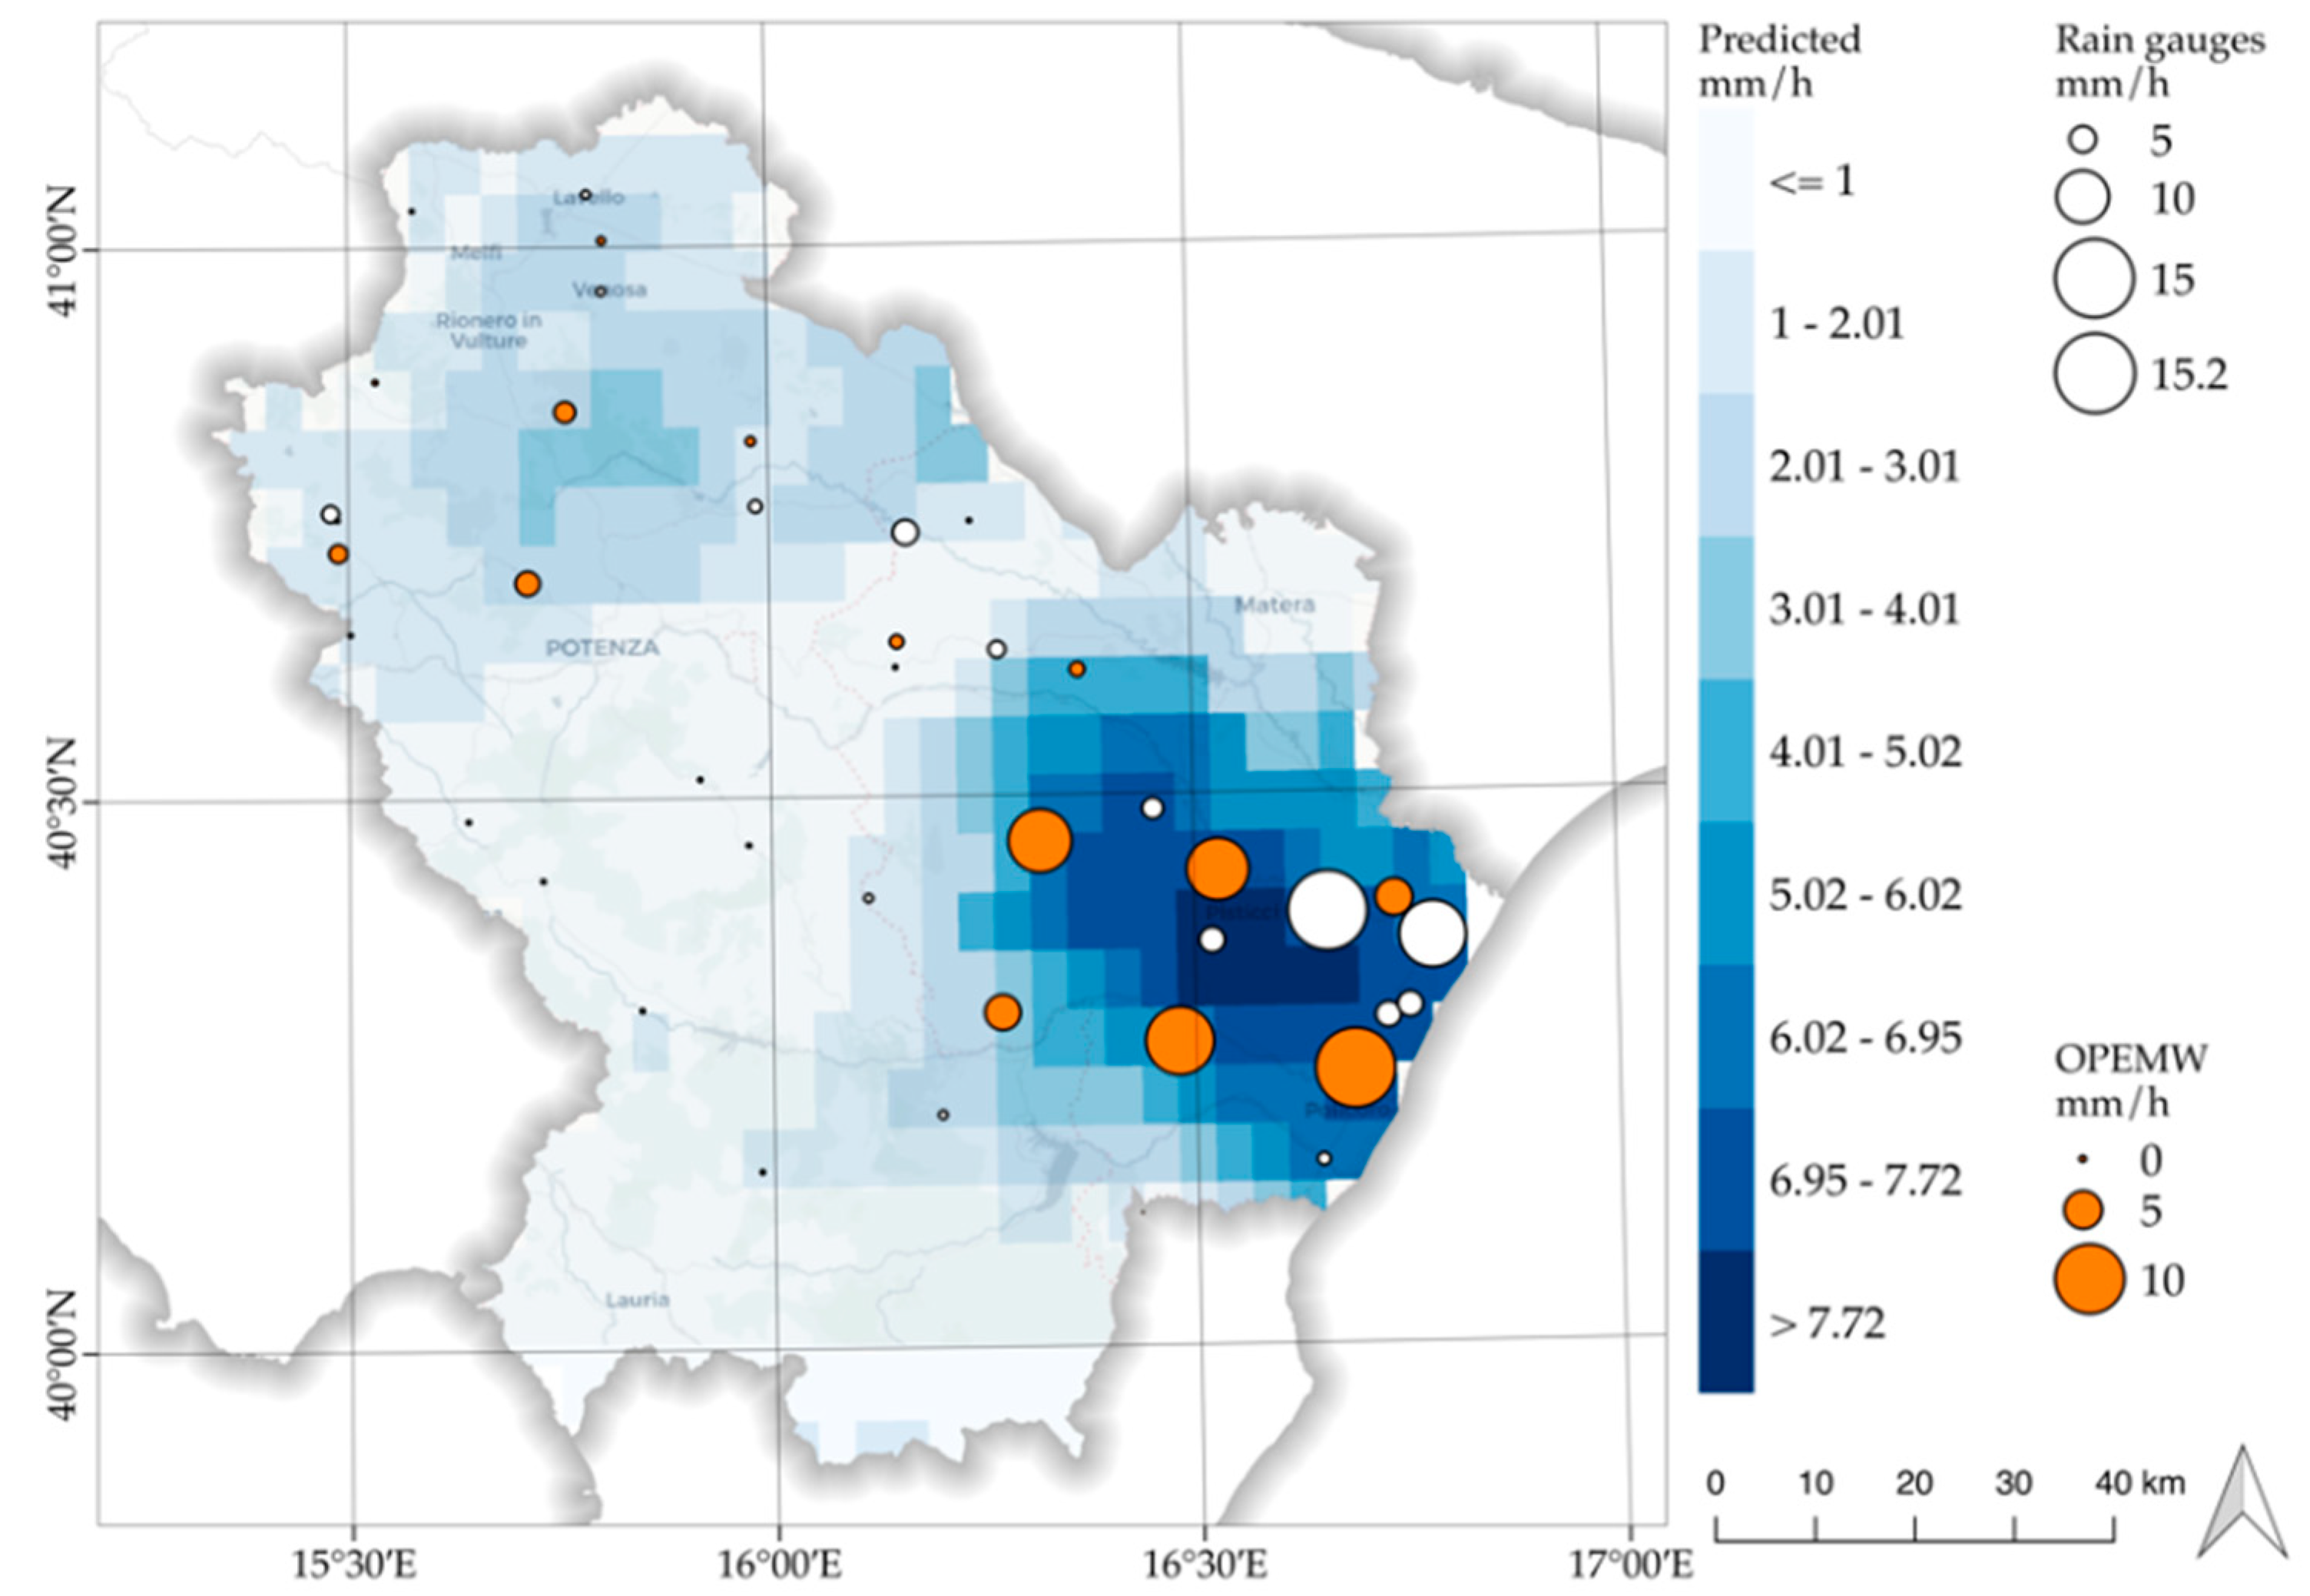
3. Results
4. Conclusions
Author Contributions
Funding
Acknowledgments
Conflicts of Interest
Appendix A
- the difference between the nugget values of and ;
- the difference between the partial sills values of and ;
- the difference between the range values of and ;
- the RMSE between and ;
- the value of the sum of the differences determined at points 1-2;
- the value of the sum of the differences determined at points 1-2-3-4.

Appendix B

| ID | Rain Gauge | Longitude (deg north) | Latitude (deg east) | Elevation (m) |
|---|---|---|---|---|
| 1 | ABRIOLA A SELLATA PIERFAONE | 15.76106 | 40.50064 | 1463 |
| 2 | ALBANO DI LUCANIA | 16.03541 | 40.58202 | 758 |
| 3 | ANZI SIMN | 15.91608 | 40.5167 | 929 |
| 4 | AVIGLIANO | 15.47889 | 40.75972 | 592 |
| 5 | BALVANO | 15.5015 | 40.64956 | 385 |
| 6 | BASENTO FREATIMETRO | 16.78119 | 40.36838 | 9 |
| 7 | BRADANO PONTE COLONNA | 16.16268 | 40.73881 | 213 |
| 8 | BRIENZA | 15.64131 | 40.47969 | 786 |
| 9 | CASTELSARACENO PC | 15.98547 | 40.16081 | 1090 |
| 10 | CASTROCUCCO | 15.80183 | 39.99217 | 142 |
| 11 | CAVONE SS106 | 16.72739 | 40.29586 | 13 |
| 12 | CRACO PESCHIERA | 16.52011 | 40.36642 | 57 |
| 13 | EPISCOPIA | 16.09883 | 40.0667 | 578 |
| 14 | FERRANDINA SP | 16.45156 | 40.48611 | 457 |
| 15 | GORGOGLIONE | 16.11419 | 40.40786 | 1051 |
| 16 | GRASSANO SP | 16.27011 | 40.63236 | 486 |
| 17 | GRUMENTO-PONTE LA MARMORA | 15.84508 | 40.30835 | 552 |
| 18 | IRSINA PC | 16.23947 | 40.74858 | 552 |
| 19 | LAGONEGRO PC | 15.76206 | 40.13419 | 791 |
| 20 | LAURENZANA | 15.97322 | 40.45678 | 814 |
| 21 | LAVELLO | 15.78608 | 41.04806 | 304 |
| 22 | MARATEA MASSA | 15.73597 | 39.98358 | 492 |
| 23 | MARSICO NUOVO PC | 15.72939 | 40.4265 | 747 |
| 24 | MATERA | 16.59539 | 40.65969 | 403 |
| 25 | MONTESCAGLIOSO SIMN | 16.66371 | 40.56673 | 162 |
| 26 | MURO LUCANO | 15.48673 | 40.75361 | 586 |
| 27 | NOEPOLI | 16.32989 | 40.08975 | 556 |
| 28 | OFANTO A MONTICCHIO | 15.50351 | 40.90276 | 322 |
| 29 | OPPIDO LUCANO | 15.98543 | 40.76388 | 747 |
| 30 | PICERNO | 15.63724 | 40.63771 | 655 |
| 31 | POTENZA | 15.80161 | 40.63703 | 820 |
| 32 | ROCCANOVA | 16.19922 | 40.21056 | 704 |
| 33 | ROTONDA SIMN | 16.03237 | 39.95003 | 557 |
| 34 | SINNI A VALSINNI | 16.4399 | 40.17283 | 152 |
| 35 | SINNI SS106 | 16.64803 | 40.16556 | 15 |
| 36 | STIGLIANO | 16.50908 | 40.40836 | 150 |
| 37 | TERRA MONTONATA | 16.75283 | 40.30469 | 7 |
| 38 | TERRANOVA DI POLLINO SIMN | 16.30374 | 39.97981 | 936 |
| 39 | TITO | 15.65703 | 40.57425 | 661 |
| 40 | TORRE ACCIO | 16.65694 | 40.39072 | 19 |
| 41 | TRAMUTOLA | 15.77394 | 40.32528 | 662 |
| 42 | TRICARICO SIMN | 16.14868 | 40.61671 | 682 |
| 43 | TURSI | 16.47469 | 40.25375 | 264 |
| 44 | VENOSA | 15.80325 | 40.95986 | 430 |
References
- Cantet, P. Mapping the mean monthly precipitation of a small island using kriging with external drifts. Theor. Appl. Climatol. 2017, 127, 31–44. [Google Scholar] [CrossRef]
- Levizzani, V.; Bauer, P.; Turk, F.J. Measuring precipitation from space. In EURAINSAT and the Future; Springer: Dordrecht, The Netherlands, 2007; 748p, ISBN 978-1-4020-5834-9. [Google Scholar]
- Guan, H.; Wilson, J.L.; Xie, H.J. A cluster-optimizing regression-based approach for precipitation spatial downscaling in mountainous terrain. J. Hydrol. 2009, 375, 578–588. [Google Scholar] [CrossRef]
- Fang, J.; Du, J.; Xu, W.; Shi, P.; Li, M.; Ming, X. Spatial downscaling of TRMM precipitation data based on the orographical effect and meteorological conditions in a mountainous area. Adv. Water Resour. 2013, 61, 42–50. [Google Scholar] [CrossRef]
- Immerzeel, W.W.; Rutten, M.; Droogers, P. Spatial downscaling of TRMM precipitation using vegetative response on the Iberian Peninsula. Remote Sens. Environ. 2009, 113, 362–370. [Google Scholar] [CrossRef]
- Jia, S.; Zhu, W.; Lu, A.; Yan, T. A statistical spatial downscaling algorithm of TRMM precipitation based on NDVI and DEM in theQaidam Basin of China. Remote Sens. Environ. 2011, 115, 3069–3079. [Google Scholar] [CrossRef]
- Zhang, Y.; Li, Y.; Ji, X.; Luo, X.; Li, X. Fine-Resolution Precipitation Mapping in a Mountainous Watershed: Geostatistical Downscaling of TRMM Products Based on Environmental Variables. Remote Sens. 2018, 10, 119. [Google Scholar] [CrossRef]
- Alexakis, D.D.; Tsanis, I.K. Comparison of multiple linear regression and artificial neural network models for downscaling TRMM precipitation products using MODIS data. Environ. Earth Sci. 2016, 75, 1077. [Google Scholar] [CrossRef]
- Di Tomaso, E.; Romano, F.; Cuomo, V. Rainfall estimation from satellite passive microwave observations in the range 89 GHz to 190 GHz. J. Geophys. Res. 2009, 114, D18203. [Google Scholar] [CrossRef]
- Cimini, D.; Romano, F.; Ricciardelli, E.; Di Paola, F.; Viggiano, M.; Marzano, F.S.; Colaiuda, V.; Picciotti, E.; Vulpiani, G.; Cuomo, V. Validation of satellite OPEMW precipitation product with ground-based weather radar and rain gauge networks. Atmos. Meas. Tech. 2013, 6, 3181–3196. [Google Scholar] [CrossRef] [Green Version]
- Schmetz, J.; Pili, P.; Tjemkes, S.; Just, D.; Kerkmann, J.; Rota, S.; Ratier, A. An Introduction to Meteosat Second Generation (MSG). Bull. Am. Meteorol. Soc. 2002, 83, 977–992. [Google Scholar] [CrossRef]
- Nilo, S.T.; Romano, F.; Cermak, J.; Cimini, D.; Ricciardelli, E.; Cersosimo, A.; Di Paola, F.; Gallucci, D.; Gentile, S.; Geraldi, E.; et al. Fog Detection Based on Meteosat Second Generation-Spinning Enhanced Visible and InfraRed Imager High Resolution Visible Channel. Remote Sens. 2018, 10, 541. [Google Scholar] [CrossRef]
- Gallucci, D.; Romano, F.; Cersosimo, A.; Cimini, D.; Di Paola, F.; Gentile, S.; Geraldi, E.; Larosa, S.; Nilo, S.T.; Ricciardelli, E.; et al. Nowcasting Surface Solar Irradiance with AMESIS via Motion Vector Fields of MSG-SEVIRI Data. Remote Sens. 2018, 10, 845. [Google Scholar] [CrossRef]
- Ricciardelli, E.; Cimini, D.; Di Paola, F.; Romano, F.; Viggiano, M. A statistical approach for rain intensity differentiation using Meteosat Second Generation-Spinning Enhanced Visible and InfraRed Imager observations. Hydrol. Earth Syst. Sci. 2014, 18, 2559–2576. [Google Scholar] [CrossRef] [Green Version]
- Di Paola, F.; Casella, D.; Dietrich, S.; Mugnai, A.; Ricciardelli, E.; Romano, F.; Sanò, P. Combined MW-IR Precipitation Evolving Technique (PET) of convective rain fields. Nat. Hazards Earth Syst. Sci. 2012, 12, 3557–3570. [Google Scholar] [CrossRef] [Green Version]
- Ricciardelli, E.; Di Paola, F.; Gentile, S.; Cersosimo, A.; Cimini, D.; Gallucci, D.; Geraldi, E.; Larosa, S.; Nilo, S.T.; Ripepi, E.; et al. Analysis of Livorno Heavy Rainfall Event: Examples of Satellite-Based Observation Techniques in Support of Numerical Weather Prediction. Remote Sens. 2018, 10, 1549. [Google Scholar] [CrossRef]
- Di Paola, F.; Ricciardelli, E.; Cimini, D.; Romano, F.; Viggiano, M.; Cuomo, V. Analysis of Catania Flash Flood Case Study by Using Combined Microwave and Infrared Technique. J. Hydrometeorol. 2014, 1. [Google Scholar] [CrossRef]
- Barbosa, H.A.; Ertürk, A.G.; Da Silva, L.R.M. Using the Meteosat-9 images to the detection of deep convective systems in Brazil. J. Hyperspectr. Remote Sens. 2012, 12, 069–082. [Google Scholar] [CrossRef]
- Berterame, D.; D’Avenia, G.; Glisci, C.; Lanorte, V.; Mangiolfi, A.; Motta, G.; Pacifico, G. Analisi del Deficit Pluviometrico del 1° Semestre 2017 in Basilicata. 2017. Available online: http://www.centrofunzionalebasilicata.it/ew/ew_pdf/r/Articolo_Deficit_I_semestre_2017_colonne.pdf (accessed on 6 November 2018).
- Farr, T.G.; Kobrick, M. Shuttle Radar Topography Mission produces a wealth of data. Eos. Trans. Am. Geophys. Union 2000, 81, 583–585. [Google Scholar] [CrossRef]
- Rabus, B.; Eineder, M.; Roth, A.; Bamler, R. The shuttle radar topography mission—A new class of digital elevation models acquired by spaceborne radar. Remote Sens. 2003, 57, 241–262. [Google Scholar] [CrossRef]
- Werner, M. Shuttle radar topography mission (SRTM), mission overview. J. Telecommun. (Frequenz) 2001, 55, 75–79. [Google Scholar] [CrossRef]
- SRTM 90 m Digital Elevation Database v4.1. Available online: ftp://e0srp01u.ecs.nasa.gov (accessed on 6 November 2018).
- Horn, B.K.P. Hill Shading and the Reflectance Map. Proc. IEEE 1981, 69, 14–47. [Google Scholar] [CrossRef]
- Hofierka, J.; Mitasova, H.; Neteler, M. Geomorphometry in GRASS GIS. In Geomorphometry: Concepts, Software, Applications. Developments in Soil Science; Hengl, T., Reuter, H.I., Eds.; Elsevier: Amsterdam, The Netherlands, 2009; Volume 33, pp. 387–410. [Google Scholar]
- Burrough, P.; McDonnell, R.A. Principles of Geographical Information Systems; Oxford University Press: Oxford, UK, 1998. [Google Scholar]
- Cressie, N.A.C. Statistics for spatial data, revised edition. Wiley Ser. Probab. Stat. 2015. [Google Scholar] [CrossRef]
- Wackernagel, H. Multivariate Geostatistics. An Introduction with Applications; Springer: Berlin, Germany, 2003. [Google Scholar]
- Anagnostou, E.N.; Kummerow, C. Stratiform and convective classification of rainfall using SSM/I 85-GHz Brightness Temperature Observations. J. Atmos. Ocean. Technol. 1997, 14, 570–575. [Google Scholar] [CrossRef]
- Ricciardelli, E.; Romano, F.; Cuomo, V. Physical and statistical approaches for cloud identification using Meteosat Second Generation-Spinning Enhanced Visible and Infrared Imager Data. Remote Sens. Environ. 2008, 112, 2741–2760. [Google Scholar] [CrossRef]
- Karl, J.K. Spatial predictions of cover attributes of rangeland ecosystems using regression kriging and remote sensing. Rangeland Ecol. Manag. 2010, 63, 335–349. [Google Scholar] [CrossRef]


| Case | Data | Satellite Overpass (UTC) | Case | Data | Satellite Overpass (UTC) |
|---|---|---|---|---|---|
| 1 | 30 Nov 2017 | 06:33 | 6 | 10 Feb 2018 | 07:54 |
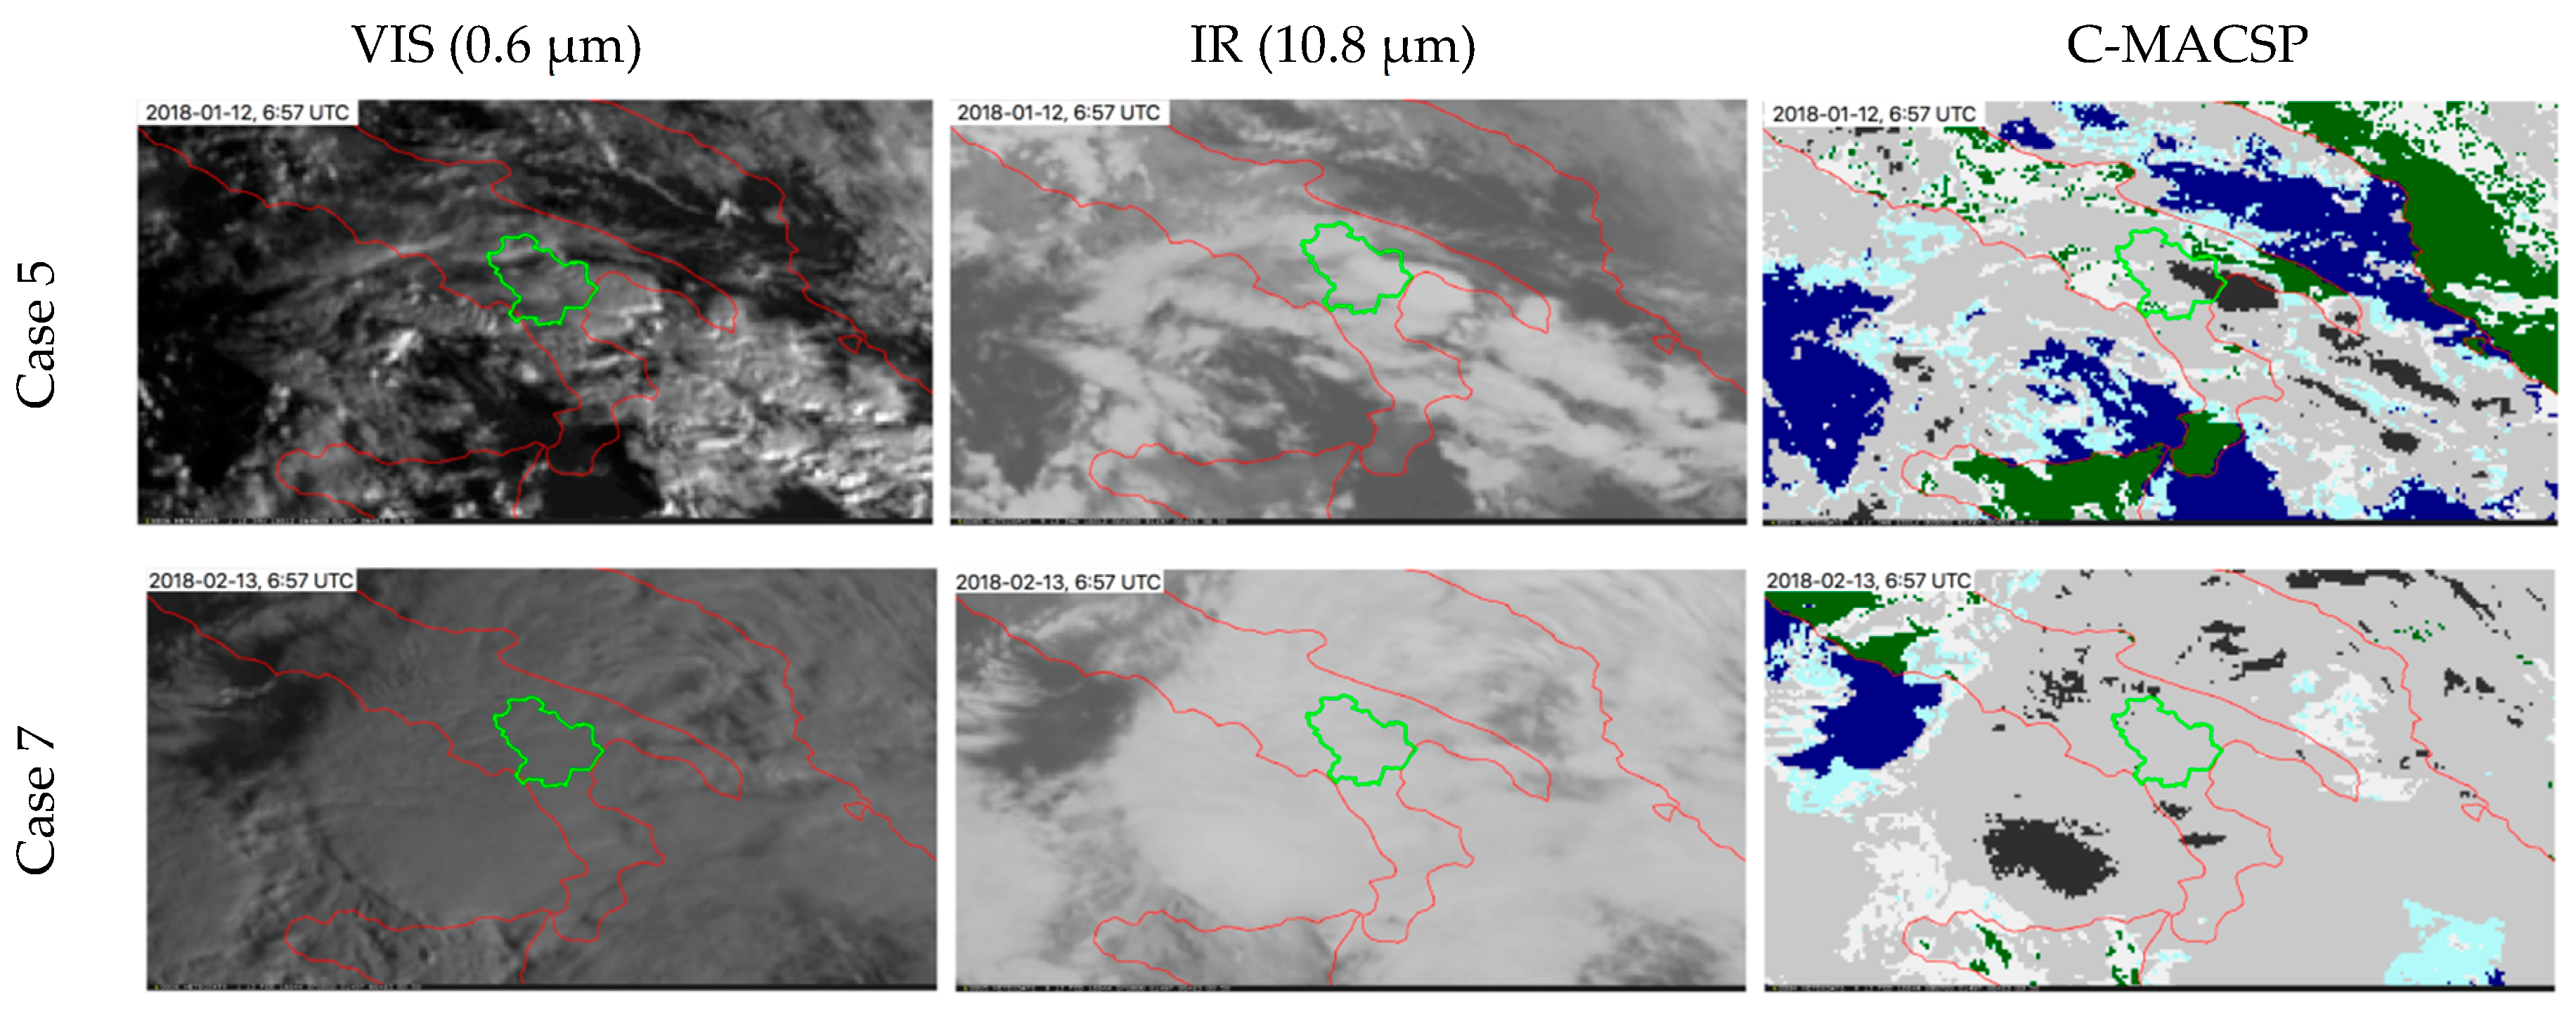
| 2 | 28 Dec 2017 | 08:24 | 7 | 13 Feb 2018 | 06:58 |
| 3 | 02 Jan 2018 | 08:49 | 8 | 14 Feb 2018 | 12:13 |
| 4 | 10 Jan 2018 | 06:54 | 9 | 20 Feb 2018 | 18:32 |
| 5 | 12 Jan 2018 | 06:54 | 10 | 20 Mar 2018 | 17:43 |
| Case | MAE [mm/h] | MBE [mm/h] | RMSE [mm/h] | |
|---|---|---|---|---|
| (OPEMW, OK, KED) | (OPEMW, OK, KED) | (OPEMW, OK, KED) | (OPEMW, OK, KED) | |
| 1 | (1.46, 1.39, 1.33) | (−0.72, −1.03, −0.89) | (3.08, 2.97, 2.82) | (0.62, 0.73, 0.75) |
| 2 | (0.32, 0.35, 0.34) | (−0.22, −0.20, −0.18) | (0.69, 0.67, 0.64) | (0.24, 0.32, 0.42) |
| 3 | (1.38, 1.25, 1.03) | (0.45, 0.47, 0.41) | (2.12, 1.82, 1.46) | (0.50, 0.55, 0.72) |
| 4 | (1.17, 0.70, 0.65) | (0.42, 0.60, 0.53) | (2.73, 1.22, 1.15) | (0.62, 0.72, 0.73) |
| 5 | (2.15, 1.55, 1.43) | (0.59, 0.44, 0.38) | (3.56, 2.35, 2.48) | (0.48, 0.63, 0.68) |
| 6 | (3.29, 3.09, 2.35) | (3.29, 3.09, 2.35) | (3.92, 3.63, 2.76) | (0.33, 0.33, 0.49) |
| 7 | (1.32, 0.98, 0.92) | (0.29, 0.07, 0.04) | (1.61, 1.13, 1.06) | (0.33, 0.39, 0.41) |
| 8 | (5.21, 4.99, 4.86) | (5.21, 4.99, 4.86) | (6.12, 5.75, 5.53) | (0.27, 0.31, 0.33) |
| 9 | (1.52, 1.52, 1.52) | (−1.21, −1.39, −1.39) | (2.09, 2.03, 2.01) | (0.30, 0.31, 0.34) |
| 10 | (3.86, 3.59, 3.52) | (3.30, 3.00, 2.94) | (4.61, 4.07, 3.98) | (0.31, 0.34, 0.36) |
| Statistics | OPEMW | OK | KED |
|---|---|---|---|
| MAE (mm/h) | 2.17 | 1.94 | 1.70 |
| MBE (mm/h) | 1.14 | 1.44 | 0.91 |
| RMSE (mm/h) | 3.05 | 2.58 | 2.38 |
| 0.34 | 0.46 | 0.52 |
| Statistics | OPEMW | OK | KED |
|---|---|---|---|
| MAE (mm/h) | 2.15 | 1.55 | 1.43 |
| RMSE (mm/h) | 3.56 | 2.48 | 2.35 |
| MBE (mm/h) | 0.59 | 0.44 | 0.38 |
| 0.48 | 0.63 | 0.68 |
| Statistics | OPEMW | OK | KED |
|---|---|---|---|
| MAE (mm/h) | 1.32 | 0.98 | 0.92 |
| RMSE (mm/h) | 1.61 | 1.13 | 1.06 |
| MBE (mm/h) | 0.29 | 0.07 | 0.04 |
| 0.33 | 0.39 | 0.41 |
© 2018 by the authors. Licensee MDPI, Basel, Switzerland. This article is an open access article distributed under the terms and conditions of the Creative Commons Attribution (CC BY) license (http://creativecommons.org/licenses/by/4.0/).
Share and Cite
Cersosimo, A.; Larosa, S.; Romano, F.; Cimini, D.; Di Paola, F.; Gallucci, D.; Gentile, S.; Geraldi, E.; Teodosio Nilo, S.; Ricciardelli, E.; et al. Downscaling of Satellite OPEMW Surface Rain Intensity Data. Remote Sens. 2018, 10, 1763. https://doi.org/10.3390/rs10111763
Cersosimo A, Larosa S, Romano F, Cimini D, Di Paola F, Gallucci D, Gentile S, Geraldi E, Teodosio Nilo S, Ricciardelli E, et al. Downscaling of Satellite OPEMW Surface Rain Intensity Data. Remote Sensing. 2018; 10(11):1763. https://doi.org/10.3390/rs10111763
Chicago/Turabian StyleCersosimo, Angela, Salvatore Larosa, Filomena Romano, Domenico Cimini, Francesco Di Paola, Donatello Gallucci, Sabrina Gentile, Edoardo Geraldi, Saverio Teodosio Nilo, Elisabetta Ricciardelli, and et al. 2018. "Downscaling of Satellite OPEMW Surface Rain Intensity Data" Remote Sensing 10, no. 11: 1763. https://doi.org/10.3390/rs10111763
APA StyleCersosimo, A., Larosa, S., Romano, F., Cimini, D., Di Paola, F., Gallucci, D., Gentile, S., Geraldi, E., Teodosio Nilo, S., Ricciardelli, E., Ripepi, E., & Viggiano, M. (2018). Downscaling of Satellite OPEMW Surface Rain Intensity Data. Remote Sensing, 10(11), 1763. https://doi.org/10.3390/rs10111763