1. Introduction
From the very first spaceborne synthetic aperture radar (SAR)-SEASAT (seafaring satellite), storm signatures have been seen, mainly in the unique structure of storm-related rain footprints over the ocean surface [
1,
2]. Unique mesoscale features such as rain bands [
3], eye morphology [
4], and vortices [
5] have also been observed by follow-on SAR missions. Significant efforts for the retrieval of quantitative information from SAR have been conducted for ocean surface wind. After several decades of development, the algorithms for SAR wind retrieval have reached operational applications for routine sea conditions; for example, the Alaskan coastal SAR program [
6] and the Canadian National SAR Wind program [
7]. These developments have especially benefited from large datasets of associated microwave frequency band scatterometer wind products. Based on the continuous improvements in wind speed retrieval under conventional wind conditions, it is appropriate to test the potential capability of high wind speed retrieval from SAR, for hurricanes. The motivation is highlighted by the critical demands for enhanced wind observations during hurricanes, especially over the ocean, before storms make landfall.
Modern SAR instruments have a capability for multiple polarization measurements. Among these, co-polarization (hereafter: co-pol), i.e., HH and/or VV polarization (H: Horizontal, V: vertical, with the first letter standing for radar transmission polarization and the second letter for receiving polarization), is mostly used in ocean studies, especially in early satellite SAR missions e.g., Reference [
6]. The wind vector retrieval methods based on these co-pol SAR measurements have been successful, based on a series of geophysical model functions (GMFs), such as CMOD5.N [
8], for C-band SAR, which are leading to the operational monitoring of wind fields under low to moderate wind conditions (i.e., 0–35 m/s). For example, ocean wind products are operationally provided in the Sentinel SAR L2 product data by the European Space Agency. Attempts to retrieve hurricane-force wind from co-pol SAR have also been made, as shown in References [
9,
10]. Mathematically, it is straightforward to apply the SAR wind algorithm derived for conventional wind conditions to SAR hurricane images, however, challenges remain. For example, studies show that co-pol SAR signals suffer signal saturation under high wind speeds e.g., Reference [
8], which result in decreased sensitivity of radar backscattered signals with increased wind speed. This is thought to be mainly induced by suppressed Bragg waves under high wind conditions, due to sea spray [
11] or changes in the atmospheric surface layer [
12]; however, the detailed mechanism is still unclear due to limited in situ observations. Under low radar incidence angles (<30°), the normalized radar cross section (NRCS) even appears to decrease as observed by laboratory [
13] and aircraft measurements [
14], leading to speed ambiguity in SAR wind retrievals for high wind speeds [
15]. The CMOD5.N GMF captures this natural saturation effect; thus, an ambiguity removal scheme needs to be applied so that hurricane-force wind speed can be obtained from co-pol radar returns [
16].
Meanwhile, the capability of cross-polarization (hereafter: cross-pol) measurements for high wind speed retrieval has been revealed, benefiting from the high-quality radiometric calibration performance of C-band RADARSAT-2 SAR. Compared to higher frequency microwave bands, for example X-band, C-band radar is less influenced by rain, and thus more widely used for hurricane wind retrieval. Studies show that cross-pol has increased sensitivity under high wind speeds, which makes it especially suitable for high wind speed monitoring. Data analysis has revealed that the cross-pol radar NRCS monotonically increases with wind speed, with no dependence on wind direction and no or little dependence on radar incidence angle. Thus, by collocating observations of radar NRCS with wind data from buoys, dropsondes, models etc., empirical GMFs have been developed [
17,
18,
19]. For example, the authors of study [
18] proposed a linear model between radar NRCS and wind speed for quad-polarization SAR measurements; and the authors of study [
19] proposed a piecewise linear model with a noise suppression procedure for ScanSAR mode RADARSAT-2 SAR data, which is the most widely used mode for hurricane observations [incidence angles, 20–49°]. Since wind direction is not needed in these models, wind speed can be directly retrieved from radar measurements without additional information regarding wind direction as required for wind speed retrieval from co-pol radar signals. These empirical GMFs have been successful in quantifying the relationship between radar backscattered signals and wind speed, which can be difficult to establish for a theoretical model, due to the complicated state of the ocean surface under high wind speeds, involving processes such as wave breaking induced sea spray and foam.
Although empirical geophysical model functions are able to quantify the relationship between the radar NRCS and wind vectors, and accommodate different wind-induced dynamical processes implicitly, there are non-wind-induced external processes in the ocean which can contribute additional radar backscattered signals [
20] Rain is one of these processes. Naturally, heavy precipitation is present in tropical storms and heavy rainfall-induced flooding is a major threat to human society. As mentioned previously, the signatures of heavy rainfall have been observed from the very beginning of SAR satellite remote sensing, e.g., Reference [
2]. Many studies have focused mainly on the morphology of rain signatures in SAR images. In 1994, Atlas [
2] first explained these hurricane footprints in SAR imagery as a result of rain downdrafts. A recent 2016 study by Alpers et al. [
21] suggested a C-band SAR imaging mechanism for rain under low to moderate wind conditions. The rain morphology [
3] apparent from SAR images indicates possible contamination to the retrieved wind speeds in affected areas. Attempts to build a scattering model due to rain effects on the rough sea surface have also been pursued e.g., References [
22,
23]. However, most of these studies rely on rain rate measurements from other sources. A method to retrieve wind and rain simultaneously from ERS scatterometer data has been tested and is possible [
24] under moderate wind conditions. Thus far, no GMF explicitly includes rain estimation for wind retrieval under hurricane conditions. For hurricane-force wind, rain can contribute up to 100% error ([
25] Figure 2) for wind retrieval from airborne stepped frequency microwave radiometer (SFMR) observations (incidence angles −40°–+40°). Compared to SFMR, wind retrieval from SAR suffers similar apparent effects from heavy rain on the ocean surface, because the presence of rain not only changes the brightness temperature which is measured by SFMR, but also surface roughness which is captured by SAR. Thus it is necessary to consider the rain effect in hurricane wind retrieval from SAR.
Finding a method to recognize rain-affected wind cells in SAR images is not a simple task. Because of its antenna design, the scatterometer can assign a quality flag for each retrieved wind vector based on the consistency of multiple measurements from different incidence angles [
24,
26]. SAR has only one incidence angle for each observation, and thus it is difficult to make a similar quality assessment based on its measurements, although the removal of directional ambiguity has been possible based on the concentric wind structure that is generally followed for hurricanes [
10].
However, similar to the multi-looking directional measurements from scatterometers, modern SAR instruments have special multiple-polarization capabilities, such as RADARSAT-2 SAR, which is able to conduct dual-polarization (dual-pol hereafter) and quad-polarization measurements. Dual-pol mode can be operated at ScanSAR swath, with swath widths as much as 500 km, which is suitable for observing hurricanes. The two polarization measurements of dual-pol mode are cross-pol (VH or HV) and co-pol (VV or HH), which have different imaging mechanisms. For cross-pol, volume scattering dominates, whereas for co-pol Bragg scattering is more important [
19]. Study [
21] indicated that non-Bragg scattering may be a dominant scattering mechanism for rain cells. Therefore, the combination of both measurements has been important for wind vector retrieval, in rain-free areas, owing to the advantage of wind speed retrieval from cross-pol measurements and the wind direction sensitivity of co-pol measurements [
27]. This combination has also been shown to be useful for the detection of various targets, for example, oil [
28], wind turbines [
29], macroalgae bloom patches [
30] etc. Under hurricane conditions, a recent study showed that both co- and cross-polarized SAR measurements can be used for extreme wind retrieval. Using their combined geophysical model functions, they obtained wind speeds up to 60 m/s [
31].
In this paper, we extend the application of multiple polarization measurements for rain under hurricane conditions. This is achieved by introducing the principle of rain recognition from SAR described in
Section 2, based on SAR measurements and co-located SFMR measurements. In
Section 3, results are given for SAR-retrieved hurricane wind speeds with a rain flag as a quality index. A methodology to correct the rain-contaminated areas is introduced in
Section 4 and the rain-corrected wind field is validated by HWIND data from Risk Management Solutions (RMS;
www.rms.com/models/hwind), which are post-analysis winds based on objective analysis of best available observations during the storm. Discussions of uncertainties and future plans are presented in
Section 5, followed by conclusions in
Section 6.
3. Rain Recognition from Dual-Pol SAR Imagery
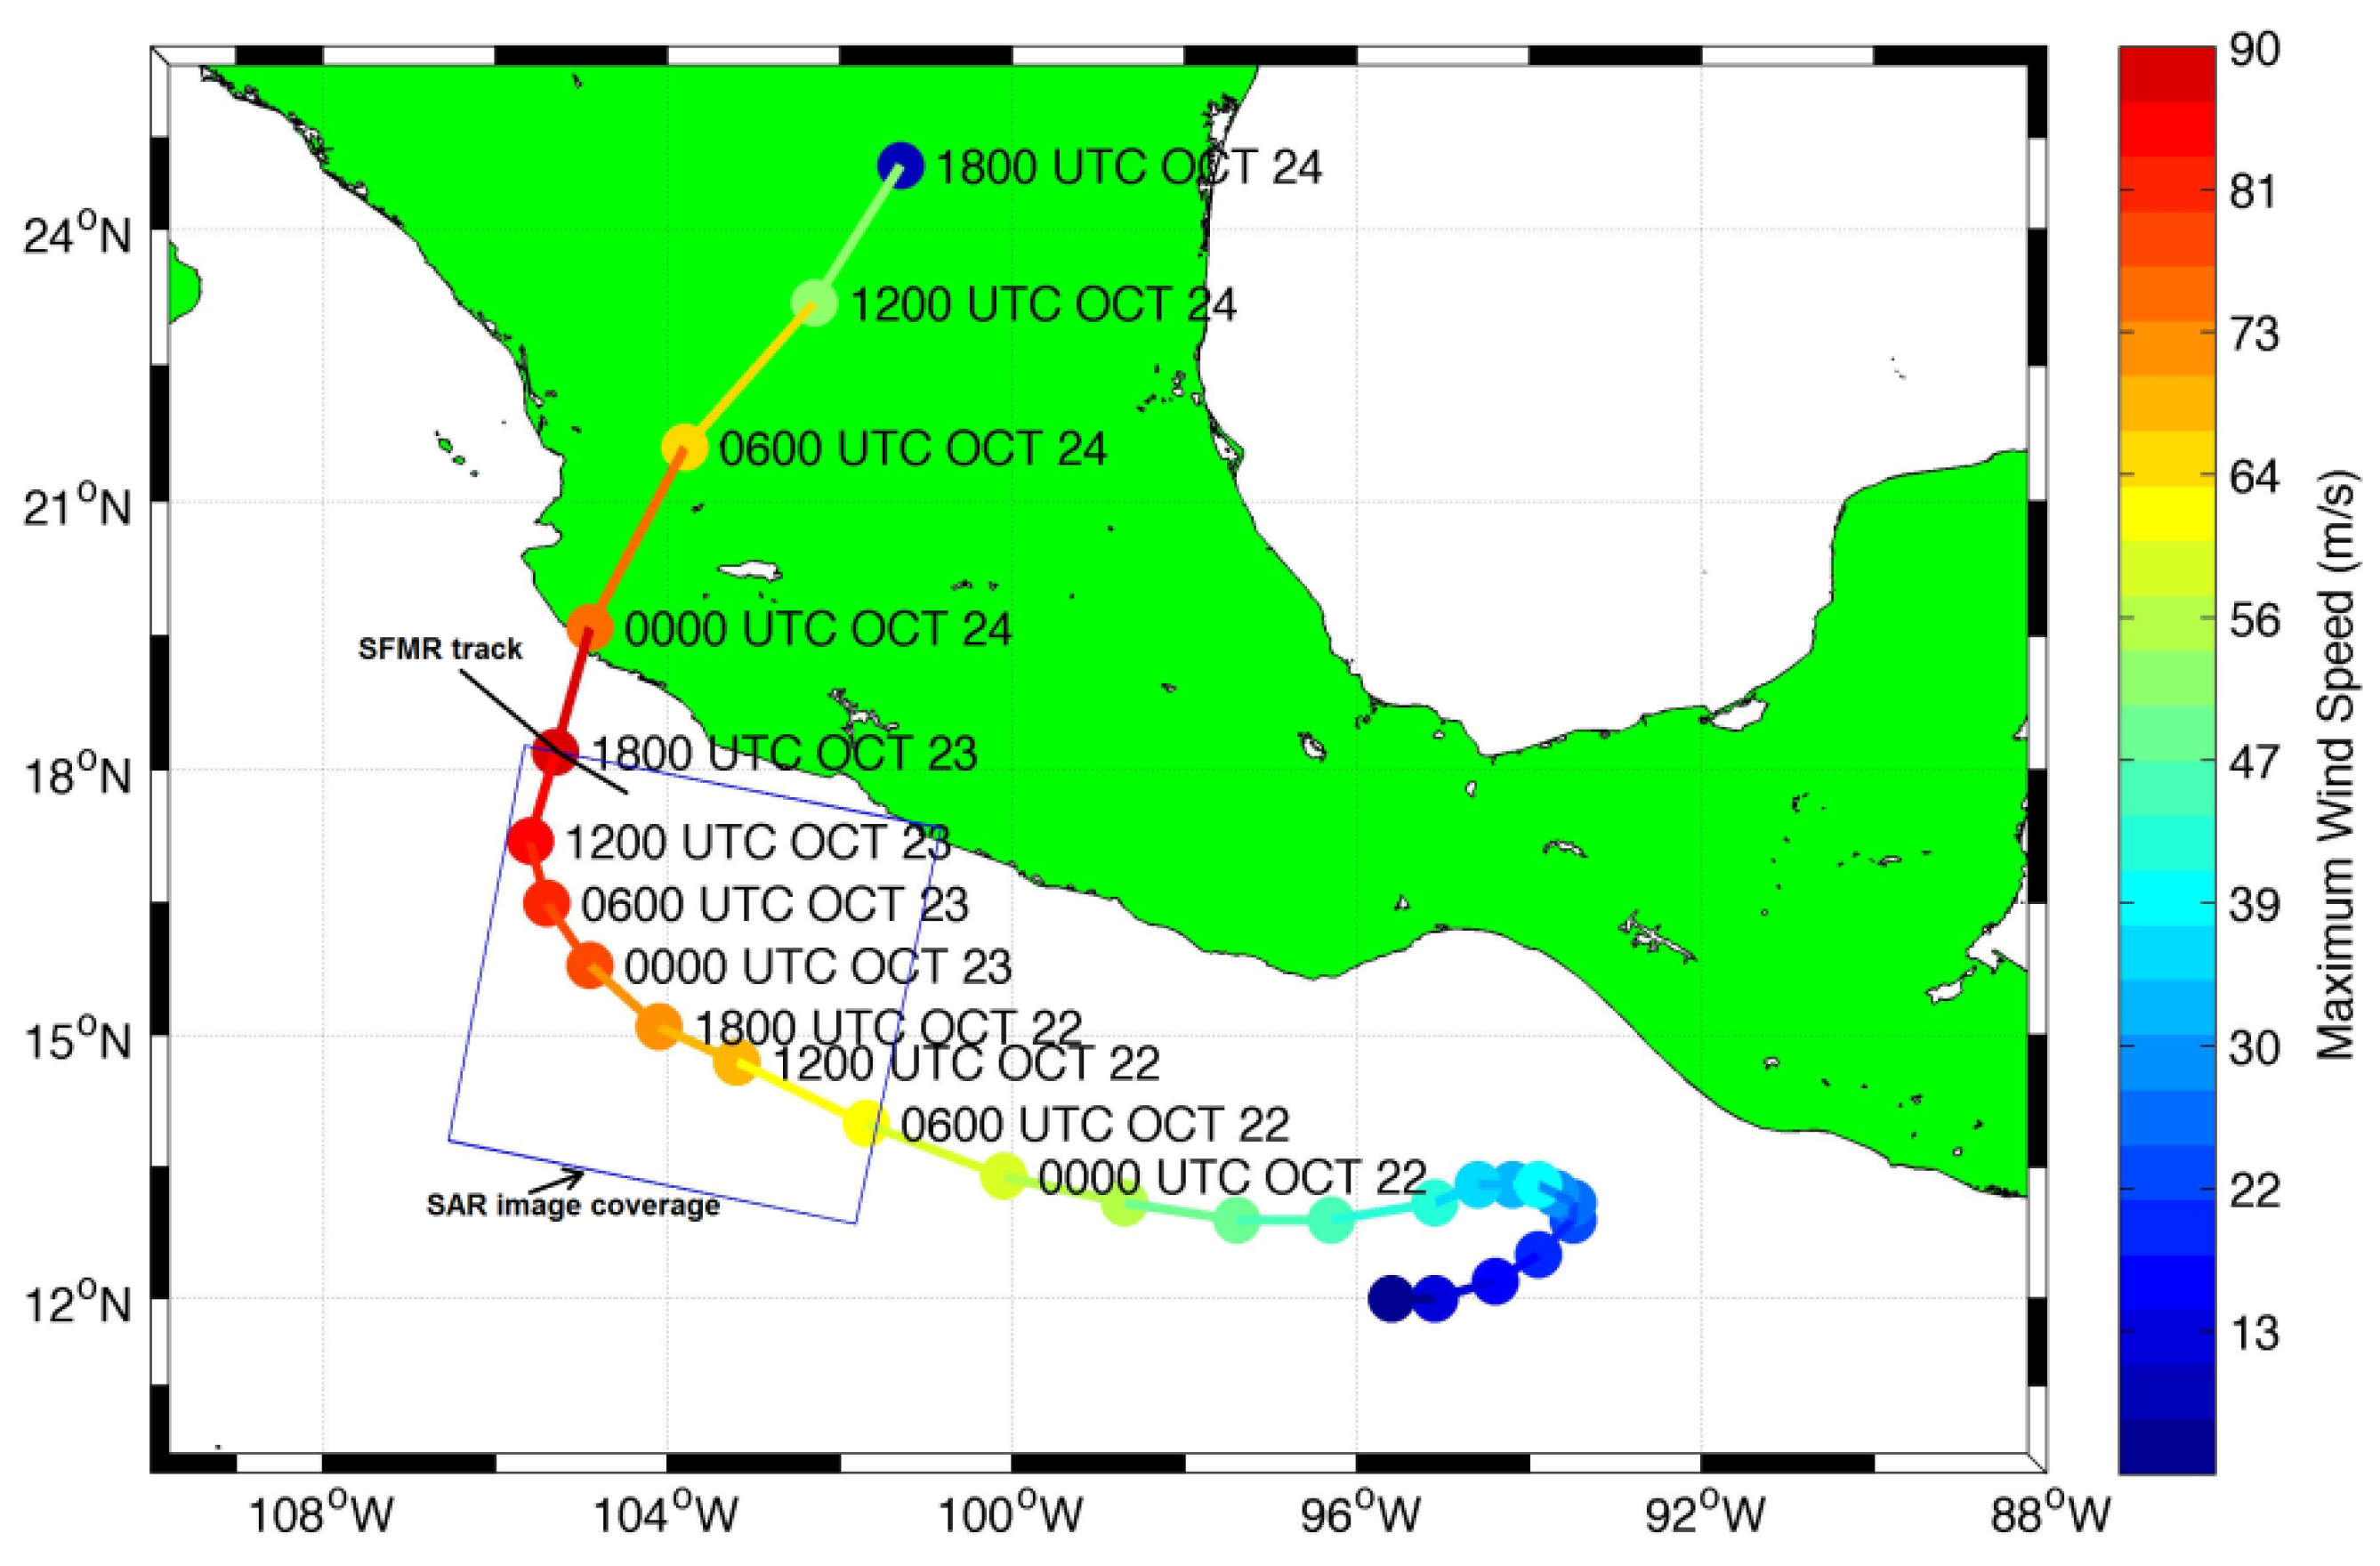
In order to develop a methodology to recognize the rain contaminated ocean surface areas under hurricane conditions, we studied RADARSAT-2 SAR imagery of the most intense winds observed in Hurricane Patricia (2015), together with SFMR wind speeds and rain rate measurements from hurricane reconnaissance missions. During 20–24 October 2015, Hurricane Patricia intensified from a tropical storm to a Category 5 hurricane and made landfall on the Pacific coast of Mexico (
Figure 2). According to aircraft measurements conducted by the United States National Hurricane Center (NHC) of NOAA (National Ocean and Atmosphere Administration), the lowest pressure was 879 mbar and maximum sustained winds were 200 mph (~89 m/s) at 05:33PM UTC 23 October 2015, which confirms Hurricane Patricia as the most intense cyclone recorded in the western hemisphere in terms of barometric pressure, and the most intense globally in terms of measured maximum sustained winds [
32].
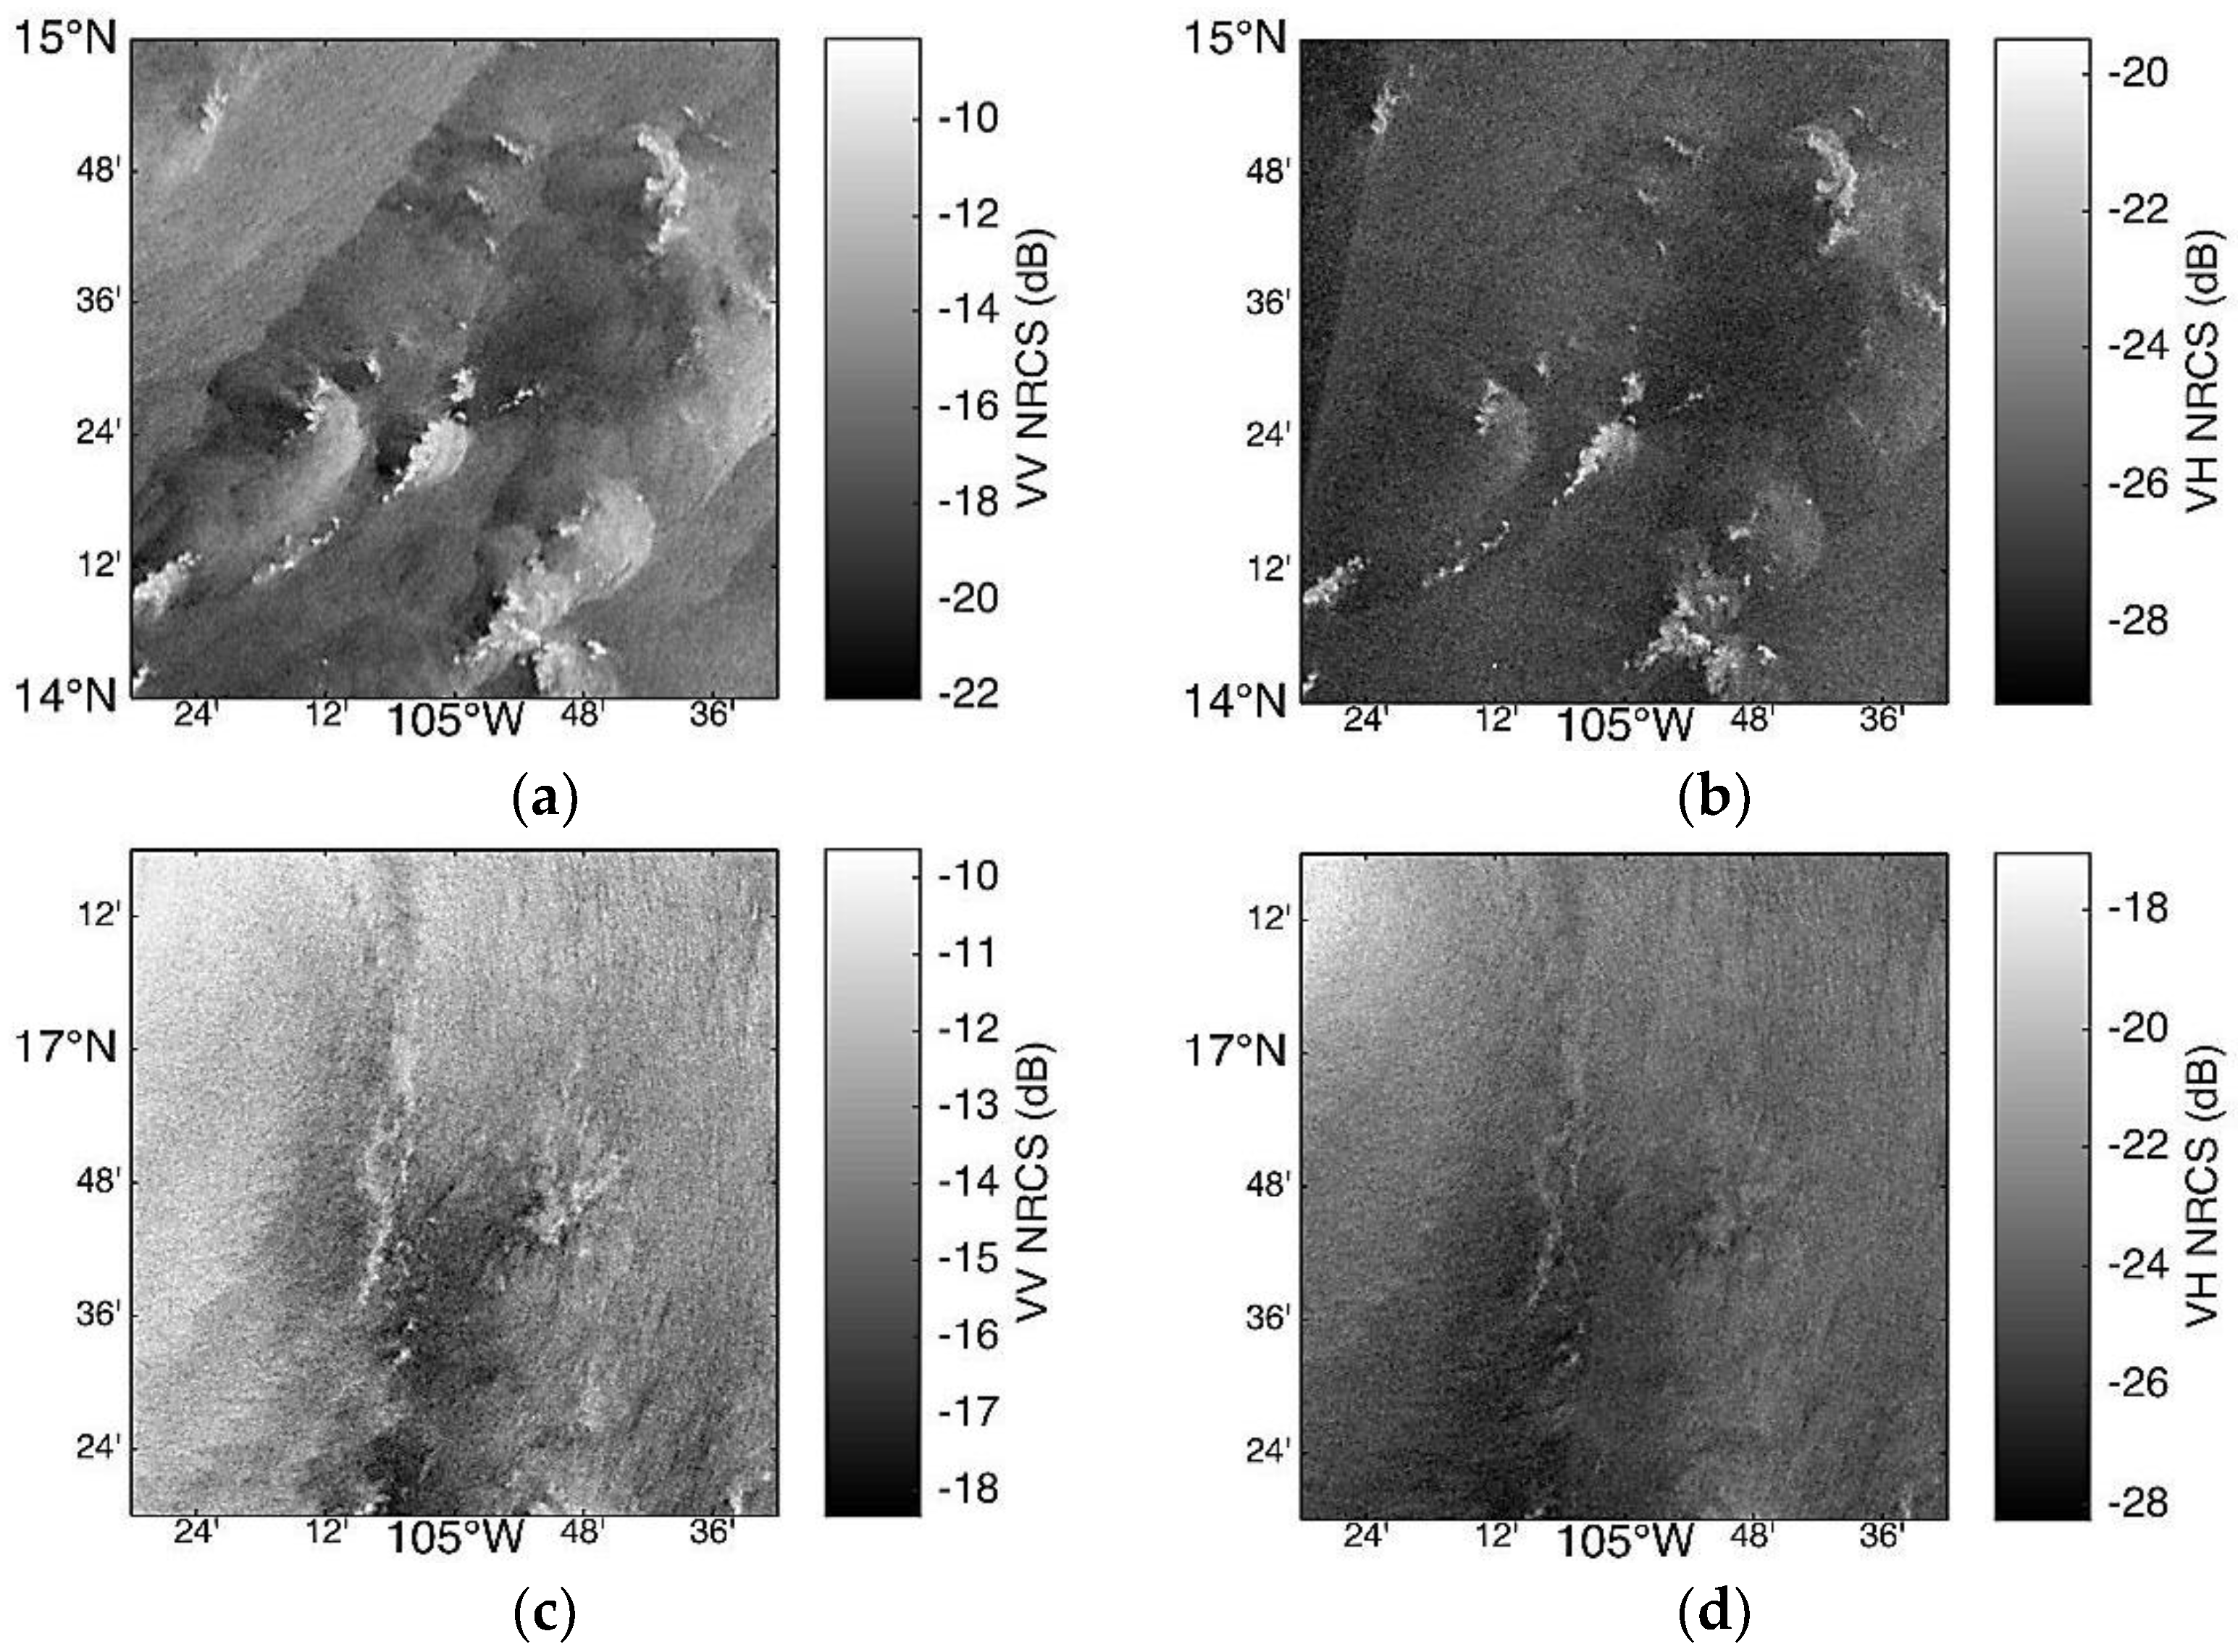
RADARSAT-2 SAR measurements during the most intense phase of Hurricane Patricia took place at 12:45PM UTC on 23 October 2015. RADARSAT-2 SAR has multiple imaging modes and polarizations. Almost all the hurricane images taken by RADARSAT-2 SAR are in ScanSAR mode with dual-polarizations (VV and VH). For ScanSAR, only signal intensity is recorded. For other modes, phase information can be processed by request. The SAR measurements for Hurricane Patricia (2015) were taken in dual-pol mode, and two images with co-pol VV polarization and cross-pol VH polarization were captured. These two RADARSAT-2 SAR images are also notable for capturing the most intense wind speed that has thus far been recorded by SAR measurements over the ocean surface.
Hurricane track data are from the NHC (
www.nhc.noaa.gov/). The color of the track as indicated with dots shows the strength of the maximum wind speeds. The square box shows the coverage of the RADARSAT-2 SAR image at 12:45 UTC on 23 October 2015, and the black line shows the NOAA 43 SFMR track in the hurricane core area.
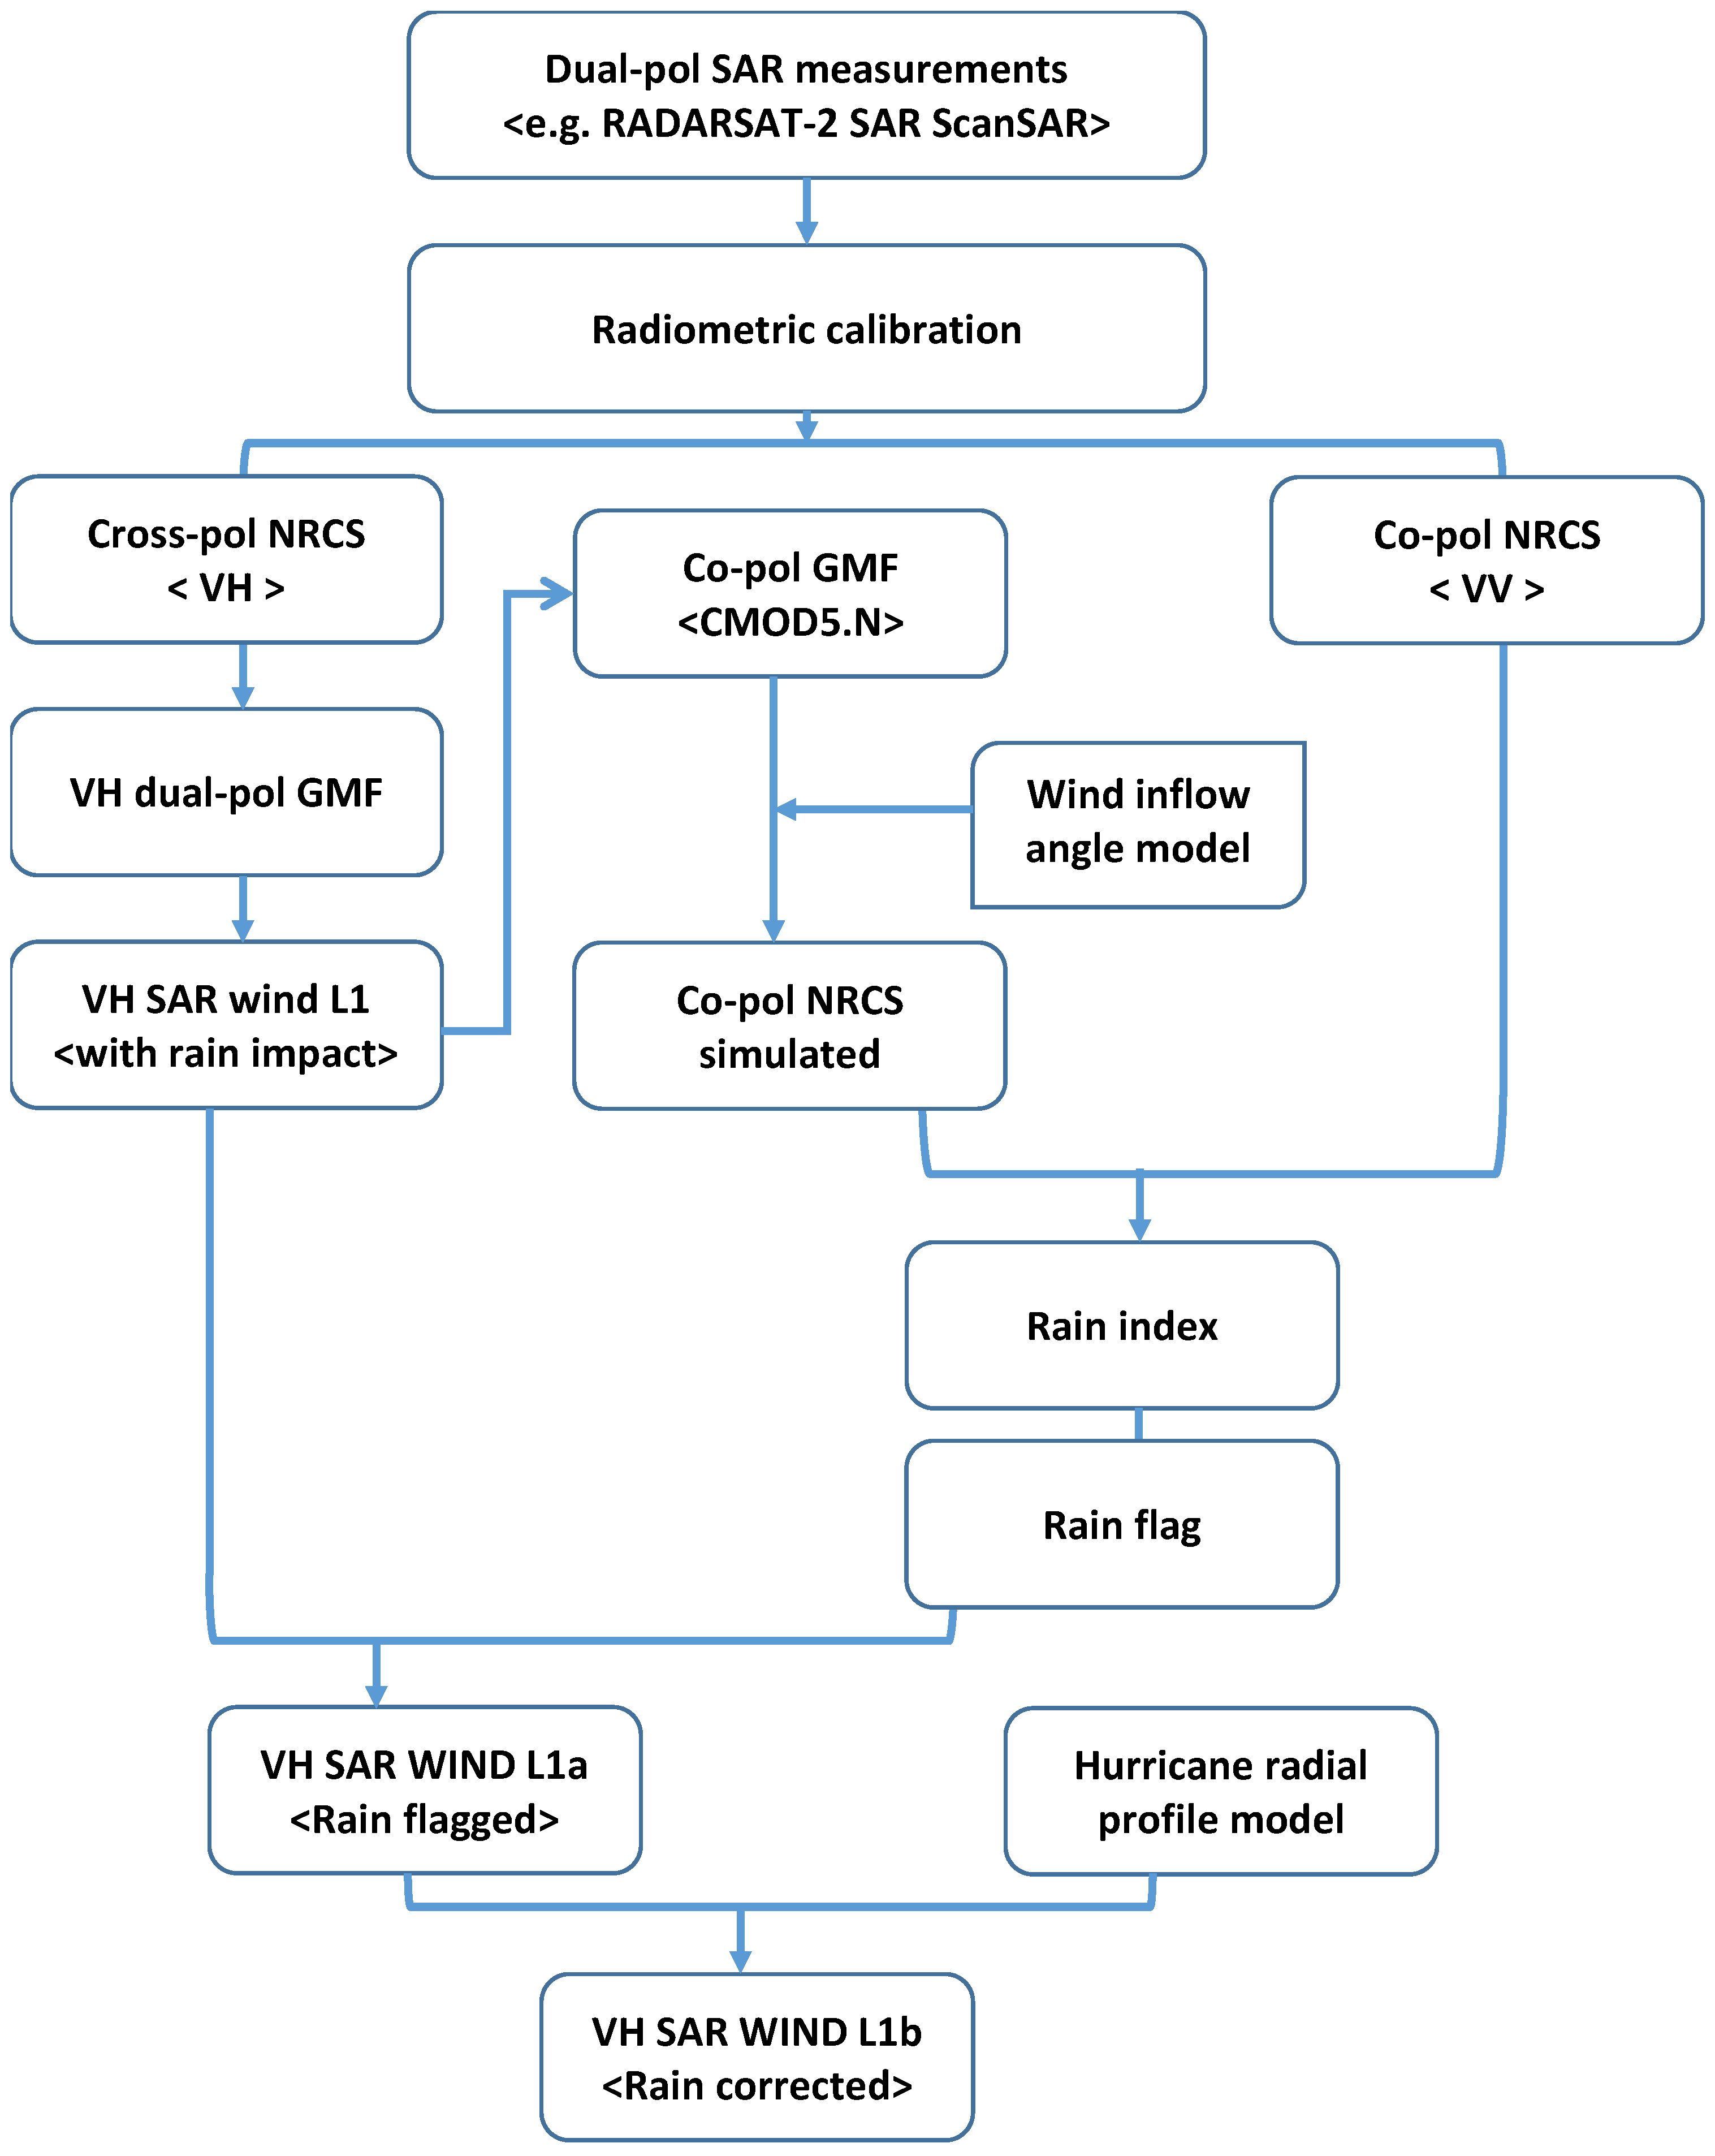
The flowchart of the proposed procedure to recognize rain areas from SAR is shown in
Figure 3. Firstly, RADARSAT-2 SAR dual-pol measurements are processed to obtain the radiometric calibrated NRCS (dB). Hurricane wind speeds are then retrieved from the cross-pol mode image, using a VH dual-pol GMF [
19]. Similar to other cross-pol GMFs, this GMF [
19] was developed by collocating SAR measurements with data from in situ buoys. However, this model function targets VH dual-pol data only instead of also including quad-pol data which has different radiometric accuracy. Since most, if not all, of the cross-pol RADARSAT-2 SAR hurricane images are taken in the VH dual-pol mode, this approach is expected to better fit the objectives of this study. In previous work [
19], we also introduced a noise removal scheme which significantly removed the apparent “seams” between different beams of the ScanSAR mode image. The VH dual-pol GMF was further evaluated in Reference [
33] by comparing SAR winds with the state-of-art hurricane wind analysis product, HWND, from NOAA (now provided by RMS). HWIND uses expertly standardized and quality controlled wind observations from multiple platforms (aircraft, surface-based stations, buoys, remote sensing, etc.) in a storm-relative framework to map a tropical cyclone’s wind field [
34]. Validation results show that wind patterns retrieved from the VH dual-pol GMF are consistent with HWIND, with SAR speed underestimates of −1.3 m/s over the whole hurricane area, and −7.05 m/s in the hurricane core area (within 100 km of the hurricane center). The root mean square difference is 4.5 m/s. Heavy rain may contribute to a larger bias in the core area, which is a focus of the present paper.
We simulated the co-pol radar NRCS based on wind speed retrieved from VH SAR measurements (hereafter, VH wind speed), using the co-pol GMF CMOD5.N [
8], which would be used for comparison with the measured co-pol data. For the co-pol GMF, wind direction is required to be known a priori. We adopted the hurricane sea surface inflow angle parameterization model from Reference [
35] to obtain the hurricane wind direction. To decrease any possible bias induced from uncertainty in the wind direction away from the hurricane center, we focus on the wind field within 100 km of the hurricane eye.
We then compared the simulated co-pol radar NRCS to the NRCS from observations. The difference between the simulated and measured co-pol NRCS was taken as a quality index as shown in Equation (1). To avoid possible errors induced by speed ambiguity from co-pol wind retrieval under low incidence angles, we did not directly compare the wind retrievals from the two polarization modes; instead, we used an alternate approach to quantify the rain-induced differences in the dual-pol measurements. Note these attenuations are a natural phenomenon in NRCS for high winds measurements by co-pol SAR. We simulated the co-pol radar NRCS based on the wind speed retrieved from the VH wind speed, using the co-pol GMF CMOD5.N.
When there was an apparent difference between the simulated co-pol radar NCRS and the measurements, we labeled the corresponding areas as rain contaminated. Ideally, there should be no difference between these areas and rain-free areas. However, there is always random noise in SAR measurements. RADARSAT-2 SAR has a radiometric accuracy of 0.3 dB [
36]; a SAR wind White Paper [
37] suggested that the radiometric error should be less than 0.5 dB in order to obtain high resolution wind retrieval from SAR. By accommodating these factors, we set the threshold value for the difference to be 0.5 dB. The low wind area (here <20 m/s) within the hurricane eye was not labeled for quality assessment, based on two considerations: firstly, that the hurricane eye area may have complex wind dynamics, for example mesovortices [
38], thus the wind direction parametric model adopted for co-pol simulation may not apply, as it was developed mostly for areas outside the eyewall [
35]; and secondly, the eye area is usually cloud-free as observed from optical imagery, thus is not directly affected by rain. For Hurricane Patricia (2015), this low wind eye area is within a 7 km radius of the hurricane center.
where,
σ is NRCS in dB,
U is VH wind speed,
ϕ is radar incidence angle,
θ is wind direction.
SAR-retrieved wind speeds were compared with SFMR measurements from the NOAA hurricane hunter mission. A storm-relative coordinate system was adopted by firstly adjusting the SAR hurricane center to the SFMR observed hurricane center, and thus we retrieved SAR observations along the SFMR track. The hurricane center from SAR is determined by fitting the position of the hurricane maximum wind speed (eyewall) as retrieved from cross-pol image to an ellipse as in study [
4]. The center of the ellipse is taken as the center of hurricane. We note that Hurricane Patricia remained relatively steady from 12:00PM to 06:00PM as indicated by the hurricane best track analysis by the National Hurricane Center. The lowest surface pressure was estimated to be 872 mbar at around 12:00PM and 879 at 05:39PM, according to 43 SFMR measurements [
30].
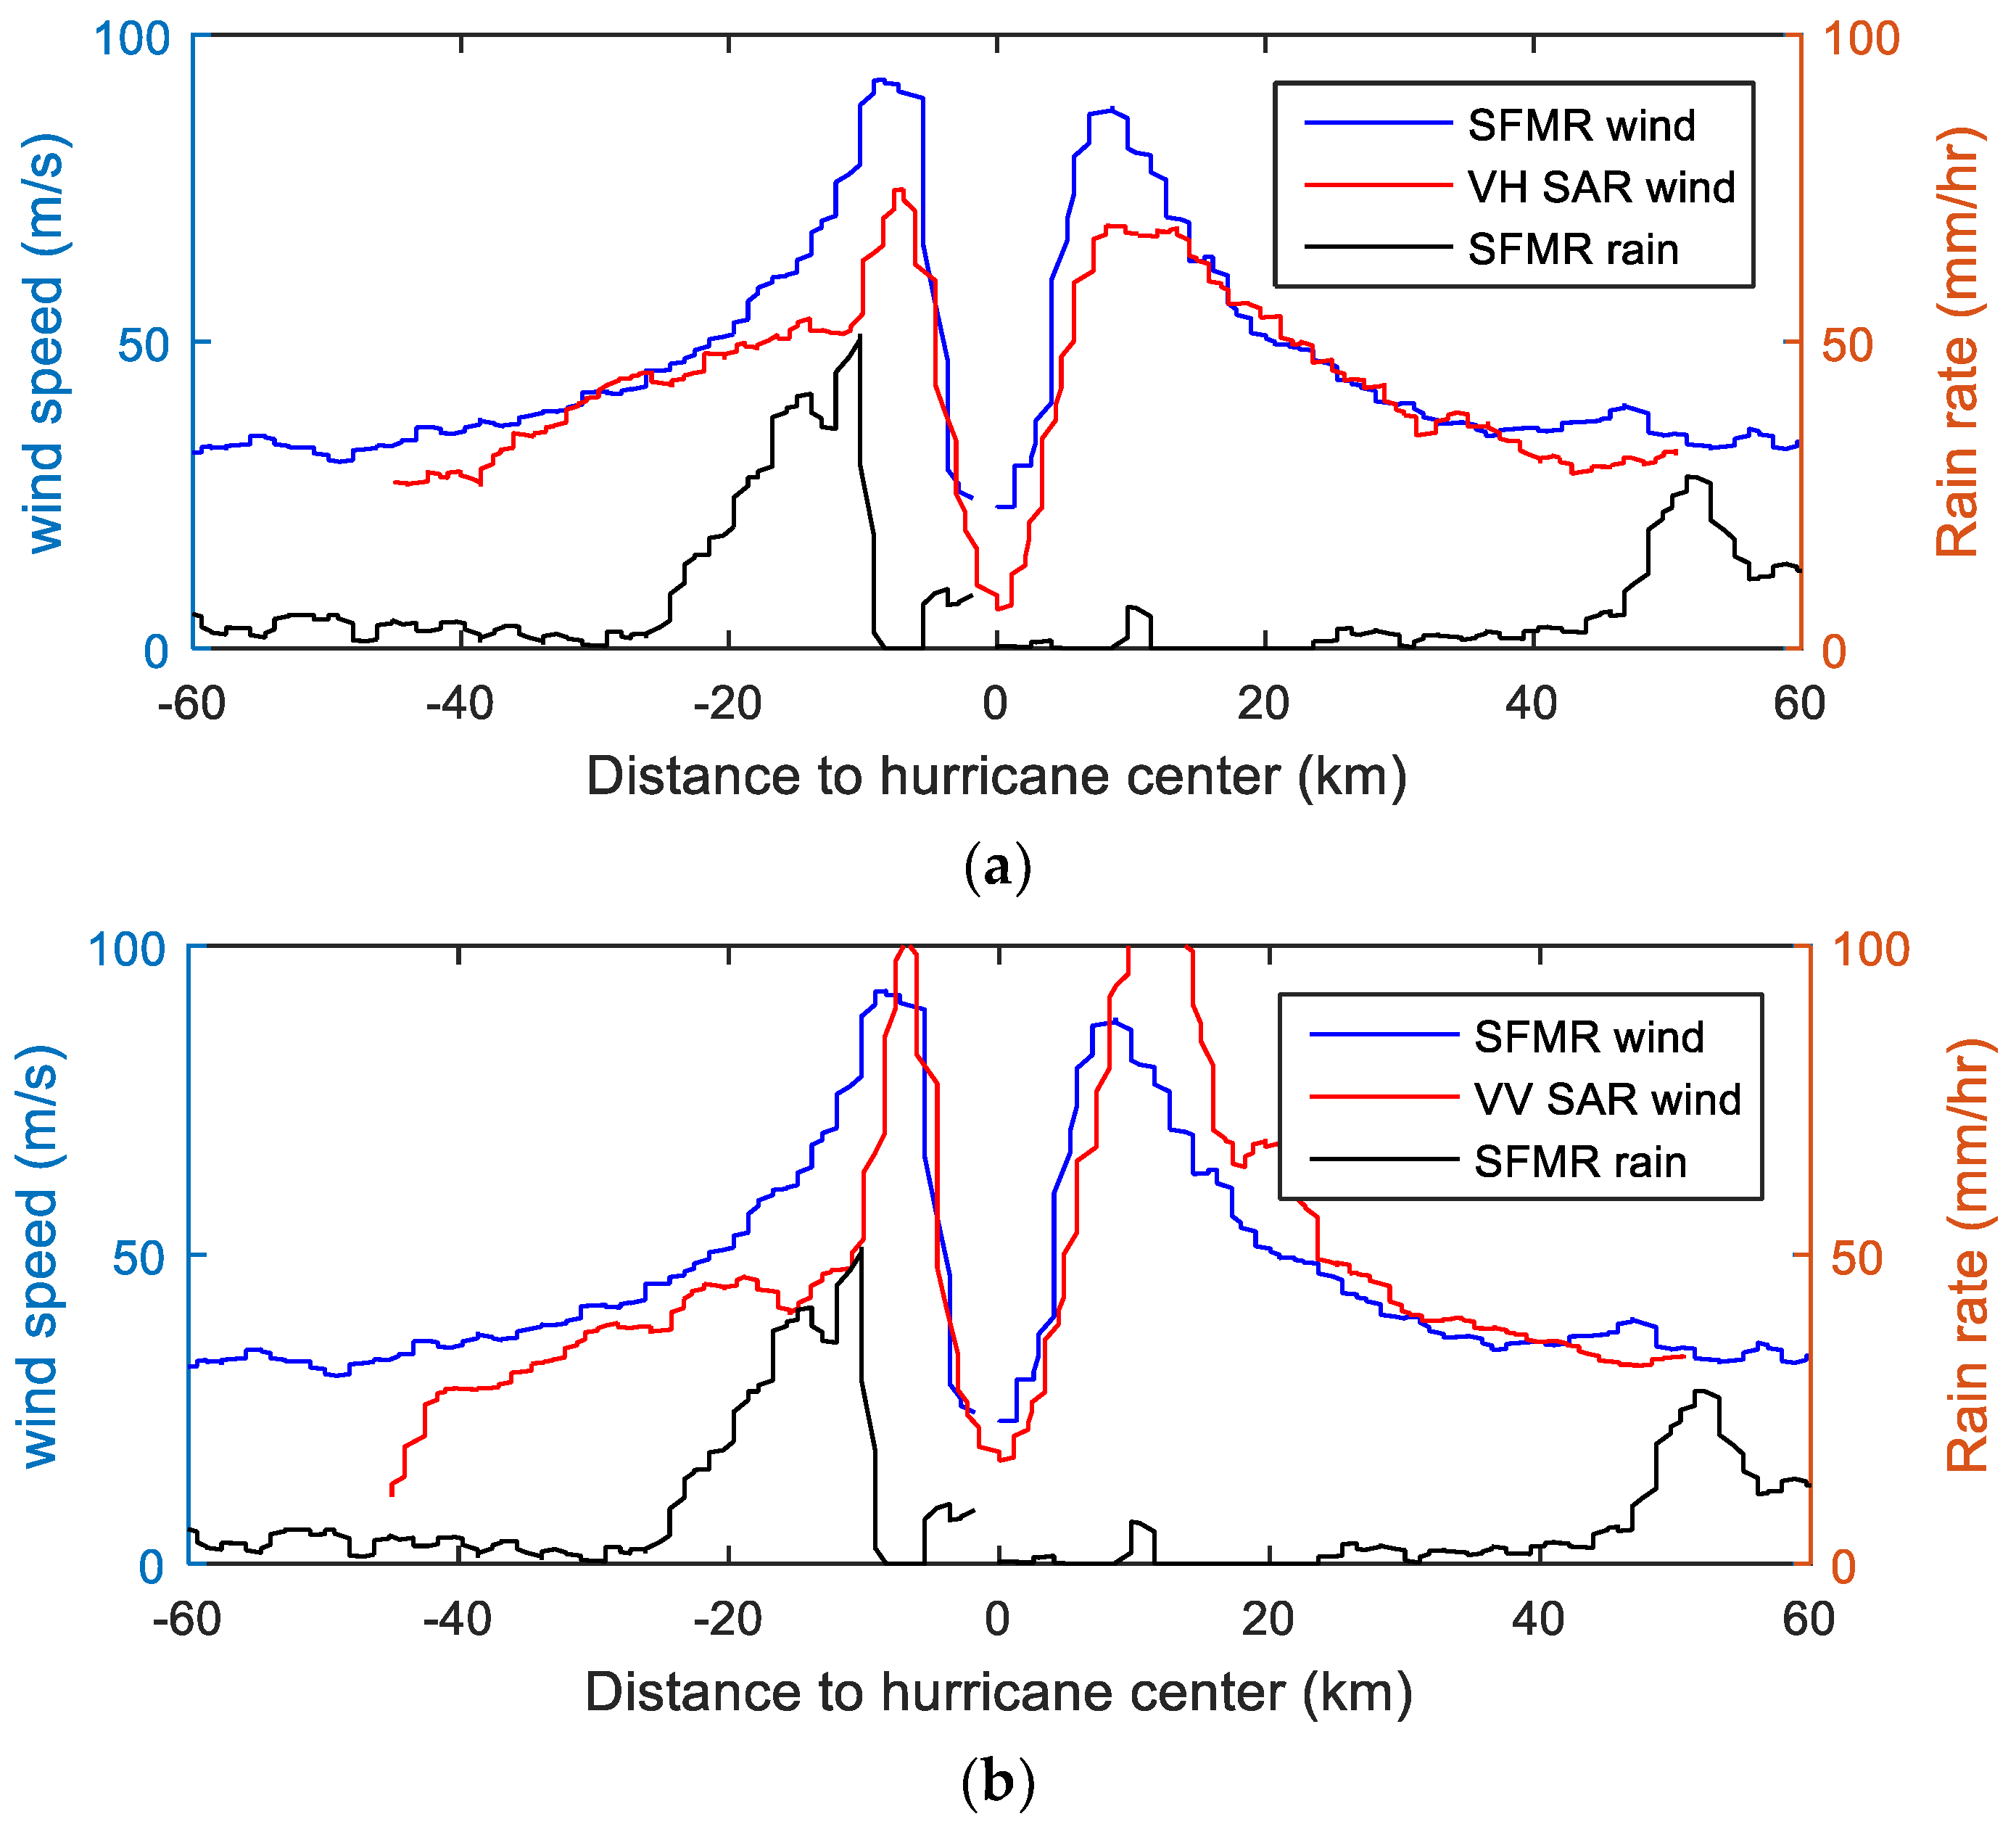
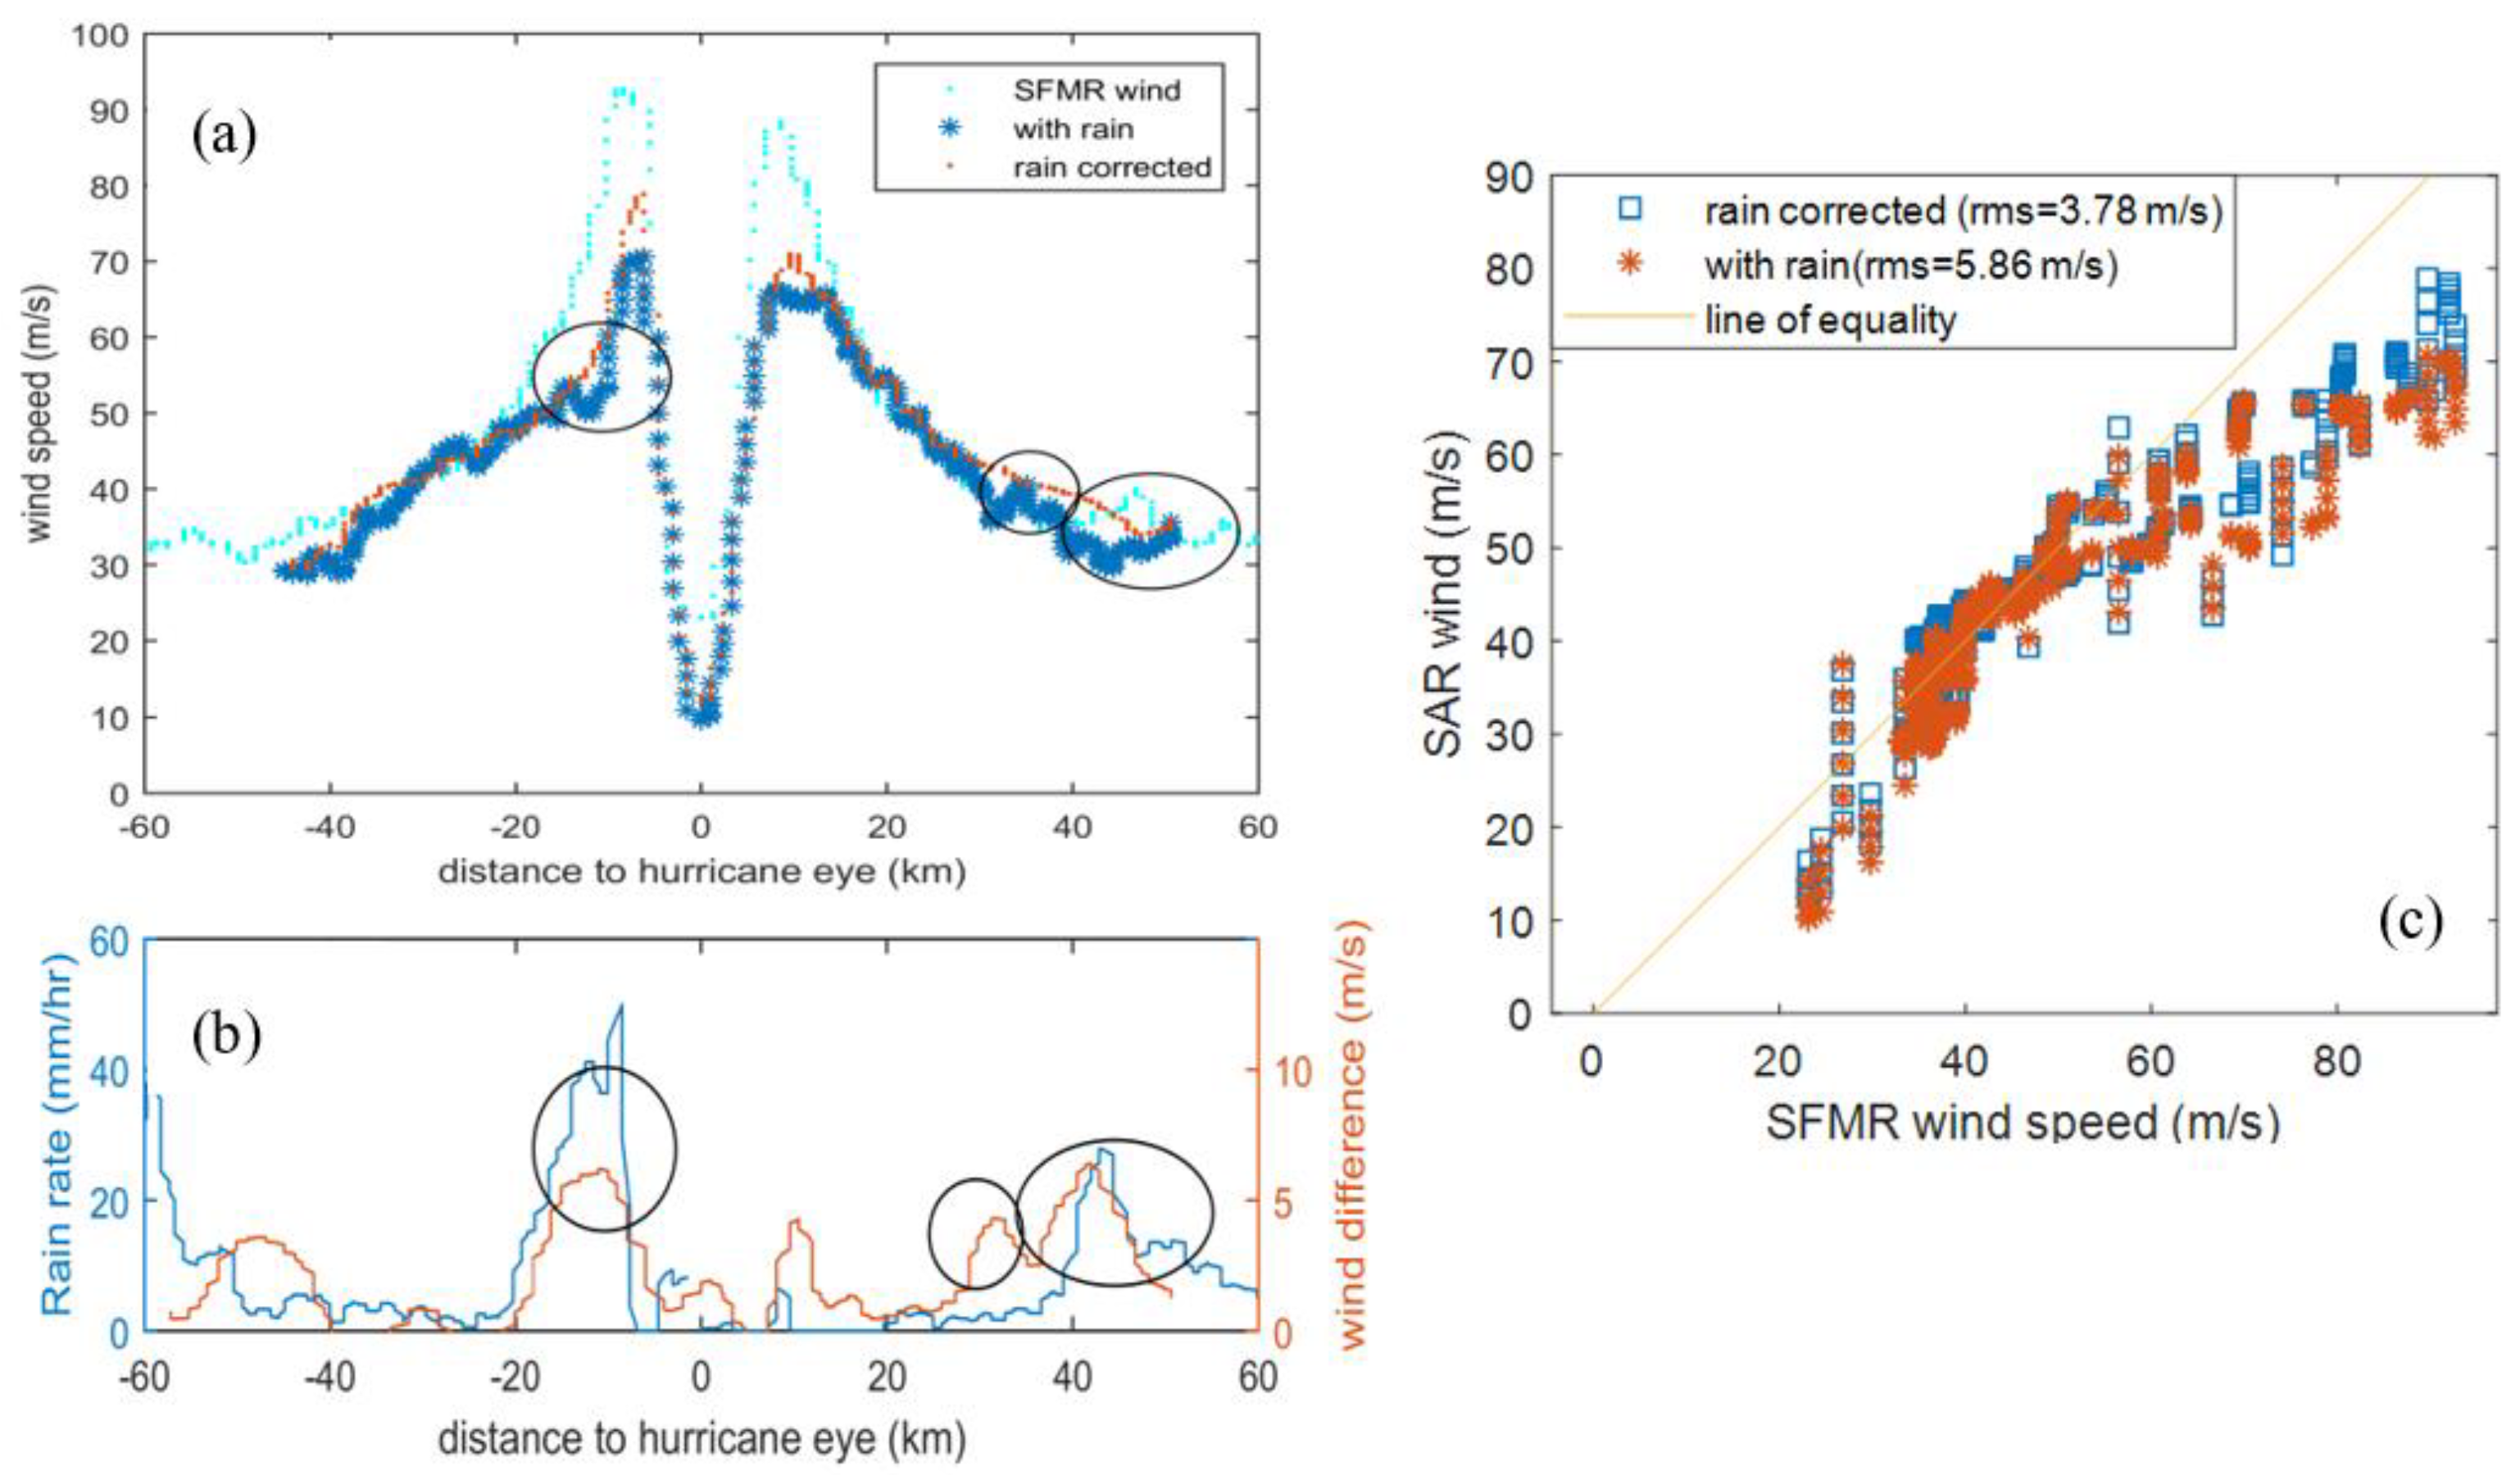
Figure 4 shows a comparison of both measurements along the SFMR track. The SAR-retrieved wind speed from the cross-polarization data reaches 85 m/s, and the SFMR peak wind speed indicates about 93 m/s, with simultaneous rain measurements showing strong precipitation in the hurricane eyewall area, located to the right of the peak wind as indicated by SFMR observations (
Figure 4a). By adopting the hurricane inflow angle model [
35] to CMOD5.N GMF, wind speed is also obtained from co-pol SAR measurements; the peak wind speed obtained by co-pol SAR observations is over 100 m/s (
Figure 4b). Generally, for the rain-free area, both estimates for SAR winds are consistent with SFMR measurements. However, in the heavy rain area (>30 mm/h), the winds derived from co-pol SAR data underestimate the wind speed by about 20–30 m/s, whereas the cross-pol observations seem less affected.
Figure 4 shows the underestimation of the SAR-derived winds in the heavy precipitation area, which once again confirms the overall attenuation effect of rain under hurricane-force wind conditions. This has previously been shown in the analysis of QuikSCAT measurements [
24] and in our data in
Figure 1.
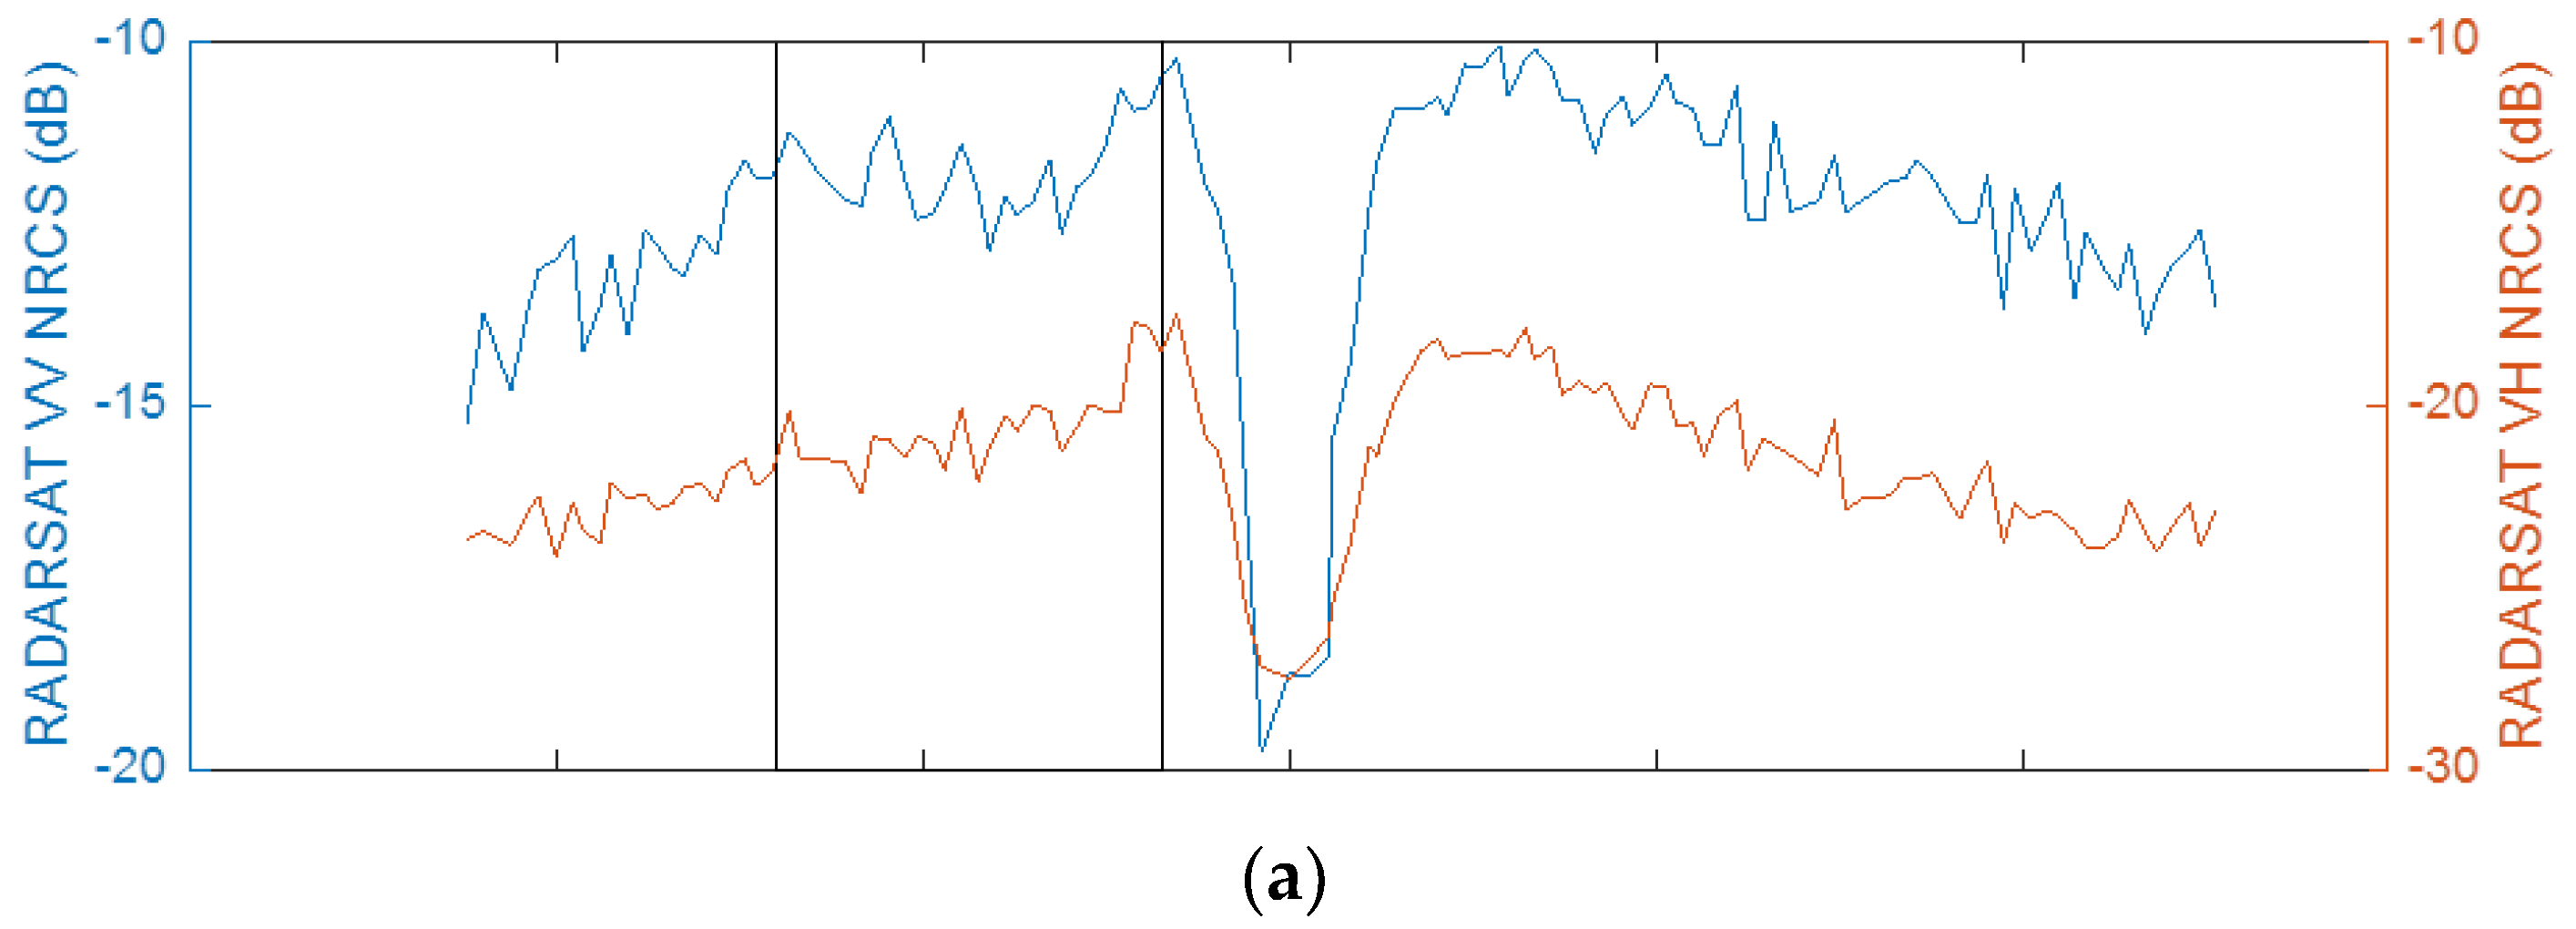
Figure 5a shows the performance of the co-pol backscattered signals along the SFMR tracks. In the heavy precipitation area, the co-pol NRCS measurements decrease by 2–4 dB, compared to the nearby rain-free observations. Comparing the two lines in
Figure 4, it is found that the co-pol data are more heavily affected by rain than the cross-pol data. Consequently, the rain leads to greater underestimation of the wind speed retrieval from co-pol SAR measurements than from cross-pol SAR measurements, with cross-pol showing no apparent underestimation of wind speed, and co-pol showing an underestimation of wind speed of about ~20 m/s.
For areas with rain rates exceeding 30 mm/h, the wind difference between the two GMFs output is larger than 10 m/s (
Figure 4), which is more than three times the standard deviation of SAR-retrieved winds in the 3 × 3 image pixels.
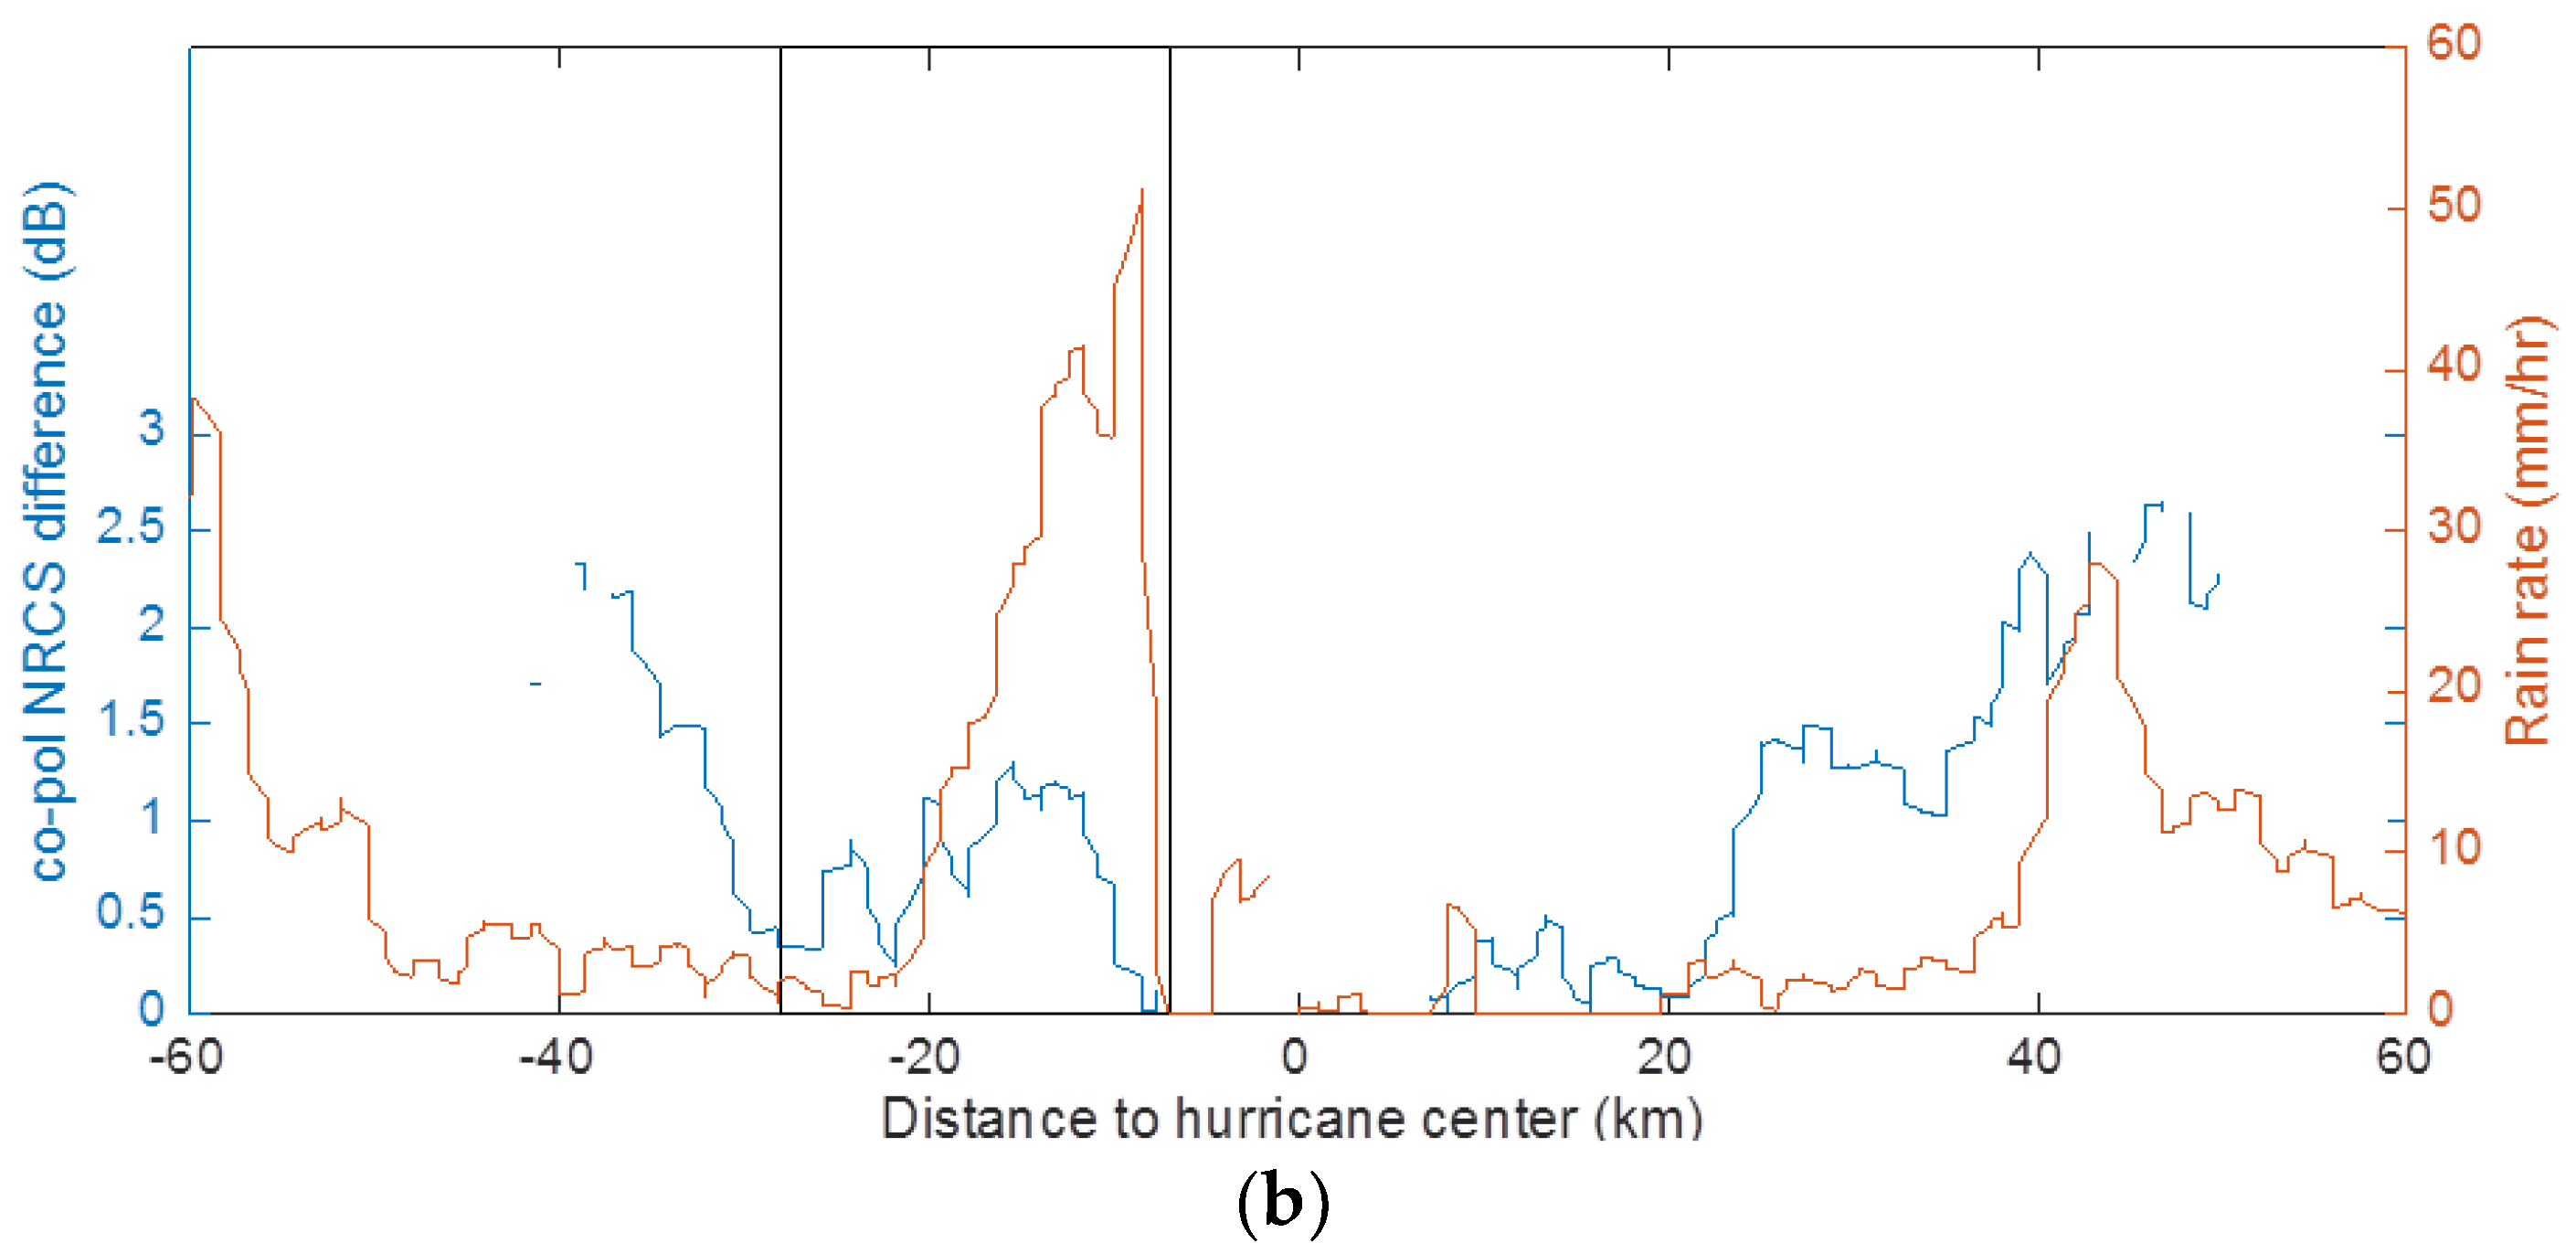
By applying the proposed rain flag methodology as expressed in Equation (1), we label the rain-affected areas in the SAR image and compare them with the SFMR measured rain rate. Overall, the retrieved rain area is consistent with the high rain rate domain as suggested by SFMR measurements (
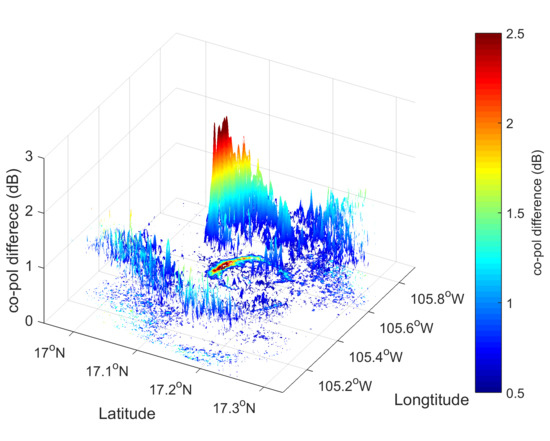
Figure 5b). The two peak index values at ~−15 km and 40 km correspond to high rain rates (>20 mm/h) in these areas. However, the index value does not monotonically increase with higher rain rates. Outside the eyewall area, a larger index value is achieved, benefiting from the higher sensitivity to rain in lower wind speed areas as shown previously in
Figure 1. The relatively lower rain rate areas (3–5 mm/h) at −40 km and 35 km also have high index values of 1.5–2 dB. The index values in these areas are even higher than in the very high rain rate areas around the eyewall at around −10–−20 km, where the rain rate reaches 50 mm/h.
Figure 4 suggests that the wind speed in these corresponding high rain rate areas is around >60 m/s, whereas the wind speed in the relatively low rain rate areas is around <40 m/s.
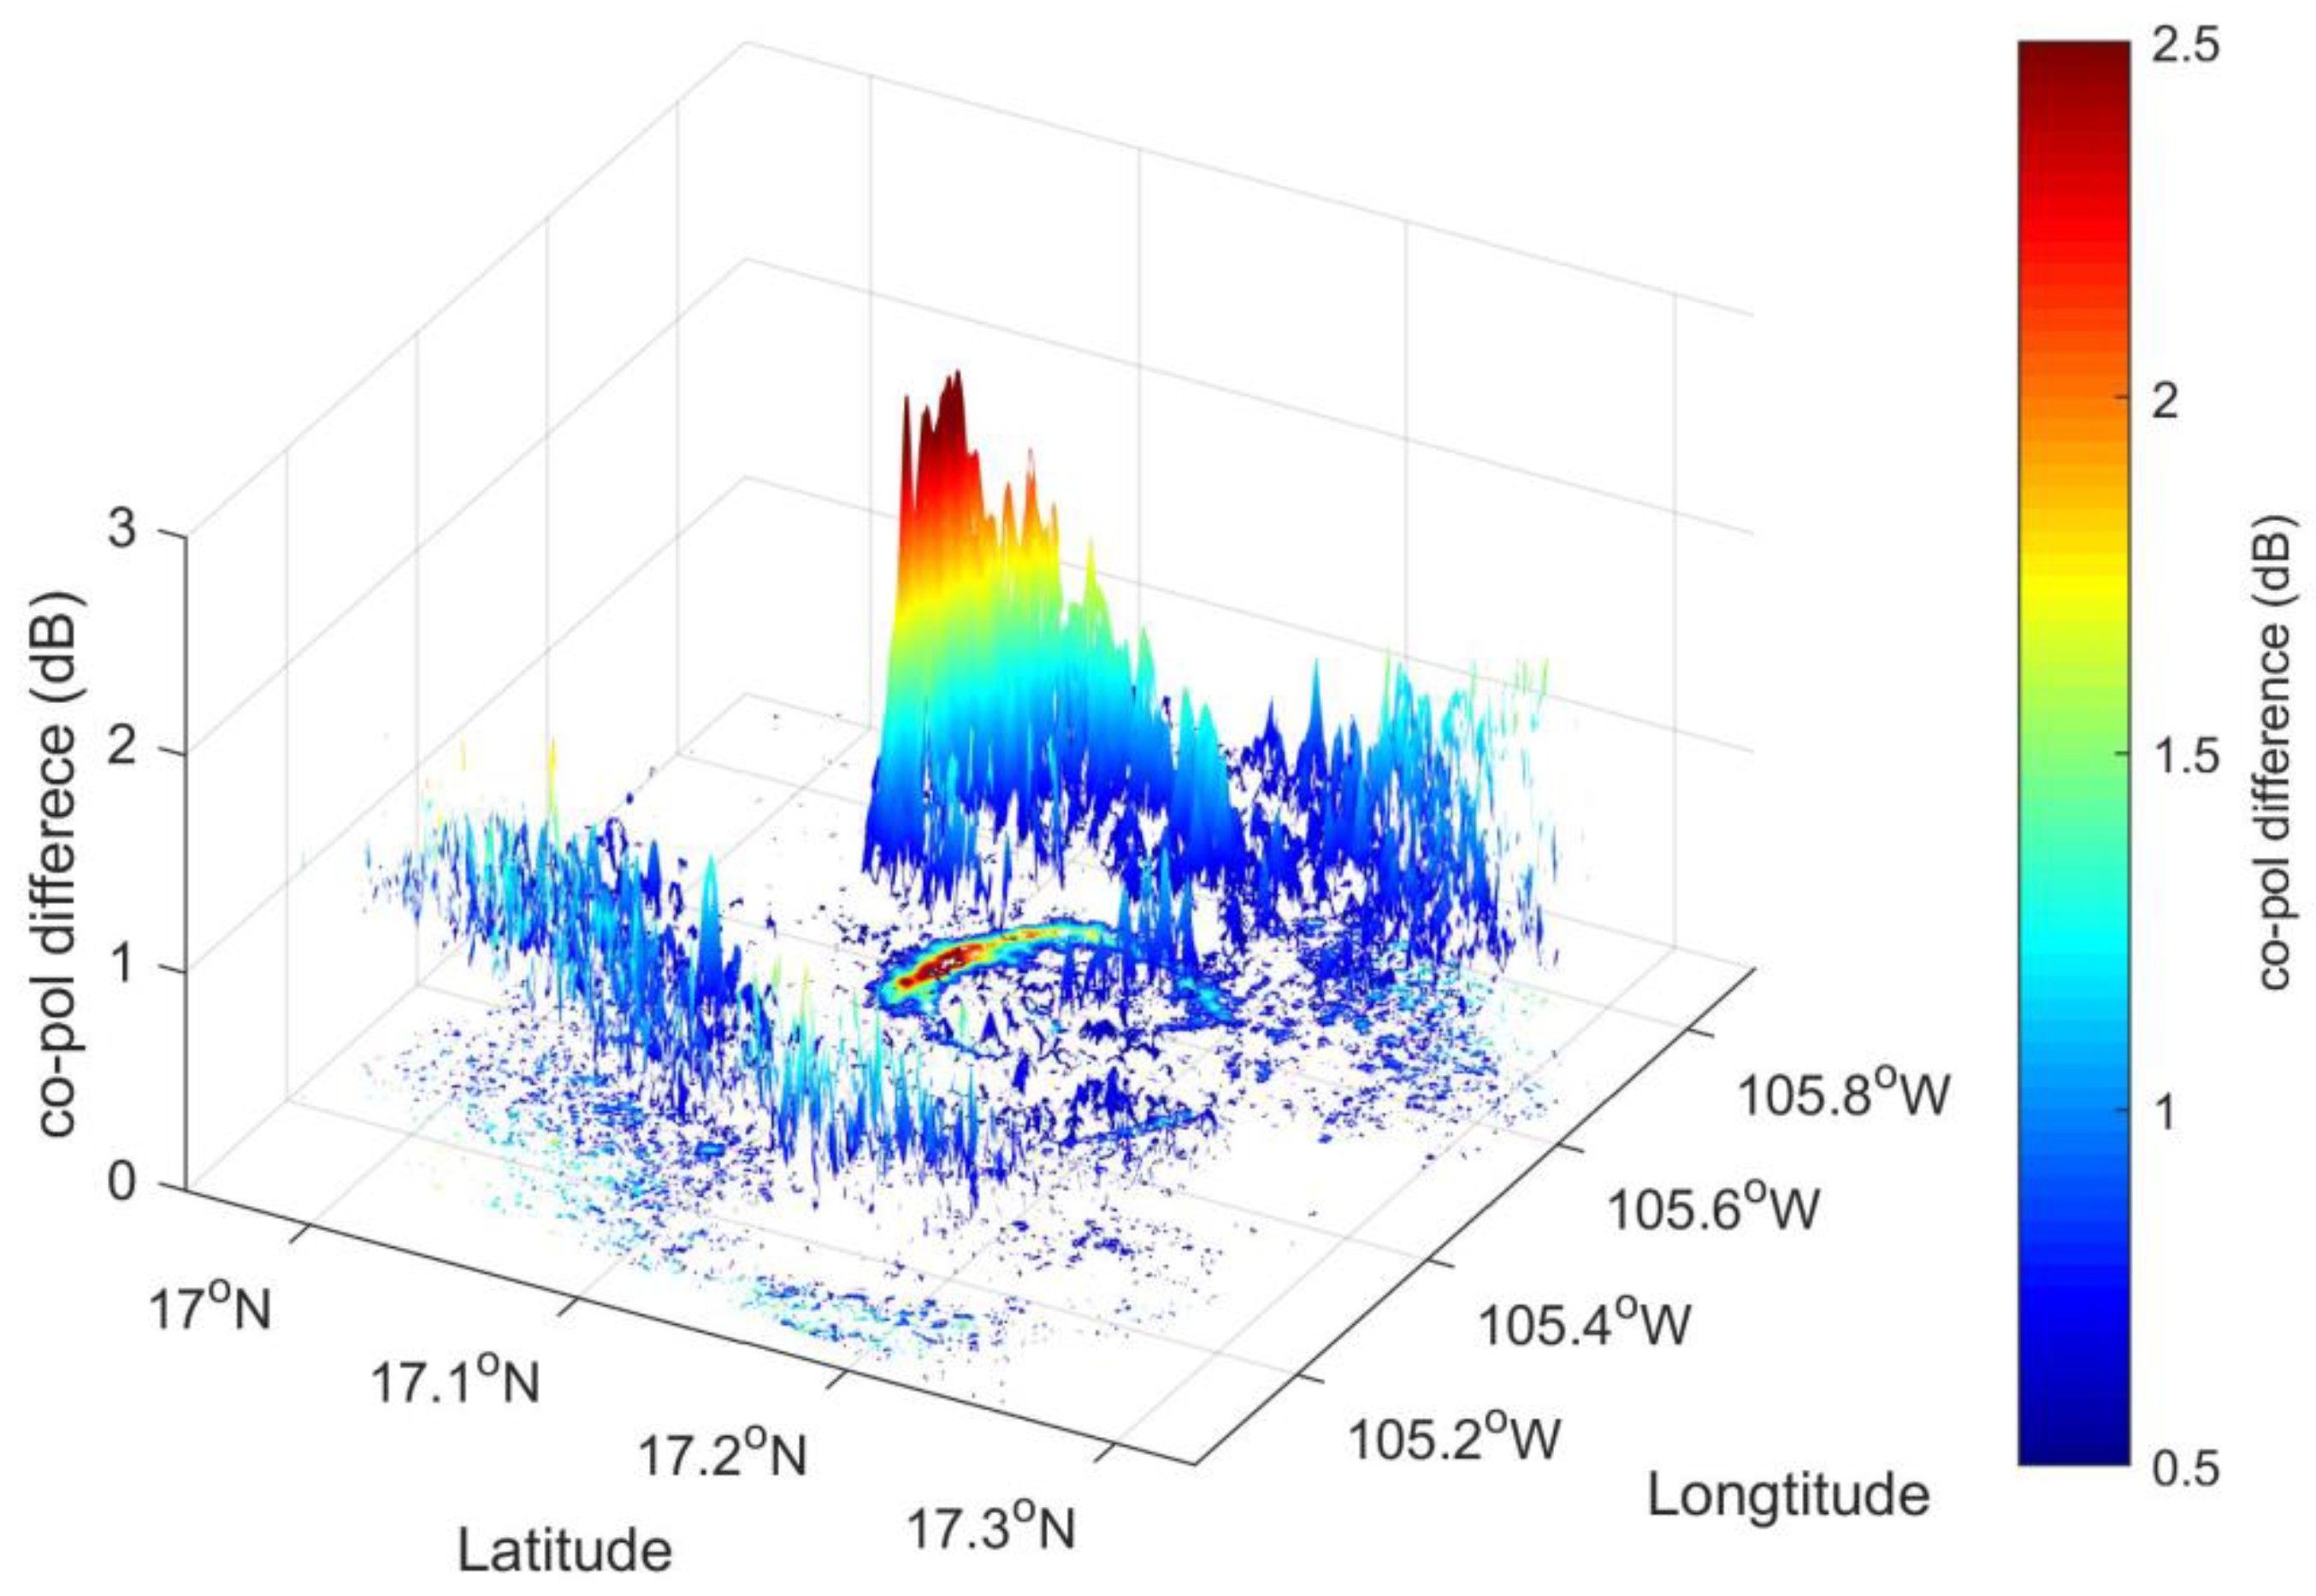
Comparing this quality index with SFMR measurements suggests that the 0.5 dB threshold corresponds to a 5 mm/h rain rate in hurricane eyewall areas and 2–3 mm/h in moderate wind speed areas. In the full 2 Dimension spatial domain of the SAR image,
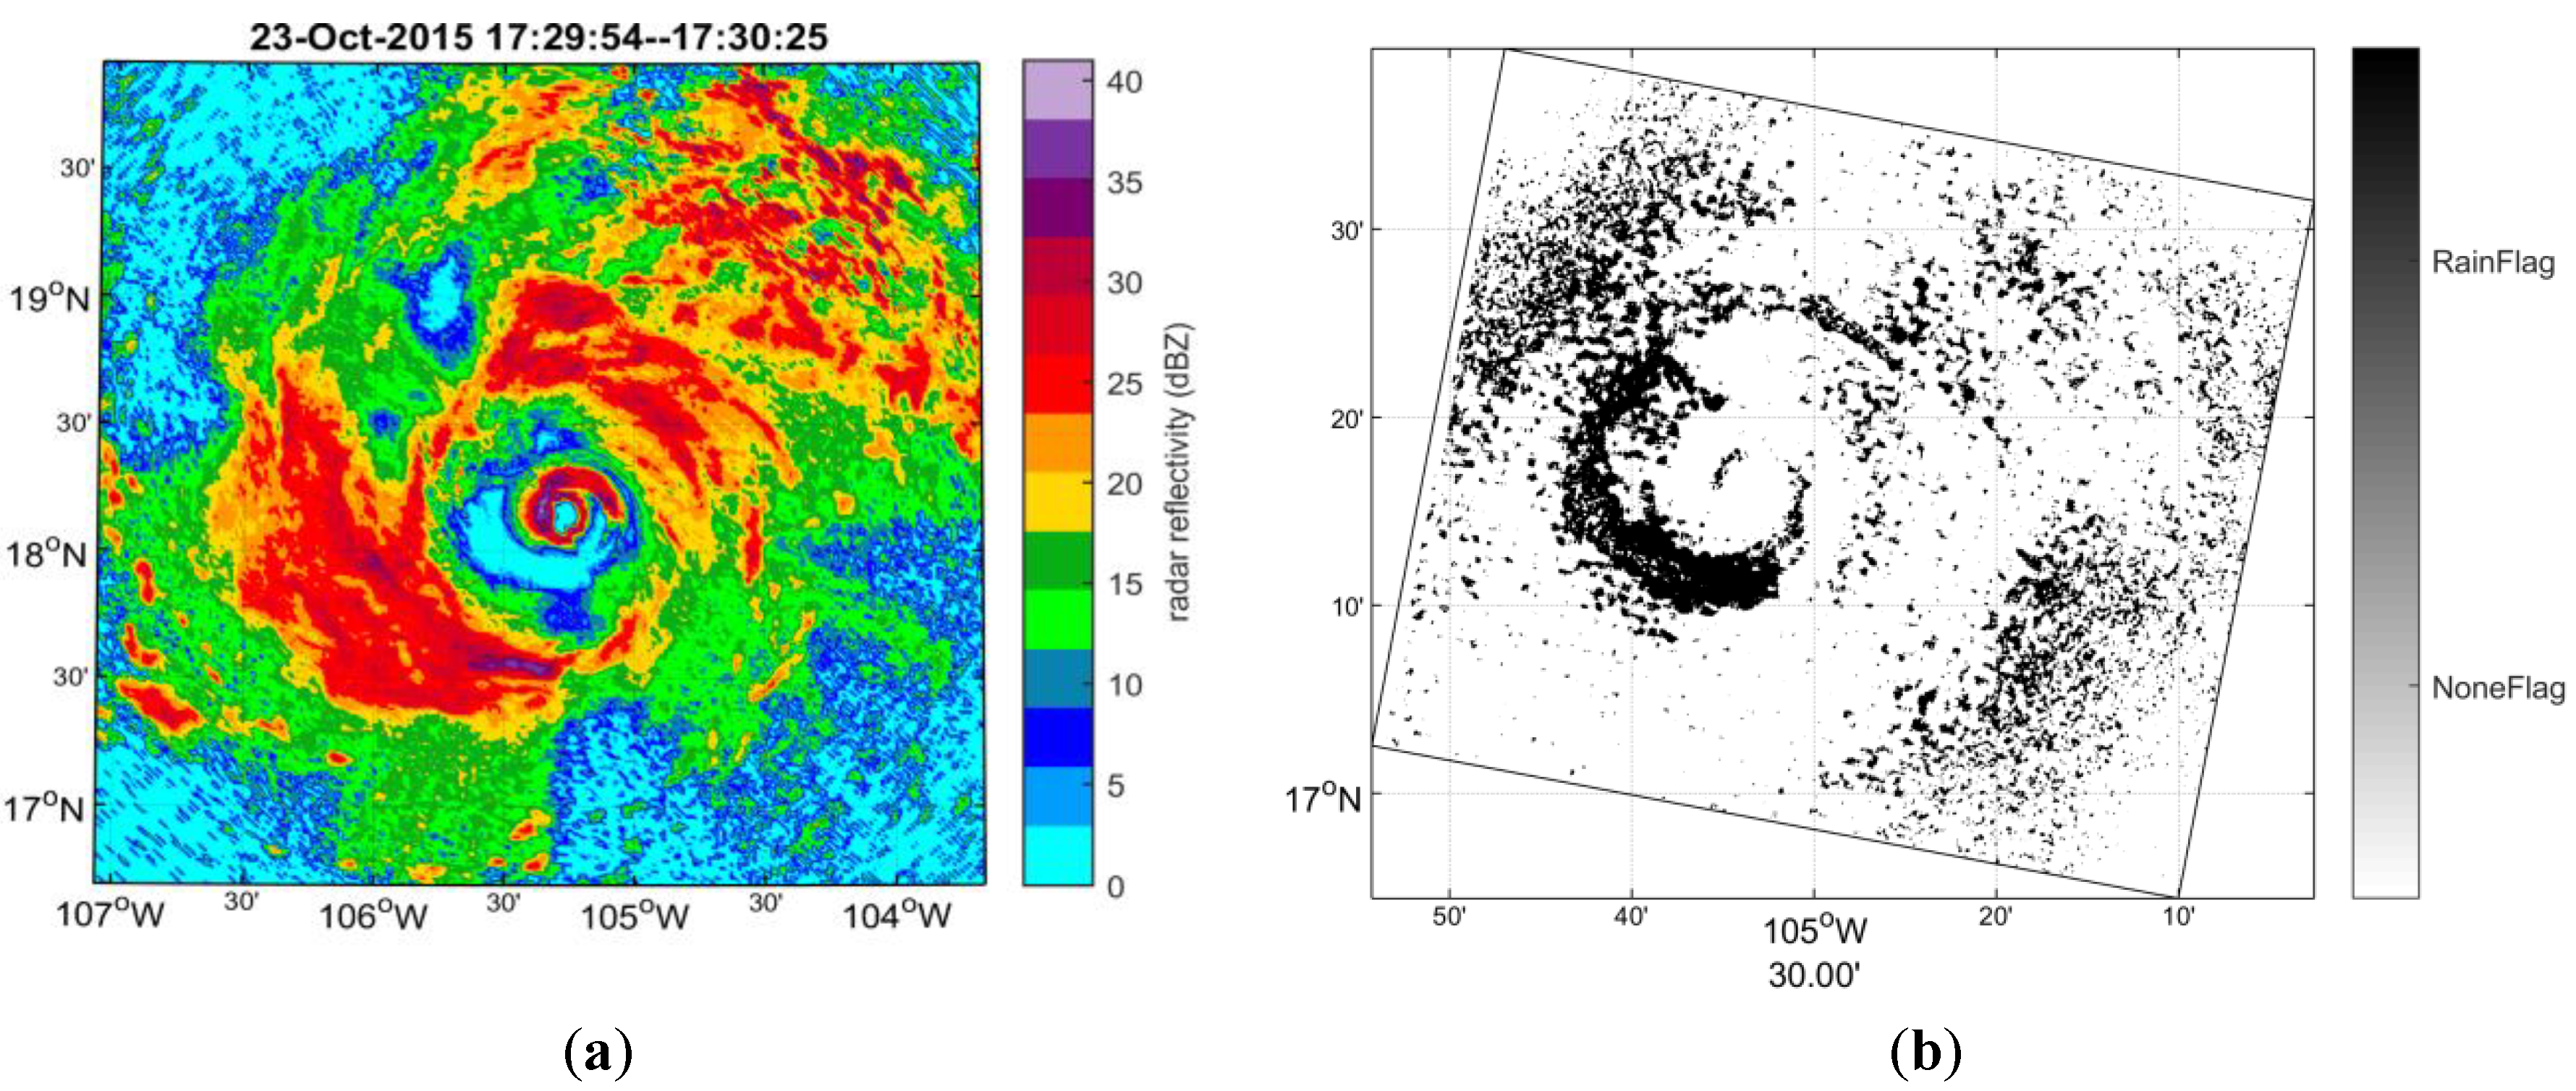
Figure 6 presents results of the high precipitation areas of Hurricane Patricia (2015). With the proposed index as a third dimension, this figure shows the 3 Dimension view of possible rain contamination in the SAR image. A clearly evident rain band stands out. This rain band is shaped like the number ‘6’, with a larger index value on the left side of the hurricane eyewall. This is consistent with the radar reflectivity measurements obtained from hurricane reconnaissance mission at 05:35PM 23 October 2015 (
Figure 7a) which shows a similar rain band pattern as revealed in
Figure 6. The radar reflectivity shown in
Figure 7a is from the lower fuselage radar mounted on the NOAA WP-3D aircraft which operated at the same C-band as RADARSAT-2 SAR (
http://www.aoml.noaa.gov/hrd/about_hrd/HRD-P3_radar.html). The WP-3D radar recognizes areas of strong precipitation by measuring radar reflectivity when flying through hurricanes. In
Figure 7a, the strong precipitation area is located at the hurricane eyewall; with another strong precipitation area ~100 km away from the hurricane center and outside of the SAR image coverage. The strong precipitation close to the eyewall is in a spatial pattern of the number ‘6’.
We label the retrieved rain area by taking the absolute value of Equation (1) as an index of the quality of the SAR-retrieved wind speed. The recognized rain area is given a quality flag of 1, which indicates the
presence of strong precipitation, and other areas are given a quality flag of 0, indicating the
absence of strong precipitation.
Figure 7b shows the results of the quality flag corresponding to Hurricane Patricia as shown in
Figure 6.
Figure 7b is a 2D view of
Figure 6, where spatial locations of possible rain areas are presented.
Figure 7b may be directly compared to
Figure 7a, as both figures show the horizontal 2D structure of rain. Despite the time differences of the two measurements (~5 h), recall that Hurricane Patricia (2015) maintains very strong intensity with relatively steady state during 12:00 and 06:00PM [
39]. Moreover, the two datasets show the consistent spatial patterns of rain in the shape of the number ‘6’.
Figure 7b misses the high radar reflectivity area to the north of the hurricane eye; this bias suggests areas for potential improvement for the proposed method, as discussed in the following section. The quality flag presents quality assessments for each grid cell in a SAR image indicating possible contamination by rain. This flag can be used as a reference when SAR-retrieved wind is used in operational analyses.
5. Discussion
Reliable forecasts of hurricanes depend on accurate understanding of the physical processes related to their formation and development and should be based on accurate observations. Although the hurricane modeling community claims that the basic physics are well understood [
42,
43], estimating and forecasting hurricane winds is still challenging [
44] due to the difficulty in obtaining accurate hurricane observations, especially surface winds. SAR has been proven to be capable of obtaining hurricane-force winds over the ocean surface from co-pol and cross-pol satellite measurements.
Despite the progress made on the methodology, and algorithms based on improved understanding of hurricane imaging theory and advanced SAR instruments in the past decades, the operational application of SAR-retrieved hurricane winds has still not been achieved. Many factors are at play in this situation. For example, due to the high power requirements, SAR only acquires data when ordered. Thus, temporal continuity and intervals separating data are irregular. This is different from other conventional wind observation systems, such as scatterometer, with regular revisiting periods. Another approach is Sentinel SAR, which continuously acquires images in the globally pre-defined areas. Numerical models could benefit by assimilating these high resolution SAR time series. However, hurricanes don’t necessarily occur in these pre-defined areas, and particular data analysis and assimilation schemes are needed to enable these temporally irregular SAR observations to help hurricane forecasting. Meanwhile, SAR’s capability to provide detailed wind structure within the hurricane core makes it unique for capturing high frequency wind variations, such as strong wind shear, hurricane-related atmospheric boundary layer rolls etc. [
5]. Abrupt variations of wind speed can happen on small spatial scales due to turbulence etc., which are important for hurricane-related disaster assessment, risk management, insurance industries etc. Considering these advantages and potential applications of SAR hurricane winds, it is of urgency to introduce these data into operational applications. Such methodology has been shown to be useful [
45] to improve the track and intensity forecasting of Hurricane Isabel (2003) when SAR-retrieved hurricane wind vectors were assimilated into a numerical weather prediction model.
In this paper, we developed a methodology to assess the quality of SAR-retrieved wind speed based on two different modes of SAR observations. We demonstrated a capability to label poor-quality wind retrievals where the two observation modes are inconsistent. The capability of SAR to recognize strong precipitation areas in hurricanes is important, since it will not only lessen the dependence on external measurements to obtain the corresponding information, but also presents a useful tool for assessment of the quality of SAR-retrieved winds, in each wind cell. These differences in the rain effect on SAR-retrieved wind speeds under co-pol and cross-pol measurements are due to the different contributions of rain on the SAR Bragg-scattering and volume scattering mechanisms. Although cross-pol is relatively weakly affected by rain, as compared to co-pol, the rain bias on wind speed is still visible (
Figure 9a). Thus, the difference in wind speeds retrieved from co-pol and cross-pol can be linked to non-wind contributions. For hurricanes, this non-wind contribution is mostly due to the contamination of heavy precipitation. Therefore, the methodology provides assessments of the validity of SAR-retrieved wind speed, and can be used as a quality index for the SAR wind product. To the best of our knowledge, this is the first time that a quality flag has been applied to SAR-retrieved wind speed, which we hope will be helpful for the operational application of SAR wind products. The proposed methodology is motivated by the quality flag for scatterometer wind products, where the product quality flag is based on various measurements from different antenna [
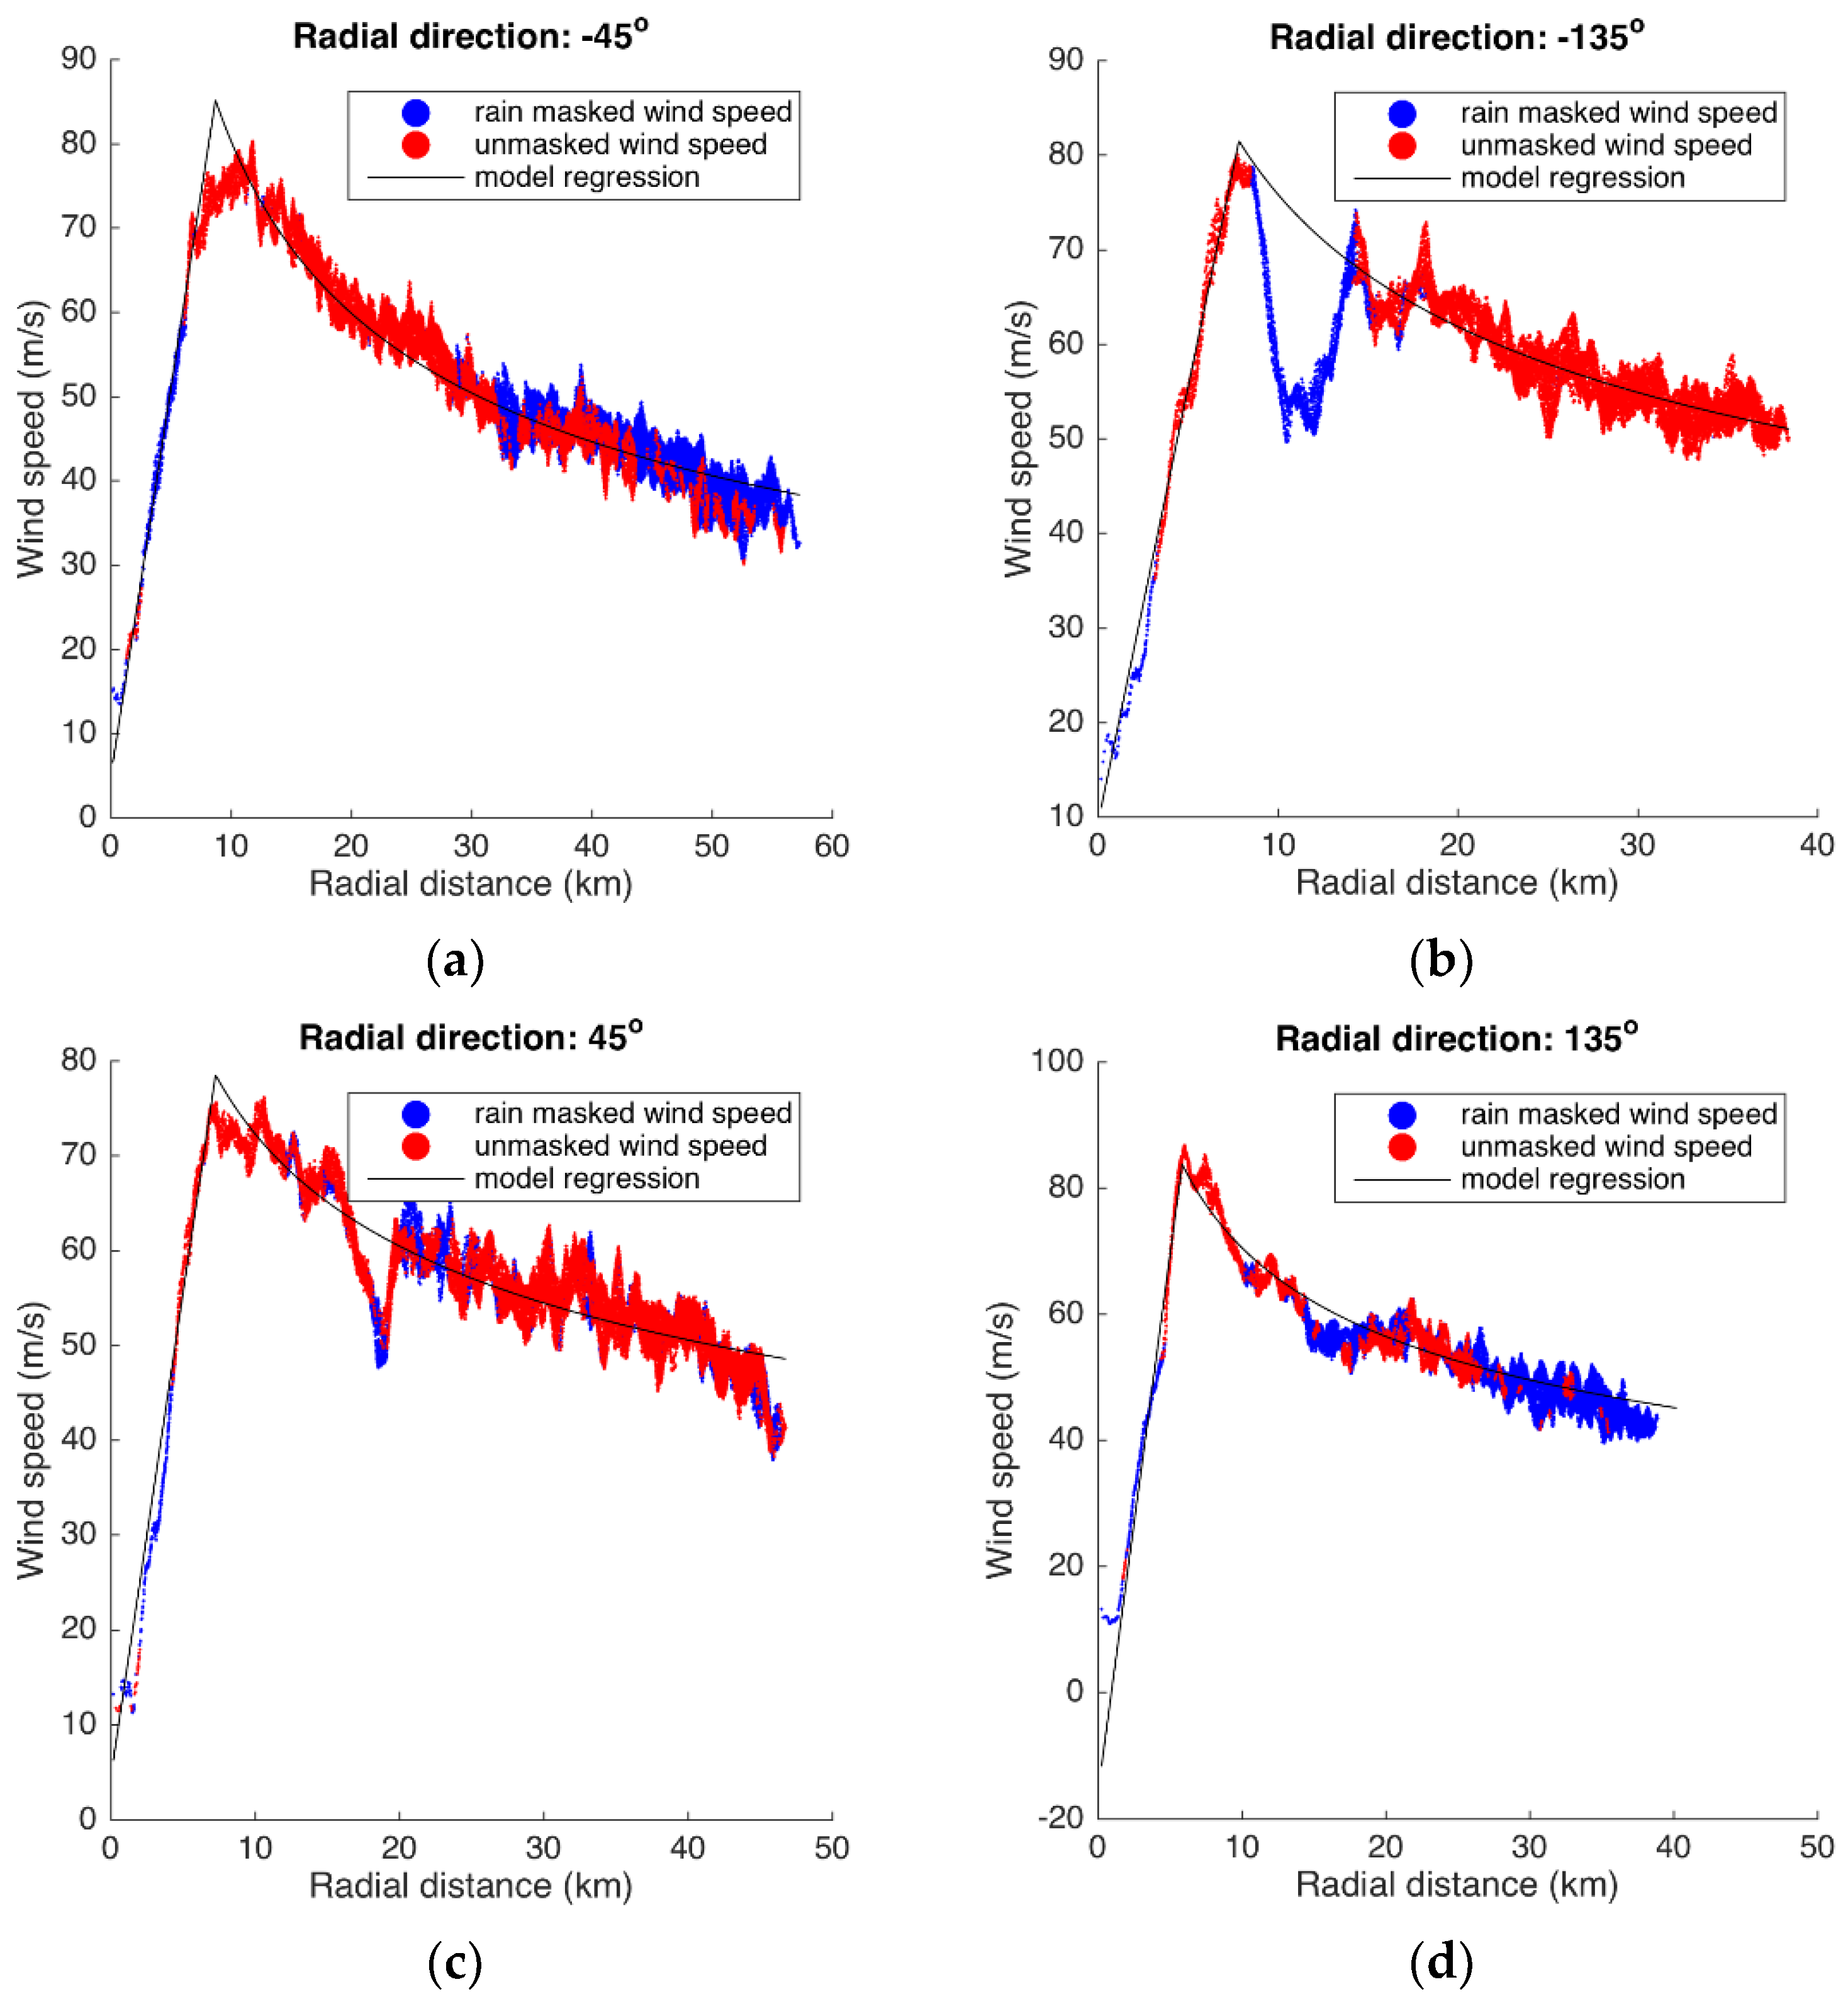
24], comparable to the different polarizations of SAR dual-pol measurements that are applied here. Scatterometer data flagged as poor-quality are often eliminated from wind estimation. For the specific processes considered here, i.e., hurricanes, a dynamically consistent wind profile along the radial direction is adopted to rebuild the wind field for the rain-contaminated area, providing a tool for wind correction for poor quality SAR wind data. This methodology takes advantage of the particular wind structure of hurricanes, which is a robust physical mechanism for hurricanes. Such methodology has been successfully adopted for deriving hurricane wind direction information from co-pol SAR [
10], for removing the speed ambiguity problem for high wind retrieval from co-pol SAR [
16], and for rebuilding the full wind field of SAR images that only partly cover hurricanes [
46].
Optimal performance of the proposed quality index depends on the accuracy of GMFs for wind retrieval from co-pol and cross-pol SAR measurements. With continued advancement in our understanding of the air-sea boundary layer physics underlying hurricanes, and more comprehensive collocated datasets for SAR measurements and wind vectors, the related SAR wind GMFs are expected to continuously improve. Thus, the quality of the proposed SAR winds index will be improved accordingly. The hurricane wind profile model along the radial direction adopted here considers a single eyewall hurricane only. For double or triple eyewall hurricanes, a different model would be developed and applied to represent the radial wind profile. SAR may be used to discriminate the unique multiple-eyewall structure based on its high-resolution imaging capability as shown in Reference [
4]. Our proposed method will benefit from future improvement of parametric hurricane models for improved wind correction of rain-contaminated areas. The present study assumes consistent radar returns from co-pol and cross-pol SAR measurements induced by the wind to recognize non-wind-induced features by examining the inconsistent radar returns in the SAR measurements of the two different polarizations. Even though the concept introduced here does not rely on the GMF itself, the methodology and performance of the outcome would be affected by the accuracy of GMFs. Therefore, future advancement in the development of GMFs will also be beneficial. By including hurricane images with various spatial structures and at different stages, it will be possible to build a generalized dataset, which can be used to optimize the concept and methodology into broad hurricane conditions, and therefore provide improved, more robust accuracy assessments.
The threshold value of 0.5 dB was chosen based on comparisons between wind differences from two measurements of SAR and the SFMR rain rate. Our study shows this threshold value corresponds to rain rates higher than 5 mm/h in high wind areas, and 2–3 mm/h in moderately high wind speed conditions. The index has increased sensitivity at lower wind speeds. This confirms the decreased contamination of rain on radar backscattered signals as revealed by
Figure 1. The threshold value is also based on current state of radiometric calibration accuracy of this SAR instrument, and applies to most of the current SAR instruments. Future SAR sensors might be able to achieve higher performance, thus with more accurate GMFs for wind retrieval, a smaller threshold value might be achieved. For hurricanes, the 0.5 dB threshold value should remain valid to detect rain areas, since rain is usually heavy in hurricanes.
Figure 5b and
Figure 6 present the relationship of the rain-induced NRCS difference in regard to the rain rates; therefore, a formula for rain rate retrieval based on SAR imagery seems possible in the future. In order to achieve this goal, a comprehensive dataset needs to be built with SAR measurements and collocated simultaneous rain information. By recognizing the complicated processes related to rain modulation of the ocean surface roughness, and the fact that the sensitivity of the proposed quality index changes under different wind speeds, this may lead to a multi-factor non-linear relationship.
Despite decades of efforts in improved monitoring of hurricane core structures, methods for high resolution wind measurements are limited. The hurricane hunter radar reconnaissance missions conducted by NHC NOAA provide valuable but limited data in a temporally and spatially changing coordinate. Synthetic aperture radar, which is suitable for conducting high spatial resolution hurricane monitoring, is capable of filling this gap. By conducting simultaneous wind measurements over hurricanes, SAR captures fine-scale wind features within hurricanes. The comparison of SAR wind to in situ measurements of high wind speeds is challenging. The time difference of the measurements could be critical for highly dynamical hurricane processes. Future studies may consider developing an enhanced dataset by pairing multiple SAR images with the collocated flight/buoy measurements at SAR observation times. With more SAR platforms going into orbit, SAR-derived winds are expected to play a key role in future hurricane prediction systems.


