Seasonal Variations in the Flow of Land-Terminating Glaciers in Central-West Greenland Using Sentinel-1 Imagery


Abstract
:
1. Introduction
2. Study Area
3. Data and Methods
4. Results and Discussion
5. Conclusions
Author Contributions
Funding
Acknowledgments
Conflicts of Interest
References
- Shepherd, A.; Ivins, E.R.; Geruo, A.; Barletta, V.R.; Bentley, M.J.; Bettadpur, S.; Briggs, K.H.; Bromwich, D.H.; Forsberg, R.; Galin, N.; et al. A Reconciled Estimate of Ice-Sheet Mass Balance. Science 2012, 338, 1183–1189. [Google Scholar] [CrossRef] [PubMed] [Green Version]
- McMillan, M.; Leeson, A.; Shepherd, A.; Briggs, K.; Armitage, T.W.K.; Hogg, A.; Munneke, P.K.; van den Broeke, M.; Noël, B.; Berg, W.J.; et al. A high resolution record of Greenland mass balance. Geophys. Res. Lett. 2016, 43, 1–9. [Google Scholar] [CrossRef]
- Enderlin, E.M.; Howat, I.M.; Jeong, S.; Noh, M.-J.; van Angelen, J.H.; van den Broeke, M.R. An improved mass budget for the Greenland ice sheet. Geophys. Res. Lett. 2014, 41, 1–7. [Google Scholar] [CrossRef]
- Van den Broeke, M.; Enderlin, E.; Howat, I.; Kuipers Munneke, P.; Noël, B.; van de Berg, W.J.; van Meijgaard, E.; Wouters, B. On the recent contribution of the Greenland ice sheet to sea level change. Cryosphere 2016, 10, 1933–1946. [Google Scholar] [CrossRef] [Green Version]
- Hanna, E.; Mernild, S.H.; Cappelen, J.; Steffen, K. Recent warming in Greenland in a long-term instrumental (1881–2012) climatic context: I. Evaluation of surface air temperature records. Environ. Res. Lett. 2012, 7. [Google Scholar] [CrossRef]
- Hanna, E.; Fettweis, X.; Mernild, S.H.; Cappelen, J.; Ribergaard, M.H.; Shuman, C.A.; Steffen, K.; Wood, L.; Mote, T.L. Atmospheric and oceanic climate forcing of the exceptional Greenland ice sheet surface melt in summer 2012. Int. J. Climatol. 2014, 34, 1022–1037. [Google Scholar] [CrossRef]
- Crozier, J.; Karlstrom, L.; Yang, K. Basal control of supraglacial meltwater catchments on the Greenland Ice Sheet. Cryosphere 2018, 12, 3383–3407. [Google Scholar] [CrossRef]
- Zwally, H.J.; Abdalati, W.; Herring, T.; Larson, K.; Saba, J.; Steffen, K. Surface Melt—Induced Acceleration of Greenland Ice-Sheet Flow. Science 2002, 297, 218–223. [Google Scholar] [CrossRef] [PubMed]
- Hoffman, M.J.; Catania, G.A.; Neumann, T.A.; Andrews, L.C.; Rumrill, J.A. Links between acceleration, melting, and supraglacial lake drainage of the western Greenland Ice Sheet. J. Geophys. Res. Earth Surf. 2011, 116, 1–16. [Google Scholar] [CrossRef]
- Chu, V.W. Greenland ice sheet hydrology: A review. Prog. Phys. Geogr. 2014, 38, 19–54. [Google Scholar] [CrossRef]
- Harper, J.T.; Humphrey, N.F.; Pfeffer, W.T.; Fudge, T.; O’Neel, S. Evolution of subglacial water pressure along a glacier’s length. Ann. Glaciol. 2005, 40, 31–36. [Google Scholar] [CrossRef] [Green Version]
- Nienow, P.W.; Hubbard, A.L.; Hubbard, B.P.; Chandler, D.M.; Mair, D.W.F.; Sharp, M.J.; Willis, I.C. Hydrological controls on diurnal ice flow variability in valley glaciers. J. Geophys. Res. Earth Surf. 2005, 110, 1–11. [Google Scholar] [CrossRef]
- Andrews, L.C.; Catania, G.A.; Hoffman, M.J.; Gulley, J.D.; Lüthi, M.P.; Ryser, C.; Hawley, R.L.; Neumann, T.A. Direct observations of evolving subglacial drainage beneath the Greenland Ice Sheet. Nature 2015, 514, 80–83. [Google Scholar] [CrossRef] [PubMed]
- Bartholomew, I.D.; Nienow, P.; Mair, D.; Hubbard, A.; King, M.A.; Sole, A. Seasonal evolution of subglacial drainage and acceleration in a Greenland outlet glacier. Nat. Geosci. 2010, 3, 408–411. [Google Scholar] [CrossRef]
- Cowton, T.; Nienow, P.; Sole, A.; Wadham, J.; Lis, G.; Bartholomew, I.D.; Mair, D.; Chandler, D. Evolution of drainage system morphology at a land-terminating Greenlandic outlet glacier. J. Geophys. Res. Earth Surf. 2013, 118, 29–41. [Google Scholar] [CrossRef] [Green Version]
- Schoof, C. Ice-sheet acceleration driven by melt supply variability. Nature 2010, 468, 803–806. [Google Scholar] [CrossRef] [PubMed]
- Rignot, E.; Kanagaratnam, P. Changes in the Velocity Structure of the Greenland Ice Sheet. Science 2006, 311, 986–990. [Google Scholar] [CrossRef] [PubMed] [Green Version]
- Joughin, I.; Das, S.B.; King, M.A.; Smith, B.E.; Howat, I.M.; Moon, T. Seasonal Speedup along the Western Flank of the Greenland Ice Sheet. Science 2008, 320, 781–784. [Google Scholar] [CrossRef] [PubMed]
- Shepherd, A.; Hubbard, A.; Nienow, P.; King, M.; McMillan, M.; Joughin, I. Greenland ice sheet motion coupled with daily melting in late summer. Geophys. Res. Lett. 2009, 36, 1–4. [Google Scholar] [CrossRef]
- Sundal, A.V.; Shepherd, A.; Nienow, P.; Hanna, E.; Palmer, S.; Huybrechts, P. Melt-induced speed-up of Greenland ice sheet offset by efficient subglacial drainage. Nature 2011, 469, 521–524. [Google Scholar] [CrossRef] [PubMed]
- Palmer, S.; Shepherd, A.; Nienow, P.; Joughin, I. Seasonal speedup of the Greenland Ice Sheet linked to routing of surface water. Earth Planet. Sci. Lett. 2011, 302, 423–428. [Google Scholar] [CrossRef]
- Joughin, I.; Das, S.B.; Flowers, G.E.; Behn, M.D.; Alley, R.B.; King, M.A.; Smith, B.E.; Bamber, J.L.; Van Den Broeke, M.R.; Van Angelen, J.H. Influence of ice-sheet geometry and supraglacial lakes on seasonal ice-flow variability. Cryosphere 2013, 7, 1185–1192. [Google Scholar] [CrossRef]
- Moon, T.; Joughin, I.; Smith, B.; Broeke, M.R.; Berg, W.J.; Noël, B.; Usher, M. Distinct patterns of seasonal Greenland glacier velocity. Geophys. Res. Lett. 2014, 41, 7209–7216. [Google Scholar] [CrossRef] [PubMed] [Green Version]
- Sole, A.J.; Mair, D.W.F.; Nienow, P.W.; Bartholomew, I.D.; King, M.A.; Burke, M.J.; Joughin, I. Seasonal speedup of a Greenland marine-terminating outlet glacier forced by surface melt-induced changes in subglacial hydrology. J. Geophys. Res. Earth Surf. 2011, 116, 1–11. [Google Scholar] [CrossRef]
- Bartholomew, I.D.; Nienow, P.; Sole, A.; Mair, D.; Cowton, T.; King, M.A. Short-term variability in Greenland Ice Sheet motion forced by time-varying meltwater drainage: Implications for the relationship between subglacial drainage system behavior and ice velocity. J. Geophys. Res. Earth Surf. 2012, 117, 1–17. [Google Scholar] [CrossRef]
- Van de Wal, R.S.W.; Smeets, C.J.P.P.; Boot, W.; Stoffelen, M.; Van Kampen, R.; Doyle, S.H.; Wilhelms, F.; Van Den Broeke, M.R.; Reijmer, C.H.; Oerlemans, J.; et al. Self-regulation of ice flow varies across the ablation area in south-west Greenland. Cryosphere 2015, 9, 603–611. [Google Scholar] [CrossRef] [Green Version]
- Fitzpatrick, A.A.W.; Hubbard, A.; Joughin, I.; Quincey, D.J.; Van As, D.; Mikkelsen, A.P.B.; Doyle, S.H.; Hasholt, B.; Jones, G.A. Ice flow dynamics and surface meltwater flux at a land-terminating sector of the Greenland ice sheet. J. Glaciol. 2013, 59, 687–696. [Google Scholar] [CrossRef] [Green Version]
- Lucchitta, B.K.; Ferguson, H.M. Antarctica: Measuring glacier velocity from satellite images. Science 1986, 234, 1105–1108. [Google Scholar] [CrossRef] [PubMed]
- Dehecq, A.; Gourmelen, N.; Trouve, E. Deriving large-scale glacier velocities from a complete satellite archive: Application to the Pamir-Karakoram-Himalaya. Remote Sens. Environ. 2015, 162, 55–66. [Google Scholar] [CrossRef]
- Fahnestock, M.; Scambos, T.; Moon, T.; Gardner, A.; Haran, T.; Klinger, M. Rapid large-area mapping of ice flow using Landsat 8. Remote Sens. Environ. 2016, 185, 84–94. [Google Scholar] [CrossRef]
- Armstrong, W.H.; Anderson, R.S.; Fahnestock, M.A. Spatial Patterns of Summer Speedup on South Central Alaska Glaciers. Geophys. Res. Lett. 2017, 44, 9379–9388. [Google Scholar] [CrossRef]
- Gardner, A.S.; Moholdt, G.; Scambos, T.; Fahnstock, M.; Ligtenberg, S.; Van Den Broeke, M.; Nilsson, J. Increased West Antarctic ice discharge and East Antarctic stability over the last seven years. Cryosphere 2018, 12, 521–547. [Google Scholar] [CrossRef]
- Joughin, I.; Winebrenner, D.P.; Fahnestock, M.A. Observations of ice-sheet motion in Greenland using satellite radar interferometry. Geophys. Res. Lett. 1995, 22, 571–574. [Google Scholar] [CrossRef]
- Lucchitta, B.K.; Rosanova, C.E.; Mullins, K.F. Velocities of Pine Island Glacier, West Antarctica, from ERS-1 SAR images. Ann. Glaciol. 1995, 21, 277–283. [Google Scholar] [CrossRef] [Green Version]
- Goldstein, R.M.; Engelhardt, H.; Kamb, B.; Frolich, R.M. Satellite Radar Interferometry for Monitoring Ice Sheet Motion: Application to an Antarctic Ice Stream. Science 1993, 262, 1525–1530. [Google Scholar] [CrossRef] [PubMed]
- Rignot, E.; Velicogna, I.; Van Den Broeke, M.R.; Monaghan, A.; Lenaerts, J.T.M. Acceleration of the contribution of the Greenland and Antarctic ice sheets to sea level rise. Geophys. Res. Lett. 2011, 38, 1–5. [Google Scholar] [CrossRef]
- Joughin, I.; Smith, B.E.; Howat, I.M.; Scambos, T.; Moon, T. Greenland flow variability from ice-sheet-wide velocity mapping. J. Glaciol. 2010, 56, 415–430. [Google Scholar] [CrossRef]
- Nagler, T.; Rott, H.; Hetzenecker, M.; Wuite, J.; Potin, P. The Sentinel-1 Mission: New Opportunities for Ice Sheet Observations. Remote Sens. 2015, 7, 9371–9389. [Google Scholar] [CrossRef] [Green Version]
- Joughin, I.; Smith, B.E.; Howat, I. Greenland Ice Mapping Project: Ice Flow Velocity Variation at sub-monthly to decadal time scales. Cryosphere 2018, 12, 2211–2227. [Google Scholar] [CrossRef]
- Lemos, A.; Shepherd, A.; Mcmillan, M.; Hogg, A.E.; Hatton, E.; Joughin, I. Ice velocity of Jakobshavn Isbræ, Petermann Glacier, Nioghalvfjerdsfjorden and Zachariæ Isstrøm, 2015-2017, from Sentinel 1-a/b SAR imagery. Cryosphere 2018, 12, 2087–2097. [Google Scholar] [CrossRef]
- Bartholomew, I.D.; Nienow, P.; Sole, A.; Mair, D.; Cowton, T.; King, M.A.; Palmer, S. Seasonal variations in Greenland Ice Sheet motion: Inland extent and behaviour at higher elevations. Earth Planet. Sci. Lett. 2011, 307, 271–278. [Google Scholar] [CrossRef] [Green Version]
- Sole, A.; Nienow, P.W.; Bartholomew, I.D.; Mair, D.W.F.; Cowton, T.R.; Tedstone, A.J.; King, M.A. Winter motion mediates dynamic response of the Greenland Ice Sheet to warmer summers. Geophys. Res. Lett. 2013, 40, 3940–3944. [Google Scholar] [CrossRef] [Green Version]
- Chandler, D.M.; Wadham, J.L.; Lis, G.P.; Cowton, T.; Sole, A.; Bartholomew, I.D.; Telling, J.; Nienow, P.; Bagshaw, E.B.; Mair, D.; et al. Evolution of the subglacial drainage system beneath the Greenland Ice Sheet revealed by tracers. Nat. Geosci. 2013, 6, 195–198. [Google Scholar] [CrossRef]
- Howat, I.M.; de la Peña, S.; van Angelen, J.H.; Lenaerts, J.T.M.; van den Broeke, M.R. Brief Communication: “Expansion of meltwater lakes on the Greenland Ice Sheet”. Cryosphere 2013, 7, 201–204. [Google Scholar] [CrossRef]
- Leeson, A.A.; Shepherd, A.; Palmer, S.; Sundal, A.; Fettweis, X. Simulating the growth of supraglacial lakes at the western margin of the Greenland ice sheet. Cryosphere 2012, 6, 1077–1086. [Google Scholar] [CrossRef] [Green Version]
- Leeson, A.A.; Shepherd, A.; Sundal, A.V.; Johansson, A.M.; Selmes, N.; Briggs, K.; Hogg, A.E.; Fettweis, X. A comparison of supraglacial lake observations derived from MODIS imagery at the western margin of the Greenland ice sheet. J. Glaciol. 2013, 59, 1179–1188. [Google Scholar] [CrossRef] [Green Version]
- Leeson, A.; Shepherd, A.; Briggs, K.; Fettweis, X. Supraglacial lakes on Greenland migrate inland under warming climate. Nat. Clim. Chang. 2015, 16, 51–55. [Google Scholar] [CrossRef]
- Clason, C.C.; Mair, D.W.F.; Nienow, P.W.; Bartholomew, I.D.; Sole, A.; Palmer, S.; Schwanghart, W. Modelling the transfer of supraglacial meltwater to the bed of Leverett Glacier, Southwest Greenland. Cryosphere 2015, 9, 123–138. [Google Scholar] [CrossRef] [Green Version]
- Koziol, C.P.; Arnold, N. Modelling seasonal meltwater forcing of the velocity of land-terminating margins of the Greenland Ice Sheet. Cryosphere 2018, 12, 971–991. [Google Scholar] [CrossRef] [Green Version]
- GAMMA REMOTE SENSING. Sentinel-1 Processing with GAMMA Software. Version 1.2; GAMMA Remote Sensing AG: Gumligen, Switzerland, 2015.
- Strozzi, T.; Luckman, A.; Murray, T.; Wegmuller, U.; Werner, C.L. Glacier motion estimation using SAR offset-tracking procedures. IEEE Trans. Geosci. Remote Sens. 2002, 40, 2384–2391. [Google Scholar] [CrossRef] [Green Version]
- Pritchard, H.; Murray, T.; Luckman, A.; Strozzi, T.; Barr, S. Glacier surge dynamics of Sortebræ, east Greenland, from synthetic aperture radar feature tracking. J. Geophys. Res. 2005, 110, 1–13. [Google Scholar] [CrossRef]
- Paul, F.; Bolch, T.; Kääb, A.; Nagler, T.; Nuth, C.; Scharrer, K.; Shepherd, A.; Strozzi, T.; Ticconi, F.; Bhambri, R.; et al. The glaciers climate change initiative: Methods for creating glacier area, elevation change and velocity products. Remote Sens. Environ. 2015, 162, 408–426. [Google Scholar] [CrossRef] [Green Version]
- Howat, I.M.; Negrete, A.; Smith, B.E. The Greenland Ice Mapping Project (GIMP) land classification and surface elevation data sets. Cryosphere 2014, 8, 1509–1518. [Google Scholar] [CrossRef] [Green Version]
- Hogg, A.E.; Shepherd, A.; Cornford, S.L.; Briggs, K.H.; Gourmelen, N.; Graham, J.; Joughin, I.; Mouginot, J.; Nagler, T.; Payne, A.J.; et al. Increased ice flow in Western Palmer Land linked to ocean melting. Geophys. Res. Lett. 2017, 1–9. [Google Scholar] [CrossRef]
- Liao, H.; Meyer, F.J.; Scheuchl, B.; Mouginot, J.; Joughin, I.; Rignot, E. Ionospheric correction of InSAR data for accurate ice velocity measurement at polar regions. Remote Sens. Environ. 2018, 209, 166–180. [Google Scholar] [CrossRef]
- De Lange, R.; Luckman, A.; Murray, T. Improvement of satellite radar feature tracking for ice velocity derivation by spatial frequency filtering. IEEE Trans. Geosci. Remote Sens. 2007, 45, 2309–2318. [Google Scholar] [CrossRef]
- Morlighem, M.; Williams, C.; Rignot, E.; An, L.; Arndt, J.E.; Bamber, J.; Catania, G.; Chauché, N.; Dowdeswell, J.A.; Dorschel, B.; et al. Zinglersen IceBridge BedMachine Greenland. NASA National Snow and Ice Data Center Distributed Active Archive Center; Version 3; Boulder, Colorado, USA, 2017. [Google Scholar] [CrossRef]
- Ryser, C.; Lüthi, M.P.; Andrews, L.C.; Hoffman, M.J.; Catania, G.A.; Hawley, R.L.; Neumann, T.A.; Kristensen, S.S. Sustained high basal motion of the Greenland ice sheet revealed by borehole deformation. J. Glaciol. 2014, 60, 647–660. [Google Scholar] [CrossRef] [Green Version]
- Armstrong, W.H.; Anderson, R.S.; Allen, J.; Rajaram, H. Modeling the WorldView-derived seasonal velocity evolution of Kennicott Glacier, Alaska. J. Glaciol. 2016, 62, 763–777. [Google Scholar] [CrossRef]
- Hewitt, I.J. Seasonal changes in ice sheet motion due to melt water lubrication. Earth Planet. Sci. Lett. 2013, 371–372, 16–25. [Google Scholar] [CrossRef]


| Location | Summer Speed (m yr−1) | Winter Speed (m yr−1) | Speedup Relative to Winter (%) | Summer Velocity Peak (m yr−1) | Annual Mean Velocity (m yr−1) | Speedup Start Day | Speedup End Day | Speedup Persistence (days) | Mean Thickness (m) | Mean Slope (%) | |
|---|---|---|---|---|---|---|---|---|---|---|---|
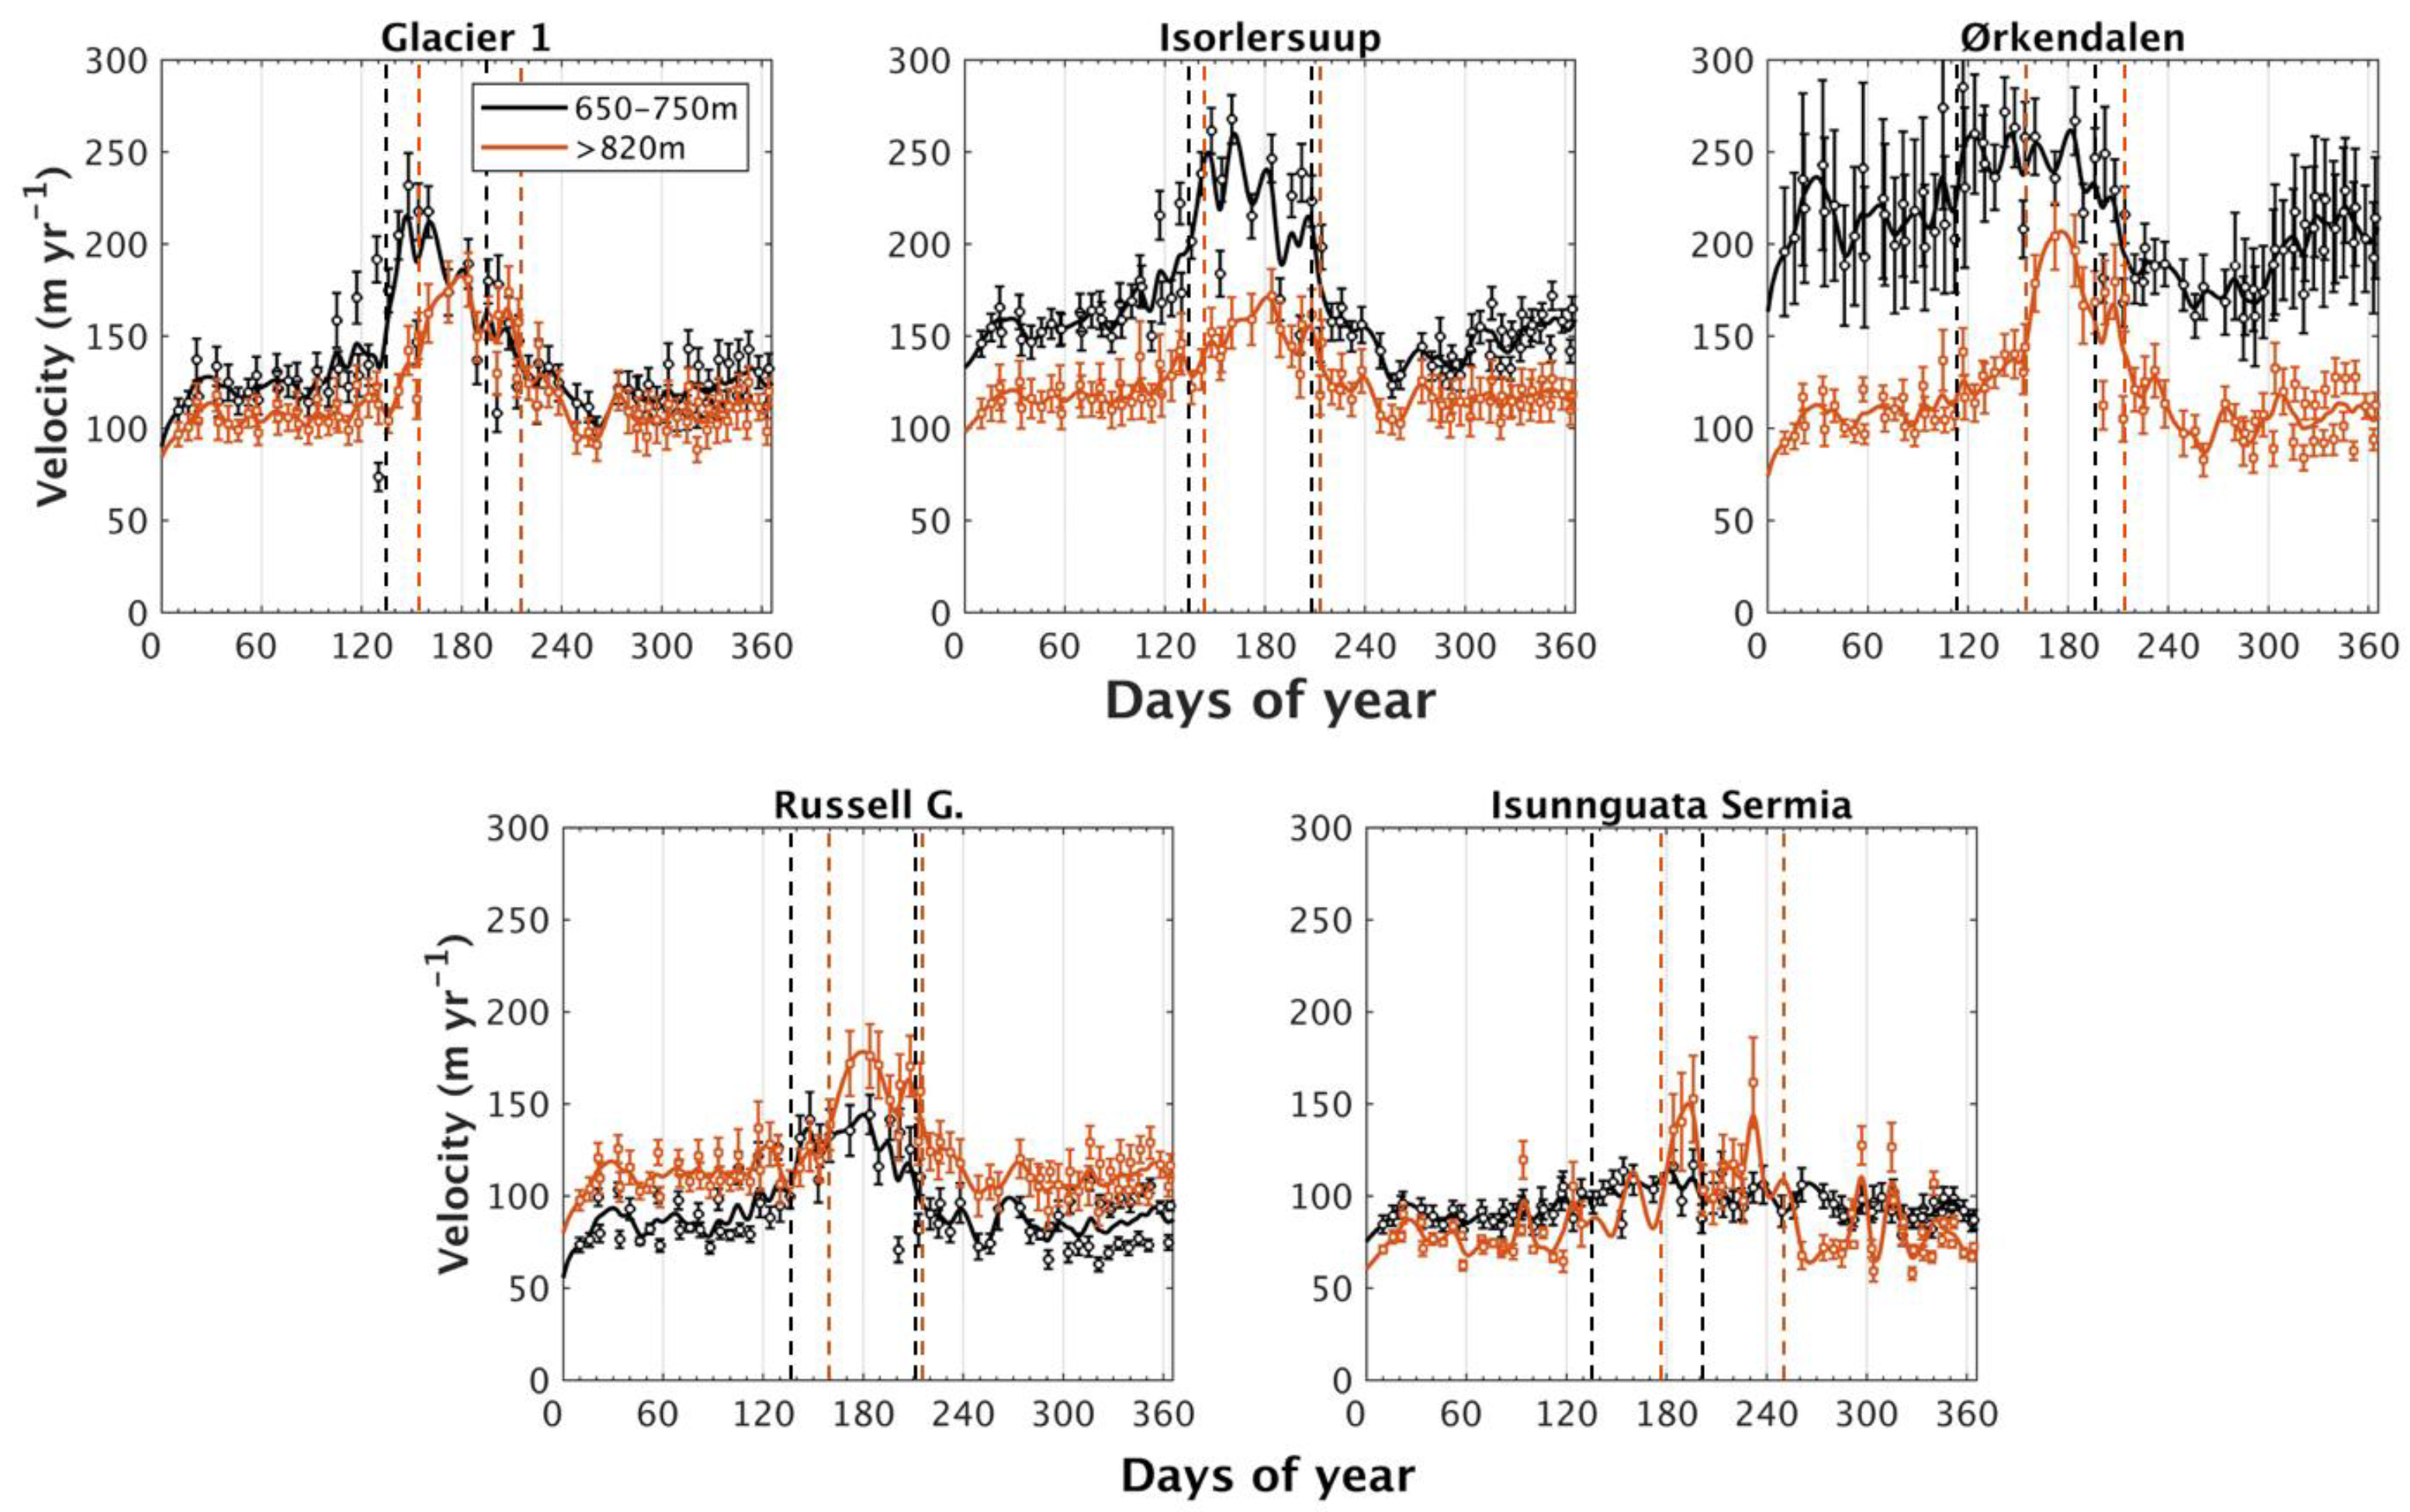
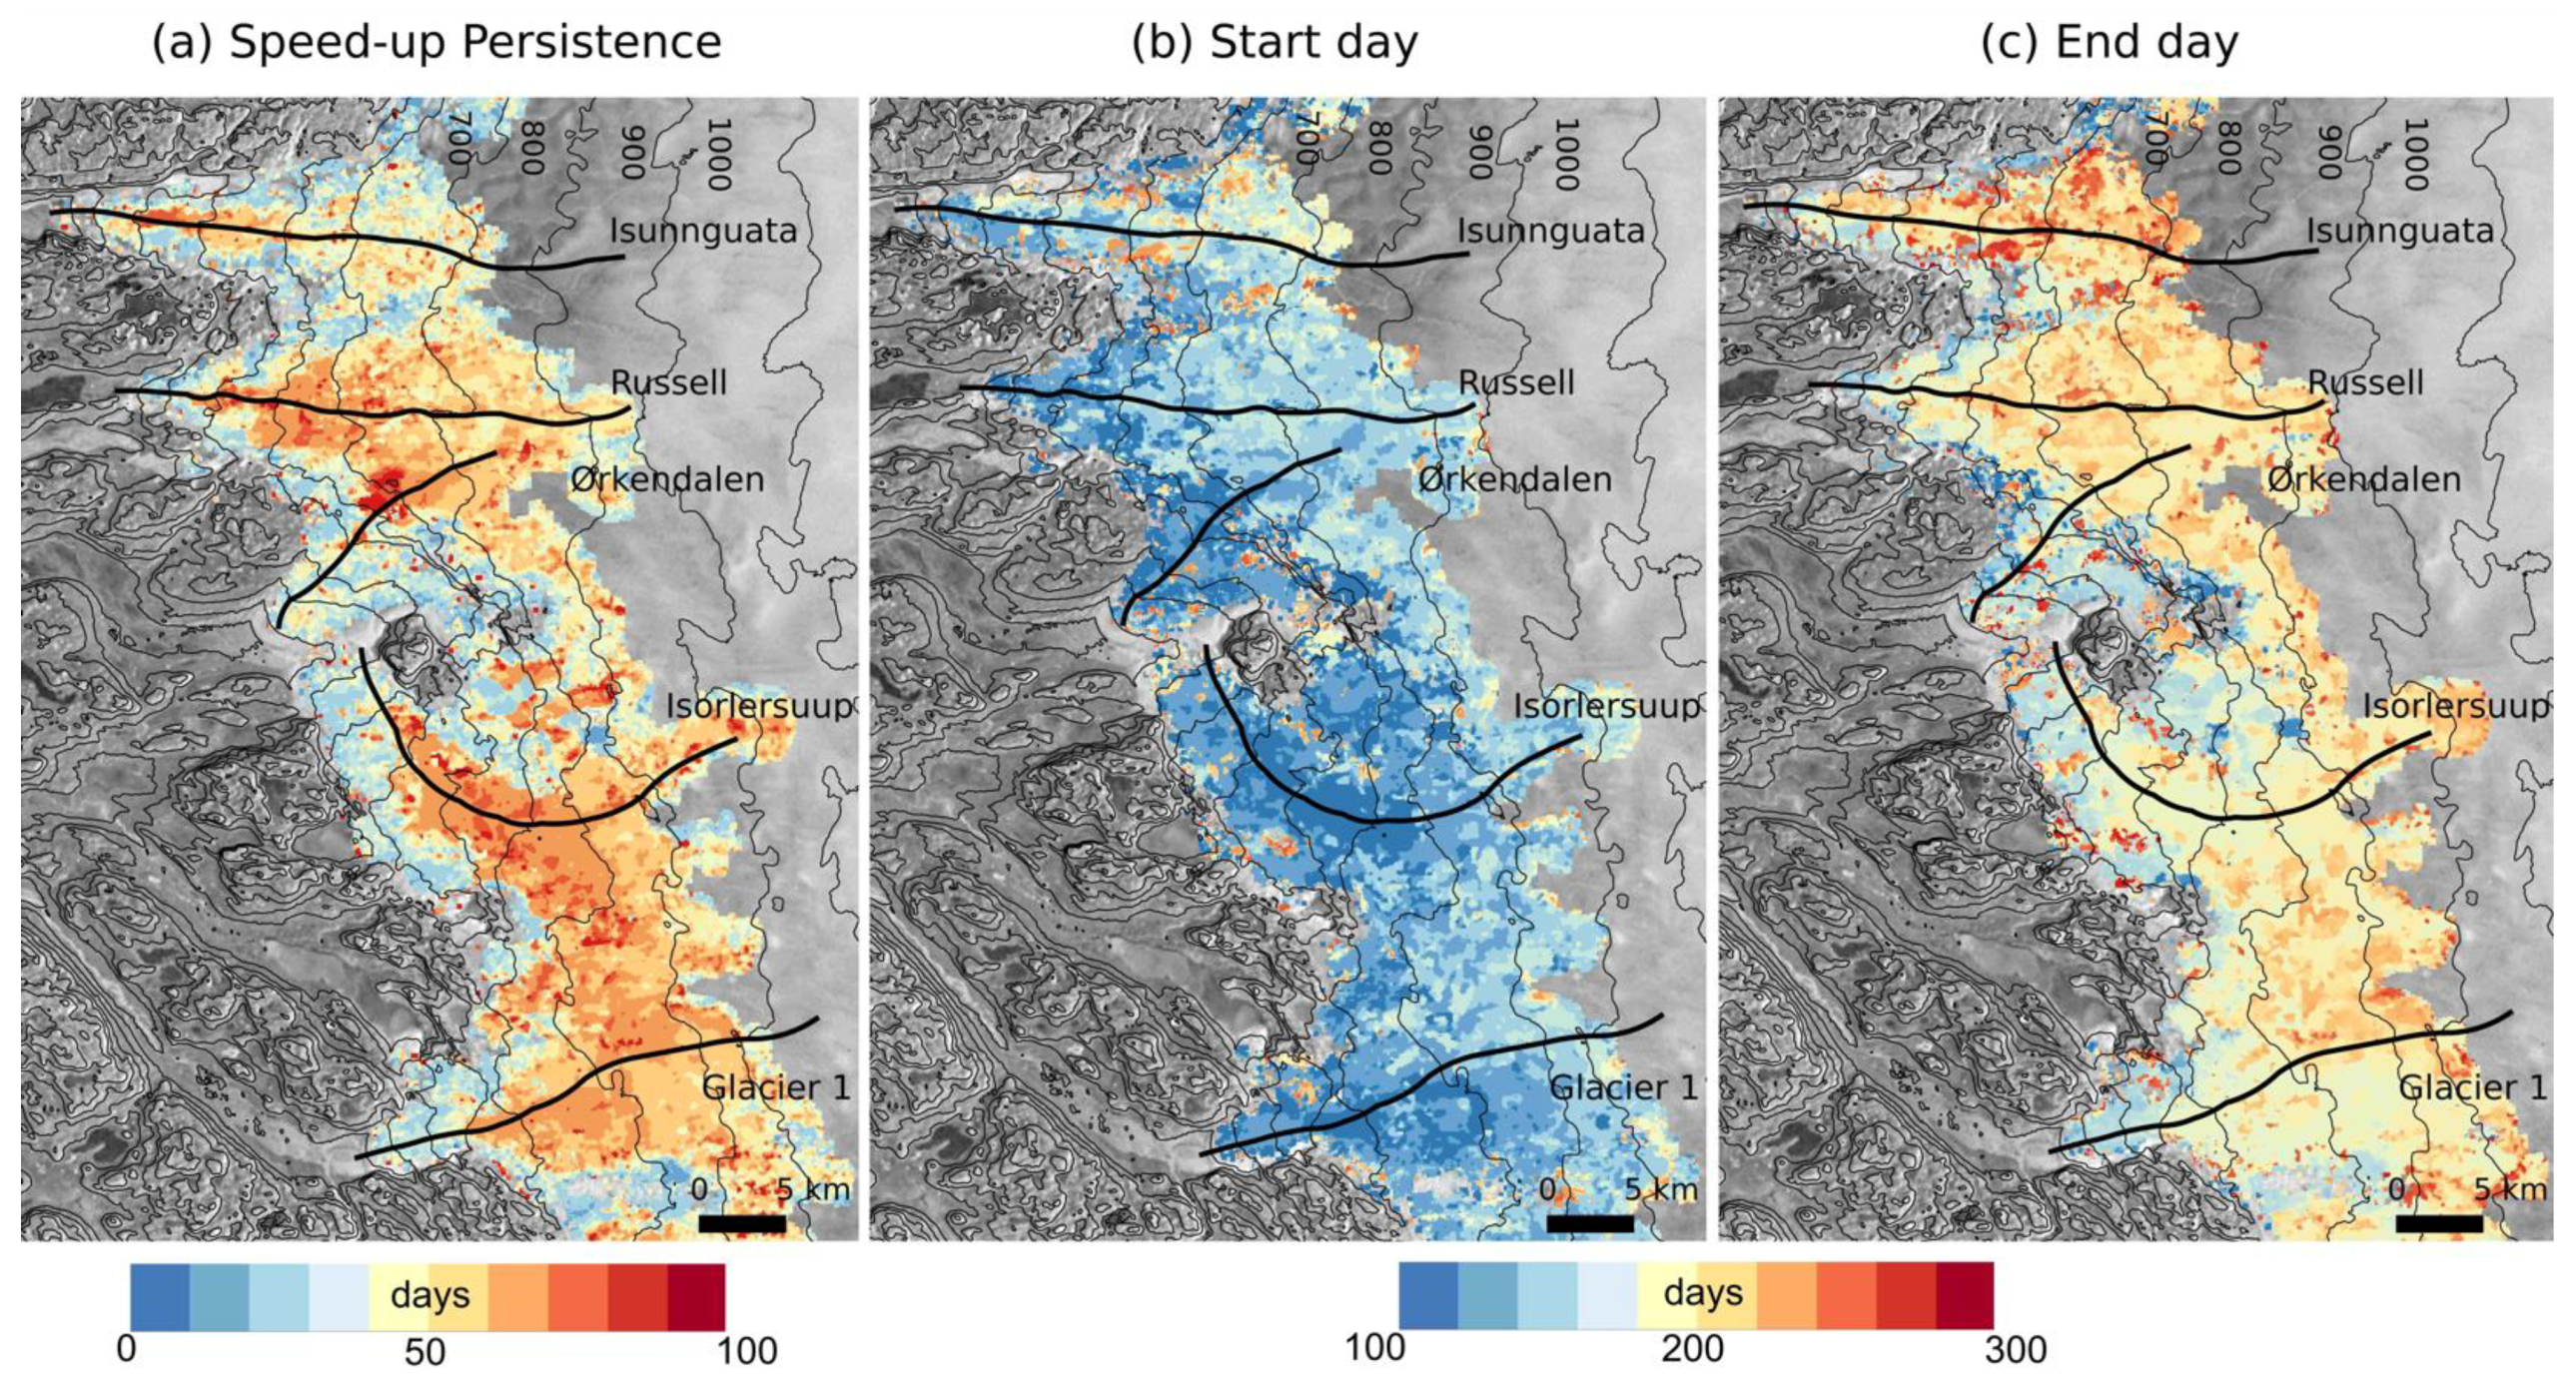
| Glacier 1 | P1 | 187 ± 13 | 125 ± 9 | 49% | 214 ± 13 | 133 ± 10 | 136 | 196 | 60 | 470 | 2.2% |
| P2 | 154 ± 18 | 109 ± 10 | 41% | 176 ± 18 | 116 ± 11 | 153 | 216 | 63 | 650 | 2.0% | |
| Isorlersuup | P1 | 220 ± 11 | 156 ± 8 | 41% | 257 ± 11 | 166 ± 9 | 134 | 209 | 75 | 516 | 2.2% |
| P2 | 148 ± 17 | 119 ± 10 | 24% | 169 ± 17 | 124 ± 11 | 143 | 212 | 69 | 612 | 1.6% | |
| Ørkendalen | P1 | 246 ± 16 | 203 ± 22 | 21% | 259 ± 16 | 212 ± 22 | 113 | 198 | 85 | 390 | 2.8% |
| P2 | 163 ± 17 | 111 ± 9 | 47% | 205 ± 17 | 118 ± 11 | 155 | 212 | 57 | 623 | 1.5% | |
| Russell G. | P1 | 121 ± 13 | 87 ± 5 | 38% | 139 ± 13 | 93 ± 7 | 137 | 211 | 74 | 559 | 2.2% |
| P2 | 156 ± 18 | 113 ± 10 | 38% | 177 ± 18 | 118 ± 11 | 160 | 215 | 55 | 692 | 1.9% | |
| Isunnguata S. | P1 | 103 ± 9 | 93 ± 6 | 11% | 112 ± 9 | 95 ± 7 | 136 | 201 | 64 | 615 | 2.1% |
| P2 | 121 ± 21 | 79 ± 5 | 53% | 145 ± 21 | 87 ± 7 | 178 | 250 | 71 | 802 | 1.5% | |
| Sector | P1 | 175 ± 28 | 132 ± 26 | 32% | 196 ± 28 | 140 ± 28 | 131 | 203 | 72 | 510 | 2.3% |
| P2 | 148 ± 41 | 106 ± 20 | 40% | 174 ± 41 | 113 ± 23 | 158 | 221 | 63 | 676 | 1.7% | |
© 2018 by the authors. Licensee MDPI, Basel, Switzerland. This article is an open access article distributed under the terms and conditions of the Creative Commons Attribution (CC BY) license (http://creativecommons.org/licenses/by/4.0/).
Share and Cite
Lemos, A.; Shepherd, A.; McMillan, M.; Hogg, A.E. Seasonal Variations in the Flow of Land-Terminating Glaciers in Central-West Greenland Using Sentinel-1 Imagery. Remote Sens. 2018, 10, 1878. https://doi.org/10.3390/rs10121878
Lemos A, Shepherd A, McMillan M, Hogg AE. Seasonal Variations in the Flow of Land-Terminating Glaciers in Central-West Greenland Using Sentinel-1 Imagery. Remote Sensing. 2018; 10(12):1878. https://doi.org/10.3390/rs10121878
Chicago/Turabian StyleLemos, Adriano, Andrew Shepherd, Malcolm McMillan, and Anna E. Hogg. 2018. "Seasonal Variations in the Flow of Land-Terminating Glaciers in Central-West Greenland Using Sentinel-1 Imagery" Remote Sensing 10, no. 12: 1878. https://doi.org/10.3390/rs10121878