Abstract
A digital surface model (DSM) provides the geometry and structure of an urban environment with buildings being the most prominent objects in it. Built-up areas change with time due to the rapid expansion of cities. New buildings are being built, existing ones are expanded, and old buildings are torn down. As a result, 3D surface models can increase the understanding and explanation of complex urban scenarios. They are very useful in numerous fields of remote sensing applications, in tasks related to 3D reconstruction and city modeling, planning, visualization, disaster management, navigation, and decision-making, among others. DSMs are typically derived from various acquisition techniques, like photogrammetry, laser scanning, or synthetic aperture radar (SAR). The generation of DSMs from very high resolution optical stereo satellite imagery leads to high resolution DSMs which often suffer from mismatches, missing values, or blunders, resulting in coarse building shape representation. To overcome these problems, we propose a method for 3D surface model generation with refined building shapes to level of detail (LoD) 2 from stereo half-meter resolution satellite DSMs using deep learning techniques. Mainly, we train a conditional generative adversarial network (cGAN) with an objective function based on least square residuals to generate an accurate LoD2-like DSM with enhanced 3D object shapes directly from the noisy stereo DSM input. In addition, to achieve close to LoD2 shapes of buildings, we introduce a new approach to generate an artificial DSM with accurate and realistic building geometries from city geography markup language (CityGML) data, on which we later perform a training of the proposed cGAN architecture. The experimental results demonstrate the strong potential to create large-scale remote sensing elevation models where the buildings exhibit better-quality shapes and roof forms than just using the matching process. Moreover, the developed model is successfully applied to a different city that is unseen during the training to show its generalization capacity.
1. Introduction
Worldwide urbanization has transformed vast farmlands and forests into urban landscapes, resulting in the appearance of new houses and infrastructures. Due to these rapid changes, accurate and timely updated cadastral 3D building model data are not often available, but are very valuable for urban planning and city management, navigation, virtual environment generation, disaster analysis, tourism, civil engineering, etc. The methodologies for realizing these applications are mainly based on 3D elevation information. Therefore, the automatic generation of 3D elevation models with accurate building shapes, including the recovery of disturbed boundaries and robust reconstruction of precise rooftop geometries, is in demand.
Remote sensing technology provides several ways to measure the 3D urban morphology. Conventional ground surveying, stereo airborne or satellite photogrammetry, interferometric synthetic aperture radar (InSAR), and light detection and ranging (LIDAR) are the main data sources used to obtain high-resolution elevation information [1]. The main advantage of digital surface models (DSMs) generated using ground surveying and LIDAR is their good quality and detailed object representations. However, their production is costly and time consuming, and covers relatively small areas compared with images produced with spaceborne remote sensing [2]. SAR imagery is operational in all seasons under different weather conditions. Nevertheless it has a side-looking sensor principle that is not so useful for building recognition and reconstruction compared with optical imagery. The DSMs generated from spaceborne data using stereo image matching nowadays show relatively high spatial resolution and wide coverage which is preferable for large-scale remote sensing applications, especially when using sub-meter multi-stereo data from, e.g., World-View or Pleiades satellites. However, due to automatic DSM generation, some unwanted failures in building geometries may occur which influence their later reconstruction and modeling. These originate from applied interpolation techniques, temporal changes, or matching errors. For example, low-textured, homogenous, or shadowed areas caused by a combination of sun to satellite viewing geometries and surface properties often lead to blunders or not-sharp rooftop contours, as the automatic matching of the homologous points fails. Specific radiometric effects, such as spilling and saturation on roof planes due to the acquisition geometry, the surface type, or the inclination, may also lead to local blunders [3]. Moreover, densely located buildings in city areas cause uncertainty on building edges. As a result, the applied interpolation techniques lead to low sharpness. Another very common problem in urban areas is the occurrence of occlusions due to tall buildings or trees; these also depend on the acquisition viewing angles. Hence, these DSMs need to be refined either manually or automatically to make them more useful for remote sensing applications.
As manual refinement is costly and time consuming, there has been a considerable amount of research done regarding automatic 3D surface model refinement. Several researchers tried to enhance DSMs by removing inconsistency errors. Shi and Tian [4] attempted to overcome the noise and outliers within the DSMs by incorporating both bi-linear and the bi-cubic interpolation methods. Yang et al. [5] proposed to improve the small-scale DSMs by optimizing the interpolation parameters using independent validation data with higher accuracy and semi-quantitative analysis of DSM derivatives. In the work of Karkee et al. [6], the improved DSM was generated by the fusion of two independent DSMs by employing the relative elimination of errors followed by height summation. Moreover, DSM denoising through the application of different filters is also a very common technique for removing the errors [7,8].
With the significant advances in machine learning and the development of deep convolutional neural networks (CNNs), which nowadays provide the best solutions for many computer vision tasks, like classification, localization, detection, and segmentation, it became possible to power the applications for self-driving cars, robotics, drones, security, and medical diagnoses. Along with their ability to process spectral, textual, and acoustic data, they also can operate on depth images, not only to perform object detection or classification but even to reconstruct 2D depth maps from one or several spectral images. Laina et al. [9] estimated the depth image from a single RGB image by employing the fully convolutional Network (FCN) architecture with feature map up-sampling within the network. A set loss and two-streamed CNN that fuses predictions of depth and depth gradients into an accurate and detailed depth map was investigated by Li et al. [10].
Recently, a further class of neural network, generative adversarial networks (GANs), was developed, and it immediately gained a lot of attention in the field of machine learning. An innovative algorithm was proposed to solve the giant problem of adapting two domains, such as image generation from descriptions [11,12], high-resolution image generation from low-resolution images [13], video generation [14], anomaly detection in medicine [15], etc. GANs are even able to generate 3D objects out of probabilistic space or 2D spectral or depth images [16,17,18].
The ability of CNN-based approaches to reconstruct depth images is strongly correlated with our area of interest. As a result, in this paper, we analyze the potential of conditional generative adversarial networks (cGANs) to reconstruct depth images from a bird’s-eye view perspective. Depth images, in our case, represent the urban 3D structure with elevation information in the form of continuous values. We aim to design a cGAN architecture based on the approach of Isola et al. [19] that takes a noisy stereo DSM as input and produces an improved DSM with refined building shapes. We perform network training on two different kinds of ground truth data, level of detail (LoD)2-DSM and LIDAR-DSM, where the LoD2-DSM is the one artificially generated from city geography markup language (CityGML) data containing only 3D building model information. It should be mentioned that although the so-called LoD2-DSM does not contain any above ground objects except buildings, it is still useful for many remote sensing applications, like navigation, 3D city modeling, and cadastral database updates.
The remainder of the paper is arranged as follows. In Section 2, work related to 3D urban structure refinement from different data sources is summarized, together with recently developed approaches for continuous data reconstruction using deep learning techniques. The background of GANs, the used objective functions, and details of our deep network architecture are described in Section 3. Furthermore, the description of necessary ground truth data generation, which is required for the training process, is presented in this section. In Section 4, we introduce the dataset and present implementation details and training strategies. The experimental results for two different datasets applying the proposed deep network architecture, together with qualitative and quantitative evaluations are shown and discussed in Section 5. Section 6 concludes the paper.
2. Related Work
Over time, the methodologies used for DSM generation have experienced a dramatic improvement: from coarse to high-resolution elevation model generation with detailed building shapes if high resolution data is used. However, despite their high resolution, they can still feature many mismatches and noise due to perspective differences, occlusions by dense and complex building structures, or stereo matching errors during DSMs generation. Therefore, post-processing steps on DSM refinement are highly required and are a hot topic in current research.
In the literature, very few of the proposed approaches consider the stereo DSM enhancement of urban areas. Some works proposed the computation of the parallax between two orthoimages and used the displacement of the best match point to compute elevation errors in the DSMs [20,21]. Though the proposed techniques work fine in rural regions, they are inapplicable when surface discontinuities exist. Other approaches investigated DSM by refining using filtering techniques, such as a Gaussian noise removal filter [22] or geostatistical filter [23]. However, the smoothness effect, due to the filtering, dramatically influences the steepness of the building walls. Sirmacek et al. [24] proposed to enhance the building shapes by, firstly, extracting the possible building segments through thresholding the normalized digital surface model (nDSM). In the next step in this process, building shapes are detected by applying the box-fitting algorithm. Finally, the building walls in the DSM are sharpened using the information from detected building shapes, and the noise in building rooftops is smoothed. This methodology is limited to the detection and enhancement of rectangular buildings which is not the case for most of the complex building shapes in urban areas. In a following study, Sirmacek et al. [25] improved the shape detection of complex buildings by fitting a chain of active shape models to the input data. Additionally, in this study, the Canny edge information from spectral images was considered to fit rectangular boxes. Although they achieved better results in terms of building footprints compared to [24], only one single height value was assigned to each building shape. Another approach that deals with outliers, mismatches, and erroneously detected occlusions in DSM was proposed by Krauß and Reinartz [26]. It is based on an segmentation algorithm. The segmentation from the stereo image is transferred to the DSM and following a statistical analysis and spectral information, a coarse object detection and classification is performed. Afterwards, using this information the DSM is refined.
In recent years, as deep learning techniques have emerged, new approaches for remote sensing image processing have achieved significant breakthroughs. However, most of these approaches work with spectral imagery, while depth image processing has still not been well investigated. In computer vision, on the other hand, there have already been several attempts to generate, restore, and enhance depth images using CNNs. Eigen et al. [27] and Eigen and Fergus [28] performed coarse-to-fine learning of two and three convolutional networks in stages, respectively, to transform a monocular color input image into a geometrically meaningful output image at a higher resolution. Liu et al. [29] explored the strength of a deep structured CNN which learns the unary and pairwise potentials of a continuous conditional random field (CRF) which enforces local consistency in the output image. In contrast to standard methods, it inputs an image consisting of small regions of homogeneous pixels to the network. The method can also work with single pixels, but it is computationally inefficient. The method delivers predictions with sharper transitions compared to previous studies, but with a mosaic appearance. Zhu and Ma [30] trained a model for depth estimation consisting of two parts: a pre-trained VGG [31] and two fully connected layers of their own design. This network only allows a gradient descent optimization algorithm for five convolutional layers starting from the end. Although these methods are able to generate depth images relatively close to the ground truth, the sharpness of the object edges and their appearances in the image are very coarse. Jeon and Lee [32] aimed to solve a problem similar to ours regarding depth image enhancement. They explored a multi-scale Laplacian pyramid-based neural network and structure preserving loss functions to progressively reduce the noise and holes from coarse to fine scales.
The development of GANs [33] helped to achieved impressive results in high-quality image generation tasks. There have already been many studies on the mapping of images between different domains, such as black and white images into color, or satellite images to maps [19]. Recently, some works proposed the learning of object representations in three-dimensional space based on different variations of GAN architecture. These methods typically use autoencoder networks [34,35] combined with a generative adversarial approach to generate 3D objects. Wu et al. [16] modeled 3D shapes from a random input vector by using a variant of GAN with volumetric convolutions. Although the algorithm produces 3D objects with high quality and fine-grained details, the final grid has limited resolution. Rezende et al. [36] introduced a general framework to learn 3D structures from 2D observations with a 3D-2D projection mechanism. However, the proposed projection mechanism minimizes the discrepancy between the observed mask and the reprojected predictions either through a learned or fixed reprojection function. Recently, Yang et al. [18] proposed an automatic completion of 3D shapes from a single depth image using GANs. The architecture combines cGANs [37] with autoencoders to generate accurate 3D structures of objects. The method learns both local geometric details and the global 3D context of the scene to infer occluded objects from the scene layout. However, designing a network that can efficiently learn both components is a non-trivial task [38]. All of these studies learn a single object reconstruction based on existing libraries of individual objects and are able to produce a probability for occupancy at each discrete position in the 3D voxel space. Yet, the computational and spatial complexities of such voxelized representations significantly limit the output resolution. In our work, we approach the problem differently.
Despite the trials of depth image estimation with deep CNNs and 3D object generation with variational GANs architectures, there is no direct similarity to the problem we try to solve. Mainly, there have been no attempts to generate a remote sensing 3D elevation model with an accurate building structure in the past using CNN-based methodologies. In addition, among the variety of methodologies that have been developed to refine the 3D urban structure, only a few of them use DSMs generated from stereo satellite imagery, as this type of data features strong noise, inconsistencies, or absence of data due to occlusions between the objects. Urban surface reconstruction based on stereo satellite imagery still is a complex problem. In continuation from our previous investigations [39,40], where we made the first attempt to generate a LIDAR-like quality DSM out of a given stereo DSM using a cGAN with an objective function based on negative log likelihood, we further explore the potential to generate DSMs with a refined form of buildings without any limitations on their geometry or space scale. Our contributions are as follows:
- We efficiently adapt the cGAN architecture developed by Isola et al. [19] from generic images to satellite images and analyze it for different data sources: LoD2-DSM from CityGML and LIDAR-DSM.
- We investigate the potential of using the objective function with least squares instead of negative log likelihood through which we gain more accurate building structures.
- The proposed framework generates images with continuous values representing the elevation models and, at the same time, enhances the building geometries.
- Our approach is not limited to the libraries of predefined building models and, as a result, can be generalized to large-scale scenes.
- We propose a methodology to convert CityGML data into LoD2-DSM.
- We develop a universal network which is able to generalize different urban landscape that have not been seen previously by the model, as generalization is an important aspect for remote sensing applications.
To our knowledge, this is the first study to carry out DSM refinement using deep learning techniques.
3. Methodology
3.1. Objective
GANs represent one of the few types of machine learning technique that is able to perform well for generative tasks. As proposed by Goodfellow et al. [33] in 2014, such techniques are characterized by training a pair of networks, namely a generator G and a discriminator D, which are trained in an adversarial manner to compete against each other.
The aim of is to implement a differentiable function to map a latent vector drawn from any distribution , e.g., a uniform distribution , to an element that is approximatively distributed according to , i.e., into the form of the data we are interested in imitating. On the other hand, attempts to differentiate between the generated data y and the genuine sample . The objective function for GANs can be expressed through a two-player minimax game:
where denotes the expectation value. The discriminator D is realized as a binary classification network that outputs the probability that an input image belongs either to class 0 (“generated”) or to class 1 (“real”). During training, the G aims to create samples that look more and more real, while the D intents to always correctly classify where a sample comes from.
In this paper, we address the generation of better-quality DSM featuring refined building shapes at LoD2 according to the definitions of CityGML [41]. In other words, we aim to generate artificial LoD2-like height images with a similar appearance to the given DSMs from stereo satellite imagery but with an improved building appearance.
The conditioning of the model on external information was first introduced by Mirza and Osindero [37]. The cGANs restrict both the generator in its output and the discriminator in its expected input. As a result, cGANs allow the generation of artificial images similar to some known input image x. In contrast to Equation (1), the cGAN objective function
now involves some conditional data x.
Since the appearance of cGAN, many extensions to its architecture have been proposed. The architecture of Isola et al. [19] gained the most popularity in cases involving the image-to-image translation problem, and is used nowadays as a basic model for image generation tasks. Our method also builds upon this adversarial system to generate images with continuous values representing the elevation information.
It is common to blend the GANs objective with traditional losses, such as or distances, as this helps the generator to make the created image as close to the given ground truth in an or sense. As we are interested in images where the buildings have steep walls and sharp ridge lines, we use the distance
as it encourages less blurring. Adding this term leads to our final objective:
where is a balancing hyper-parameter.
Moreover, to overcome the common problem of unstable training when the objective function of GANs is based on the negative log-likelihood, we apply a technique that was recently proposed by Mao et al. [42] which replaces the negative log likelihood in Equation (2) by a least square loss , yielding the conditional least square generative adversarial network (cLSGAN) objective:
This makes it possible both to stabilize the training process and to improve the quality of the generated image. Therefore, we also investigate the influence of this alternative training procedure using cLSGAN
for our proposed generation of better-quality DSMs.
3.2. Network Architecture
We adapted our architectures from those presented by Isola et al. [19]. The network G is a U-Net [43] accepting a single-channel depth image with continuous values as input. The tanh activation function is applied on the top layer of the G network. The U-Net is an encoder-decoder type of network that progressively down-samples the input through a series of layers until a bottleneck layer and codes back the process from this point. In order to recover important details that are lost due to the down-sampling in the encoder, skip connections are added to the network, which combine the encoder layer i with the up-sampled decoder layer at every stage. In our work, the encoder part of U-Net is constructed with 8 layers and 7 skip connections. The stereo DSM images are accepted as an input image of this network. The detailed U-Net network architecture is illustrated in Figure 1.
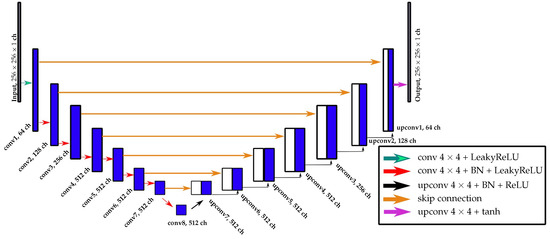
Figure 1.
Schematic overview of the proposed U-Net architecture. Each convolution operation has a kernel of size with stride 2. For up-sampling, the transposed convolution operations with kernels of size and stride 2 are used. The Leaky ReLU activation function in the encoder part of the network has a negative slope of 0.2.
The D network is a binary classification network consisting of 5 convolutional layers in our case. The input to the discriminator D is a concatenation of a stereo DSM with either a U-Net-generated fake DSM or a ground-truth DSM. The D has a sigmoid activation function on the top layer as it is meant to output the probability that the input image belongs either to class 1 (“real”) or class 0 (“generated”).
A schematic diagram of the proposed network architecture is illustrated in Figure 2.
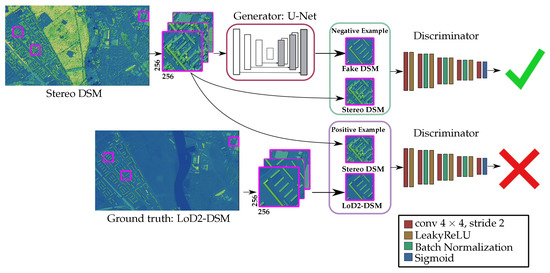
Figure 2.
Schematic overview of the proposed method for the 3D building shape improvement in stereo DSM by cGAN. The DSM images are color-shaded for better visualization.
3.3. LoD2-DSM Ground Truth Data Generation
CityGML encodes a standard model and mechanism for describing different kinds of 3D city objects with respect to their geometry, topology, semantics, and appearance. It also provides specific relationships between different objects, e.g., a building is decomposed of roof, wall, and ground surfaces, as seen in Figure 3a. For the creation of LoD2-DSM, the roof polygons of each building from the database consisting of points with location and height information are selected. Each polygon is triangulated afterwards (cf. Figure 3b) using the algorithm introduced by Shewchuk [44] based on Delaunay triangulation [45]. The software is publicly available. It should be noted that the triangular surfaces are left as they are. In order to generate a raster height image, we developed a method to calculate a unique height value of pixels lying inside each triangle using barycentric interpolation. The pixels outside buildings are filled with a digital terrain model (DTM) −, a mathematical representation of the ground surface without above-ground objects. As a result, the artificially generated so-called LoD2-DSM does not contain any vegetation, only building information. This can be clearly seen in Figure 4.
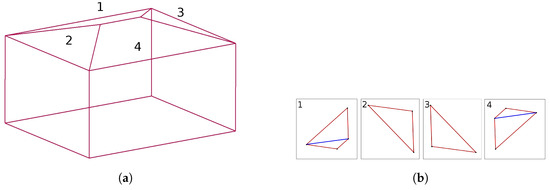
Figure 3.
An example of CityGML building model representation and triangulation of its roof surfaces. (a) CityGML building model representation; (b) roof surface triangulation.
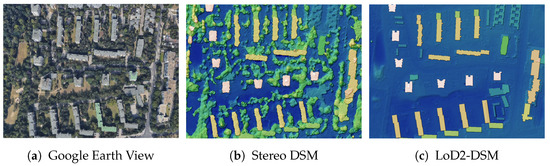
Figure 4.
Illustration of differences in vegetation representation between a stereo DSM from WorldView-1 satellite and an artificially generated LoD2-DSM.
4. Study Area and Experiments
Two different types of ground truth datasets were used for network training and evaluation of the results.
The first dataset consisted of a spaceborne stereo DSM and a LoD2-DSM. The LoD2-DSM was generated with a resolution of 0.5 m from a CityGML data model that is freely available on the download portal Berlin 3D (http://www.businesslocationcenter.de/downloadportal). The process of this type of DSM generation is given in Section 3.3.
The second dataset consisted of a spaceborne stereo DSM and LIDAR-DSM. We ran this experiment to demonstrate the improvements in the results from our previous work and, additionally, to produce a trained network to perform a model generalization test on (see Section 5.2), as only LIDAR-DSM data is available for another region. Semi-global matching (SGM) [46] was used to generate a stereo DSM with a resolution of from six panchromatic Worldview-1 images acquired on two different days. The LIDAR-DSM considered as a ground truth was provided by the Senate Department for Urban Development and Housing, Berlin. It was generated from airborne laser scanning data with a resolution of 1 and up-sampled to the resolution of 0.5 m to establish consistency with the available stereo DSM. We used the last pulse laser scanning data which contains much less vegetation compared to the stereo DSM. Both datasets used for this experiments show Berlin city, Germany within a total area of 410 2.
The LIDAR-DSM was used as a vertical and horizontal reference during the automatic image orientation as part of the LoD2-DSM generation process. However, a systematic deformation of up to between the LoD2-DSM and the stereo DSM was noticed. We thus co-registered the LoD2-DSM to the stereo DSM using an affine transformation based on 19 manually selected points, leading to a fit with a standard deviation of less than 1 .
To investigate the prediction model‘s capacity over a different urban landscape, a third stereo DSM and LIDAR-DSM dataset showing a part of Munich city, Germany, was considered. For this test, the stereo DSM from WorldView-2 satellite imagery with a resolution of derived by the same methodology [46] was used. The last pulse airborne laser scanning data with a resolution of 1 2 was provided by Bavarian Agency for Digitisation, High-Speed Internet and Surveying. The data was rasterized with a resolution of . The Munich dataset covering 9 km2 was used only for the inference phase.
4.1. Implementation and Training Details
4.1.1. Training Process
As this paper is a follow-up to our previous work [39], the DSM-to-LoD2 network was also based on the cGAN architecture developed by Isola et al. [19] on PyTorch python package with a slight extension. To organize the training data, the satellite images were tiled into patches of size which fit into the available GPU memory and was large enough to capture not only a single building but also a constellation of building structures and their surroundings. This led to the production of sufficient context information required by the network about building shapes, positions, and orientations. The prepared training data for the learning process consisted of 21,480 pairs of patches covering an area of 353 km2. To tune the hyper-parameters, validation data covering 6 km2 was used. The DSM-to-LoD2 network was trained with minibatch stochastic gradient descent (SGD) using the ADAM optimizer [47] with an initial learning rate of and momentum parameters of and for both setups cGAN and cLSGAN. We chose the weighting hyper-parameter after performing the experimental training and examining the resulting generated images and their profiles. During the training phase, two networks G and D were trained at the same time by alternating one gradient descent step of D and one gradient descent step of G. To achieve a better optimization behaviour when training cGANs, it is common to change G to maximize the instead of minimizing . The total number of epochs was set to 200 with a batch size of 5 on a single NVIDIA TITAN X (Pascal) GPU with 12 of memory. Within the training, a random cropping of the tiles up to one tile size was used instead of the up-scale and random crop data augmentation from the original code. The idea behind this was that the network may observe only some parts of a building in one patch for one cropping and the whole building in the next time period. Although different configurations were observed in different moments, it has been the same building featuring the same properties. This made the network more general, robust, and flexible to a variety of building types.
4.1.2. Inference Process
During the inference process, only the trained generator G of the DSM-to-LoD2 network was involved. It generated LoD2-like height images covering 50 km2 after stitching the overlapping patches for the final full image generation. The overlap for the test data was fixed at 128 in both the horizontal and vertical directions. The test dataset consisted of stereo DSM patches that were never shown to the networks during the training phase.
4.2. Evaluation Metrics
The quantitative evaluation of generative models is a challenging task especially if the generated images contain continuous values rather than discrete values. Common metrics used to measure accuracy for continuous variables are the mean absolute error (MAE)
and the root mean squared error (RMSE)
where denotes the predicted heights and the actually observed ones. Usually, the specifications of these accuracy metrics are based on the assumptions that the errors follow a Gaussian distribution and that no outliers exist [48]. However, DSMs derived by digital photogrammetry seldom features a normal error distribution due to the presence of outliers and filtering or interpolation errors. Therefore, Höhle and Höhle [48] proposed the use of a robust scale estimator, such as the normalized median absolute deviation (NMAD)
which is suitable for non-normal error distributions. It is proportional to the median of the absolute difference between height errors, denoted as , and the median error . The constant 1.4826 was included so that NMAD is comparable to the standard deviation when the data are distributed normally. This estimator can be considered more robust to outliers in the dataset.
Moreover, as we wanted to compare the similarity of generated LoD2-like height image to the ground truth DSM, the normalized correlation coefficient (NCC)
between the two signals h and was examined. Here, and are the means of all the elements in h and .
It should be mentioned that as we were interested in quantifying the improvements of the building shapes on DSMs, the above mentioned metrics were measured only in the area where buildings were situated. This was achieved by extracting useful information from the binary building mask generated from the same CityGML data model. Besides, we exceeded the building footprints by a three-pixel dilation on the boundaries to make sure that the 3D information of building walls was included as we were interested in its improvement.
5. Results and Discussion
5.1. cGAN vs. cLSGAN
The examples of DSMs generated by the DSM-to-LoD2 network for both LoD2-DSM and LIDAR-DSM datasets are depicted in Figure 5 and Figure 6, respectively. By investigating the obtained DSMs, we can see that both cGAN and cLSGAN networks are able to generate the elevation models close to the given ground truths. In the case of LoD2-like DSM, the model managed to learn that there is no vegetation in the artificially created LoD2-DSM. This also can be seen by referencing the computed height variation maps in Figure 5f,g,n,o, of the generated DSMs in comparison to the LoD2-DSM from CityGML data. The low lightness denotes areas where the stereo or generated DSMs are higher than the ground truth DSM. As a result, Figure 5e,m demonstrate that the DSM from stereo satellite imagery, on the other hand, contains many trees. Other objects, like, e.g., cranes or electrical power poles, also vanished, as they did not exist in the artificial LoD2-DSM generated from CityGML data. Regarding the LIDAR-DSM dataset, there is only small amount of vegetation on the ground truth DSM as the LIDAR point cloud we used was from the last pulse. Therefore, the model focuses on building object reconstruction and eliminates or creates areas with a small amount of vegetation while generating the height images (see Figure 6f,g,n,o).
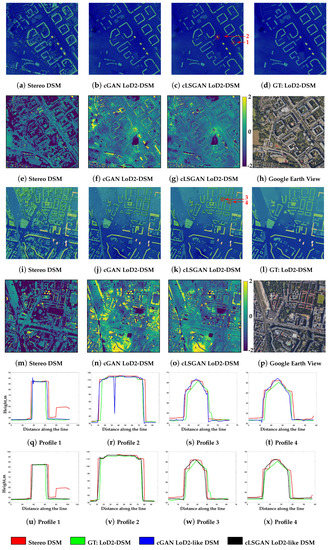
Figure 5.
Visual analysis of DSMs, generated by cGAN and cLSGAN architectures, over selected urban areas. The DSM images are color-shaded for better visualization. Difference maps in meters of stereo and generated DSMs with respect to the ground truth LoD2-DSM of the selected regions are shown in the second and fourth lines, respectively. The profiles of selected buildings from DSM generated by cGAN are illustrated in the fifth line, and the ones from cLSGAN are in the sixth line.
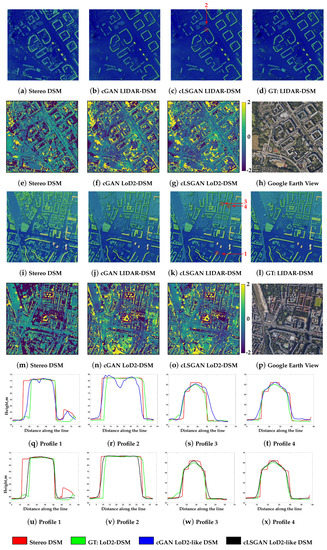
Figure 6.
Visual analysis of DSMs generated by cGAN and cLSGAN architectures over selected urban areas. The DSM images are color-shaded for better visualization. Difference maps in meters of stereo and generated DSMs with respect to ground truth LIDAR-DSM of selected regions are shown in the second and fourth lines, respectively. The profiles of selected buildings from DSM generated by cGAN are illustrated in the fifth line, and the ones from cLSGAN are in the sixth line.
In addition, it should be highlighted that the network was trained to only manipulate existing buildings and did not generate new buildings or its parts if there is no building in the input data. Good examples can be seen in highlighted areas in Figure 6n,o or in the zoomed part of the first LIDAR-DSM area illustrated in Figure 7. This building exists on the given LIDAR-DSM. However, as there is no sign about it within the stereo DSM, the two models cGAN and cLSGAN did not reconstruct it. There are only a couple of examples highlighted here, but, unfortunately, there are more in reality, as a data acquisition time difference exists between the available DSM generated from stereo satellite images and the given ground truth data.
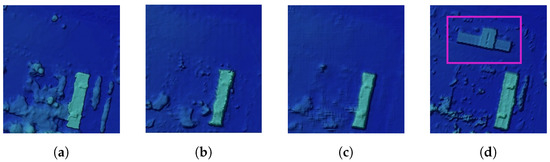
Figure 7.
Demonstration of generalization of existed buildings in the input DSM using both cGAN and cLSGAN methodologies trained on LIDAR ground truth data. (a) illustrates the input stereo DSM, (b) is a generated DSM using cGAN, (c) is a generated DSM using cLSGAN, and (d) is a LIDAR ground truth.
Regarding the quality of generated DSMs, one can say that the results from the proposed cLSGAN technique are very similar to those from cGAN. However, detailed investigation shows that cLSGAN outperforms cGAN. For example, the height difference maps demonstrate that there are less or no residuals within building areas on DSMs from cLSGAN models. In addition, it can be seen that the building structures are fully reconstructed without missing parts. This can be clearly observed in the next example. By zooming into two selected buildings (see Figure 8) from the LoD2-like first and second DSM areas, we can see that the buildings generated by the cLSGAN model are more detailed and complete than the one from the cGAN model. The right side of the first building highlighted with 1 in Figure 8a is almost missing and the inside construction highlighted with 2 was not reconstructed at all. Here, the cLSGAN produced better results, as it managed to generate those parts (see Figure 8b). Regarding the second building, one can see that the upper part of the construction generated by cGAN is not detailed compared to the one from cLSGAN. Concerning the bridge that connects two parts of the building, the same problem occurred. Besides, a certain pattern of holes on some buildings generated by cGAN models was discovered on both datasets LoD2-DSM and LIDAR-DSM. An example of these distortions can be seen in detailed view in Figure 8a. A more detailed discussion is given later during the quantitative evaluation analysis.
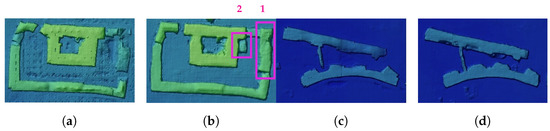
Figure 8.
Comparison of generalization over DSM between cGAN and cLSGAN methodologies for two selected buildings. (a,c) are the generated buildings by cGAN and (b,d) are the generated buildings by cLSGAN.
By investigating the profiles of selected buildings highlighted by red lines in Figure 5c,k and Figure 6c,k for LoD2-DSM and LIDAR-DSM datasets, respectively, we can confirm that, in general, both cGAN and cLSGAN models can successfully learn 3D building representations that are close to the ground truths (green profiles). However, as it was mentioned before, some artifacts exist on the height images generated by the cGAN model. This is not dependent on the data type as both obtained results from LoD2-DSM and LIDAR-DSM datasets have this problem. Examples are demonstrated in Figure 5r for LoD2-DSM and in Figure 6k,r for LIDAR-DSM. Fortunately, the application of the cLSGAN model helped to smooth the artifacts and bring the shape of building even closer to the ground truth shapes. This achievement is clearly seen in Figure 5v and Figure 6u,v. Of course, not every building in the generated results exhibited holes. The demonstrated bad examples were chosen for the visual notion. Moreover, not only the quality of flat roofs was improved. The gable, hip, or any other roof type consisting of inclined planes can be improved by applying our methodology. As can be seen from the profiles (Figure 5w,x and Figure 6w,x), the cLSGAN model provided much better results. The planes of roof surfaces are much smoother and more symmetrical regarding the central ridge line. Primarily, the ridge lines are much sharper in comparison to ridge lines from the stereo DSM and are at the central position which gives a more realistic view and is geometrically more correct. Additionally, all profiles show very close resemblance to the ground truth shapes, especially regarding the width and borders of the buildings.
To quantify the generated DSMs, we evaluated the proposed metrics on all setups, and their performances are reported in Table 1. In general, the resulting DSMs from our cGAN model revealed the same or slightly worse results compared even to the normal stereo DSM. The reason for this lies in the fact that the cGAN model uses the sigmoid cross entropy loss function for the discriminator [33] that leads to the vanishing gradient problem when updating the generator using the created samples that are on the correct side of the decision boundary but are still far from the real data [49]. As a result, the discriminator believes that the created images come from real samples and causes almost no error by updating the generator as the images are on the correct side of the decision boundary. Therefore, some parts of the buildings are still badly reconstructed, completely missed, or feature holes, as shown in the example in Figure 8a. The relatively high values of RMSE for the LoD2-DSM setup compared to the LIDAR-DSM may be due to the much bigger time difference in data acquisition which leads to cases like those depicted in Figure 7. This influences the computed metrics a lot. The results obtained by the cLSGAN model on both datasets quantitatively outperforms the stereo DSM and the DSMs generated by the cGAN model as they are much smoother, able to reconstruct even small parts of buildings, and do not contain any artifacts. Mao et al. [49] explained that as a powerful feature of the least squares loss function that moves the created samples toward the decision boundary and penalizes samples that lie in a long way on the correct side of the decision boundary. As a result, this allows the generation of more realistic samples. The metrics for the cLSGAN model lay close to 1 (0.91 for LoD2-DSM and 0.94 for LIDAR-DSM) which indicates that the produced results are meaningful and resemble the ground truth. Processing one patch of size pixels with the proposed network took 0.2 seconds on a single NVIDIA Titan X Pascal GPU.

Table 1.
Prediction accuracies of cGAN and cLSGAN models on all investigated metrics for LoD2-DSM and LIDAR-DSM datasets over the Berlin area.
5.2. Model Generalization Capability
To demonstrate the capability of the network to generalize on diverse urban landscapes, we performed a 3D reconstruction of Munich city, Germany. This dataset is different from the Berlin dataset. Although, at first sight, the building architecture styles are similar to those in Berlin city, as both of them belong to one country, the huge amount of construction within the cities excludes the possibility of meeting identical buildings. Moreover, the Munich and Berlin datasets have different absolute height values above sea level.
Without re-training the model on the new dataset, we directly generated the Munich elevation image by passing WorldView-2 data through the DSM-to-LoD2 network trained on LIDAR-DSM and LoD2-DSM. The pixel examples of generated height images from both data types are illustrated in Figure 9b,c,f,g, respectively. From the resulting 3D height images, it can be seen that the proposed model successfully managed to generate the 3D elevation constructions over a new area. As expected, no new buildings were generated. However, some buildings were only partially reconstructed using both models. In example 1 of LIDAR-DSM in Figure 9b and LoD2-DSM in Figure 9c, the highlighted building was only partially reconstructed on both datasets. From the zoomed version of the highlighted buildings in Figure 10, we can clearly see that the quality of both input buildings from the stereo DSM is quite low—not regular and very noisy. The shape of the first building (see Figure 10a) is not consistent, and the ridge line has a form close to a zigzag. The second building in Figure 10e is most probably surrounded with vegetation and, due to interpolation processes, resulted in an object with irregular form. Even for the human eye, it is difficult to say if this object is a building. Therefore, both models experienced problems with these buildings, which confirms our theory of bad quality data influence. The solution here could be to use an additional information like spectral images during the training, which is very useful for object detection and classification tasks.
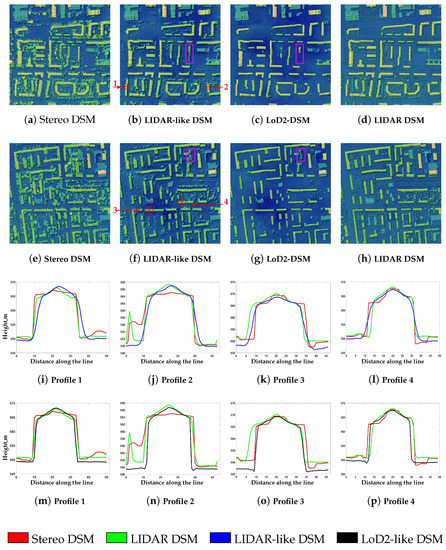
Figure 9.
Visual analysis of generalization by cLSGAN architecture over selected urban areas of Munich city using both setups LoD2-DSM and LIDAR-DSM. The DSM images are color-shaded for better visualization. (a,e) depict the input stereo DSM data, (b,f) is the generated DSM from LIDAR-DSM, (c,g) is the generated DSM from LoD2-DSM, and (d,h) is the LIDAR ground truth data. The profiles of selected buildings from DSM generated by LIDAR-DSM setup are illustrated in the third line, and the ones from LoD2-DSM setup are in the fourth line.
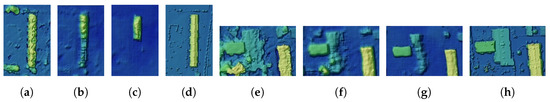
Figure 10.
Example of two buildings generated by the LIDAR-DSM setup (b,f) and LoD2-DSM setup (c,g), respectively. (a,e) show the buildings on stereo DSM and (d,h) on LIDAR DSM ground truth data. The depicted examples are from the Munich area.
By investigating the presented profiles, we noticed that the roof shapes were improved by applying both models—the ridge lines are sharper and appear much better now compared to the stereo DSM. Comparing the roof profiles between LIDAR-DSM (third line in Figure 9) and LoD2-DSM (fourth line in Figure 9), a small improvement in ridge line sharpness was produced with the LoD2-DSM model. Regarding the wall steepness, the buildings generated by the LoD2-DSM model are close to perpendicular wall planes in contrast to the one generated by applying the LIDAR-DSM model. This is reasonable, as the LIDAR-DSM was rasterized from a point cloud using interpolation and, as a result, features smooth transitions from the roof to the ground.
For the quantitative evaluation, we assumed the available LIDAR-DSM to be our ground truth, even when comparing the generated LoD2-like DSM, as no CityGML data was available for the Munich area. The statistical results of the experiment can be found in Table 2. The analysis of the results for the Munich area showed that the stereo DSM produced closer results to the LIDAR-DSM, considered as the ground truth, than both generated DSMs. This is due to the described effect of unreconstructed buildings or their parts by both models from the bad quality input image. Additionally, the generated LIDAR-like DSM showed better results in comparison to LoD2-like DSM due to the fact that the wall planes experienced a smooth transition from the roof to the ground, which is similar to what occurred in the ground truth data. In LoD2-like DSM, this transition was more perpendicular and, as a result, farther from the considered ground truth. This influenced the values of the metrics too. However, as we saw big improvements in shapes from analyzing the profiles, we decided to also evaluate the selected metric on a single building for which the profile 1 was investigated. The obtained results are summarized in the second part of Table 2. We can see a significant jump in the NCC metric for both generated DSMs which indicates the strong similarity to the ground truth building form. In addition, the LoD2-like DSM even outperformed the LIDAR-like DSM as expected due to the fact that the CityGML data provided more regular and better quality building shapes than the LIDAR-DSMs and the network was able to learn these features. Therefore, we proved that the proposed network is able to improve the law quality building shapes. It also can be said that this kind of accuracy analysis is not really suitable for a large area, but due to the lack of other potential evaluations, we still used it here. The improvements can be also seen in the three-dimensional visualization of the building geometry in Figure 11.
Table 2.
Prediction accuracies of cGAN and cLSGAN models for all investigated metrics for LoD2-DSM and LIDAR-DSM datasets over the Munich area.
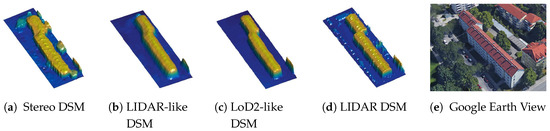
Figure 11.
Example of the generated building with a refined 3D shape for Munich city.
6. Conclusions
Many previous works have modeled natural images using conditional generative adversarial networks (cGANs) in both the computer vision and the remote sensing fields. However, the modeling of images that represent elevation models, i.e., contain continuous height values, is not common. We presented a method for the automatic digital surface models (DSMs) generation and refinement of building shapes to the level of detail (LoD) 2 from spaceborne stereo DSMs by applying a cGANs with negative log-likelihood objective function. This refinement is under demand, as the satellite stereo DSMs extracted from image matching point clouds suffers from occlusions, outliers, and noise. To achieve the generation of the surface model with buildings, which exhibit detailed shapes and roof forms, a good-quality DSM is necessary for formation of ground truth data during the training process. We proposed a methodology for transformation of city geography markup language (CityGML) data to DSM which delivers the necessary ground truth for training. Additionally, we performed training on light detection and ranging (LIDAR) DSM data to demonstrate the generalization ability on different types of data. The trained system was tested on two unseen areas in Berlin and Munich cities and achieved good results. The evaluation of the results showed the potential of the proposed methodology to generalize not only over diverse urban and industrial building shapes with complex constructions, but also in different cities without major problems. The network generated 3D building geometries with enhanced roof ridge lines, giving the buildings a more realistic appearance. Moreover, the detailed analysis reported that the model did not hallucinate new buildings but only reconstructed and improved the existing ones. Besides, vegetation reconstruction was not present and did not influence the generated results. However, some noise or unreconstructed parts of buildings were still present in the resulting DSMs. This can be explained as the consequence of the presence of very inaccurate parts in the input stereo DSM from which some buildings cannot be recognized, even with the human eye. In the future, additional information, like building masks or spectral images could be incorporated into the learning process to give an additional hint to the network about incompletely or badly reconstructed buildings in spaceborne stereo DSMs. We believe that the presented technique has great potential to provide a robust solution to the problem of DSM optimization with improved building geometries from remote sensing imagery at a large scale.
Author Contributions
K.B. and P.d. worked on developing the code and training data preparation. K.B. and M.K. performed the analysis. K.B. wrote the article. P.R. conceptualized the project and improved the manuscript. All authors reviewed and commented on the manuscript.
Funding
This research was funded by the German Academic Exchange Service (DAAD:DLR/DAAD Research Fellowship Nr. 57186656) for Ksenia Bittner.
Acknowledgments
We would like to thank the Senate Department for Urban Development and Housing, Berlin for providing the airborne laser scanning point cloud. Furthermore, we thank Thomas Krauß and Maximilian Langheinrich for their technical support on LIDAR-DSM and LoD2-DSM data generation.
Conflicts of Interest
The authors declare no conflict of interest.
References
- Jacobsen, K. DEM Generation from Satellite Data. Available online: http://pdfs.semanticscholar.org/e066/f8a278f845bf2cb19c9b4e81ec4dde1e1131.pdf (accessed on 25 August 2018).
- Sefercik, U.G. Productivity of TerraSAR-X 3D data in urban areas: A case study in Trento. Eur. J. Remote Sens. 2013, 46, 597–612. [Google Scholar] [CrossRef]
- Poli, D.; Caravaggi, I. Digital Surface Modelling and 3D Information Extraction From Spaceborne Very High Resolution Stereo Pairs. Available online: http://publications.jrc.ec.europa.eu/repository/bitstream/JRC68848/lbna25234enn.pdf (accessed on 25 August 2018).
- Shi, W.; Tian, Y. A hybrid interpolation method for the refinement of a regular grid digital elevation model. Int. J. Geogr. Inf. Sci. 2006, 20, 53–67. [Google Scholar] [CrossRef]
- Yang, Q.; McVicar, T.R.; Van Niel, T.G.; Hutchinson, M.F.; Li, L.; Zhang, X. Improving a digital elevation model by reducing source data errors and optimising interpolation algorithm parameters: An example in the Loess Plateau, China. Int. J. App. Earth Obs. Geoinf. 2007, 9, 235–246. [Google Scholar] [CrossRef]
- Karkee, M.; Steward, B.L.; Aziz, S.A. Improving quality of public domain digital elevation models through data fusion. Biosyst. Eng. 2008, 101, 293–305. [Google Scholar] [CrossRef]
- Wang, P. Applying Two Dimensional Kalman Filtering for Digital Terrain Modelling. Available online: https://pdfs.semanticscholar.org/b75e/4787d497a6fc5becb500f895ebe7df3c9d66.pdf (accessed on 25 August 2018).
- Zhen, X.; Huang, X.; Kwoh, L.K. Extracting DEM from SPOT stereo images. In Proceedings of the 22nd Asian Conference of Remote Sensing, Singapore, 5–9 November 2001; pp. 5–9. [Google Scholar]
- Laina, I.; Rupprecht, C.; Belagiannis, V.; Tombari, F.; Navab, N. Deeper depth prediction with fully convolutional residual networks. In Proceedings of the 2016 Fourth International Conference on 3D Vision (3DV), Stanford, CA, USA, 25–28 October 2016; pp. 239–248. [Google Scholar]
- Li, J.; Klein, R.; Yao, A. A two-streamed network for estimating fine-scaled depth maps from single rgb images. In Proceedings of the 2017 IEEE International Conference on Computer Vision, Venice, Italy, 22–29 October 2017; pp. 22–29. [Google Scholar]
- Reed, S.; Akata, Z.; Yan, X.; Logeswaran, L.; Schiele, B.; Lee, H. Generative adversarial text to image synthesis. arXiv, 2016; arXiv:1605.05396. [Google Scholar]
- Huang, H.; Yu, P.S.; Wang, C. An Introduction to Image Synthesis with Generative Adversarial Nets. arXiv, 2018; arXiv:1803.04469. [Google Scholar]
- Ledig, C.; Theis, L.; Huszár, F.; Caballero, J.; Cunningham, A.; Acosta, A.; Aitken, A.P.; Tejani, A.; Totz, J.; Wang, Z.; et al. Photo-Realistic Single Image Super-Resolution Using a Generative Adversarial Network. In Proceedings of the IEEE Conference on Computer Vision and Pattern Recognition, Honolulu, HI, USA, 21–26 July 2017; Volume 2, p. 4. [Google Scholar]
- Vondrick, C.; Pirsiavash, H.; Torralba, A. Generating videos with scene dynamics. Advances in Neural Information Processing Systems; MIT Press: Cambridge, MA, USA, 2016; pp. 613–621. [Google Scholar]
- Schlegl, T.; Seeböck, P.; Waldstein, S.M.; Schmidt-Erfurth, U.; Langs, G. Unsupervised anomaly detection with generative adversarial networks to guide marker discovery. In Proceedings of the International Conference on Information Processing in Medical Imaging, Boone, NC, USA, 2–7 June 2017; pp. 146–157. [Google Scholar]
- Wu, J.; Zhang, C.; Xue, T.; Freeman, B.; Tenenbaum, J. Learning a probabilistic latent space of object shapes via 3D generative-adversarial modeling. In Proceedings of the Advances in Neural Information Processing Systems, Barcelona, Spain, 5–10 December 2016; pp. 82–90. [Google Scholar]
- Smith, E.; Meger, D. Improved adversarial systems for 3D object generation and reconstruction. arXiv, 2017; arXiv:1707.09557. [Google Scholar]
- Yang, B.; Wen, H.; Wang, S.; Clark, R.; Markham, A.; Trigoni, N. 3D object reconstruction from a single depth view with adversarial learning. arXiv, 2017; arXiv:1708.07969. [Google Scholar]
- Isola, P.; Zhu, J.Y.; Zhou, T.; Efros, A.A. Image-to-image translation with conditional adversarial networks. arXiv, 2016; arXiv:1611.07004. [Google Scholar]
- Georgopoulos, A.; Skarlatos, D. A novel method for automating the checking and correction of digital elevation models using orthophotographs. Photogramm. Rec. 2003, 18, 156–163. [Google Scholar] [CrossRef]
- Amitabh, A.; Vijayvargiya, B.; GopalaKrishna, P.; Srivastava, K. Iterative automatic technique for refinement of DEM and orthoimages. In Proceedings of the 8th Map India International Conference, Pune, India, 20–22 December 2005; pp. 7–9. [Google Scholar]
- Walker, J.P.; Willgoose, G.R. A comparative study of Australian cartometric and photogrammetric digital elevation model accuracy. Photogramm. Eng. Remote Sens. 2006, 72, 771–779. [Google Scholar] [CrossRef]
- Felicísimo, A.M. Parametric statistical method for error detection in digital elevation models. ISPRS J. Photogramm. Remote Sens. 1994, 49, 29–33. [Google Scholar] [CrossRef]
- Sirmacek, B.; d’Angelo, P.; Krauss, T.; Reinartz, P. Enhancing Urban Digital Elevation Models Using Automated Computer Vision Techniques; ISPRS: Stuttgart, Germany, 2010. [Google Scholar]
- Sirmacek, B.; d’Angelo, P.; Reinartz, P. Detecting complex building shapes in panchromatic satellite images for digital elevation model enhancement. In Proceedings of the ISPRS Workshop on Modeling of Optical Airborne and Space Borne Sensors, Citeseer, Istanbul, Turkey, 11–13 October 2010. [Google Scholar]
- Krauß, T.; Reinartz, P. Enhancement of dense urban digital surface models from VHR optical satellite stereo data by pre-segmentation and object detection. Int. Arch. Photogramm. Remote Sens. Spat. Inf. Sci. 2010, 38, 6. [Google Scholar]
- Eigen, D.; Puhrsch, C.; Fergus, R. Depth map prediction from a single image using a multi-scale deep network. In Proceedings of the Advances in Neural Information Processing Systems, Montreal, QC, Canada, 8–13 December 2014; pp. 2366–2374. [Google Scholar]
- Eigen, D.; Fergus, R. Predicting depth, surface normals and semantic labels with a common multi-scale convolutional architecture. In Proceedings of the IEEE International Conference on Computer Vision, Santiago, Chile, 7–13 December 2015; pp. 2650–2658. [Google Scholar]
- Liu, F.; Shen, C.; Lin, G. Deep convolutional neural fields for depth estimation from a single image. In Proceedings of the IEEE Conference on Computer Vision and Pattern Recognition, Boston, MA, USA, 7–12 June 2015; pp. 5162–5170. [Google Scholar]
- Zhu, J.; Ma, R. Real-Time Depth Estimation from 2D Images. Available online: http://cs231n.stanford.edu/reports/2016/pdfs/407_Report.pdf (accessed on 25 August 2018).
- Simonyan, K.; Zisserman, A. Very deep convolutional networks for large-scale image recognition. arXiv, 2014; arXiv:1409.1556. [Google Scholar]
- Jeon, J.; Lee, S. Reconstruction-based Pairwise Depth Dataset for Depth Image Enhancement Using CNN. In Proceedings of the European Conference on Computer Vision (ECCV), Munich, Germany, 8–14 September 2018; pp. 422–438. [Google Scholar]
- Goodfellow, I.; Pouget-Abadie, J.; Mirza, M.; Xu, B.; Warde-Farley, D.; Ozair, S.; Courville, A.; Bengio, Y. Generative adversarial nets. In Proceedings of the Advances in Neural Information Processing Systems, Montreal, QC, Canada, 8–13 December 2014; pp. 2672–2680. [Google Scholar]
- Choy, C.B.; Xu, D.; Gwak, J.; Chen, K.; Savarese, S. 3D-R2N2: A unified approach for single and multi-view 3D object reconstruction. In Proceedings of the European Conference on Computer Vision, Amsterdam, The Netherlands, 8–16 October 2016; pp. 628–644. [Google Scholar]
- Dai, A.; Qi, C.R.; Nießner, M. Shape completion using 3D-encoder-predictor cnns and shape synthesis. In Proceedings of the IEEE Conference on Computer Vision and Pattern Recognition (CVPR), Honolulu, HI, USA, 21–26 July 2017; Volume 3. [Google Scholar]
- Rezende, D.J.; Eslami, S.A.; Mohamed, S.; Battaglia, P.; Jaderberg, M.; Heess, N. Unsupervised learning of 3D structure from images. In Proceedings of the Advances in Neural Information Processing Systems, Barcelona, Spain, 5–10 December 2016; pp. 4996–5004. [Google Scholar]
- Mirza, M.; Osindero, S. Conditional generative adversarial nets. arXiv, 2014; arXiv:1411.1784. [Google Scholar]
- Guo, Y.X.; Tong, X. View-volume Network for Semantic Scene Completion from a Single Depth Image. arXiv, 2018; arXiv:1806.05361. [Google Scholar]
- Bittner, K.; d’Angelo, P.; Körner, M.; Reinartz, P. Automatic Large-Scale 3D Building Shape Refinement Using Conditional Generative Adversarial Networks. ISPRS Int. Arch. Photogramm. Remote Sens. Spat. Inf. Sci. 2018, 422, 103–108. [Google Scholar] [CrossRef]
- Bittner, K.; Körner, M. Automatic Large-Scale 3D Building Shape Refinement Using Conditional Generative Adversarial Networks. In Proceedings of the IEEE Conference on Computer Vision and Pattern Recognition (CVPR) Workshops, Salt Lake City, Utah, 18–22 June 2018; pp. 2000–2002. [Google Scholar]
- Gröger, G.; Kolbe, T.; Nagel, C.; Häfele, K. OGC City Geography Markup Language (CityGML) Encoding Standard, Version 2.0, OGC doc no. 12-019. Available online: https://www.google.com/url?sa=t&rct=j&q=&esrc=s&source=web&cd=8&cad=rja&uact=8&ved=2ahUKEwjuxKi5__reAhUMwLwKHVcHBU0QFjAHegQICBAC&url=https%3A%2F%2Fportal.opengeospatial.org%2Ffiles%2F%3Fartifact_id%3D47842&usg=AOvVaw2wSGg9aGHeIRQc8wQe3Vug (accessed on 25 August 2018).
- Mao, X.; Li, Q.; Xie, H.; Lau, R.Y.; Wang, Z.; Smolley, S.P. Least squares generative adversarial networks. In Proceedings of the 2017 IEEE International Conference on Computer Vision (ICCV), Venice, Italy, 22–29 October 2017; pp. 2813–2821. [Google Scholar]
- Ronneberger, O.; Fischer, P.; Brox, T. U-net: Convolutional networks for biomedical image segmentation. In Proceedings of the International Conference on Medical Image Computing and Computer-Assisted Intervention, Munich, Germany, 5–9 October 2015; pp. 234–241. [Google Scholar]
- Shewchuk, J.R. Triangle: Engineering a 2D quality mesh generator and Delaunay triangulator. In Applied Computational Geometry Towards Geometric Engineering; Springer: Berlin, Germany, 1996; pp. 203–222. [Google Scholar]
- Delaunay, B.N. Sur la Sphère Vide. Bull. Acad. Sci. USSR 1934, 7, 793–800. [Google Scholar]
- D’Angelo, P.; Reinartz, P. Semiglobal matching results on the ISPRS stereo matching benchmark. ISPRS Hann. Works. 2011, 38, 79–84. [Google Scholar] [CrossRef]
- Kingma, D.P.; Ba, J. Adam: A method for stochastic optimization. arXiv, 2014; arXiv:1412.6980. [Google Scholar]
- Höhle, J.; Höhle, M. Accuracy assessment of digital elevation models by means of robust statistical methods. ISPRS J. Photogramm. Remote Sens. 2009, 64, 398–406. [Google Scholar] [CrossRef]
- Mao, X.; Li, Q.; Xie, H.; Lau, R.Y.; Wang, Z.; Smolley, S.P. On the Effectiveness of Least Squares Generative Adversarial Networks. arXiv, 2017; arXiv:1712.06391. [Google Scholar]


© 2018 by the authors. Licensee MDPI, Basel, Switzerland. This article is an open access article distributed under the terms and conditions of the Creative Commons Attribution (CC BY) license (http://creativecommons.org/licenses/by/4.0/).