Article

Long-Term Annual Mapping of Four Cities on Different Continents by Applying a Deep Information Learning Method to Landsat Data

1
Ministry of Education Key Laboratory for Earth System Modeling, Department of Earth System Science, Tsinghua University, Beijing 100084, China
2
Joint Center for Global Change Studies, Beijing 100875, China
3
Remote Sensing Technology Institute (IMF), German Aerospace Center (DLR), Wessling 82234, Germany
4
Signal Processing in Earth Observation, Technical University of Munich (TUM), Munich 80333, Germany
5
Department of Geological & Atmospheric Science, Iowa State University, Ames, IA 50014, USA
6
National Space Science Center, Chinese Academy of Sciences, Beijing 10019, China
7
State Key Lab of Remote Sensing Science, Jointly Sponsored by Institute of Remote Sensing Applications, Chinese Academy of Sciences, Beijing 100101, China
*
Author to whom correspondence should be addressed.
These authors contributed equally to this work.
Remote Sens. 2018, 10(3), 471; https://doi.org/10.3390/rs10030471
Submission received: 7 February 2018 / Revised: 3 March 2018 / Accepted: 15 March 2018 / Published: 17 March 2018
(This article belongs to the Special Issue Deep Learning for Remote Sensing)

Abstract

:
Urbanization is a substantial contributor to anthropogenic environmental change, and often occurs at a rapid pace that demands frequent and accurate monitoring. Time series of satellite imagery collected at fine spatial resolution using stable spectral bands over decades are most desirable for this purpose. In practice, however, temporal spectral variance arising from variations in atmospheric conditions, sensor calibration, cloud cover, and other factors complicates extraction of consistent information on changes in urban land cover. Moreover, the construction and application of effective training samples is time-consuming, especially at continental and global scales. Here, we propose a new framework for satellite-based mapping of urban areas based on transfer learning and deep learning techniques. We apply this method to Landsat observations collected during 1984–2016 and extract annual records of urban areas in four cities in the temperate zone (Beijing, New York, Melbourne, and Munich). The method is trained using observations of Beijing collected in 1999, and then used to map urban areas in all target cities for the entire 1984–2016 period. The method addresses two central challenges in long term detection of urban change: temporal spectral variance and a scarcity of training samples. First, we use a recurrent neural network to minimize seasonal urban spectral variance. Second, we introduce an automated transfer strategy to maximize information gain from limited training samples when applied to new target cities in similar climate zones. Compared with other state-of-the-art methods, our method achieved comparable or even better accuracy: the average change detection accuracy during 1984–2016 is 89% for Beijing, 94% for New York, 93% for Melbourne, and 89% for Munich, and the overall accuracy of single-year urban maps is approximately 96 ± 3% among the four target cities. The results demonstrate the practical potential and suitability of the proposed framework. The method is a promising tool for detecting urban change in massive remote sensing data sets with limited training data.

Graphical Abstract

1. Introduction

Urban expansion creates global environmental challenges that affect both developed and developing countries [1]. Although urban areas cover only a small fraction of the Earth’s surface (less than one percent [2]), rapid urbanization exerts disproportionate influences on biodiversity, hydrological systems and watersheds, biogeochemical cycles, and climate [3,4,5,6]. Owing to its important contributions to local and global anthropogenic change, urbanization attracts considerable attention among researchers and policymaker concerned with sustainable management of the built and natural environments. It is therefore imperative to monitor long-term changes in the spatial extent of urban areas, and particularly the impervious surfaces associated with these areas. Previous studies have exploited a variety of remotely sensed data to detect urban extent at a range of spatial and temporal scales [7,8,9,10].
Optical remote sensing data are available for urban (impervious surface) mapping. For example, Landsat imagery collected by Thematic Mapper (TM), Enhanced Thematic Mapper Plus (ETM+), and Operational Land Imager (OLI) instruments are provided at global scale with fine spatial resolutions and much useful spectral information. Long time series constructed using Landsat images have already been demonstrated to be an effective data source for mapping urban areas worldwide [11,12,13,14,15]. However, the spatiotemporal complexities of urbanization present immense challenges for timely urban mapping across seasons. Temporal nonlinearity and spatial heterogeneity in land use dynamics arise from a variety of complex interactions with the socioeconomic and ecological environment, many of which relate to the seasonal cycle [16]. Multiple studies have used spectral information in the Landsat time series to monitor urban change and evaluate its causes and consequences. For example, Yang et al. [17] produced a percent impervious surface cover dataset at 30-m resolution for the United States for inclusion in the 2001 National Land Cover Database (NLCD) Land Cover Collection [18]. Schneider [19] used Landsat TM and ETM+ data to study the expansion of 143 Chinese cities covering seven periods from 1978 to 2010. Sexton et al. [20] and Song et al. [14] used Landsat records to explore changes in the coverage of impervious surfaces in the Washington, D.C.–Baltimore, MD metropolitan region from 1984 to 2010. Li et al. [21] mapped urban areas at annual intervals over the period 1984–2013 in Beijing, China, and introduced a temporal consistency-check strategy that improved classification accuracy. Feyisa et al. [22] reported landscape patterns and associated changes between 1985 and 2010 in Addis Ababa, Ethiopia.
Despite the extensive research around urban mapping, fundamental issues remain. Uncertainties associated with the scarcity of training samples and the amplitude of spectral variance in long term datasets like Landsat continue to limit applications of these datasets [23]. It is therefore necessary to develop efficient, generalizable frameworks for extracting urban data for urban mapping. Noise due to radiation variance and the labor-intensive collection of training samples for each new target area inhibit the application and further development of urban mapping, especially when dealing with long term changes. Uncertainties associated with single-scene retrievals reduce the accuracy and temporal resolution of long time series [24,25]. Although annual maps of urban areas merged from multiple-scenes collected over the course of a year are more stable than single-scene, controlling for spectral variances remains an issue for urban mapping at all timescales. Overcoming this issue is important for expanding and improving the applicability of satellite imagery for mapping changes in urban areas over long periods. Moreover, traditional approaches to monitoring spatiotemporal patterns of urban development require large numbers of training samples in all temporal target periods [21,26]. These training-intensive approaches are extremely costly. The transferability of information derived from training data is a crucial step toward more effective, general approaches to urban mapping, and particularly for achieving the high time resolutions needed to monitor rapid urban changes at large scales.
To date, many studies have reported the potential of deep learning for providing this type of transferability [27,28,29], including in the application of large remote sensing datasets to track change in the human environment [30]. A key breakthrough in machine learning, deep learning can be used as an implicit general approach to dealing with large-scale problems [31]. Deep features have been demonstrated to be high-level, and can be transferred to accelerate learning in different but related target domains. Jean et al. [30] used a deep learning method to extract large-scale socioeconomic indicators from high-resolution satellite imagery and nighttime light intensities. Their results illustrate the informative nature and transferability of deep features. Lyu et al. [32] demonstrated that deep features can be exploited to detect changes more effectively and efficiently, with application of a previously-trained deep learning method to detect land cover changes in new target datasets. Several studies have examined the advantages and limitations of deep-feature transferability. Yosinski et al. [28] showed that transferability in deep networks can decrease with increasing distance between the training and target task, and this transferability arises from the tendency to learn generalized deep features with wide applicability. Among deep learning methods, recurrent neural networks (RNNs) have gained attention for providing solutions to challenging problems involving sequential time series data.
In this paper, we develop a new urban extraction framework based on a recurrent neural network and demonstrate the potential for deep learning to improve generalization in urban mapping applications. We select four cities (Beijing, New York, Melbourne, and Munich) as study areas and classify all Landsat scenes in these four cities during 1984–2016 at pixel level. These four target cities share similar climate zones, broadly defined by temperate continental climate conditions. Leveraging this underlying similarity, we proceed to define and discuss the general transferability of information derived from limited training data in urban areas with temperate continental climates.

2. Materials and Methods

2.1. Study Areas

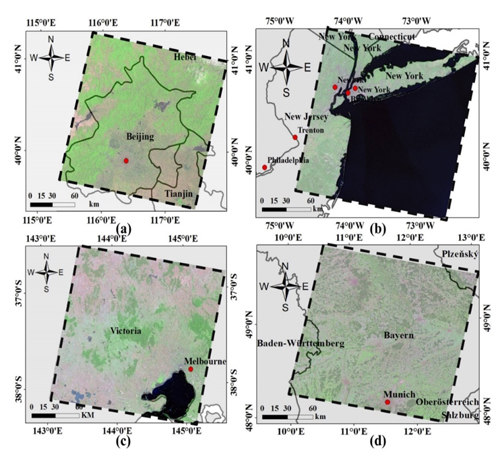
Figure 1 shows the four cities: Beijing-123/32 (path/row), New York-130/322, Melbourne-93/86, and Munich-193/26. Although all four cities are characterized by temperate climate condition, a variety of external factors may reduce the mutual transferability of deep features. These external factors include atmospheric conditions, illumination in different seasons, sensor calibration, and the presence and distribution of complex terrain.

2.2. Data Preprocessing and Collection

2.2.1. Preprocessing

All available Landsat data with cloud cover less than 10% are chosen for inclusion in this study. These data, which have been obtained from the U.S. Geological Survey (USGS: http://earthexplorer.usgs.gov/), include imagery collected by Landsat 4/5 TM, Landsat 7 ETM+, and Landsat 8 OLI data. The target data are seasonal composites (for boreal the spring, summer, autumn, and winter) based on Landsat images from 1984–2016. All locations and years are included in the analysis except for Melbourne in 1984–1985, and Munich in 1993–1996, which are excluded due to lack of data. The Landsat 4/5 TM and Landsat 7 ETM+ datasets have been processed in a uniform way using the Landsat Ecosystem Disturbance Adaptive Processing System provided by USGS [33]. Images from the Landsat 8 OLI datasets have been processed using the Level-1 T Product Generation System (LPGS) in the USGS Earth Explorer interface. Only the six spectral bands from Landsat 8 OLI that correspond to spectral bands from Landsat 4/5 TM and Landsat 7 ETM+ are chosen to test transferability. Bands 2–7 of Landsat 8 OLI are chosen to correspond to bands 1–5 and band 7 in Landsat 4/5 TM. The F-mask (function of mask) algorithm developed by Zhu et al. [34] is used to reduce the influences of cloud cover and cloud shadow.

2.2.2. Training Data Collection

Temporal distributions of the Landsat images used for the four regions are shown in Figure 2. The total number of scenes is 304 for Beijing, 231 for New York, 168 for Melbourne and 79 for Munich. A large set of training samples is needed to construct a supervised method for extracting urban land cover from satellite imagery, including the deep learning we use in this work. It is also desirable for this training data set to contain samples from all seasons. To construct a suitable test of transferability within this framework, the training samples should be drawn exclusively from one location and limited to a relatively short time period. Here, we use Landsat imagery for Beijing during 1999. This set of images comprises 14 scenes without cloud contamination distributed relatively homogeneously with the year. The training data are selected from within these scenes, with the remaining data designed for classification. The training samples have been labeled through visual inspection of Landsat images aided by higher-resolution imagery in the Google Earth archive [12,26]. According to the work of Schneider et al. [26], we define urban land sites for which the surface is predominantly impervious, including all non-vegetative, human-constructed elements (e.g., roads and buildings). Here, the term “predominantly” means that built environments with impervious surfaces cover more than 50% of the pixel. In addition to urban land, land cover categories (for vegetation, bare land and water) are considered. Bare land is defined as a natural environment dominated by exposed soil, sand, gravel, or rock, with little or no vegetation [12,21], which is more difficult to distinguish from urban pixels than water or vegetation. In total, 777,090 training samples (comprising 243,712 urban samples, 140,343 vegetation samples, 229,497 bare land samples, and 163,538 water samples) are manually identified from among the 14 scenes collected for Beijing during 1999.

2.2.3. Validation Data Collection

We perform two experiments (that evaluate temporal transferability and spatial transferability respectively, using the same training samples (manually labeled training data from Beijing during 1999). For the temporal transfer experiments, the target data are images of Beijing from 1984–2016. For the spatial transfer experiments, the target data are images of New York, Melbourne or Munich from 1984–2016. We provide quantitative assessments of the overall accuracies of the classification and detected changes to validate the performance of the proposed framework within these two experiments.
To validate temporal transferability, two separate test datasets are constructed to assess single year classifications and change detection. Single-year classifications are independently evaluated for images of Beijing collected during 1984, 1994, 2004, and 2014. All scenes within these four years are included in the evaluation. Within each selected year, 20,000 test samples are randomly selected from among known urban (10,000 units) and non-urban (10,000 units) regions. These test samples are used to assess the accuracy of urban mapping both within each individual year and merged set based on the four selected years. All validation samples are evaluated by visual inspection of Landsat images aided by examination of higher resolution images from Google Earth [35]. The Google Earth images provide high resolution land-cover information for tracking urban expansion at pixel level in Landsat images. Test samples for assessing the detection of changes are acquired from the work of Li et al. [21], which are exactly the same with the work of Li et al. [21] (see this publication for additional details). A total of 100 test samples are randomly selected from among rapidly developing regions between 1984 and 2013. We extend these data with information from 2014–2016 following the same strategy of the work of Li et al. [21].
To validate spatial transferability, both single year classification and change detection are evaluated for the other three cities (New York, Melbourne, and Munich). For the single year classification assessment, we conduct independent evaluations of all scenes from four selected years (1986, 1997, 2004, and 2014). A total of 20,000 stable test samples are randomly selected in each city, equally distributed among urban (10,000 units) and non-urban (10,000 units) sites. As above, the latter distinction is achieved by visual inspection of Landsat images supported by Google Earth imagery at a spatial resolution of 0.75 m [36]. For the change detection assessments, separate sets of test samples are selected for each of the three cities following the strategy employed by Li et al. [21]. For New York, 100 sample locations are selected by randomly sampling inform among known change regions, previously identified using the NLCD [37] and verified by visual inspection of Google Earth images. For Melbourne and Munich, 100 sample locations are selected via a similar random sampling drawn from change regions identified using visual inspection of Google Earth images and continuous analog Landsat sequences.

2.3. Method

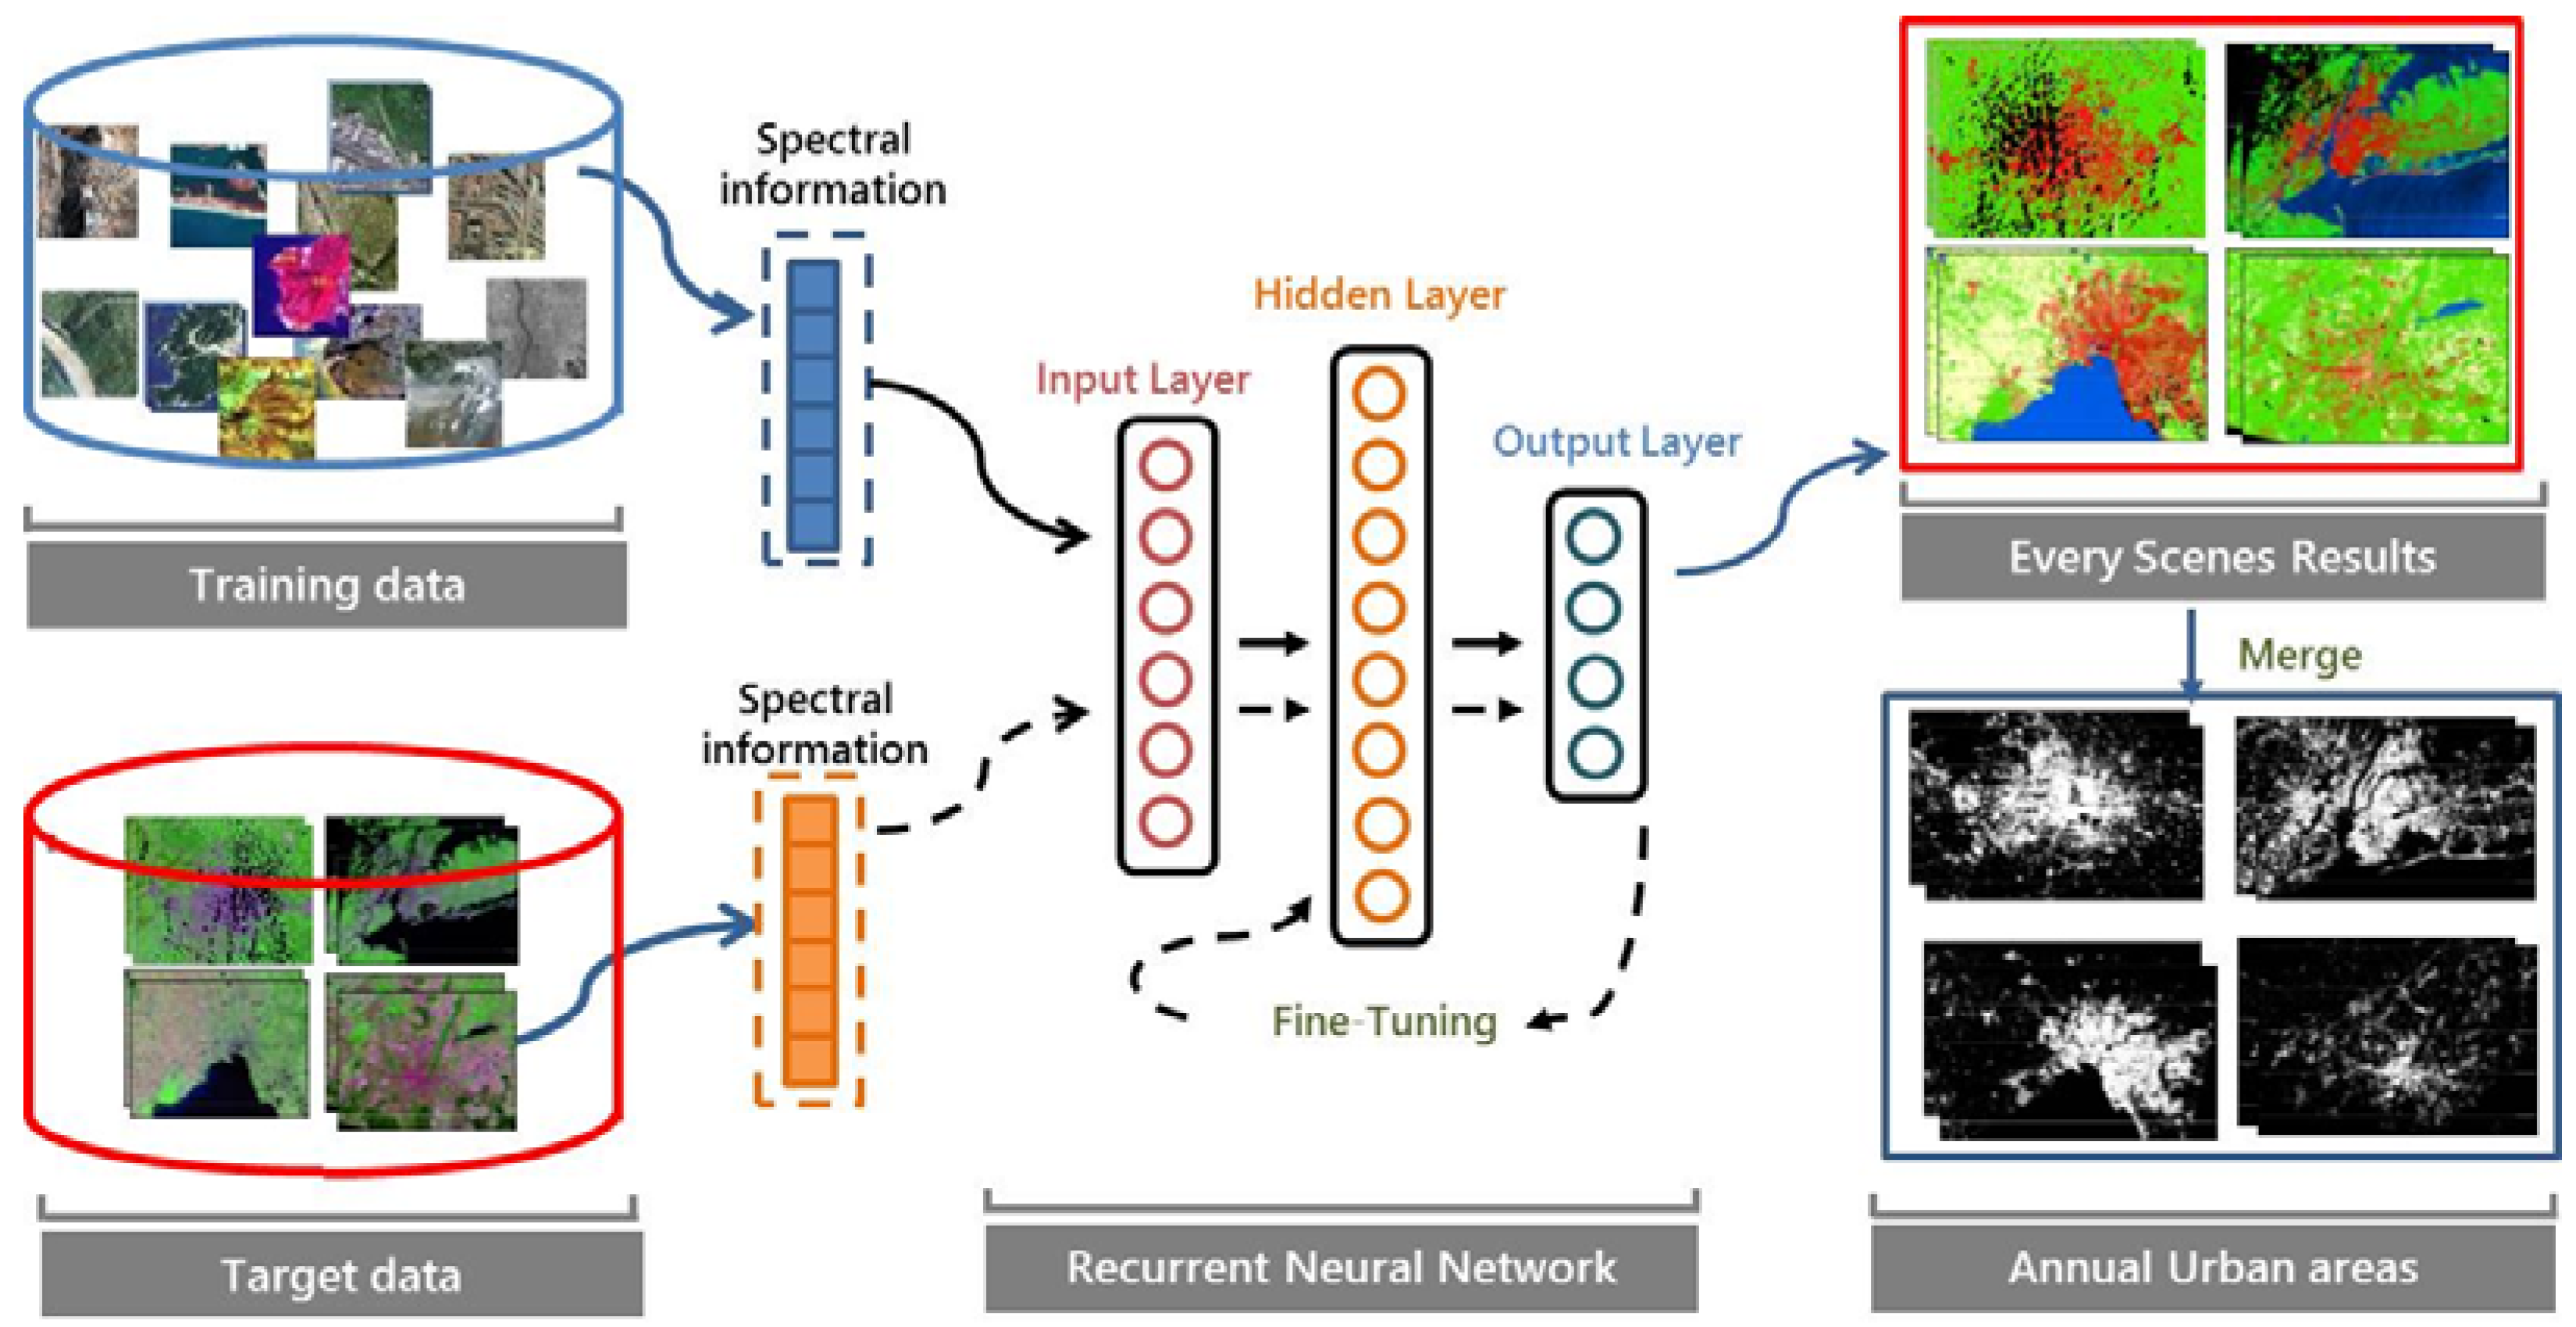
Figure 3 summarizes the proposed framework for extracting annual urban information from Landsat imagery. Inputs to the network include pixel vectors from training data and target data. Outputs are the final predicted land cover labels. Application of this framework to all pixels in all images yields a classification map. Two complementary strategies are employed to construct this framework. The first is an offline training phase, in which all labeled training data are fed into the network to construct an initial RNN-based deep learning network (as shown by the solid black arrows in Figure 3). The second is an online optimization phase, in which the target samples are used to fine-tune the initial network and increase its specialization be for the target images (as shown by the dotted black arrow). The fine-tuned network is then used to construct the final classification map for the target data. Through these steps, annual records of the distribution of impervious surface can be extracted and merged for further analysis.
This urban extraction framework exploits deep feature representations that distinguish urbanized areas from the non-urban background. Knowledge transfer can help to generalize the application of this framework to urban mapping by avoiding issues related to the scarcity of training samples. According to [30,38], transfer learning can be defined as follows. Consider a domain D = { χ , P ( X ) } that contains a feature space χ and a marginal probability distribution P ( X ) . For example, in this work, our learning task is land cover classification. Each term is a spectral feature, with χ the space containing all term vectors, χ i the ith term vector corresponding to a specific land cover distribution, and X the full set of learning samples. Within a specific domain, a task T = { Y , f ( · ) } contains a label space Y and a predictive function f T ( · ) . The latter is not observed but can be learned from analysis of the training samples. The training samples consist of pairs { χ i , y i } , where χ i X and y i Y . The function f T ( · ) then relates each term to its corresponding label [30,39]. Given the source domain (training data) D s and learning task T s along with a target domain (test data) D T and learning task T T , transfer learning aims to streamline the process for learning the target predictive function f T ( · ) relating D T and T T by utilizing prior knowledge of D s and T s (with D s D T ). In our framework, the source domain comprises Landsat images of Beijing collected in 1999, and the target domain comprises all Landsat images of the four selected cities during 1984–2016.

2.3.1. Offline Training

We first undertake to define a suitable predictive function f T ( · ) through offline training. Multi-spectral data can be conceptualized as a set of orderly and continuous sequences in the spectral space [40]. RNN is known to perform well when applied to sequential data types. Our adoption of RNN in this work is thus intended to leverage the sequential properties of multispectral data, such as spectral correlations and band-to-band variability. For our urban extraction task, the likelihood of predicting correct labels within the training data set D s can be maximized by solving
θ * = arg max θ i p ( y s i | x s i ; θ ) ,
where θ is the parameter set for the network, x s i denotes a spectral pixel vector, and y s i is the corresponding land-cover label. Since the spectral vector x s i can be considered sequential, RNN is a natural choice for dealing with p ( y s i | x s i ; θ ) . Urban pixels can be addressed in the RNN by the hidden units h t . We use an advanced recurrent unit/gated recurrent unit (GRU) approach to construct the RNN. This approach mitigates problems with vanishing or exploding gradients, which can hamper convergence.

2.3.2. Online Optimization

Our objective is an efficient and generalizable method for mapping urban areas. We therefore introduce an online learning step to specialize the representation of deep feature within the network to each new target space rather than applying the initial network directly. The collection of training data for real remote sensing applications covering multiple domains is expensive and time consuming. As the amount of unlabeled data is large relative to the amount of labelled training data, the unlabeled data provide information that can be used to explore and ultimately enhance the generalization capacity of the classification [41].
In our framework, we introduce information from D T into the initial RNN to fine-tune the network to each new study area. We first identify the top N data samples from a new target scene with high likelihood scores (higher than 0.99) using the trained GRU recurrent network and then adopt these samples as additional training data for the target domain. Likelihood scores are thus treated as the final output of the softmax layer, collated and applied prior to the final classification [42]. These additional training data allow us to efficiently optimize the method to each target scene. The online optimization consists of three steps. First, D T is fed into the RNN trained on the source domain. This generates a provisional predicted label y T i and corresponding likelihood p ( y T i | x T i ; θ ) for each sample according to Equation (1), where p ( y T i | x T i ; θ ) represents the likelihood that the sample belongs to a specific class. Second, samples with high likelihood scores (≥0.99) are selected as additional training samples on the target domain. Third, a supplementary training set D T = { ( x T 1 , y T i ) , , ( x T n , y T n ) } that is specialized to the target scene (domain) is generated. The combined training data (i.e., the source data D s and the newly produced additional training set D T ) are then used to fine-tune the initial RNN method, producing an optimized method for conducting the T T task. The weights of the initial GRU recurrent network thus contribute to classifying the features of multispectral images covering the new target domain. The framework is constructed to strike a balance between generalized land cover classification (application to different land cover types, seasons, and cities) and specialized land cover classification (transfer of prior knowledge from D s and T s ).
We train the test case presented in this paper using the RMSprop algorithm [43]. The recommended default parameters are used for all experiments. We use a single-layer GRU of size 32 with sigmoid activations and tanh activation for hidden representations. Sigmoid gate activations and tanh activation are both default settings under the RNN framework. All weight matrices in our method are initialized from a uniform distribution covering the range [−0.1, 0.1]. All weight matrices are updated as necessary during the learning process and fine-tuned during the online optimization process.
Once each individual scene is classified using the proposed framework, the initial classification maps are merged into annual maps using the ‘dominated strategy’. Under this strategy, a sample is classified as urban in the annual map if it was classified as urban in more than 50% of the scenes available for that year [10,44]. Our use of this strategy is motivated by the relative stability of urban areas (or impervious surfaces) over long periods.

3. Results

3.1. Temporal Transfer

3.1.1. Performance of the Initial Classification

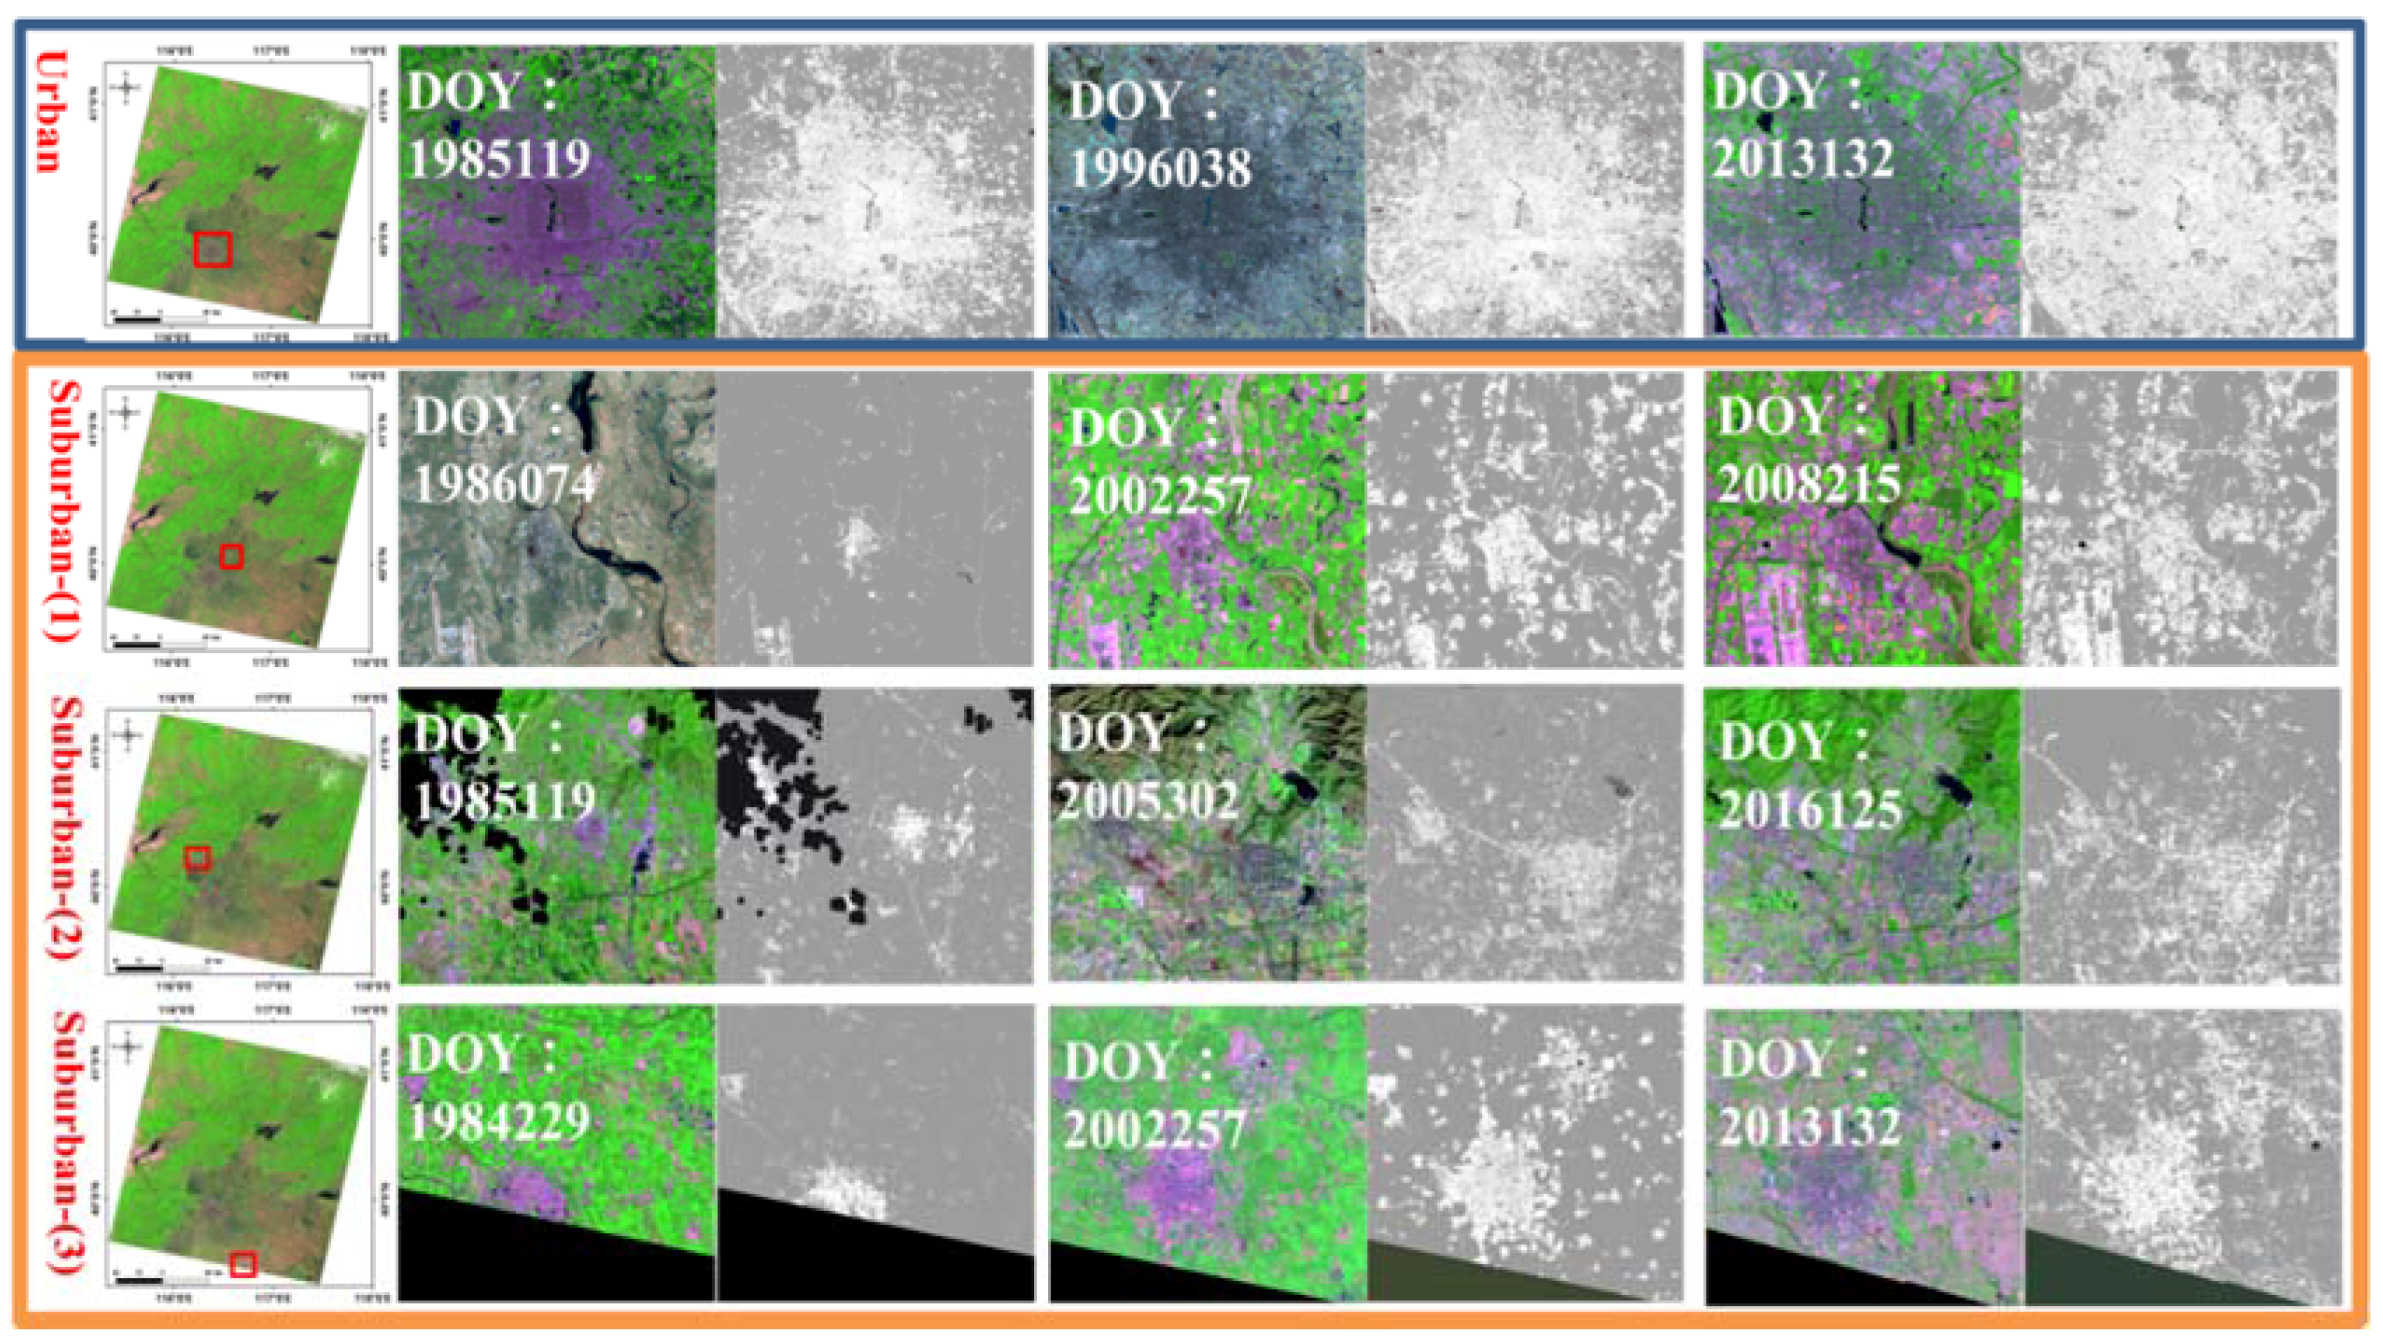
We evaluate temporal transfer within the proposed framework in the hope that long-term urban mapping can be achieved from spectral information alone with robust transferability in time. Landsat images covering more than 30 years are classified using training data drawn from the labeled training samples observed in and around Beijing during 1999. Figure 4 shows distributions of impervious land cover extracted using the original classification for urban and suburban regions around Beijing. The dates are randomly selected from early, middle, and late years within the analysis period and cover multiple seasons. Urban and non-urban regions can be clearly distinguished in all scenes, indicating a promising transferability of deep features learned by our method across different seasons. Figure 4 also shows evident urbanization in both urban and suburban regions of Beijing between the mid-1980s and recent years. Impervious surfaces with distinguishable shapes, such as airport runways and roads are detected at pixel level by the method.
After acquisition of the initial classification maps, all images from each year are merged into annual urban maps using the ‘dominated strategy’ (see Section 2.3.2 for details). Here, we use confusion matrices, overall accuracies (OA), and user accuracies (UA) to assess the results of the temporal transfer experiments. Table 1 summarizes single scene and merged annual classification accuracies for four selected years. For completeness, counts of true negatives (TN), true positives (TP), false positives (FP) and false negatives (FN) are also listed. The abbreviation UA-N is used to denote the user accuracy of non-urban pixels, while UA-U demotes the user accuracy of urban pixels. The overall accuracies (OA) for all four merged annual assessments exceed 90%, with the user accuracy (UA) for urban areas greater than 98%. Among the single scene assessments, the average OA was 97 ± 0.2% in 1984, 93 ± 5% in 1994, 96 ± 2% in 2004, and 93 ± 4% in 2014. The user accuracy is typically higher for urban areas than for non-urban areas, but consistently exceeds 80% for both. These results indicate that the framework is sensitive to urban land cover in all seasons, and that information learned by training the method on images of Beijing in 1999 is transferable in time. The merged annual classification maps (99 ± 0.3%: average OA) outperform the single scene classification maps (95 ± 3%: average OA) slightly over these four years. The merged annual classifications are more robust and more stable than the single scene results given reduced uncertainties due to, e.g., poor image quality and spectral confusion. Based on these temporal transfer experiments, we conclude that the proposed framework is a promising tool for extracting urban areas from satellite imagery over long time spans.
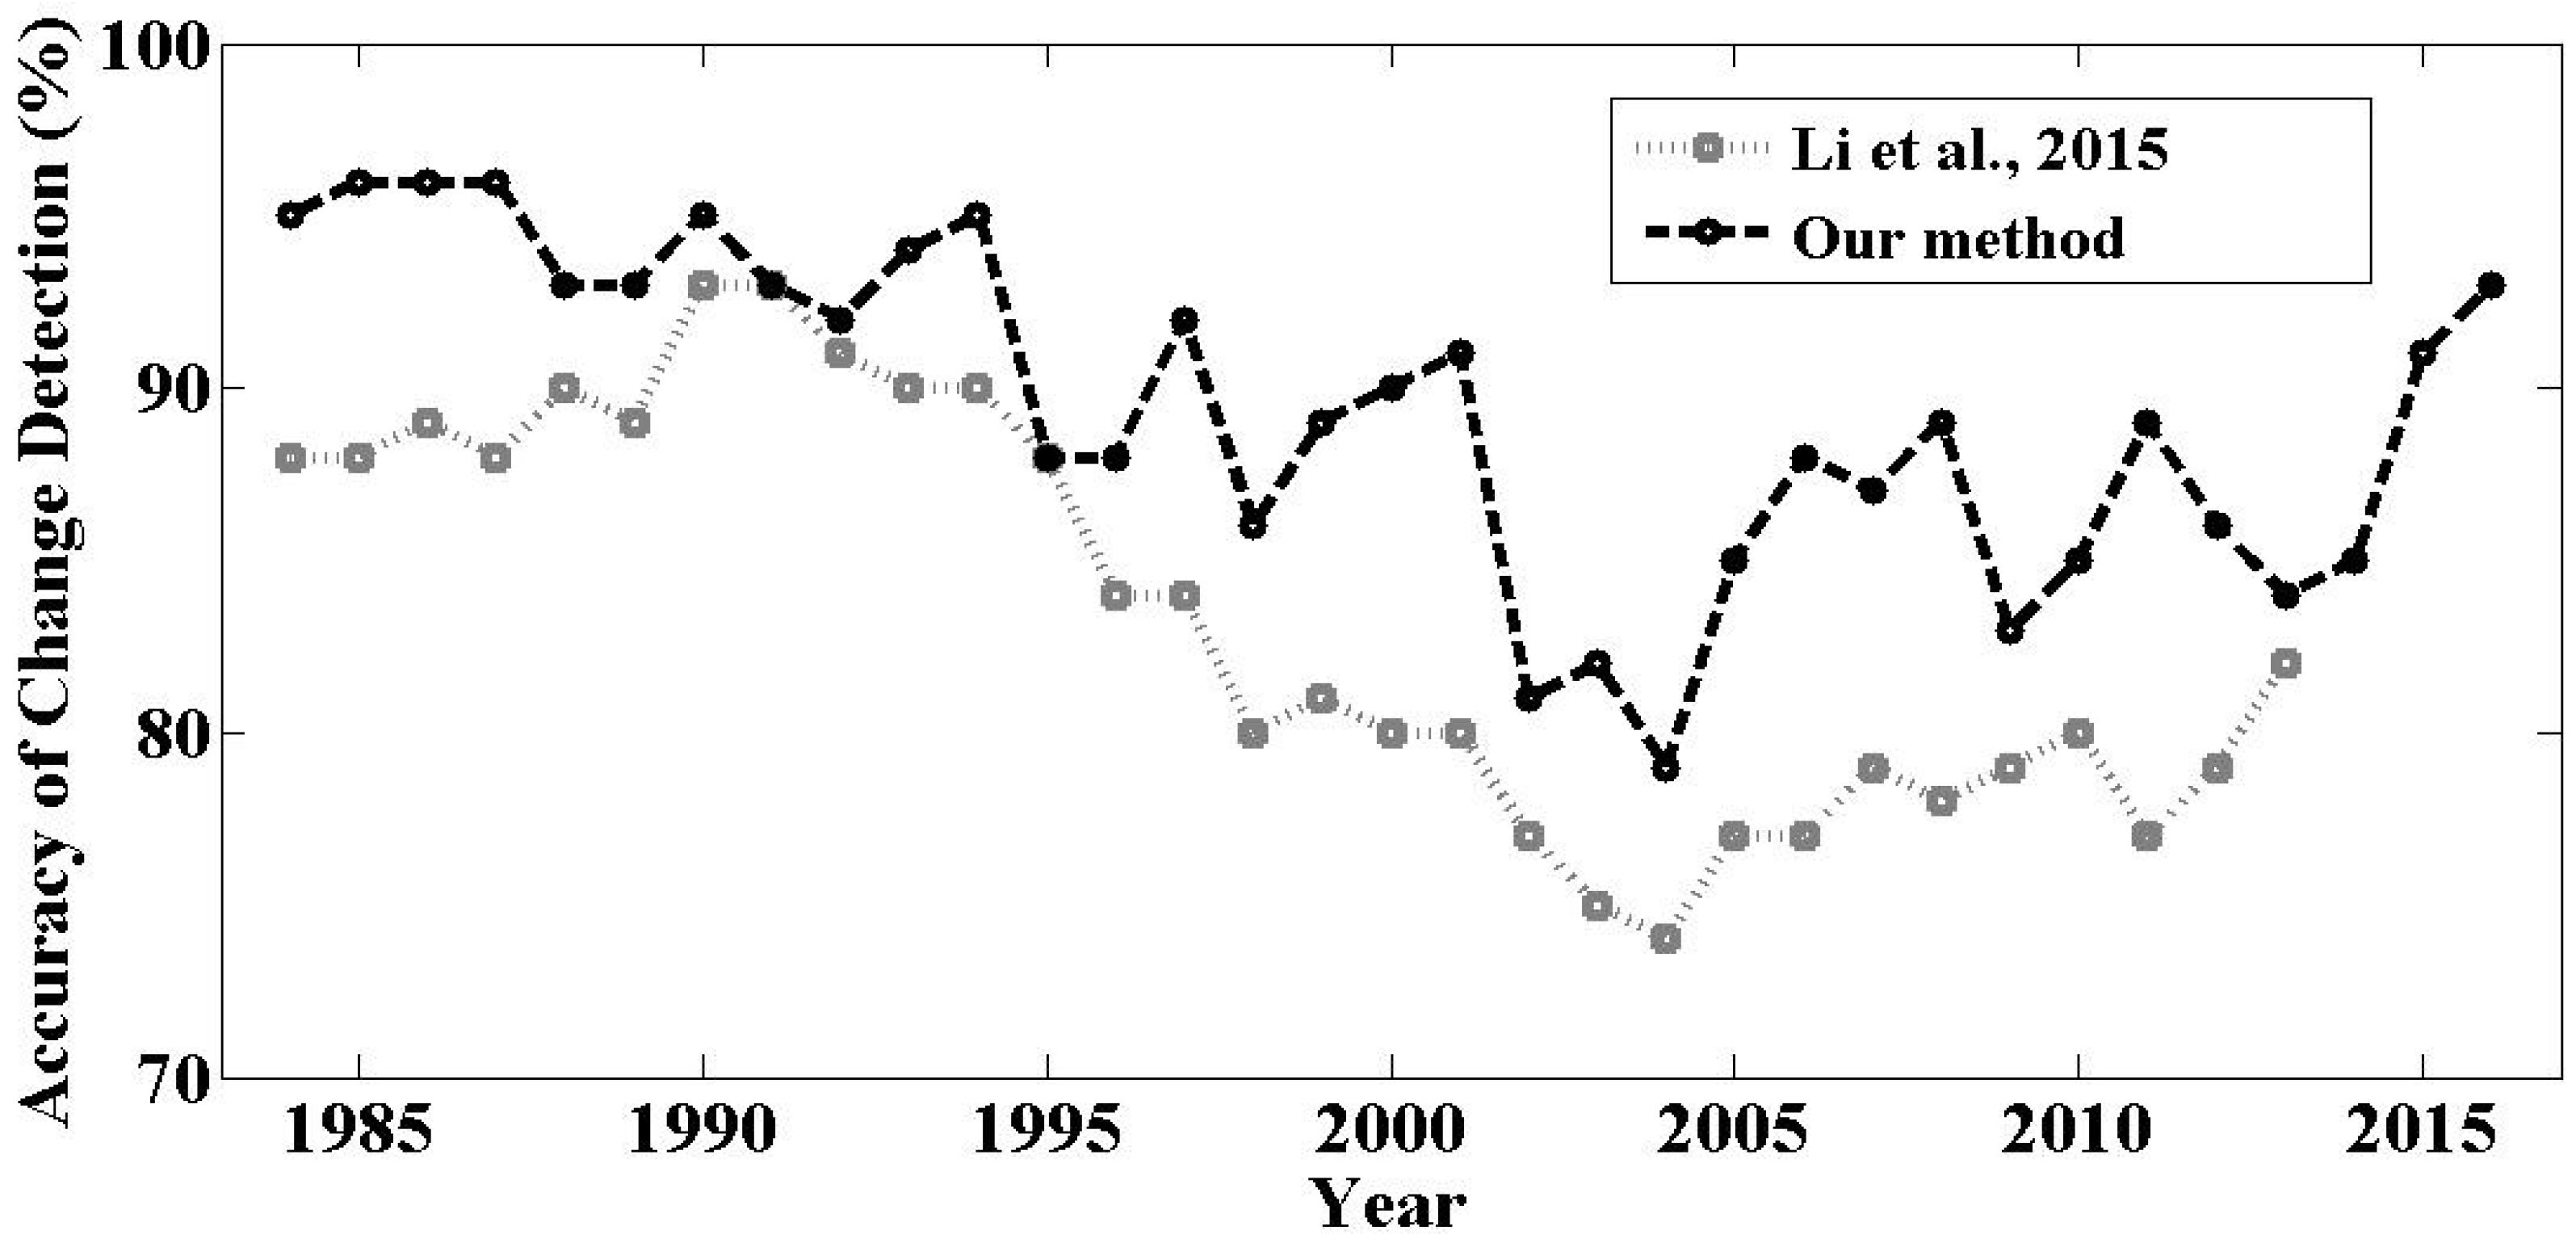
Figure 5 shows the overall accuracy of changes detected using the merged annual classification maps. This accuracy fluctuates from year to year, with indications of a slight decline and a slight increase before and after 2004 respectively. This general evolution of change detection accuracy has also reported by Li et al. [21], where the random forest method was exploited for classification, and a temporal consistency-check strategy was introduced to improve classification accuracy. The slight decrease before 2004 may emerge for two reasons. First, the quality of Landsat images acquired during different seasons may vary from year to year, affecting the final mapping results. Second, rapid land-cover changes are difficult to extract with precision on annual time scales. Most clear-sky Landsat images around 2004 were collected during winter and spring (Figure 2). This seasonal sampling bias may influence the final detection accuracy. Urban land cover in Beijing also expanded rapidly after 2000, with an average growth rate of 99.48 ± 1.3 km2 year−1 between 2000 and 2013 [21]. The evolution of new construction within a given year may complicate the classification, particularly in times of rapid urbanization, as urban expansion is spread throughout the year. Overall, the accuracy for change detection in long term data sets ranged from 79% to 96%, with an average accuracy of 89%.

3.1.2. Urban Expansion

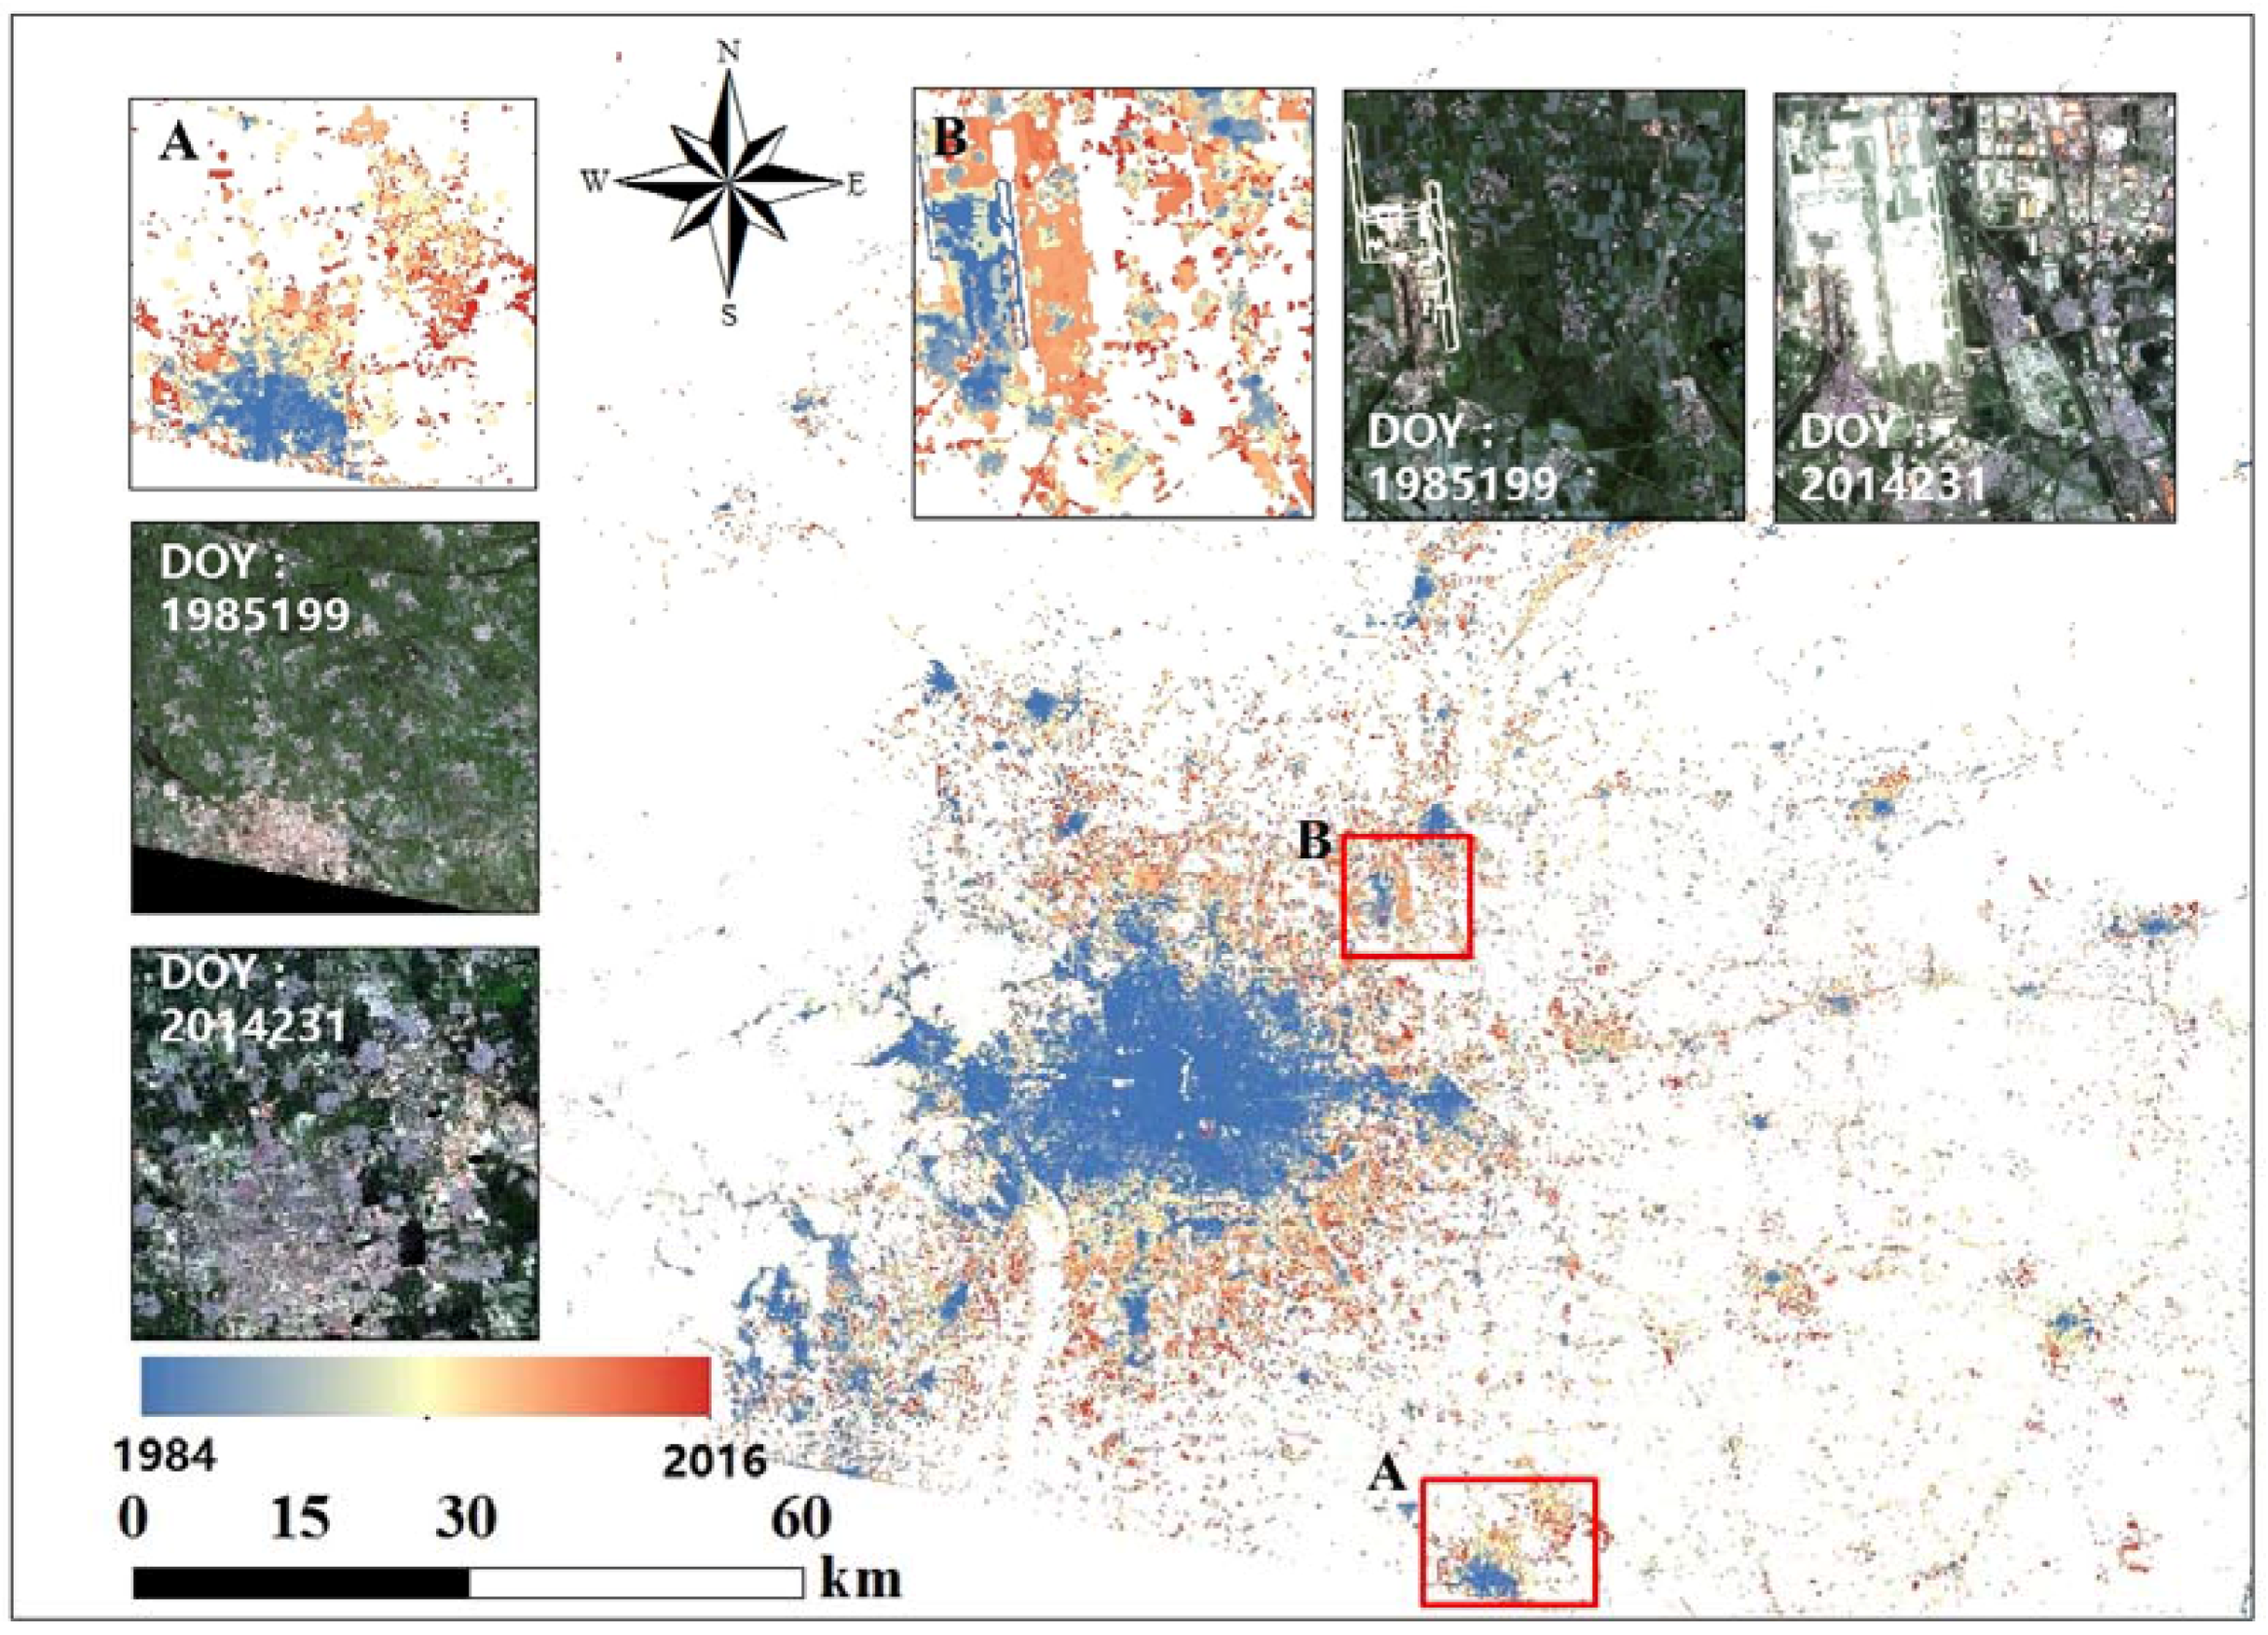
Long term urban land cover datasets are essential for tracking and understanding the spatiotemporal patterns of urban development. Figure 6 shows the spatial distribution of urban expansion during 1984–2016. Here, sites that were built earlier have lower values (shown in blue), while sites that were built more recently have higher values (shown in bright red). Built environments have expanded in both the urban and suburban areas of Beijing in recent decades. Two inset maps (Figure 6A,B) show urbanization patterns for the Langfang and Beijing Capital Airport regions respectively. The corresponding Landsat images are also included for context.

3.2. Spatial Transfer

3.2.1. Performance of the Initial Classification

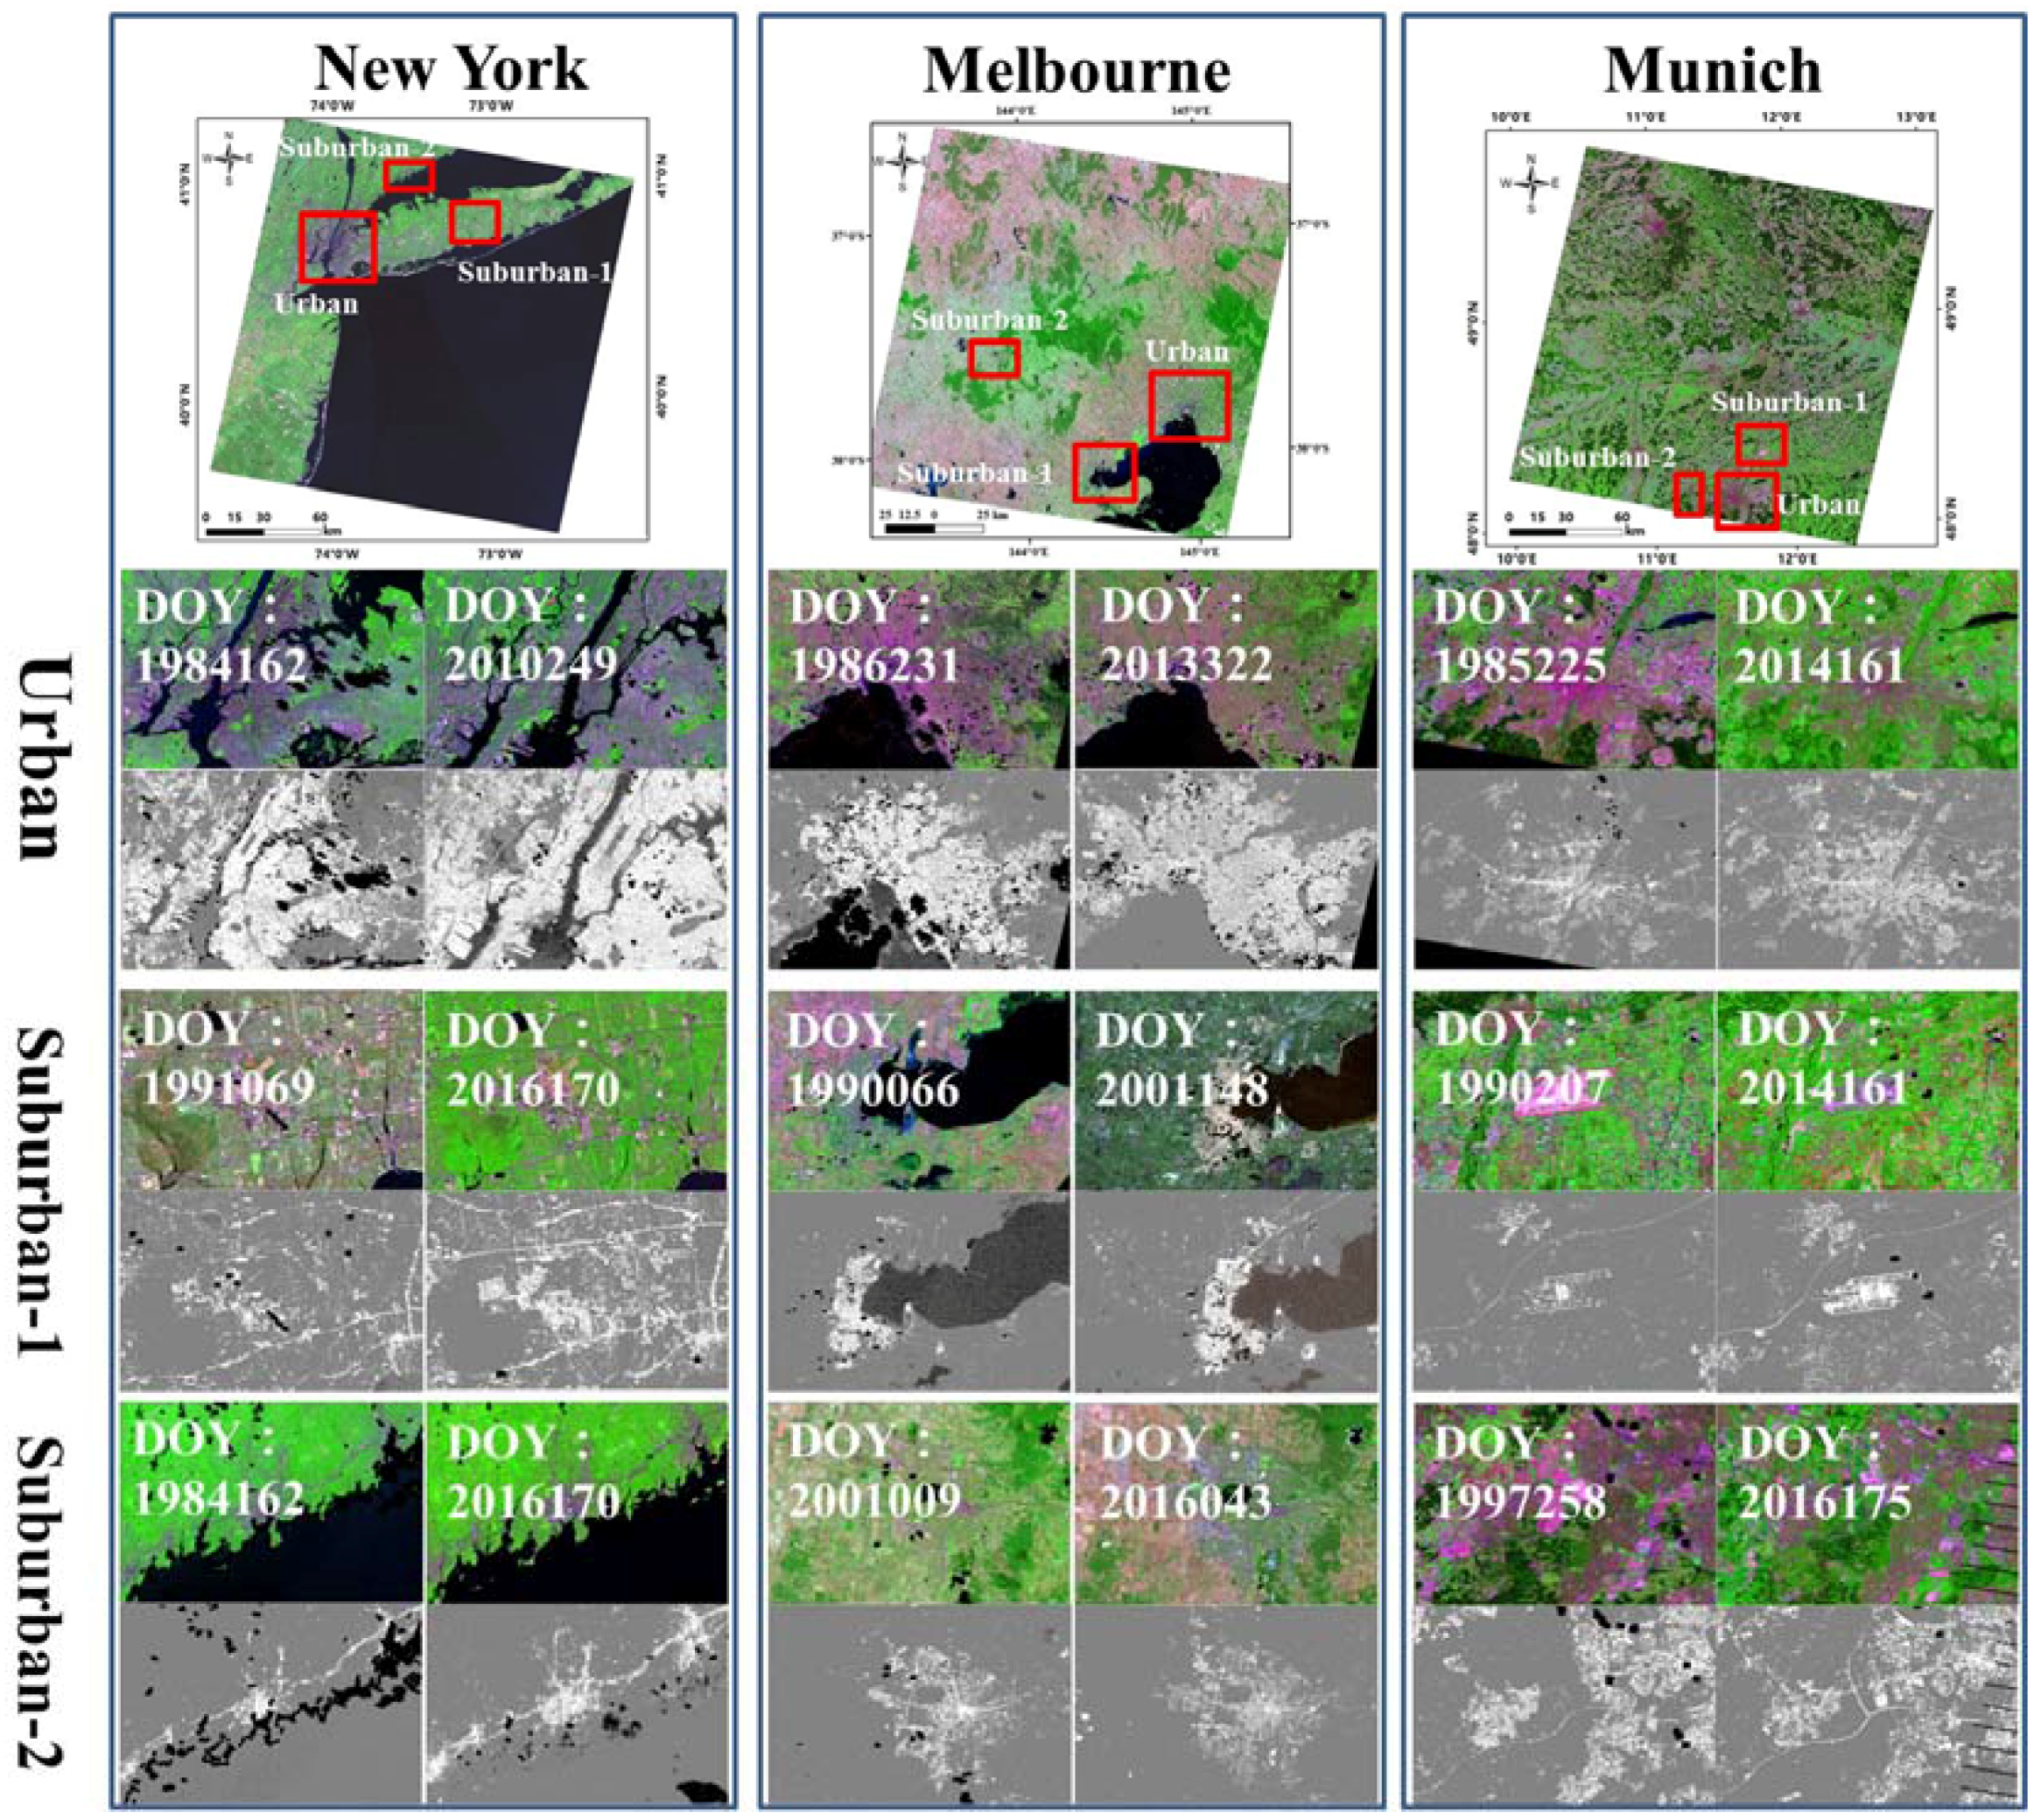
The spatial transferability of information gained from the training samples collected over Beijing in 1999 are tested for three different cities (New York, Melbourne, and Munich) in similar (temperate continental) climate zones during 1984–2016. A total of 478 Landsat images of these three cities are classified without field data from these three cities (spatial transfer experiments). Figure 7 shows examples of initial maps of impervious cover extracted for urban and suburban regions in all three cities. Corresponding Landsat images are shown for each randomly-selected classification map. Impervious surfaces can be accurately detected in both urban and suburban regions, and the locations of newly built roads and airports can be identified under different seasonal conditions. In urban detection, pure impervious surface pixels and mixed pixels in which impervious surfaces are paired with vegetation or water are easy to distinguish from non-urban classes. By contrast, mixed pixels with impervious surfaces and bare-land are difficult to classify, as illustrated for New York Suburban-1 (Levittown) in Figure 7.
As in the temporal transfer experiment (Section 3.1), the accuracies of both single-year classifications and detected changes are evaluated for the spatial transfer experiments. Table 2 lists the results for both single scene and merged annual classifications for all three urban areas in four selected years (1986, 1997, 2004, and 2014). As above, confusion matrices (TP, TN, FP, and FN), overall accuracies (OA) and user accuracies (UA) are calculated to assess the classification results. Our framework accurately extracts urban surfaces in both individual scenes (across seasons) and merged annual classification with UA-U consistently exceeding 92% in all cases). Average values of single-scene OA are 97 ± 3% in New York, 97 ± 2% in Melbourne, and 94 ± 4% in Munich. This level performance and its extension across different seasons demonstrate that the information gained from and the Beijing 1999 training data is transferable to other locations in similar climate zones. The extraction of urban area in any single scene is subject to uncertainties, as shown in Table 2; however, these uncertainties can be reduced substantially by merging the single scene results for each year. The merged annual classifications are more robust and stable than the single scene results, as also found in the temporal transfer experiment (Table 1). The results are qualitatively consistent among the three cities, with large values of OA and UA-U and slightly smaller values of UA-N. The latter implies larger errors in detecting non-urban areas, although UA-N still exceeds 90% for most scenes.
Figure 8 illustrates the change detection accuracy for each of the three cities. The approach to selecting validation data for Figure 8 is described in Section 2.2.3. The accuracies vary among the three cities, but are consistently higher than 75%. Generally, changes are detected more accurately for New York (average OA of 94%) than for the other two cities. Changes are detected least accurately for Munich but remain relatively large on average (average OA of 89.4%). Change detection accuracy is relatively stable in time for Melbourne, with annual accuracies from 87% to 95%, and an average OA equal of 93%. The results indicate that our method can accurately detect changes related to urbanization in metropolitan areas with temperate continental climates.

3.2.2. Urban Expansion

The different urban development patterns are provided for each of the three cities, with the expansion of urban land during 1984–2016 illustrated in map form (Figure 9 for New York, Figure 10 for Melbourne, and Figure 11 for Munich). Sites that were built earlier have lower values (blue), while sites that were built recently have higher values (bright red). Two focus regions are selected for each city to better visualize spatiotemporal development patterns in the three cities, supplemented by TM images corresponding to the beginning and end of the Landsat record considered in this work. Central Park (Figure 9A,B) Levittown are selected for New York. Willerby (Figure 10A) and Hume (Figure 10B) are selected for Melbourne, and areas corresponding to the city center (Figure 11A) and airport (Figure 11B) are selected for Munich. Based on the results discussed above, our framework can effectively distinguish urban and non-urban (water, vegetation and bare-land) regions in most cases, but pixels containing both impervious surfaces and bare-land remain a challenge. Although Levittown (Figure 9B) experienced few changes during 1984–2016 (Section 4.2), our method indicates widely-scattered recent urbanization throughout the region (red pixels). We use data from Google Earth to analyze the source of this phenomenon. The availability of Google Earth data at 0.75 m spatial resolution enables detailed inspection of land-cover changes within Landsat pixels over long periods. The Levittown region contains many independent and sparse houses. Although impervious surfaces occupied less than 50% of many pixels in earlier years, recent re-paving of roads results in the detection of newly-built impervious land cover. Temporal changes are more easily extracted for pure impervious surfaces, such as Munich airport (Figure 11B).
Our results highlight important differences in spatiotemporal development patterns among these four cities. We examine these patterns further using higher resolution images from Google Earth in Section 4.2. Here, we note for context that New York added only a small amount of new urban area in the last 30 years, while Melbourne experienced significant urban expansion in both urban and suburban regions. Although Munich has experienced little expansion of populated areas, public transport systems have expanded substantially over the last 30 years.

3.3. Comparisons with State-of-the-Art Methods

To further investigate evaluate the performance of our framework, we compare the results to classifications based on the random forest (RF) [45,46], support vector machine (SVM) [47,48], and basic RNN with long short-term memory (LSTM) [49,50] techniques. RF is a robust and widely used method for land cover classification. Here, we use 500 classification trees as fixed-parameter for RF experiment. SVM methods are likewise popular due to their ability to identify classes based on high dimensional datasets with flexible kernel specification. Here, we use a nonlinear SVM (LibSVM) [48] based on the radial basis function (RBF). Moreover, to make a fair comparison, we use 10% of the training samples to optimize the SVM parameters. In RBF-SVM, the two main parameters are the cost parameter ( C ) and gamma ( γ ) [48]. We perform a two-dimensional grid search and select the optimal values from among a wide range of possibilities ( C :   10 6 , 10 5 , , 10 9 , 10 10 ; γ :   2 15 , 2 14 , , 2 3 , 2 4 ). The selected parameter values are C = 10,000 and γ = 0.5. We also compare the performance of our framework with that of a basic RNN method, using the popular LSTM approach for activation. The specification and evolution of parameters are identical to those employed in our framework (see in Section 2.3 for details). To ensure a fair comparison, we randomly select 10,000 labeled training samples (5000 urban and 5000 non-urban samples covering all seasons) from the original spectral features over Beijing in 1999. All validations are conducted using the labeled validation data for the temporal transfer and spatial transfer experiments (see Section 2.2.3 for details).
Table 3 compares classification accuracies for these methods according to overall accuracy (OA). Our proposed-framework consistently provides comparable or better results than the other three methods in all temporal transfer and spatial transfer experiments. The basic RNN with LSTM activation also performed well, with OA values approaching those for the deep-learning approach. Classification accuracies based on SVM and RF are similar to results reported by [51,52]. The results of this comparison indicate the promising potential of our proposed framework for detecting urban regions in remote sensing datasets with limited training data. Together, the information listed in Table 1, Table 2 and Table 3, also establish the potential of this method for improving transferability to new time periods and locations in similar climate zones. For data applications such as this, the computational cost of training and prediction is also an important consideration. Table 3 also show the run times (min) on temporal transfer experiments. Among the evaluated methods SVM requires the most processing time, while RF requires the least. Although the proposed method requires slightly more than twice the processing time required by RF, this increased computational cost is balanced by substantial improvements in classification accuracy. The enhanced accuracy achieved using this framework could be particularly valuable for multi-season mapping applications and general purpose classifications at national and global level.

4. Discussion

4.1. Applicability of Spectral Information from Landsat

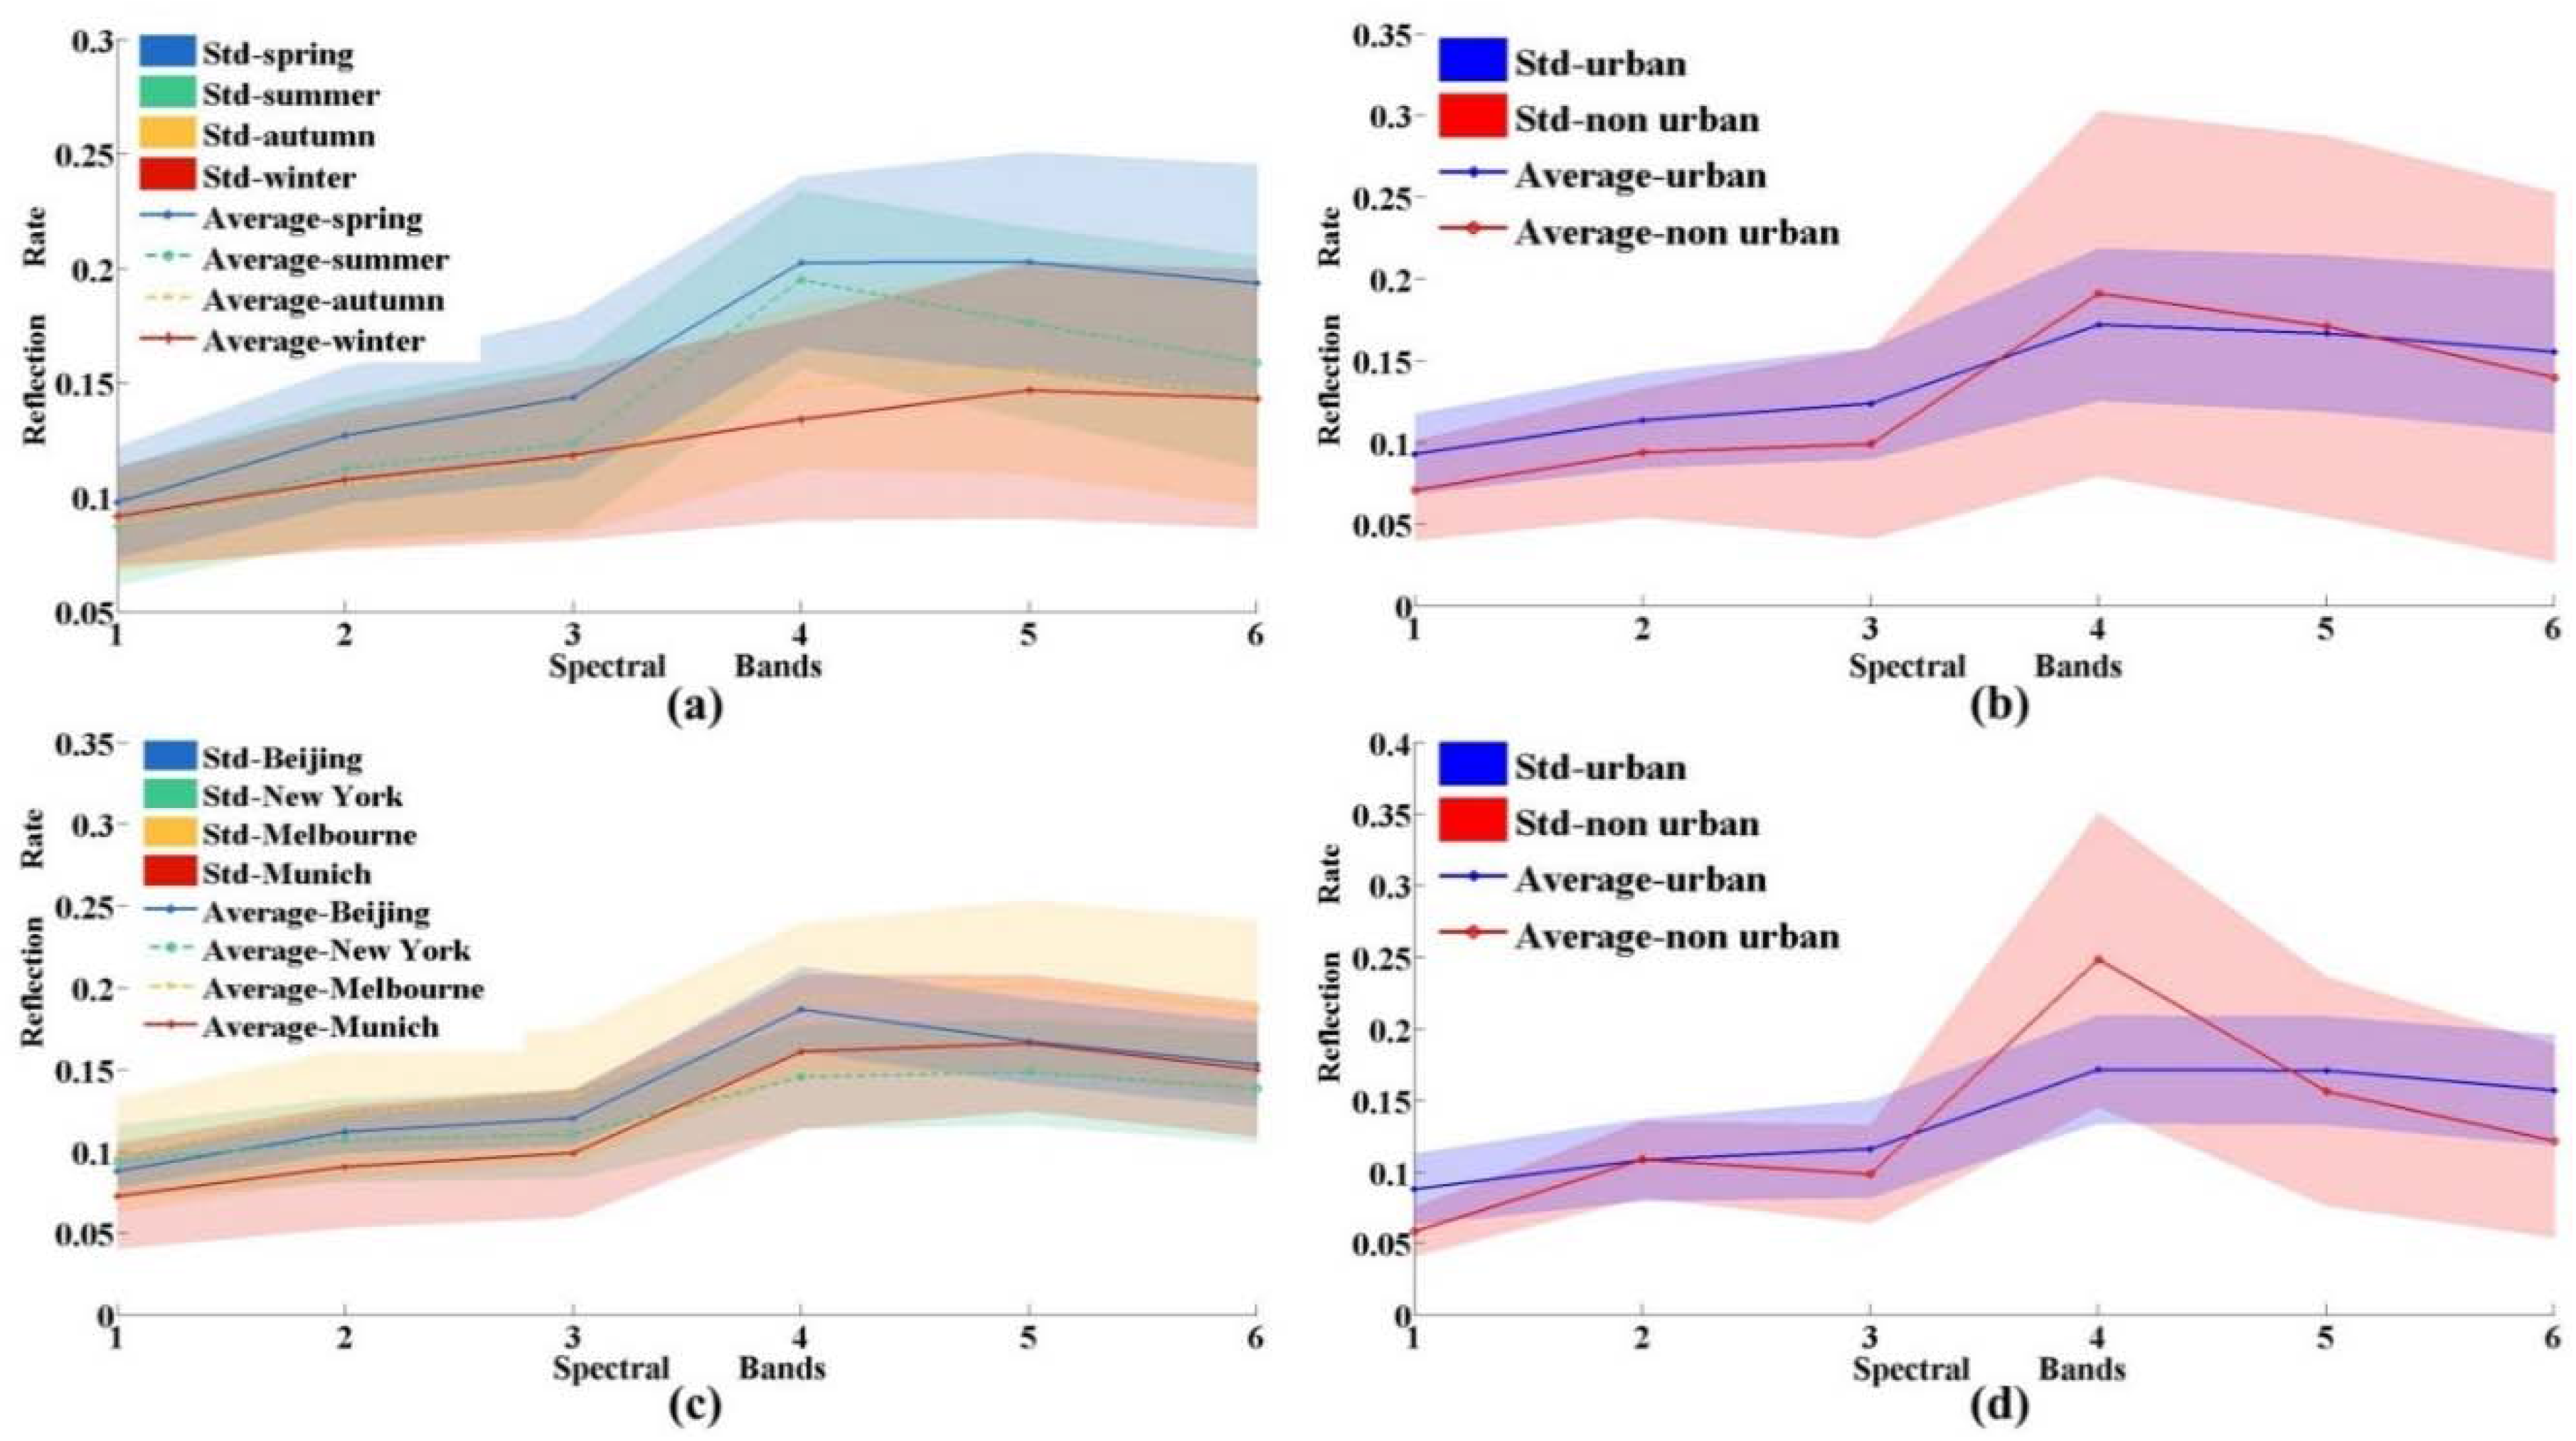
In this paper, we discuss a method for applying Landsat spectral information to map urban areas in different cities and across different seasons. Here, we exploit all 777,090 training samples collected in Beijing 1999 (see Section 2.2.2 for details) and all selected 320,000 validation samples for the temporal transfer and spatial transfer experiments (in Section 2.2.3 for details) to analyze the spectral feasibility of different cities in different seasons. The labeled training images of Beijing in 1999 were selected from 14 scenes. Defining seasons following the criteria used by [21], these 14 scenes include one acquired in spring, six acquired in summer, three acquired in autumn, and four acquired in winter. Then, we can assess the typical distinctions between spectral signatures for urban and non-urban areas. We also use all 320,000 validation samples analyzed cities at similar times of year. The analyzed images are from 14 September 2000 for Beijing, 24 August 1999 for New York, 4 September 2003 for Melbourne, and 18 August 1998 for Munich. Based on these labeled samples, we plot spectral curves with average and standard deviation (Std) value of spectral vectors of urban and non-urban across different seasons and cities for further analysis.
Figure 12 shows original Landsat spectral curves for urban and non-urban classes in the four analyzed urban areas. The spectral curves for urban areas in Beijing (Figure 12a) undergo evident variations by season, with a particularly large bias between winter and spring. Despite these differences, the qualitative shapes of the urban spectral curves for Beijing are consistent across seasons, suggesting a potential for temporal transferability in urban extraction methods that rely on these spectra. Simultaneous examination of non-urban and urban spectral curves for Beijing (Figure 12b) reveals substantial overlap between urban and non-urban spectral signatures. This overlap threatens the generalizability of urban mapping frameworks based on these spectra. Similar, illustrations are shown for spectral curves over different urban areas at similar times of year (Figure 12c,d). Although spectral variations for non-urban areas still overlap greatly with those for urban areas (Figure 12d), the similarity of the urban spectral curves for urban areas in different cities (Figure 12c) highlights the potential for the spatial transfer of information gained from training data. The experiments described in Section 3 further demonstrate the promise of our framework for detecting urban regions from massive remote sensing datasets with limited training data, with a more robust performance and improved transferability relative to other common methods (Section 3.3). Deep feature representations help to increase the information gain from the original signatures for application to mapping urban areas.
We use inter-class and intra-class distances to evaluate the effectiveness of the deep features. These two metrics quantify the degree of similarity within a given class and the ability to distinguish between different classes respectively. Here, all labeled training samples (777,090) of Beijing in 1999 and validation samples (320,000) in four cities are exploited for calculating these distances. The deep features were the output before soft layer of our framework with 64 dimensions. The spectral features are the reflectivity values from Landsat directly. Both intra-class distance and inter-class distance are calculated as J-M distance, defined following [53] as:
J ij = 2 ( 1 e B i , j ) ,
B i j = 1 8 ( m i m j ) T ( c i + c j 2 ) 1 ( m i m j ) + 1 2 l o g ( | c i + c j 2 | | c i | | c j | ) ,
where m i is the average vector, c i is the covariance matrix, and B i j is the Bhattacharyya between of two classes. Larger inter-class distances and smaller intra-class distances indicate an improved capacity for accurate classification.
Table 4 lists calculated inter-class and intra-class distances calculated for the original spectral features and the deep features obtained in our framework. Relative to the original spectral features, the deep features produce a smaller intra-class distance for both urban and non-urban areas, as well as larger inter-class distances between urban and non-urban classes. We infer from these results that the deep features are a valid and efficient means of increasing the information content of Landsat spectra for urban mapping. The results of our experiments and transfer analyses consistently indicate that the adverse effects of spectral variations can be greatly reduced by using the learned deep features in place of the original spectra. Our proposed urban detection framework relies on the larger inter-class distances and smaller intra-class summarized in Table 4 to generate an accurate classification with spatiotemporal transferability.

4.2. Variations in Urban Expansion Patterns among Cities

The primary motivation behind using deep learning to map urban areas across different cities and seasons is the need to understand how spatiotemporal patterns of urbanization differ among cities from the perspective of a single uniform classification framework. Our results highlight important differences in the characteristic patterns of urban change among different cities. Here, we summarize these differences as revealed by our analysis supplemented by higher-resolution imagery from Google Earth. Beijing has developed rapidly over the past 30 years, with urbanization often accomplished within a short time (e.g., 0.5–2 years). Along with economic growth, much of the urban expansion in Beijing consists of newly built human settlements (buildings) and public transport service (roads and airports). Timely observations are necessary to support planning design that can better cope with the rapid expansion of urban land covers in Beijing. In contrast to Beijing, little urban expansion has occurred in New York during the last 30 years. However, despite this lack of expansion, reconstruction, conservation and renovation have all been actively pursued, with fragmentary and independent impervious surfaces often appearing in suburban regions. As in Beijing, Melbourne underwent considerable urban expansion during 1984–2016 primarily due to new human settlements and roads. Although the expansion rate was lower than that for Beijing, the spatiotemporal urban expansion pattern for Melbourne demonstrates the extent to which new impervious surfaces were constructed to satisfy accommodate rapid population growth between 1984 (2.9 million) and 2015 (4 million) [54]. Munich’s urban expansion followed a similar pattern to New York’s, with few new human settlements constructed in the past 30 years. Urbanization in Munich has mainly centered on the expansion of public transit facilities, including the Munich airport and improvements in roads and rail facilities. These four different cities have distinct spatiotemporal patterns of development that accentuate the need for urban maps at annual scales, as the use of coarser time intervals would obscure many of the details of this development (Li et al., [21]. Timely observations that make optimal use of the available information are necessary to study urban change in detail.

4.3. Limitations of Transfer Learning for Urban Mapping

Although our proposed method performs well, several issues remain to be resolved in future work. First, mixed pixels can be difficult to classify accurately. For large-scale urban extraction, pixels that contain both impervious surfaces and bare land are difficult to classify. The challenges associated with distinguishing bare land from impervious surfaces are well known [21], and are a major source of uncertainty in remote sensing-based urban mapping frameworks. Particularly in rural areas, the bare-land cover occupy more than 50% in the mixed pixel, then the impervious surface in this pixel is hard to detect. Pixel unmixing algorithms and higher-resolution images may be necessary to overcome this issue. Second, urban detection methods based on transfer learning should only be applied in controlled scenarios. These methods are most effective when the target and source task contain potential similarity. In this paper, although four focus areas are located on four different continents, all four cities are large scale intensive urban environments with temperate continental climates. This choice is motivated by the selection of Beijing as the sole source of training. The required degree of similarity remains unclear, and particularly whether the transferability demonstrated in this work extends to cities in different climate zones. These topics will be investigated in future work. Finally, we reiterate that the merged annual urban map is typically more accurate than the single scene classification map. Combining multiple images acquired within a year (or indeed within any extended period), helps to overcome key uncertainties that may adversely affect the single-scene results. Google Earth Engine [55] is in use across a wide variety of disciplines, which is helpful for urban mapping [56].

5. Conclusions

In this paper, we have proposed a framework for classifying urban and non-urban areas based on deep learning with transferability. A manually-labeled training dataset based on observations of Beijing in 1999 was sampled to train the framework. Knowledge gained from this training step was then transferred to further extractions of urban land cover in all available Landsat images collected over Beijing, New York, Melbourne, and Munich during 1984–2016. Our results demonstrate the viability of this approach for detecting urban areas in different cities and at different times with a single classification strategy. The classification accurately captures historical spatiotemporal development patterns of impervious surfaces in each city. The temporal transfer and spatial transfer experiments demonstrate the generalizability of the proposed framework for urban mapping. For cities with similar climate conditions, the transferability of learned deep features can reduce the impacts of variations in radiometric values in constructing single-scene maps, and enhance inter-class distance between urban and non-urban pixels to better facilitate extraction of urban areas from Landsat imagery. Our experiments show a promising level of accuracy in both single-scene and merged annual classifications over all four cities, with an average OA exceeding 89%. The final experimental results also show that our proposed classification strategy can be extended to different sensors. Our results based on images collected by Landsat 4/5, Landsat 7, and Landsat 8 indicate that information from six common spectral bands is sufficient for detecting urban changes despite differences in sensors. Similar combinations of deep learning and transfer learning methods should be considered for other big data challenges in remote sensing and related fields. Maps of urban areas and their spatiotemporal evolution produced using this method will be useful for ecologists, hydrologists, and social scientists studying the built environment, its ecological impacts, and public policy.

Acknowledgments

This work was jointly supported by the National Basic Research Program of China (No. 2015CB953703), the National Key Research and Development Program of China (2017YFA0603703), and the National Natural Science Foundation of China (91537210 & 91747101). Computational resources for this work were provided by the Tsinghua National Laboratory for Information Science and Technology. Contributions by Lichao Mou and Xiao Xiang Zhu have been supported by the European Research Council (ERC) under the European Union’s Horizon 2020 research and innovation program (grant agreement No. [ERC-2016-StG-714087], Acronym: So2Sat), the Helmholtz Association under the framework of the Young Investigators Group “SiPEO” (VH-NG-1018, www.sipeo.bgu.tum.de) and the China Scholarship Council. The authors are grateful to the USGS for providing Landsat data support, and acknowledge Pauline Lovell and Arthur Cracknell for their kind help and comments on this paper.

Author Contributions

All authors contributed to the design of the experiment and to its undertaking. All authors revised and approved the final manuscript.

Conflicts of Interest

The authors declare no conflict of interest.

References

  1. Grey, W.M.F.; Luckman, A.J.; Holland, D. Mapping urban change in the UK using satellite radar interferometry. Remote Sens. Environ. 2003, 87, 16–22. [Google Scholar] [CrossRef]
  2. Schneider, A.; Friedl, M.A.; Potere, D. Mapping global urban areas using MODIS 500-m data: New methods and datasets based on ‘urban ecoregions’. Remote Sens. Environ. 2010, 114, 1733–1746. [Google Scholar] [CrossRef]
  3. Cao, X.; Chen, J.; Imura, H.; Higashi, O. A SVM-based method to extract urban areas from DMSP-OLS and SPOT VGT data. Remote Sens. Environ. 2009, 113, 2205–2209. [Google Scholar] [CrossRef]
  4. Foley, J.A.; Defries, R.; Asner, G.P.; Barford, C.; Bonan, G.; Carpenter, S.R.; Chapin, F.S.; Coe, M.T.; Daily, G.C.; Gibbs, H.K. Global consequences of land use. Science 2005, 309, 570–574. [Google Scholar] [CrossRef] [PubMed]
  5. Grimm, N.B.; Faeth, S.H.; Golubiewski, N.E.; Redman, C.L.; Wu, J.; Bai, X.; Briggs, J.M. Global change and the ecology of cities. Science 2008, 319, 756–760. [Google Scholar] [CrossRef] [PubMed]
  6. Yu, C.; Xiao, Y.; Ni, S. Changing patterns of urban-rural nutrient flows in China: Driving forces and options. Sci. Bull. 2017, 62, 83–91. [Google Scholar] [CrossRef]
  7. Li, X.; Li, W.; Middel, A.; Harlan, S.L.; Brazel, A.J.; Ii, B.L.T. Remote sensing of the surface urban heat island and land architecture in Phoenix, Arizona: Combined effects of land composition and configuration and cadastral–demographic–economic factors. Remote Sens. Environ. 2016, 174, 233–243. [Google Scholar] [CrossRef]
  8. Lu, D.; Tian, H.; Zhou, G.; Ge, H. Regional mapping of human settlements in southeastern China with multisensor remotely sensed data. Remote Sens. Environ. 2008, 112, 3668–3679. [Google Scholar] [CrossRef]
  9. Ma, T.; Zhou, C.; Tao, P.; Haynie, S.; Fan, J. Quantitative estimation of urbanization dynamics using time series of DMSP/OLS nighttime light data: A comparative case study from China’s cities. Remote Sens. Environ. 2012, 124, 99–107. [Google Scholar] [CrossRef]
  10. Mertes, C.M.; Schneider, A.; Sulla-Menashe, D.; Tatem, A.J.; Tan, B. Detecting change in urban areas at continental scales with MODIS data. Remote Sens. Environ. 2015, 158, 331–347. [Google Scholar] [CrossRef]
  11. Boasson, E.; Howarth, P.J. Landsat digital enhancements for change detection in urban environments. Remote Sens. Environ. 1983, 13, 149–160. [Google Scholar]
  12. Gong, P.; Wang, J.; Yu, L.; Zhao, Y.; Zhao, Y.; Liang, L.; Niu, Z.; Huang, X.; Fu, H.; Liu, S. Finer resolution observation and monitoring of global land cover: First mapping results with Landsat TM and ETM+ data. Int. J. Remote Sens. 2013, 34, 2607–2654. [Google Scholar] [CrossRef]
  13. Gong, P.; Howarth, P.J. The use of structural information for improving land-cover classification accuracies at the rural-urban fringe. Photogramm. Eng. Remote Sens. 1990, 56, 67–73. [Google Scholar]
  14. Song, X.P.; Sexton, J.O.; Huang, C.; Channan, S.; Townshend, J.R. Characterizing the magnitude, timing and duration of urban growth from time series of Landsat-based estimates of impervious cover. Remote Sens. Environ. 2016, 175, 1–13. [Google Scholar] [CrossRef]
  15. Wang, L.; Li, C.C.; Ying, Q.; Xiao, C.; Wang, X.Y.; Li, X.Y.; Hu, L.Y.; Liang, L.; Yu, L.; Huabing, H.; et al. China’s urban expansion from 1990 to 2010 determined with satellite remote sensing. Sci. Bull. 2012, 57, 2802–2812. [Google Scholar] [CrossRef]
  16. Lambin, E.F.; Geist, H.J.; Lepers, E. Dynamics of Land-use and Land-Cover Change in Tropical Regions. Annu. Rev. Environ. Resour. 2003, 28, 205–241. [Google Scholar] [CrossRef]
  17. Yang, L.; Huang, C.; Homer, C.G.; Wylie, B.K.; Coan, M.J. An approach for mapping large-area impervious surfaces: Synergistic use of Landsat-7 ETM+ and high spatial resolution imagery. Can. J. Remote Sens. 2003, 29, 230–240. [Google Scholar] [CrossRef]
  18. Homer, C.; Huang, C.; Yang, L.; Wylie, B.; Coan, M. Development of a 2001 National Land-Cover Database for the United States. Photogramm. Eng. Remote Sens. 2004, 70, 829–840. [Google Scholar] [CrossRef]
  19. Schneider, A.; Mertes, C.M. Expansion and growth in Chinese cities, 1978–2010. Environ. Res. Lett. 2014, 9, 024008. [Google Scholar] [CrossRef]
  20. Sexton, J.O.; Song, X.P.; Huang, C.; Channan, S.; Baker, M.E.; Townshend, J.R. Urban growth of the Washington, D.C.–Baltimore, MD metropolitan region from 1984 to 2010 by annual, Landsat-based estimates of impervious cover. Remote Sens. Environ. 2013, 129, 42–53. [Google Scholar] [CrossRef]
  21. Li, X.; Gong, P.; Liang, L. A 30-year (1984–2013) record of annual urban dynamics of Beijing City derived from Landsat data. Remote Sens. Environ. 2015, 116, 78–90. [Google Scholar] [CrossRef]
  22. Feyisa, G.L.; Meilby, H.; Jenerette, G.D.; Pauliet, S. Locally optimized separability enhancement indices for urban land cover mapping: Exploring thermal environmental consequences of rapid urbanization in Addis Ababa, Ethiopia. Remote Sens. Environ. 2016, 175, 14–31. [Google Scholar] [CrossRef]
  23. Shahtahmassebi, A.R.; Lin, Y.; Lin, L.; Atkinson, P.M.; Moore, N.; Wang, K.; He, S.; Huang, L.; Wu, J.; Shen, Z. Reconstructing Historical Land Cover Type and Complexity by Synergistic Use of Landsat Multispectral Scanner and CORONA. Remote Sens. 2017, 9, 682. [Google Scholar] [CrossRef]
  24. Yang, C.; Wu, G.; Ding, K.; Shi, T.; Li, Q.; Wang, J. Improving Land Use/Land Cover Classification by Integrating Pixel Unmixing and Decision Tree Methods. Remote Sens. 2017, 9, 1222. [Google Scholar] [CrossRef]
  25. Arai, K. A supervised Thematic Mapper classification with a purification of training samples. Int. J. Remote Sens. 2007, 13, 2039–2049. [Google Scholar] [CrossRef]
  26. Schneider, A. Monitoring land cover change in urban and peri-urban areas using dense time stacks of Landsat satellite data and a data mining approach. Remote Sens. Environ. 2012, 124, 689–704. [Google Scholar] [CrossRef]
  27. Lecun, Y.; Bengio, Y.; Hinton, G. Deep learning. Nature 2015, 521, 436–444. [Google Scholar] [CrossRef] [PubMed]
  28. Yosinski, J.; Clune, J.; Bengio, Y.; Lipson, H. How transferable are features in deep neural networks? Adv. Neural Inf. Process. Syst. 2014, 27, 3320–3328. [Google Scholar]
  29. Marmanis, D.; Datcu, M.; Esch, T.; Stilla, U. Deep Learning Earth Observation Classification Using ImageNet Pretrained Networks. IEEE Geosci. Remote Sens. Lett. 2016, 13, 105–109. [Google Scholar] [CrossRef]
  30. Jean, N.; Burke, M.; Xie, M.; Davis, W.M.; Lobell, D.B.; Ermon, S. Combining satellite imagery and machine learning to predict poverty. Science 2016, 353, 790–794. [Google Scholar] [CrossRef] [PubMed]
  31. Zhu, X.X.; Tuia, D.; Mou, L.; Xia, G.S.; Zhang, L.; Xu, F.; Fraundorfer, F. Deep Learning in Remote Sensing: A Comprehensive Review and List of Resources. IEEE Geosci. Remote Sens. Mag. 2018, 5, 8–36. [Google Scholar] [CrossRef]
  32. Lyu, H.; Lu, H.; Mou, L. Learning a Transferable Change Rule from a Recurrent Neural Network for Land Cover Change Detection. Remote Sens. 2016, 8, 506. [Google Scholar] [CrossRef]
  33. Masek, J.G.; Vermote, E.F.; Saleous, N.E.; Wolfe, R.; Hall, F.G.; Huemmrich, K.F.; Gao, F.; Kutler, J.; Lim, T.K. A Landsat surface reflectance dataset for North America, 1990–2000. IEEE Geosci. Remote Sens. Lett. 2006, 3, 68–72. [Google Scholar] [CrossRef]
  34. Zhu, Z.; Woodcock, C.E. Object-based cloud and cloud shadow detection in Landsat imagery. Remote Sens. Environ. 2012, 118, 83–94. [Google Scholar] [CrossRef]
  35. Cracknell, A.P.; Kanniah, K.D.; Tan, K.P.; Wang, L. Evaluation of MODIS gross primary productivity and land cover products for the humid tropics using oil palm trees in Peninsular Malaysia and Google Earth imagery. Int. J. Remote Sens. 2013, 34, 7400–7423. [Google Scholar] [CrossRef]
  36. Cracknell, A.P.; Kanniah, K.D.; Tan, K.P.; Lei, W. Towards the development of a regional version of MOD17 for the determination of gross and net primary productivity of oil palm trees. Int. J. Remote Sens. 2015, 36, 262–289. [Google Scholar] [CrossRef]
  37. Xian, G.; Homer, C.; Dewitz, J.; Fry, J.; Hossain, N.; Wickham, J. Change of Impervious Surface Area Between 2001 and 2006 in the Conterminous United States. Photogramm. Eng. Remote Sens. 2011, 77, 758–762. [Google Scholar]
  38. Pan, S.J.; Yang, Q. A Survey on Transfer Learning. IEEE Trans. Knowl. Data Eng. 2010, 22, 1345–1359. [Google Scholar] [CrossRef]
  39. Xie, M.; Jean, N.; Burke, M.; Lobell, D.; Ermon, S. Transfer Learning from Deep Features for Remote Sensing and Poverty Mapping. arXiv, 2015; arXiv:1510.00098. [Google Scholar]
  40. Mou, L.; Ghamisi, P.; Zhu, X.X. Deep Recurrent Neural Networks for Hyperspectral Image Classification. IEEE Trans. Geosci. Remote Sens. 2017, 55, 3639–3655. [Google Scholar] [CrossRef]
  41. Cohen, I.; Cozman, F.G.; Sebe, N.; Cirelo, M.C.; Huang, T.S. Semisupervised learning of classifiers: Theory, algorithms, and their application to human-computer interaction. IEEE Trans. Pattern Anal. 2004, 26, 1553–1566. [Google Scholar] [CrossRef] [PubMed]
  42. Tüske, Z.; Tahir, M.A.; Schlüter, R.; Ney, H. Integrating Gaussian mixtures into deep neural networks: Softmax layer with hidden variables. In Proceedings of the IEEE International Conference on Acoustics, Speech and Signal Processing, South Brisbane, Australia, 19–24 April 2015; pp. 4285–4289. [Google Scholar]
  43. Tieleman, T.; Hinton, G.G. Lecture 6.5—RmsProp: Divide the gradient by a running average of its recent magnitude. Neural Netw. Mach. Learn. 2012, 4, 26–31. [Google Scholar]
  44. Shi, L.; Ling, F.; Ge, Y.; Foody, G.M.; Li, X.; Wang, L.; Zhang, Y.; Du, Y. Impervious Surface Change Mapping with an Uncertainty-Based Spatial-Temporal Consistency Model: A Case Study in Wuhan City Using Landsat Time-Series Datasets from 1987 to 2016. Remote Sens. 2017, 9, 1148. [Google Scholar] [CrossRef]
  45. Breiman, L. Random Forests. Mach. Learn. 2001, 45, 5–32. [Google Scholar] [CrossRef]
  46. Cutler, A.; Cutler, D.R.; Stevens, J.R. Random Forests. Mach. Learn. 2004, 45, 157–176. [Google Scholar]
  47. Tong, S.; Koller, D. Support vector machine active learning with applications to text classification. J. Mach. Learn. Res. 2001, 2, 45–66. [Google Scholar]
  48. Chang, C.C.; Lin, C.J. LIBSVM: A library for support vector machines. ACM Trans. Intell. Syst. Technol. 2011, 2. [Google Scholar] [CrossRef]
  49. Mikolov, T.; Karafiát, M.; Burget, L.; Cernocký, J.; Khudanpur, S. Recurrent neural network based language model. In Proceedings of the 11th Annual Conference of the International Speech Communication Association, Chiba, Japan, 26–30 September 2010; pp. 1045–1048. [Google Scholar]
  50. Graves, A. Long Short-Term Memory. Neural Comput. 2014, 9, 1735–1780. [Google Scholar]
  51. Li, C.; Wang, J.; Wang, L.; Hu, L.; Gong, P. Comparison of Classification Algorithms and Training Sample Sizes in Urban Land Classification with Landsat Thematic Mapper Imagery. Remote Sens. 2014, 6, 964–983. [Google Scholar] [CrossRef]
  52. Li, C.; Gong, P.; Wang, J.; Zhu, Z.; Biging, G.S.; Yuan, C.; Hu, T.; Zhang, H.; Wang, Q.; Li, X. The first all-season sample set for mapping global land cover with Landsat-8 data. Sci. Bull. 2017, 7, 508–515. [Google Scholar] [CrossRef]
  53. Bartholomew, D.J.; Steele, F.; Galbraith, J.I.; Moustaki, I. Analysis of multivariate social science data. Struct. Equ. Model. Multidiscip. J. 2011, 18, 686–693. [Google Scholar]
  54. Mcgilvray, A. Sydney & Melbourne: A tale of two cities. Nature 2016, S58–S65. [Google Scholar] [CrossRef]
  55. Gorelick, N.; Hancher, M.; Dixon, M.; Ilyushchenko, S.; Thau, D.; Moore, R. Google Earth Engine: Planetary-scale geospatial analysis for everyone. Remote Sens. Environ. 2017, 202, 18–27. [Google Scholar] [CrossRef]
  56. Zhang, Q.; Li, B.; Thau, D.; Moore, R. Building a Better Urban Picture: Combining Day and Night Remote Sensing Imagery. Remote Sens. 2015, 2015, 11887–11913. [Google Scholar] [CrossRef]
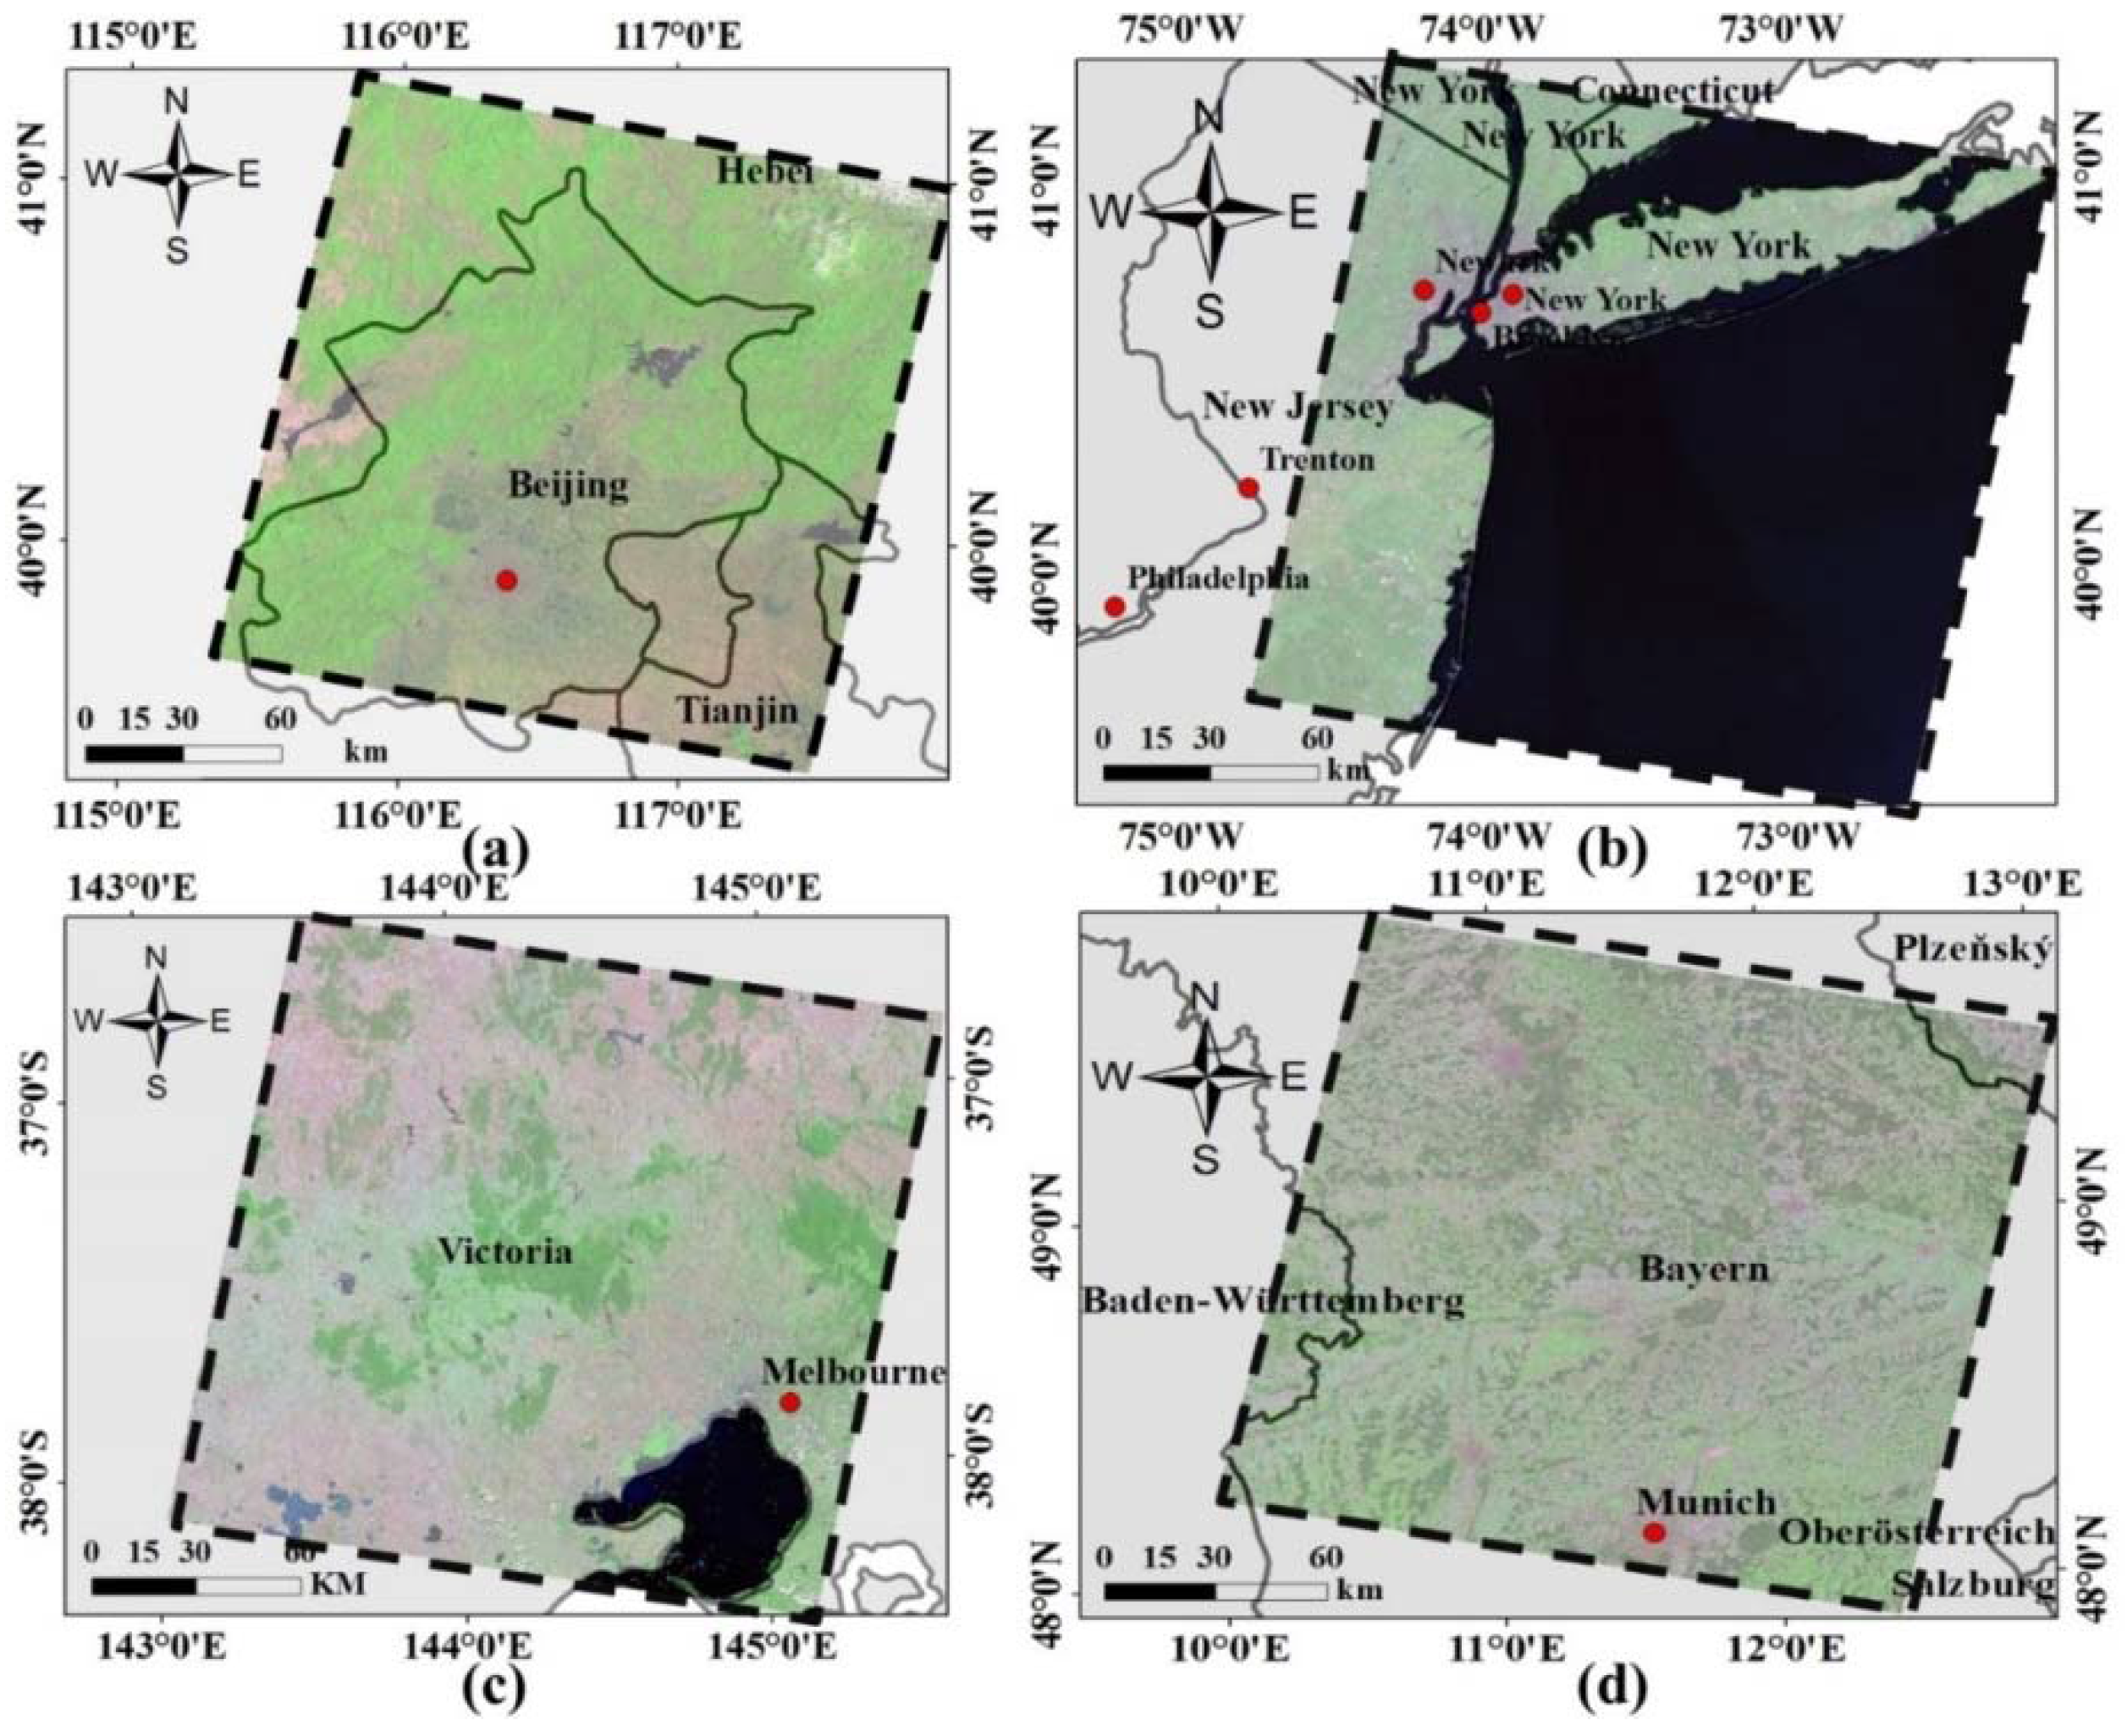
Figure 1. Study areas in RGB-5, 4, 3 include: (a) Beijing-123/32 (path/row), China; (b) New York-130/322, United States of America; (c) Melbourne-93/86, Australia; and (d) Munich-193/26, Germany. The dotted line represents the scene extent in each study area, and the box represents the normal Worldwide Reference System (WRS-2) boundary.
Remotesensing 10 00471 g001
Figure 2. Temporal distributions (DOY, day of year) of adopted Landsat scenes for (a) Beijing-123/032; (b) New York-130/322); (c) Melbourne-93/86; and (d) Munich-193/026.
Remotesensing 10 00471 g002
Figure 3. Flowchart of the proposed urban extraction framework. Solid black arrows represent training step, in which the model is initialized by feeding in labeled source data during offline training. Dotted black arrows indicate online optimization steps in which the initial model is fine-tuned, rendering it more specialized for new target data. Blue arrows represent input and output processes.
Remotesensing 10 00471 g003
Figure 4. Original classification maps for an urban region (Beijing city center) and several regions (Shunyi: suburban-1, Changping: suburban-2, and Langfang: suburban-3) on different dates. Note that the selected dates differ by region. In each panel, the color map shows the original Landsat data with RGB-5, 4, 3, and the binary map shows the extracted urban areas (white). In the latter set of maps, gray indicates non-urban areas and black indicates that data are unavailable due to cloud contamination or other reasons.
Remotesensing 10 00471 g004
Figure 5. Time series of overall accuracy for changes detected in and around Beijing during 1984–2016. The method proposed in this paper (dark dashed line) is compared against that employed by Li et al. [21] (grey dotted line).
Remotesensing 10 00471 g005
Figure 6. Urban expansion in Beijing during 1984–2016. The map shows the current distribution of urban area (color shading) with sites that were built earlier taking lower values (blue) and sits that were built more recently taking higher values (red). Two magnified insets show the changes: (A) zoomed-in view of Langfang region, and (B) zoomed-in view of Beijing Capital airport region. The corresponding Thematic Mapper (TM) images of Langfang and Beijing Capital airport are also shown using RGB-5, 4, 3 representations of images collected on 19 July 1985 and 20 August 2014, respectively.
Remotesensing 10 00471 g006
Figure 7. Original classification maps for the urban and suburban regions of New York (left), Melbourne (center), and Munich (right) on different dates. Color maps show original Landsat data with RGB-5, 4, 3. Binary maps show extracted urban areas (white) and non-urban areas (gray), with black indicating cloud contamination or missing data. New York Suburban-1 and Suburban-2 correspond to Levittown and Stanford, respectively; and Melbourne Suburban-1 and Suburban-2 correspond to Geelong and Ballarat; and Munich-suburban-S1 and Suburban-2 correspond to Munich airport and West-Munich.
Remotesensing 10 00471 g007
Figure 8. Time series of change detection accuracy for New York, Melbourne, and Munich during 1984–2016.
Remotesensing 10 00471 g008
Figure 9. Urban expansion during 1984–2016 in New York, with insets providing magnified views of (A) Central Park and (B) Levittown. TM images corresponding to the beginning and end of the analysis period are also shown.
Remotesensing 10 00471 g009
Figure 10. Urban expansion during 1984–2016 in Melbourne, with insets providing magnified views of (A) Willerby and (B) Hume. TM images corresponding to the beginning and end of the analysis period are also shown.
Remotesensing 10 00471 g010
Figure 11. Urban expansion during 1984–2016 in Munich, with insets providing magnified views of (A) Munich city center and (B) Munich airport. TM images corresponding to the beginning and end of the analysis period are also shown.
Remotesensing 10 00471 g011
Figure 12. Spectral curves for urban and non-urban areas in different seasons and study areas: (a) spectral curves for urban areas during different seasons in Beijing; (b) annual mean spectral curves for urban and non-urban areas in Beijing; (c) spectral curves for four urban areas in the four analyzed cities acquired at similar day of year; and (d) spectral curves for urban areas averaged over the four analyzed cities.
Remotesensing 10 00471 g012
Table 1. Classification performance in specific years.
Year—DOYFNTNFPTPOAUA-NUA-U
Beijing19841984229314968620197990.970.970.98
1984277258974231896820.970.970.97
Merged19898025499560.990.980.99
19941994160188881123699640.900.811.00
199425616498369799030.990.980.99
19943361438856256994310.900.860.94
Merged11898827199290.990.990.99
20042004004102489761499860.950.901.00
2004028249948316694090.980.970.98
2004036215715816186260.980.970.98
2004068447790213584020.970.950.98
2004092197950617398030.980.980.98
200410062079687882570.960.930.99
2004108723951112391280.960.930.99
200419687072602579630.940.891.00
200424435974691986790.980.951.00
200425213196406898690.990.990.99
20042921608882519661580.890.850.97
200430024496459997540.980.980.99
200430852770732549810.960.931.00
2004324619751112783630.960.920.99
2004332509888912590780.970.950.99
2004340322752820484840.970.960.98
Merged11098901799830.990.991.00
2014201401512356533138373620.840.840.84
201406332787543071550.980.961.00
2014079872822873576710.910.900.91
2014095274834753289340.960.970.94
20141191099790125397470.930.880.97
2014127146975714077650.910.840.99
2014135944903632690920.930.910.97
201419127668341579460.980.961.00
20142071053813513975510.930.890.98
2014231493950713996150.970.950.99
201423961684007263980.960.930.99
201424798590154999510.950.901.00
2014279945905565993410.920.910.93
201428735686887877280.970.960.99
2014335693852014784020.950.920.98
2014351164770806576900.900.810.99
2014359151078356599250.920.840.99
Merged7199292899721.000.991.00
Table 2. Classification performance for each study areas in specific years (see text for abbreviations).
Year—DOYFNTNFPTPOAUA-NUA-U
New York19861986087529893813198690.970.940.99
198615114897772197520.990.991.00
1986295435956512690800.970.960.99
Merged17498261299880.990.981.00
1997199714998586315671000.980.980.98
19972292199792879121.001.001.00
199729312297366989120.990.990.99
Merged1799834699541.001.001.00
2004200400111078708551230.990.990.98
200401785512326780.990.981.00
200403313498664099600.990.991.00
2004073416958440096000.960.960.96
2004097637936326697340.950.940.97
20041613700623024097760.800.630.98
200418554494565399470.970.950.99
200419330396972799730.980.971.00
2004233386961419099100.970.960.98
200425733564613968300.970.950.99
200428116791294099600.990.981.00
Merged219979899921.001.001.00
2014201410034096298688500.980.970.99
201414022968051452300.980.971.00
201418012076535798670.990.980.99
201420478702113568760.980.990.98
2014212245902115784840.980.970.98
2014220113679215155950.980.980.97
2014236115481119758240.970.980.97
201426023889136387510.980.970.99
201430035663935136770.960.950.99
Merged17098301199270.990.981.00
Melbourne19861986231(Merged)57394276599350.970.940.99
1997199706969156895793870.950.890.99
19970855997232085761.000.991.00
199710113989713825280.980.980.99
199714943987703377390.970.951.00
1997309340943913395240.980.970.99
1997325371962612498710.980.960.99
Merged31296881099900.980.971.00
20042004001224689919378370.970.970.98
2004097266568654260480.940.960.92
200418544780546871660.970.950.99
20042498889811291730.990.991.00
20042976181523196880.990.991.00
200432118284862173650.990.981.00
2004329432930411698800.970.960.99
Merged4999511599851.001.001.00
2014201401338067101984100.970.951.00
201403715606050279700.900.801.00
201427768777184585260.960.920.99
201428532275977483950.980.960.99
201429392990712399770.950.911.00
2014333286897210889730.980.970.99
Merged14898521599850.990.991.00
Munich198619861961488851015098170.920.850.98
198621255879731953150.960.931.00
Merged35496467499260.980.960.99
19971997258(Merged)274972618698140.980.970.98
200420042147957312649140.940.901.00
20042221691740318281280.890.810.98
200424620597873599160.990.981.00
2004254607712610484670.960.920.99
200426287391187098420.950.910.99
Merged24197591499860.990.981.00
20142014073285789010580280.980.970.99
20140892102727131783280.870.780.96
2014097451872228758860.950.950.95
2014113112081228763440.920.880.99
2014161614809013395130.960.930.99
Merged28297189699040.980.970.99
Table 3. Classification results from alternative methods with overall accuracy and run-time over temporal transfer experiments.
SVM-RBF (%)RF (%)RNN-LSTM (%)Proposed Framework (%)
Temporal transferBeijing68.6371.3876.2581.87
Spatial transferNew York69.1372.7580.6382.08
Melbourne71.2567.6385.8884.75
Munich79.2578.286.8790.63
Run-Time (min)-7.530.370.780.82
Table 4. Inter-class and intra-class distances based on original spectral features and deep features.
Intra-Class DistanceInter-Class Distance
Non-UrbanUrbanNon-Urban To Urban
Temporal TransferSpectral features0.720.410.68
Deep Features0.550.371.04
Spatial TransferSpectral features0.430.480.42
Deep Features0.370.40.51